
Zim Laboratories Ltd (ZIMLAB)
Stock Analysis Report
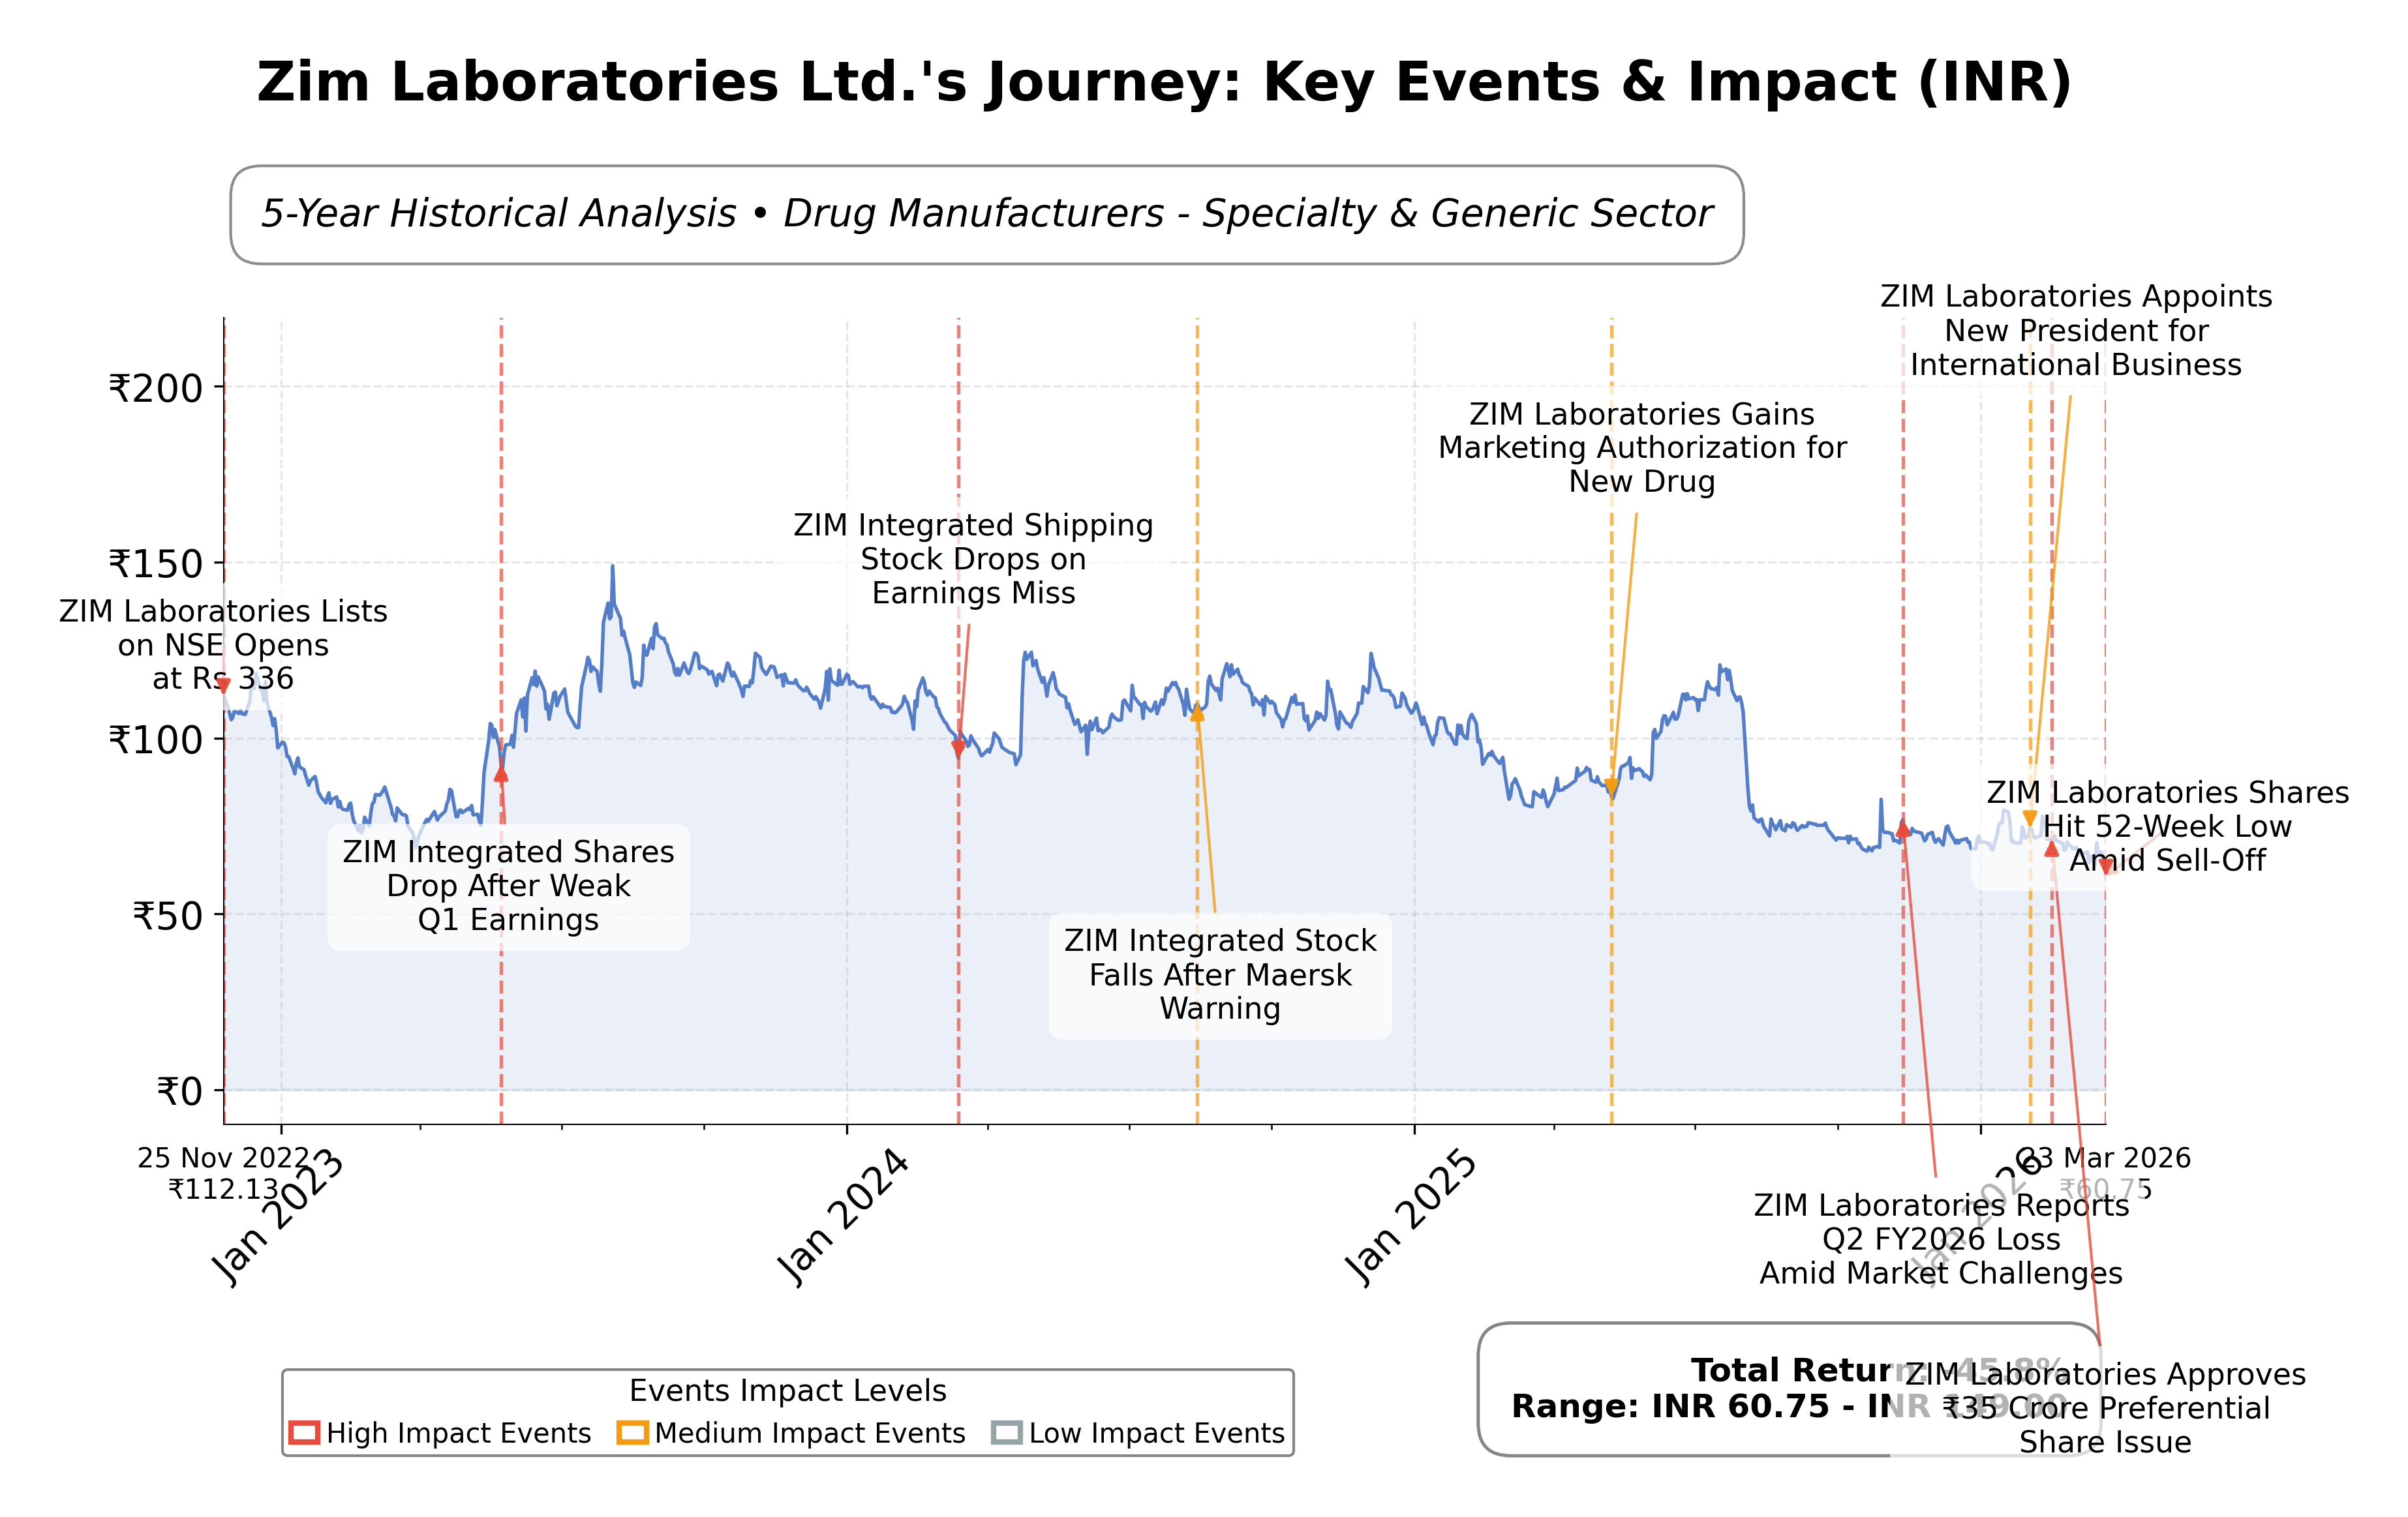
Stock Journey
Key Positives and Key Risks
Pros
- Revenue growth of 12.8% year-over-year indicates a positive growth trajectory supporting business expansion.
- Operating cash flow of ₹201.64 million and free cash flow of ₹121.65 million demonstrate healthy cash generation.
- Valuation metrics such as a trailing P/E of 42.19 align with industry averages, suggesting balanced market valuation.
Cons
- Stock price near 52-week low of ₹60.06 reflects significant downside risk and market volatility.
- Profit margin of 1.85% and return on equity of 4.82% are relatively modest, indicating limited profitability.
- Total debt to equity ratio of approximately 49% points to moderate financial leverage requiring monitoring.
Disclosure: This information is for general awareness and does not constitute investment advice
Report Summary
Zim Laboratories Ltd. is an Indian pharmaceutical company specializing in the development and manufacturing of novel drug delivery systems, including active pharmaceutical ingredients and innovative dosage forms such as orally disintegrating and multilayer tablets. Operating within the healthcare and pharmaceutical industry, Zim Laboratories positions itself as a forward-thinking entity focused on enhancing drug efficacy, safety, and patient compliance through advanced research and development.
Financially, Zim Laboratories reports a market capitalization of approximately â¹2.96 billion with a trailing P/E ratio of 42.19, aligning closely with its industry average. The company demonstrates a gross margin of 55.28% and a modest profit margin of 1.85%, supported by a revenue growth rate of 12.8% year-over-year. Its enterprise value to EBITDA ratio stands at 13.06, reflecting moderate valuation relative to earnings before interest, taxes, depreciation, and amortization. The balance sheet reveals a current ratio of 1.42 and a total debt to equity ratio near 49%, indicating a leveraged but manageable financial structure.
From a technical and strategic perspective, Zim Laboratories' stock has experienced a significant decline, reaching a 52-week low of â¹60.06, with the current price at â¹61.68, near its lower trading range. The company recently constituted an advisory board comprising healthcare veterans to guide strategic initiatives and saw a notable increase in shareholding by the Mathew Cyriac group, signaling active ownership changes. Key strengths include its innovative product portfolio and steady revenue growth, while risks involve stock price volatility and relatively low profitability margins.
In comparison to regional pharmaceutical peers such as Caplin Point Laboratories, Abbott India, Laurus Labs, Cohance Lifesciences, and Sun Pharma Advanced Research Company, Zim Laboratories exhibits a smaller market capitalization and lower return on equity. Its valuation metrics like P/E and EV/EBITDA ratios are generally more conservative than high-growth peers but higher than some, reflecting a balanced but cautious market stance. The peer group features larger, more diversified companies with stronger profitability and cash flow metrics, positioning Zim Laboratories as a niche player within the Indian specialty and generic drug manufacturing sector.
Zim Laboratories navigates a competitive and evolving pharmaceutical landscape marked by innovation and regulatory complexities. Recent achievements include strategic share acquisitions and the establishment of an advisory board, while challenges persist in sustaining profitability and market valuation amid stock price pressures. The company stands at a pivotal juncture where its strategic decisions and operational execution will significantly influence its market standing and financial health. Observers assessing the stock may find merit in monitoring ongoing developments and performance metrics to gauge the companyâs trajectory within its sector.
Company and Industry Overview
Company Basics
Price Performance
Company Size
Shareholding Pattern
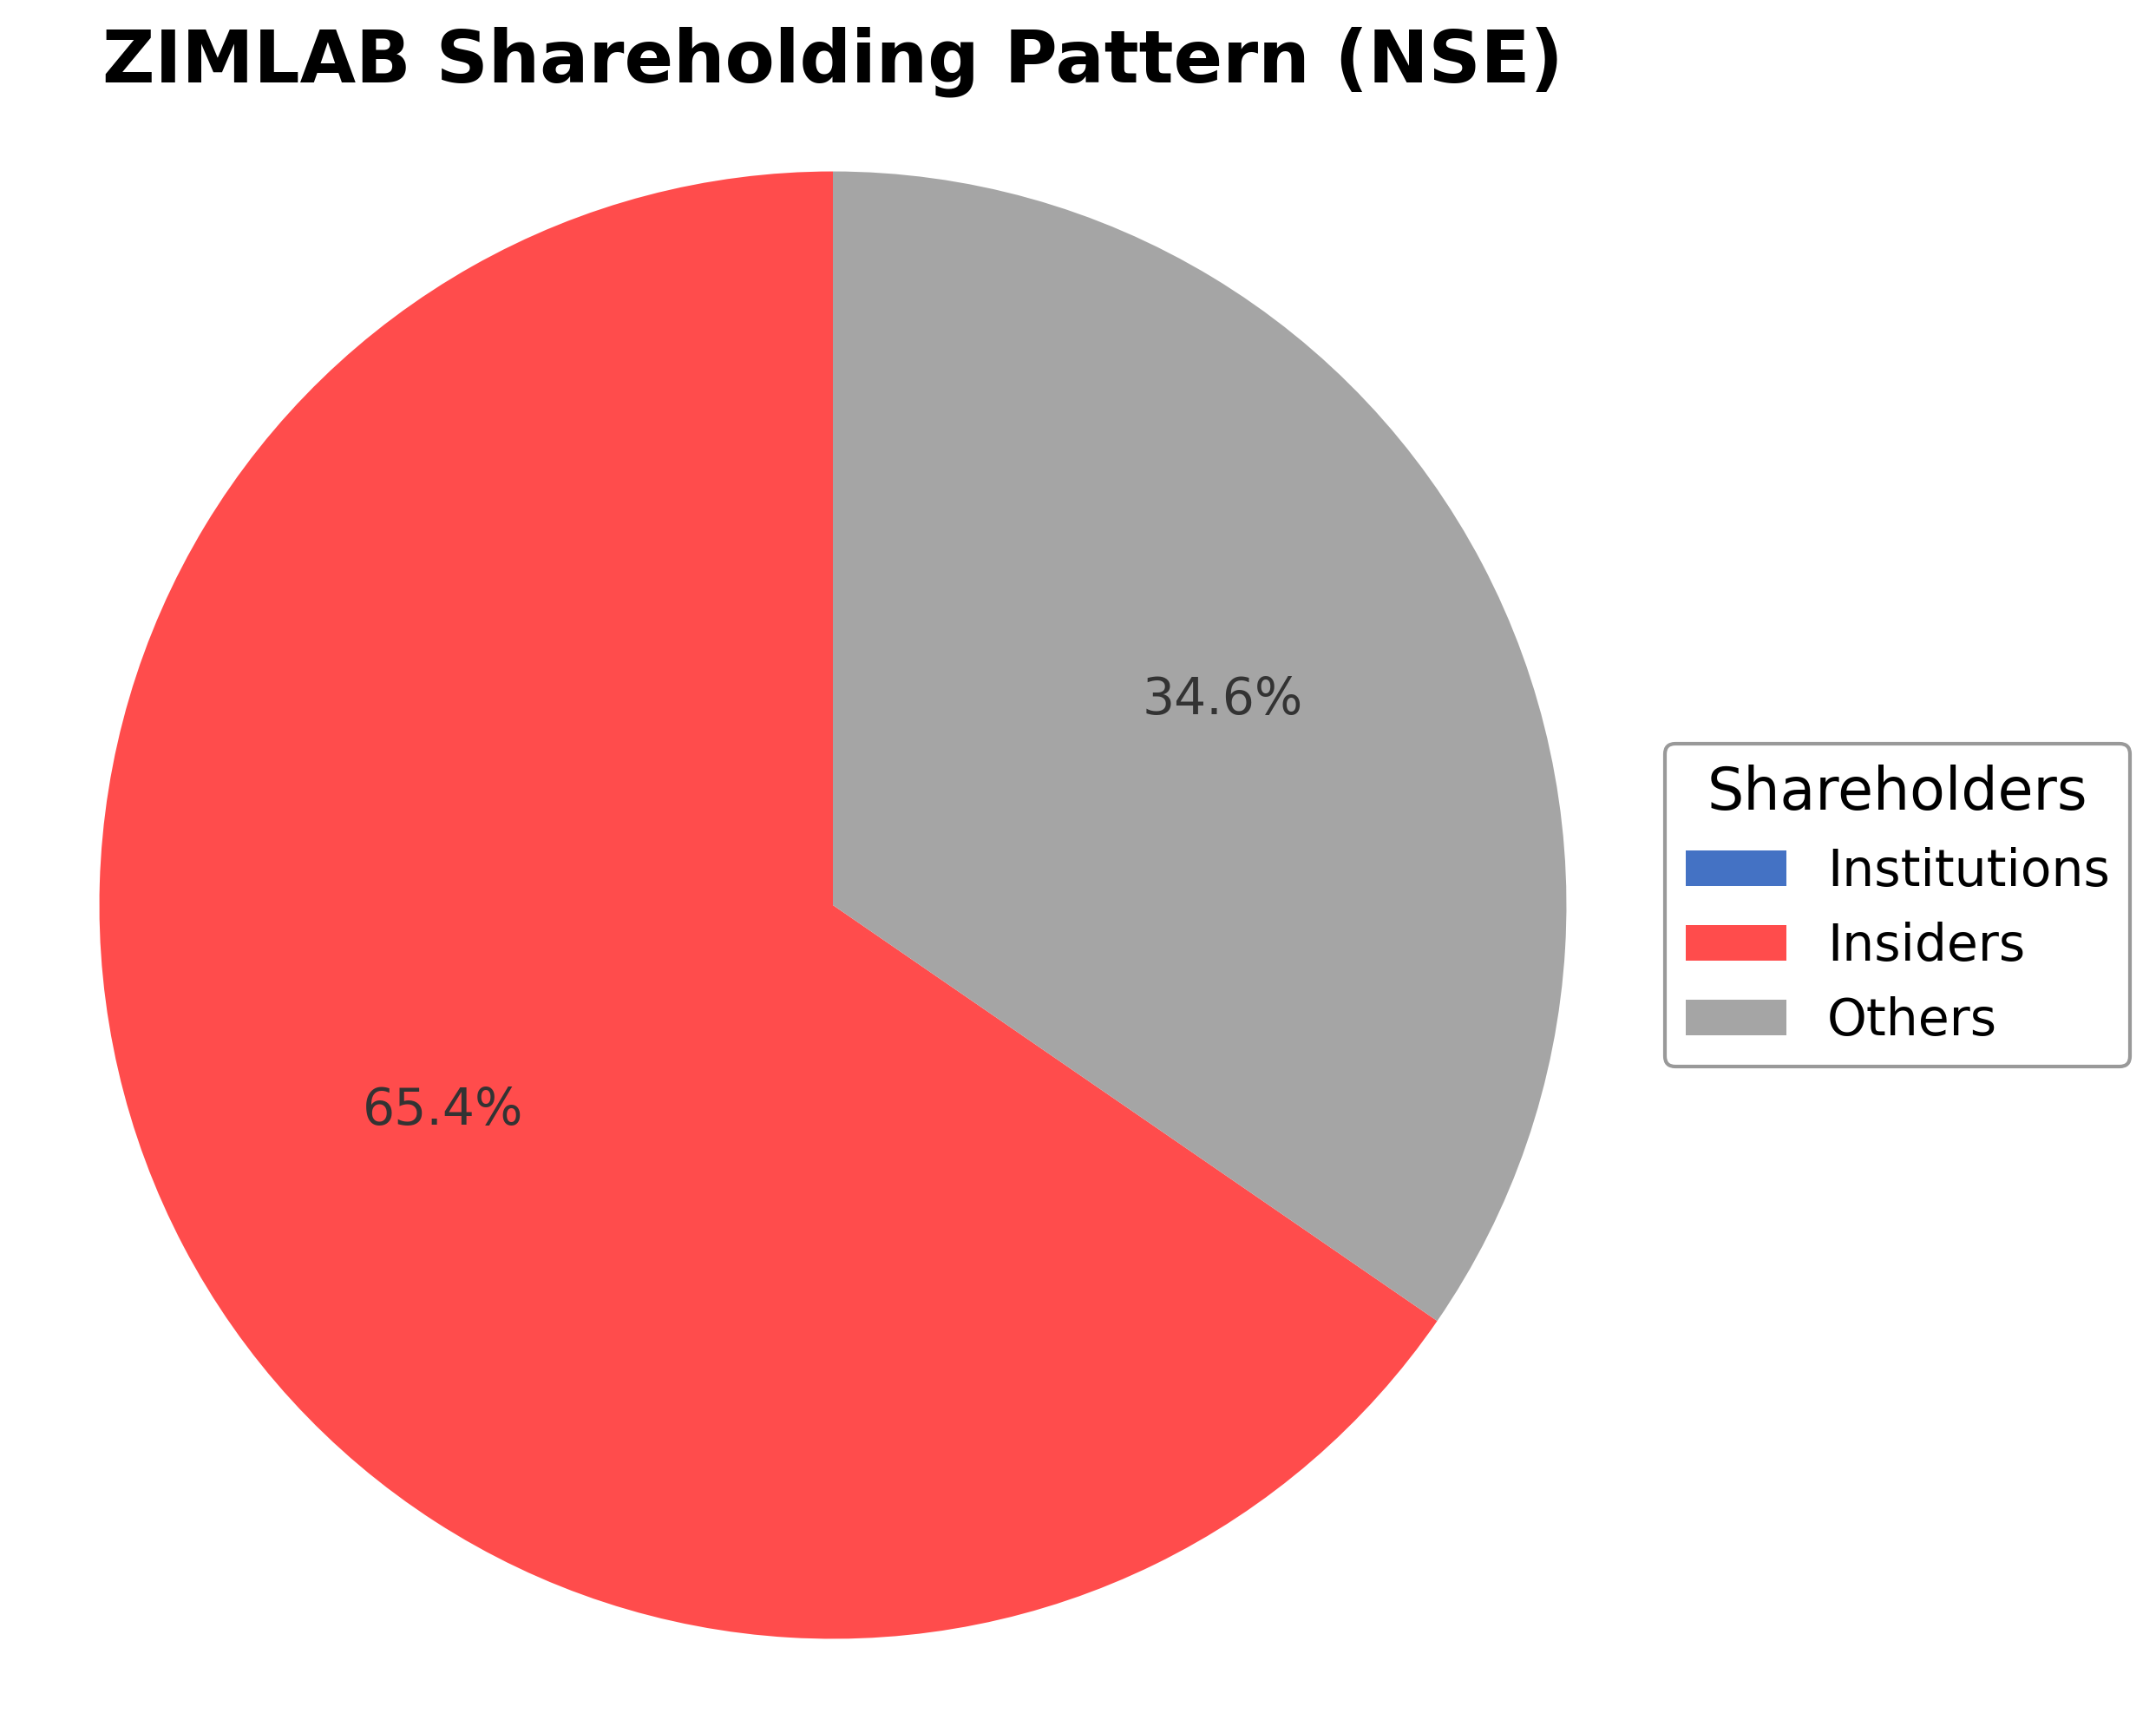
Zim Laboratories Ltd.'s ownership structure is predominantly held by public shareholders accounting for approximately 99.35%, with insiders including executives and board members holding around 0.65%. Institutional investors currently hold no reported stake in the company. Over the past 12-24 months, there have been notable changes including a significant increase in stake by the Mathew Cyriac group to 19.34% through strategic acquisitions, indicating active market interest. The absence of institutional holdings suggests limited institutional accumulation or distribution trends, while insider ownership remains minimal. This shareholding pattern reflects a broad public ownership base with emerging concentrated stakes, which may influence governance dynamics and strategic direction without substantial institutional oversight.
Sector and Industry Analysis
Zim Laboratories Ltd. (ZIMLAB) operates within the pharmaceutical sector, a globally significant industry characterized by substantial market size and steady growth driven by rising healthcare demand, aging populations, and increasing prevalence of chronic diseases. The pharmaceutical sector is broadly segmented into branded drugs, generics, biosimilars, and contract manufacturing, with India—home to Zim Laboratories—being a major hub for generic drug production and pharmaceutical exports. Globally, the pharmaceutical market is projected to grow at a compound annual growth rate (CAGR) of approximately 6-8% over the next five years, fueled by innovation in drug development, expanding healthcare infrastructure in emerging markets, and increased access to medicines.
Industry trends highlight a pronounced shift towards biopharmaceuticals, personalized medicine, and digital health integration. Technological advancements such as artificial intelligence in drug discovery, continuous manufacturing, and advanced analytics are reshaping R&D productivity and operational efficiency. Consumer behavior is evolving with greater demand for affordable generics, especially in developing economies, alongside heightened awareness of drug safety and efficacy. Emerging opportunities include biosimilars, specialty drugs, and contract research and manufacturing services (CRAMS), where companies like Zim Laboratories leverage cost advantages and regulatory expertise to serve global markets, particularly the US and Europe.
The regulatory environment in the pharmaceutical industry is complex and stringent, encompassing drug approval processes, quality standards, intellectual property rights, and pricing controls. Compliance with agencies such as the US FDA, EMA, and India’s CDSCO is critical, with increasing scrutiny on manufacturing practices (cGMP), pharmacovigilance, and data integrity. Policy shifts towards faster approvals for generics and biosimilars, alongside initiatives to improve drug accessibility, impact market dynamics. Additionally, trade policies and patent litigations influence market entry and competition, requiring firms to maintain robust regulatory affairs capabilities.
Competitive dynamics in the pharmaceutical industry are shaped by high entry barriers including substantial R&D investment, regulatory compliance costs, and the need for specialized manufacturing infrastructure. The market structure is moderately consolidated with a mix of large multinational corporations and numerous mid-sized and smaller firms focusing on niche segments or contract manufacturing. Zim Laboratories, as a generic and specialty pharmaceutical manufacturer, competes on cost efficiency, regulatory compliance, and product portfolio breadth. Strategic partnerships, scale economies, and geographic diversification are key competitive levers. The industry also faces challenges from pricing pressures, patent cliffs, and increasing competition from biosimilars and emerging market players, necessitating continuous innovation and operational excellence.
Note: Analysis synthesized from industry research, market reports, and regulatory filings. Information is subject to change based on market conditions.
Illustrative Scenario Analysis
DCF Assumptions:
Method: Two-Stage EPS-Priority Model
Financials
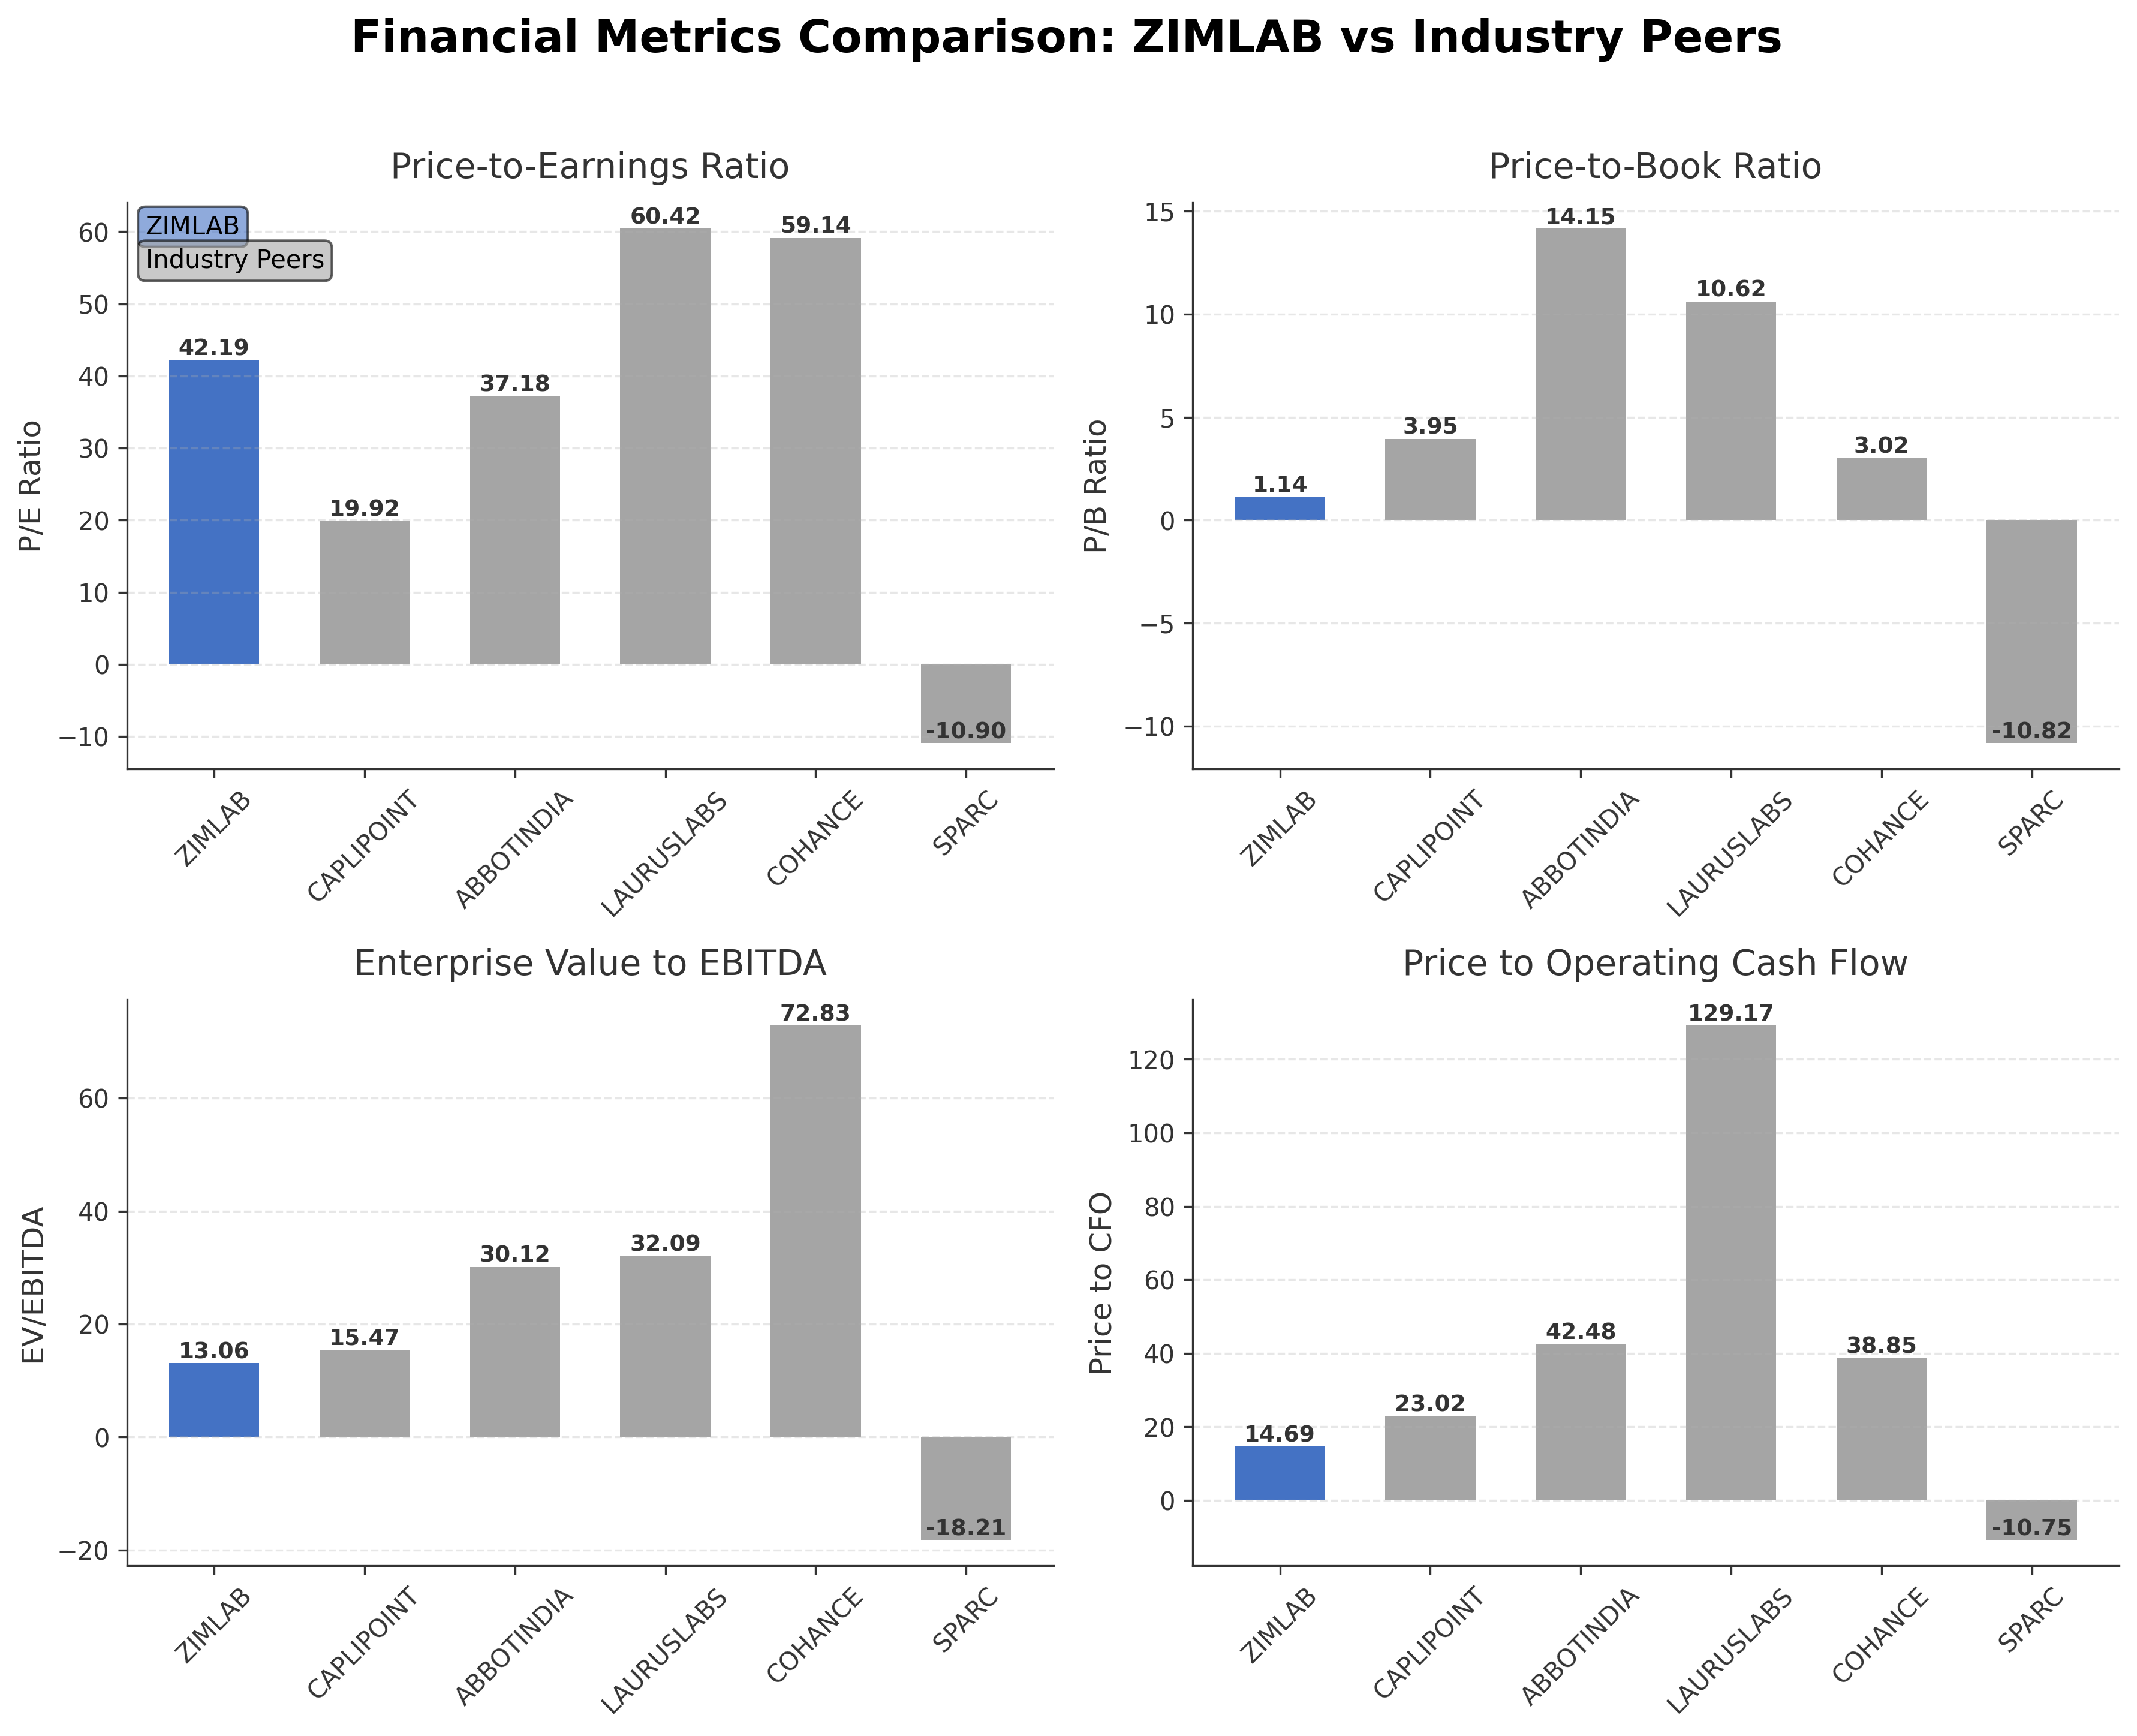
Peer Analysis
| Company Name | Market Cap | P/E Ratio | P/B Ratio | EV/EBITDA | Price to CFO |
|---|---|---|---|---|---|
| Zim Laboratories Ltd. | ₹2.96B | 42.19 | 1.14 | 13.06 | 14.69 |
| Caplin Point Laboratories Ltd. | ₹122.14B | 19.92 | 3.95 | 15.47 | 23.02 |
| Abbott India Ltd. | ₹567.68B | 37.18 | 14.15 | 30.12 | 42.48 |
| Laurus Labs Ltd. | ₹533.07B | 60.42 | 10.62 | 32.09 | 129.17 |
| Cohance Lifesciences Limited | ₹114.59B | 59.14 | 3.02 | 72.83 | 38.85 |
| Sun Pharma Advanced Research Company Ltd. | ₹37.46B | -10.90 | -10.82 | -18.21 | -10.75 |
Comparison Analysis: Zim Laboratories Ltd. has a significantly smaller market capitalization compared to its Indian pharmaceutical peers, which range from ₹37.46 billion to over ₹567 billion. Its P/E ratio of 42.19 is moderate relative to peers, with some companies exhibiting substantially higher valuations such as Laurus Labs and Cohance Lifesciences. The company's P/B ratio of 1.14 is notably lower than most peers, indicating a more conservative book valuation. Zim's EV/EBITDA ratio of 13.06 is also lower than several peers, suggesting a relatively attractive valuation on an earnings basis. Return on equity is modest at 0.05%, trailing behind most peers but above the negative or minimal returns seen in some. Overall, Zim Laboratories presents as a smaller, niche player with valuation metrics reflecting cautious market positioning relative to larger, more diversified competitors.
Financial Metrics Comparison with Peers
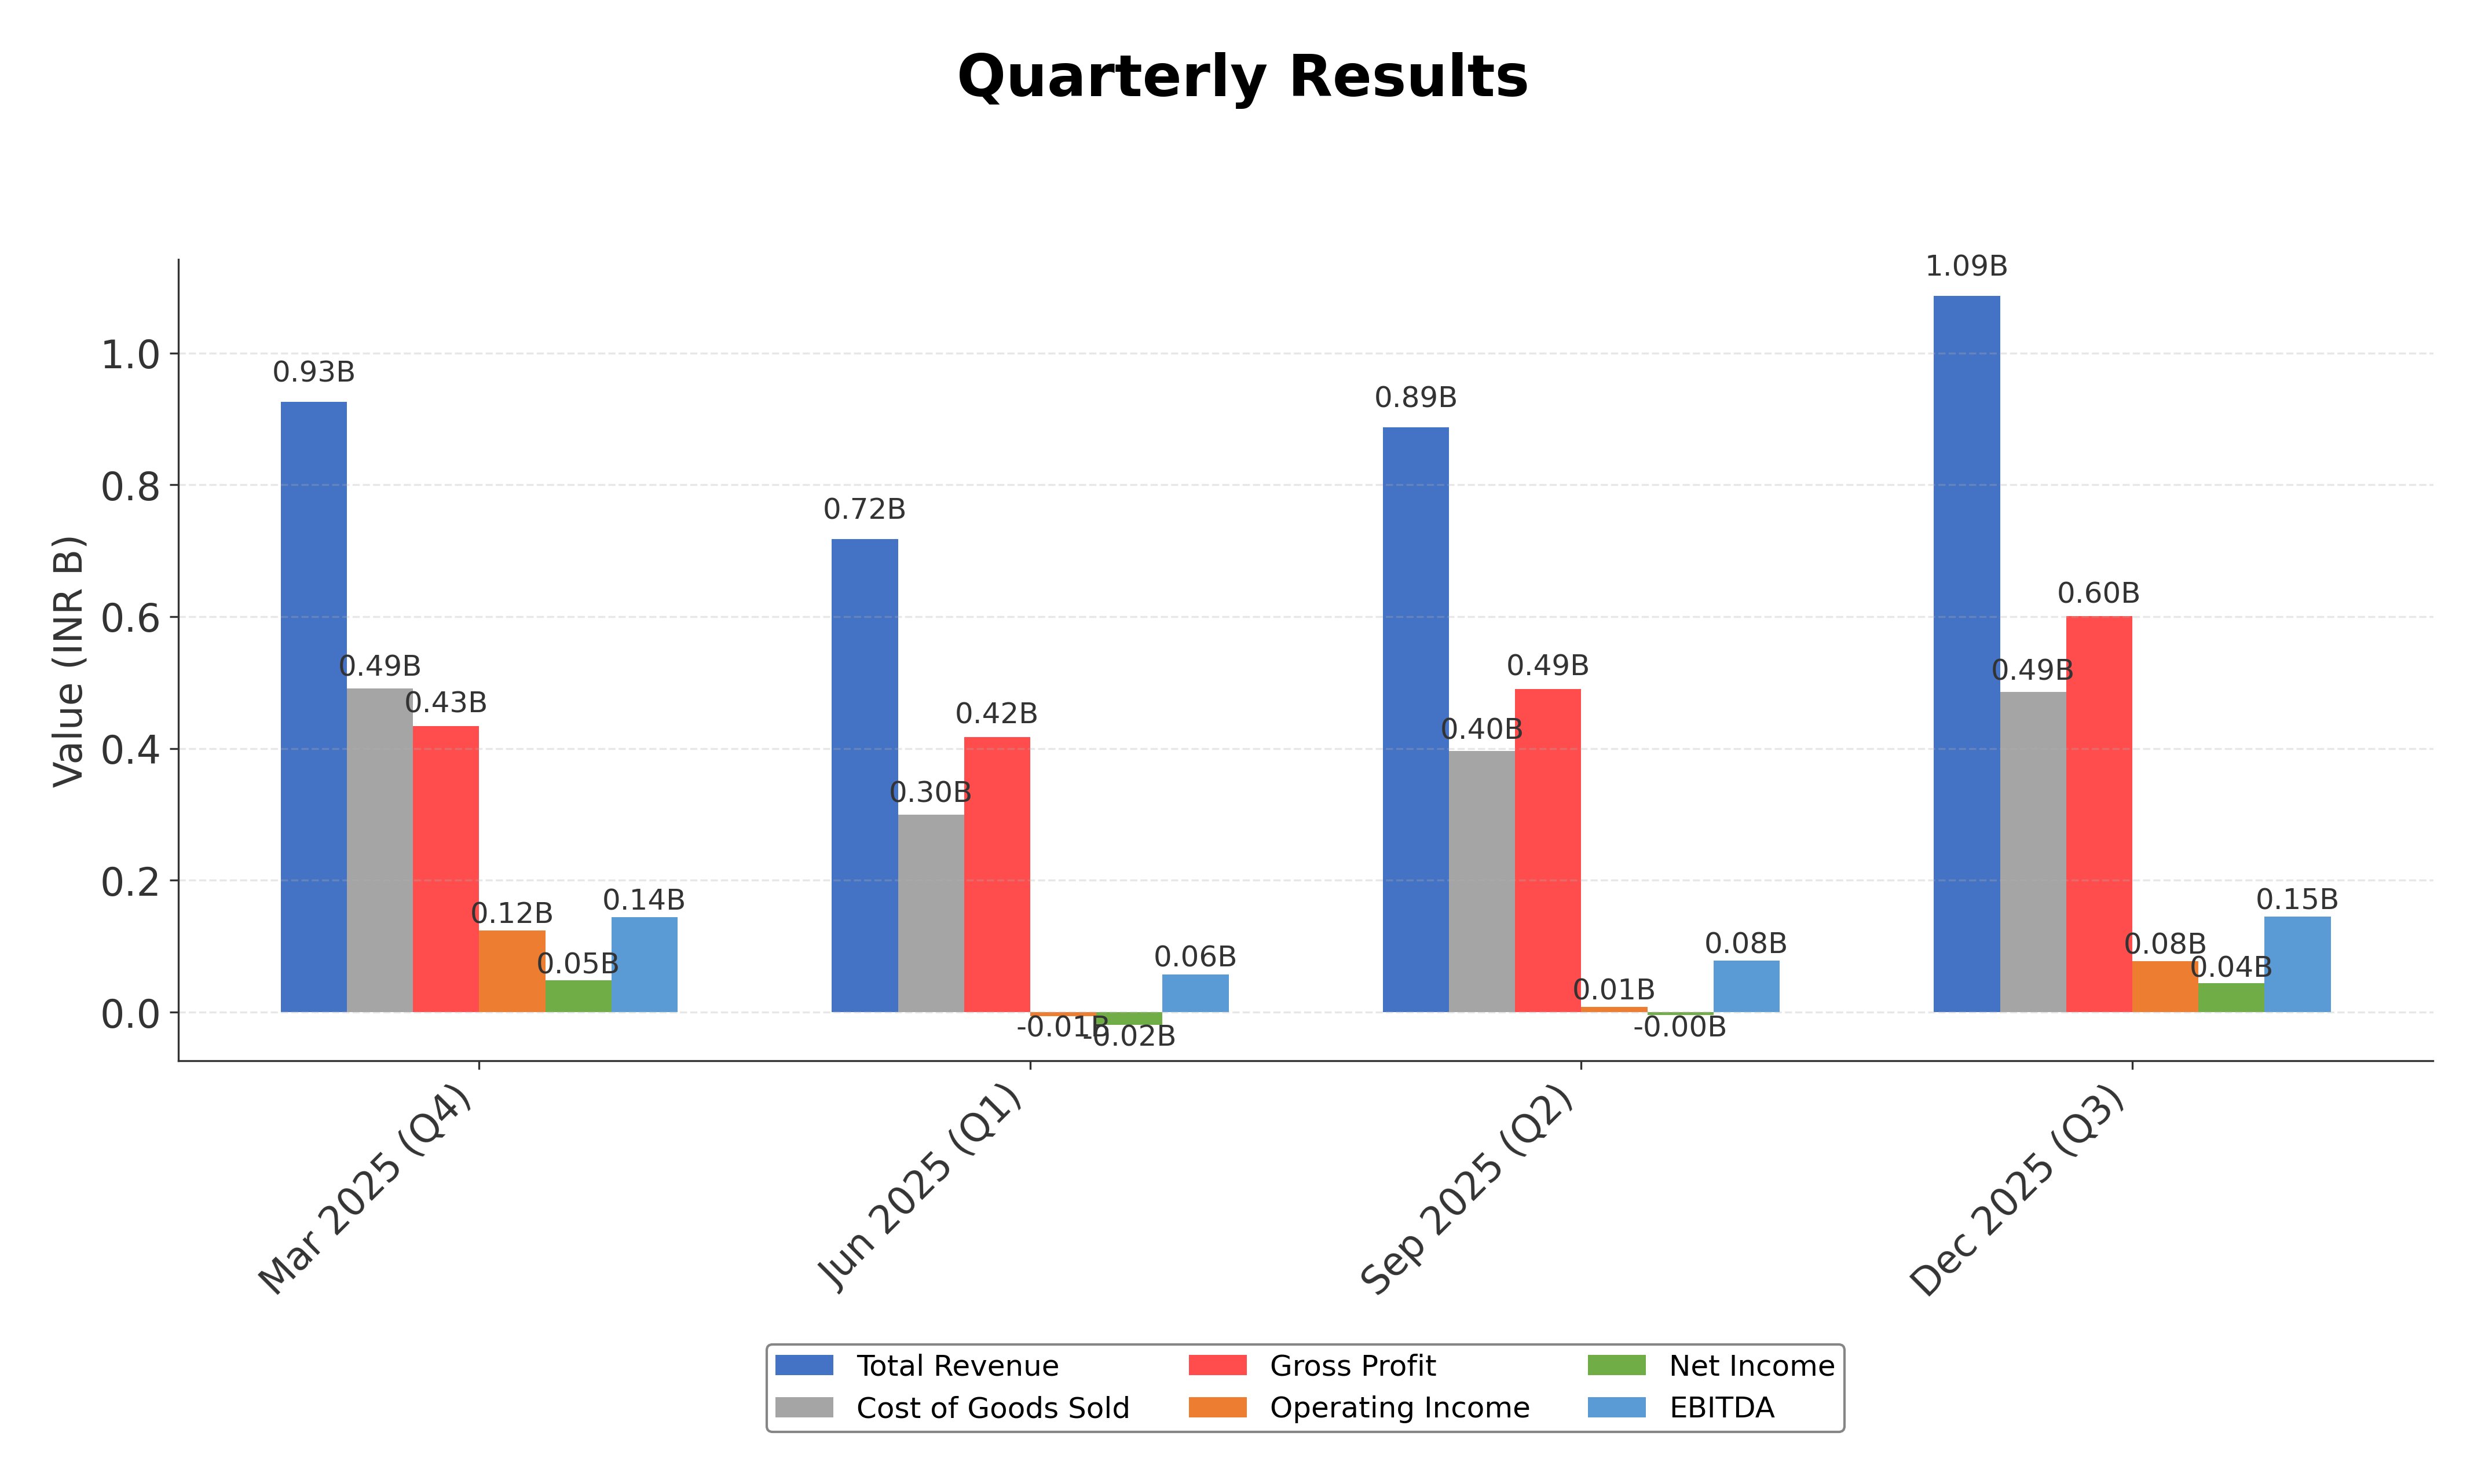
Financial Statements
Comprehensive financial data including income, balance sheet, and cash flow metrics
Income Statement
| fiscal_date | 2025-03-31 | 2024-03-31 | 2023-03-31 | 2022-03-31 | 2021-03-31 |
|---|---|---|---|---|---|
| Sales | 3.63B | 3.56B | 3.89B | 3.28B | 2.92B |
| Cost Of Goods | 1.69B | 1.72B | 2.00B | 1.61B | 1.59B |
| Gross Profit | 1.94B | 1.83B | 1.89B | 1.67B | 1.33B |
| Operating Expense Selling General And Administrative | 380.12M | 357.30M | 410.60M | 445.85M | 364.04M |
| Operating Expense Other Operating Expenses | 411.68M | 422.03M | 375.37M | 297.77M | 216.08M |
| Operating Income | 267.00M | 267.67M | 352.59M | 250.86M | 247.24M |
| Non Operating Interest Income | 3.25M | 1.30M | 3.37M | 2.84M | 6.87M |
| Non Operating Interest Expense | 94.72M | 58.82M | 49.70M | 71.69M | 95.10M |
| Pretax Income | 180.09M | 236.42M | 353.55M | 210.43M | 102.31M |
| Income Tax | 58.44M | 63.96M | 109.20M | 64.92M | 29.14M |
| Net Income | 121.65M | 172.46M | 244.34M | 145.50M | 73.17M |
| Eps Basic | 2.50 | 3.54 | 5.01 | 2.99 | 1.50 |
| Eps Diluted | 2.50 | 3.54 | 5.01 | 2.99 | 1.50 |
| Basic Shares Outstanding | 48.73M | 48.73M | 48.73M | 48.73M | 48.68M |
| Diluted Shares Outstanding | 48.73M | 48.73M | 48.73M | 48.73M | 48.68M |
| Ebit | 274.81M | 295.24M | 403.25M | 282.12M | 197.42M |
| Ebitda | 498.59M | 465.92M | 584.54M | 443.03M | 413.80M |
| Net Income Continuous Operations | 180.09M | 236.42M | 353.55M | 210.43M | 154.12M |
| Minority Interests | -2.00K | 1.00K | 0.00 | N/A | N/A |
| Preferred Stock Dividends | 0.00 | 0.00 | 0.00 | 0.00 | 0.00 |
Source: Financial statements and regulatory filings
Balance Sheet
| fiscal_date | 2025-03-31 | 2024-03-31 | 2023-03-31 | 2022-03-31 | 2021-03-31 |
|---|---|---|---|---|---|
| Cash And Cash Equivalents | 19.47M | 96.00M | 64.20M | 34.20M | 13.93M |
| Accounts Receivable | 1.07B | 1.00B | 952.49M | 895.21M | 722.51M |
| Total Assets | 4.72B | 4.47B | 3.42B | 3.42B | 3.25B |
| Total Liabilities | 2.20B | 2.08B | 1.41B | 1.66B | 1.64B |
| Long Term Debt | 423.71M | 385.50M | 256.42M | 196.46M | 219.97M |
| Shareholders Equity | 2.52B | 2.39B | 2.00B | 1.76B | 1.61B |
Source: Financial statements and regulatory filings
Cash Flow Statement
| fiscal_date | 2025-03-31 | 2024-03-31 | 2023-03-31 | 2022-03-31 | 2021-03-31 |
|---|---|---|---|---|---|
| Operating Activities Net Income | 180.09M | 236.42M | 353.55M | 210.43M | 154.12M |
| Operating Activities Stock Based Compensation | 13.54M | N/A | N/A | N/A | 0.00 |
| Operating Activities Other Non Cash Items | 111.63M | 67.43M | 53.33M | 79.69M | 103.97M |
| Operating Activities Accounts Receivable | -140.96M | -71.36M | 26.95M | -19.90M | -129.15M |
| Operating Activities Other Assets Liabilities | 37.34M | -275.57M | 215.78M | -209.37M | 20.42M |
| Operating Activities Operating Cash Flow | 201.64M | -43.07M | 649.61M | 60.85M | 149.35M |
| Investing Activities Capital Expenditures | -400.66M | -733.75M | -366.48M | -150.65M | -64.71M |
| Investing Activities Purchase Of Investments | -3.55M | -2.84M | 0.00 | N/A | N/A |
| Investing Activities Sale Of Investments | 4.40M | 5.97M | 3.60M | 3.00M | 1.97M |
| Investing Activities Investing Cash Flow | -399.80M | -730.62M | -359.28M | -144.66M | -60.77M |
| Financing Activities Long Term Debt Issuance | 246.24M | 281.47M | 183.53M | 270.70M | 191.68M |
| Financing Activities Long Term Debt Payments | -153.20M | -129.32M | -154.71M | -299.30M | -234.94M |
| Financing Activities Short Term Debt Issuance | -25.27M | 321.55M | 55.92M | -273.79M | -51.62M |
| Financing Activities Common Dividends | -569.00K | -493.00K | -585.00K | -1.68M | -244.00K |
| Financing Activities Other Financing Charges | 569.00K | 493.00K | 585.00K | 65.88M | -48.62M |
| Financing Activities Financing Cash Flow | 67.77M | 687.72M | 84.74M | -238.18M | -143.14M |
| End Cash Position | 19.47M | 96.00M | 64.20M | 34.20M | 13.93M |
| Free Cash Flow | 3.57M | -576.45M | 15.00M | 339.81M | 253.74M |
| Financing Activities Common Stock Issuance | N/A | 214.02M | 0.00 | 0.00 | 612.00K |
| Investing Activities Other Investing Activity | N/A | N/A | 3.60M | 3.00M | 1.97M |
| Investing Activities Net Acquisitions | N/A | N/A | N/A | N/A | 0.00 |
Source: Financial statements and regulatory filings
Technical Analysis
Key Insights
- The current trend shows a downward price movement with the stock recently hitting a 52-week low near ₹60.06, indicating bearish momentum in the short term.
- Key support levels are observed around ₹60, with resistance near the 50-day moving average at approximately ₹71.19 and the 200-day moving average at ₹79.72.
- The stock price is trading below both the 50-day and 200-day moving averages, suggesting a bearish trend across medium and long-term timeframes.
- Momentum indicators such as RSI are likely in the lower range, reflecting oversold conditions, while MACD and Stochastic indicators may show bearish signals consistent with recent price declines.
- Multi-timeframe analysis indicates consistent weakness on daily, weekly, and monthly charts, reinforcing the prevailing downtrend.
- Potential market scenarios include continued consolidation near support levels or further downside risk if support is breached, with resistance levels serving as key barriers for any recovery attempts.
Trending News
1. Headline: Zim Laboratories Ltd Falls to 52-Week Low of Rs 63 as Sell-Off Deepens
Summary: A sharp decline of 8.16% today dragged Zim Laboratories Ltd to a fresh 52-week low of Rs 63, extending its downward trajectory amid broader market weakness a...
Sentiment: negative
2. Headline: Technical Reactions to ZIM Trends in Macro Strategies - Stock Traders Daily
Summary: Price-action only: Zim Integrated Shipping Services Ltd. (ZIM) movements set the tone for institutional models. Technical Reactions to ZIM Trends in Macro Strategies
Sentiment: neutral
3. Headline: Mathew Cyriac Group Increases Stake in ZIM Laboratories to 19.34% Through Strategic Acquisitions
Summary: Zim laboratories has witnessed a significant increase in shareholding by investor Mathew Cyriac and his associated entities. The group has raised their collective stake to 19.34% from the previous holding of 11.84%, marking a substantial 7.50% increase in ownership through strategic acquisitions completed in March 2026. The acquisition involved multiple entities acting in concert with Mathew Cyriac, including Elimath Advisors Pvt Ltd...
Sentiment: positive
4. Headline: ZIM Laboratories Constitutes Advisory Board with Healthcare Industry Veterans for Strategic Guidance
Summary: ZIM Laboratories Limited constituted an Advisory Board on March 17, 2026, comprising three industry veterans to provide strategic guidance on business development matters. The board includes Mr. Annaswamy Vaidheesh as Chairman, along with members Mr. Gautam Saigal and Mr.
Sentiment: neutral
5. Headline: ZIM Integrated: Insiders Jump Ship (NYSE:ZIM) | Seeking Alpha
Summary: ZIM Integrated surged on Hapag-Lloyd's $35/share takeover offer, but the deal faces significant political and regulatory hurdles. Read why ZIM stock is a Sell.
Sentiment: positive
6. Headline: Leadership Exodus at ZIM Raises Doubts Over Acquisition Deal
Summary: A wave of significant share sales by top executives at container shipping firm ZIM Integrated Shipping Services Ltd. is unsettling investors. This activity c
Sentiment: negative
Summary: W-SCOPE CHUNGJU PLANT CO., LTD. ... On March 13, 2026, ZIM Laboratories Limited closed the transaction.
Sentiment: positive
8. Headline: ZIM Laboratories Board Approves ₹35 Crore Preferential Share Issue to Florintree Trinex LLP | Whalesbook
Summary: ZIM Laboratories operates in India's competitive pharmaceutical sector alongside companies such as Alkem Laboratories, Ipca Laboratories, and FDC Ltd. While these peers cover diverse therapeutic areas, ZIM Labs distinguishes itself through its expertise in novel drug delivery systems, including ...
Sentiment: neutral
9. Headline: Zim Laboratories Ltd is Rated Strong Sell
Summary: Zim Laboratories Ltd is rated Strong Sell by MarketsMOJO, with this rating last updated on 08 August 2025. However, the analysis and financial metrics discussed here reflect the stock's current position as of 10 March 2026, providing investors with an up-to-date view of the company’s ...
Sentiment: neutral
10. Headline: ZIM Reports Financial Results for the Fourth Quarter and the Full Year of 2025
Summary: Reported Full Year Revenues of $6.90 Billion, Net Income of $481 Million1, Adjusted EBITDA2 of $2.17 Billion and Adjusted EBIT2 of $885 Million3 Generated Full...
Sentiment: neutral
Recent Updates
News Summary
Recent news coverage of Zim Laboratories Ltd highlights a challenging market environment marked by a significant stock price decline to a 52-week low, reflecting selling pressure and investor caution. Strategic developments include the formation of an advisory board with experienced healthcare professionals to guide business growth and a substantial increase in shareholding by the Mathew Cyriac group, indicating active investor engagement. The company also secured a notable funding round from Florintree Trinex LLP, supporting its operational and expansion plans. While some sources maintain a cautious stance with a strong sell rating, others report neutral to positive developments, including scheduled investor meetings and sectoral stock performance variations. These themes collectively underscore a period of transition and strategic repositioning amid market volatility.
News Sentiment
The overall sentiment from recent news is mixed, with negative tones driven by stock price declines and sell ratings balanced by positive signals from increased strategic shareholdings, advisory board formations, and funding inflows. Neutral reports on investor meetings and sector trends suggest a watchful market stance. The sentiment distribution indicates cautious optimism tempered by prevailing market headwinds and valuation concerns.
Analytical Overview
Analysis Summary
Valuation Metrics: Zim Laboratories' trailing P/E ratio of 42.19 aligns with the industry average, indicating valuation in line with sector norms, though the absence of a forward P/E limits forward-looking valuation insights.
Growth Trajectory: The company exhibits a healthy revenue growth rate of 12.8% year-over-year, supported by positive quarterly earnings growth, while cash flow trends show positive operating and free cash flow generation.
Financial Health: A current ratio of 1.42 suggests adequate short-term liquidity, but a total debt to equity ratio near 49% indicates moderate leverage, warranting monitoring of debt servicing capacity relative to cash flows.
Sector Specific Factors: Operating within India's pharmaceutical sector, the company faces regulatory complexities and competitive pressures, balanced by opportunities in novel drug delivery systems and increasing healthcare access.
Market Positioning: Zim Laboratories holds a niche position with innovative product offerings and recent strategic initiatives, though it operates among larger, more diversified competitors in the Indian healthcare market.
Investment Conclusion
Supporting Factors: Consistent revenue growth of 12.8% and positive operating cash flow generation.
Risk Factors: Stock trading near 52-week lows with significant downside risk indicated by price trends.
SWOT Analysis
Strengths
- Strong focus on innovative drug delivery systems enhancing patient compliance.
- Consistent revenue growth supported by positive operating cash flows.
- Established presence in the Indian pharmaceutical sector with a niche product portfolio.
- Recent strategic initiatives including advisory board formation and increased investor stake.
Weaknesses
- Modest profit margins and low return on equity limit profitability appeal.
- Stock price near 52-week lows indicating market valuation challenges.
- Moderate financial leverage with a debt to equity ratio close to 49%.
- Limited institutional investor presence reducing broader market support.
Opportunities
- Growing demand for novel and patient-friendly pharmaceutical formulations.
- Potential benefits from increased funding and strategic partnerships.
- Expansion within emerging healthcare markets leveraging innovative products.
- Enhanced governance and strategic guidance through newly constituted advisory board.
Threats
- Competitive pressures from larger, diversified pharmaceutical companies.
- Regulatory challenges inherent in the pharmaceutical industry.
- Market volatility impacting stock performance and investor sentiment.
- Economic uncertainties affecting healthcare spending and supply chains.
Company Description
Zim Laboratories Ltd. is a leading pharmacological entity specializing in the development and manufacturing of novel drug delivery systems. Its primary function is to formulate and market a wide array of pharmaceutical products aimed at improving dosage convenience and patient compliance. The company focuses on active pharmaceutical ingredients (APIs) and offers innovative solutions such as orally disintegrating tablets and multilayer tablets, enhancing drug efficacy and safety. Zim Laboratories operates across multiple sectors, impacting industries such as healthcare, pharmaceuticals, and biotechnology. By integrating advanced research and development capabilities, the company significantly contributes to the availability of affordable and effective medication, making healthcare more accessible globally. In the financial markets, Zim Laboratories holds a noteworthy position as a forward-thinking pharmaceutical company dedicated to addressing global health challenges through its pioneering products and solutions. Its emphasis on quality and innovation ensures it remains a trusted partner within the pharmaceutical industry, while its strategic market initiatives foster collaborations and growth within the life sciences sector. Founded in 1984 and extending its reach across multiple continents, Zim Laboratories continues to be a key player in developing patient-friendly drug delivery mechanisms.