
Wipro Ltd (WIPRO)
Stock Analysis Report
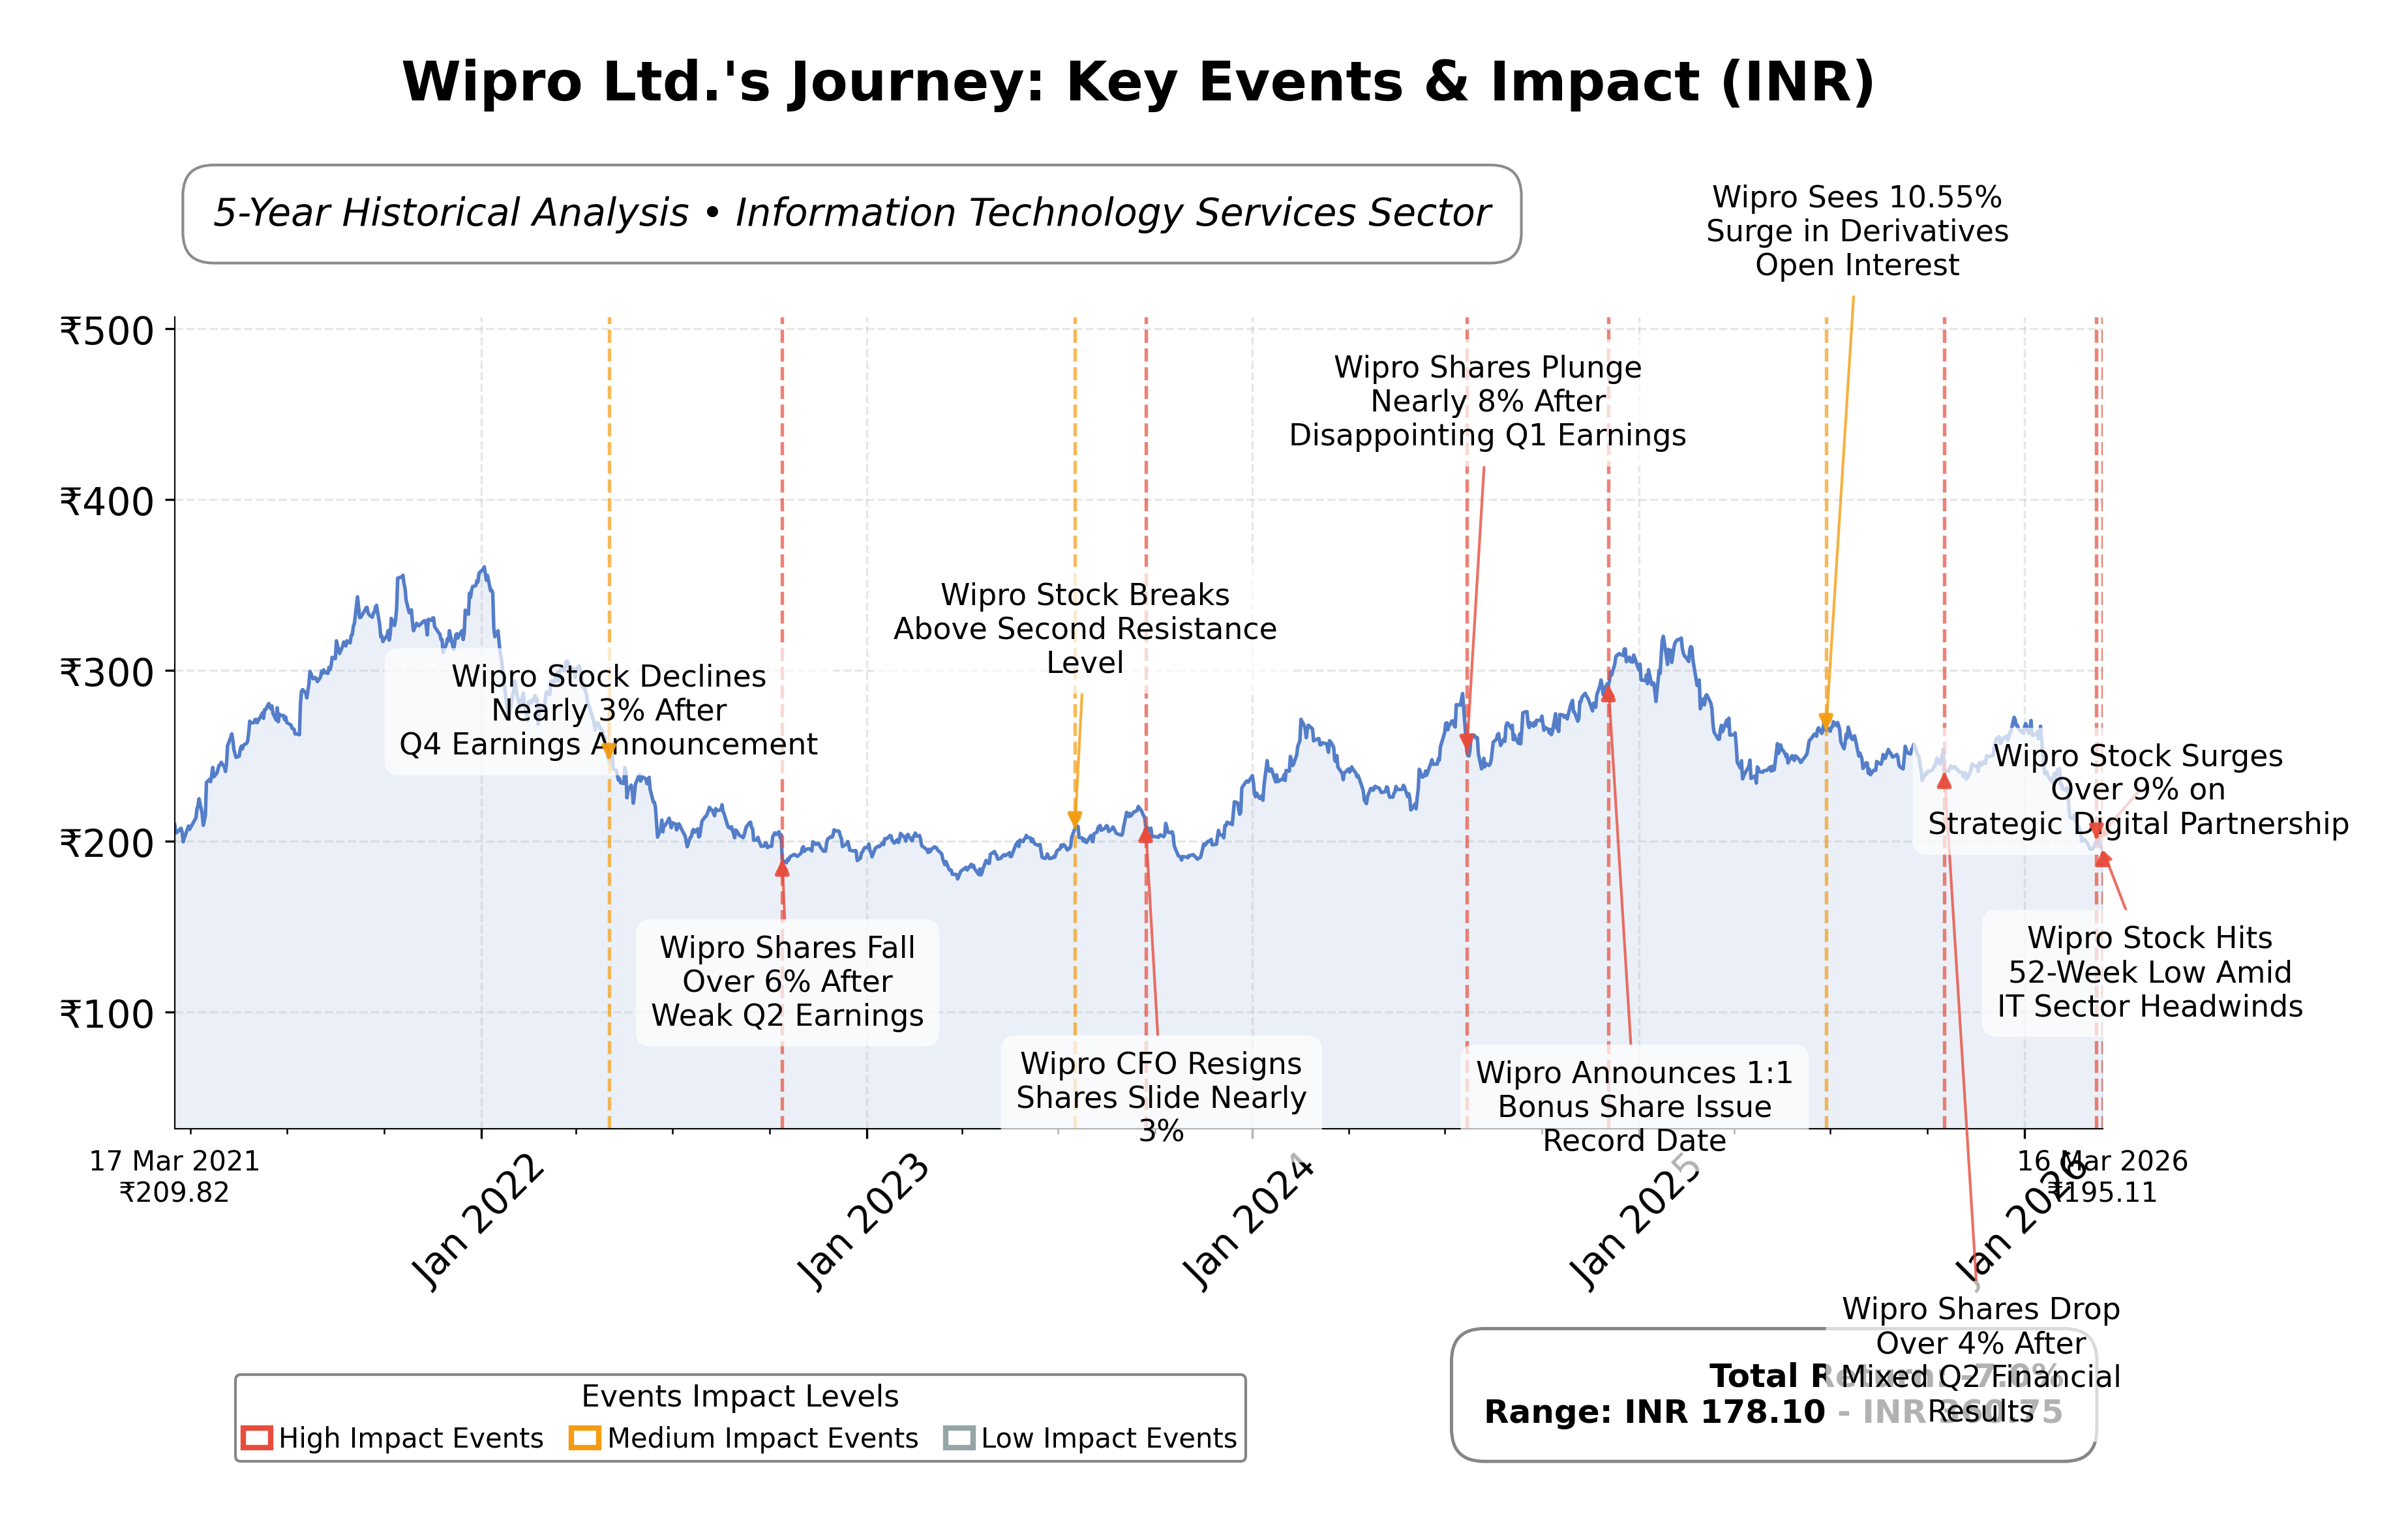
Stock Journey
Key Positives and Key Risks
Pros
- Market capitalization of ₹2.07 trillion underscores Wipro's strong market presence and scale.
- Trailing P/E ratio of 15.64 and forward P/E of 14.66 align closely with industry averages, indicating reasonable valuation.
- Operating cash flow of ₹155 billion and free cash flow of ₹110 billion demonstrate robust cash generation supporting financial stability.
Cons
- Stock price trading near 52-week low of ₹193.03 with a downside risk of 43.69% from recent highs reflects market caution.
- Negative quarterly earnings growth year-over-year of 7% signals potential profitability challenges.
- Increased put option activity and bearish sentiment indicate heightened market concerns about near-term performance.
Disclosure: This information is for general awareness and does not constitute investment advice
Report Summary
Wipro Ltd. operates as a leading global information technology, consulting, and business process services company headquartered in Bengaluru, India. It serves diverse sectors such as finance, healthcare, telecommunications, and consumer goods, providing advanced technology solutions including artificial intelligence, robotics, cybersecurity, and cloud computing. Positioned as a significant player in the Indian IT services industry, Wipro emphasizes sustainability and innovation to support digital transformation across industries.
Financially, Wipro reports a market capitalization of approximately â¹2.07 trillion with a trailing P/E ratio of 15.64 and a forward P/E of 14.66, reflecting valuation metrics close to the industry average. The company shows a profit margin of 14.59%, operating margin of 14.84%, and a return on equity of 15.20%, supported by a stable revenue growth rate of 5.5% year-over-year. Its enterprise value to EBITDA ratio stands at 10.06, indicating moderate valuation relative to earnings.
Technically, Wiproâs stock is trading near its 52-week low of â¹193.03 with a current price of â¹191.10, below both its 50-day and 200-day moving averages, suggesting a bearish short-term trend. Recent strategic initiatives include a collaboration with Harness to accelerate AI software deployment, while leadership and market sentiment reflect cautious investor attention amid sector headwinds. Key strengths include robust cash reserves and a strong current ratio of 2.19, while risks involve sector-wide challenges and recent declines in share price.
In peer comparison within the Indian IT services sector, Wiproâs valuation metrics such as P/E and EV/EBITDA are lower than those of peers like Mphasis, Persistent Systems, and Tech Mahindra, indicating relatively more conservative pricing. Its return on equity is comparable to Tech Mahindra but below some peers, reflecting moderate profitability. Market capitalization is the largest among the peers listed, underscoring Wiproâs scale and market presence.
Wipro navigates a dynamic industry landscape marked by rapid technological change and competitive pressures. Recent achievements include strategic partnerships aimed at enhancing AI capabilities, while ongoing challenges involve managing market sentiment and sustaining growth momentum. The company stands at a pivotal moment where execution of its digital transformation strategy and market conditions will significantly influence its future positioning. Evaluating the current data suggests a stance that balances recognition of Wiproâs foundational strengths with prudent observation of market developments and sector trends.",
Company and Industry Overview
Company Basics
Price Performance
Company Size
Shareholding Pattern
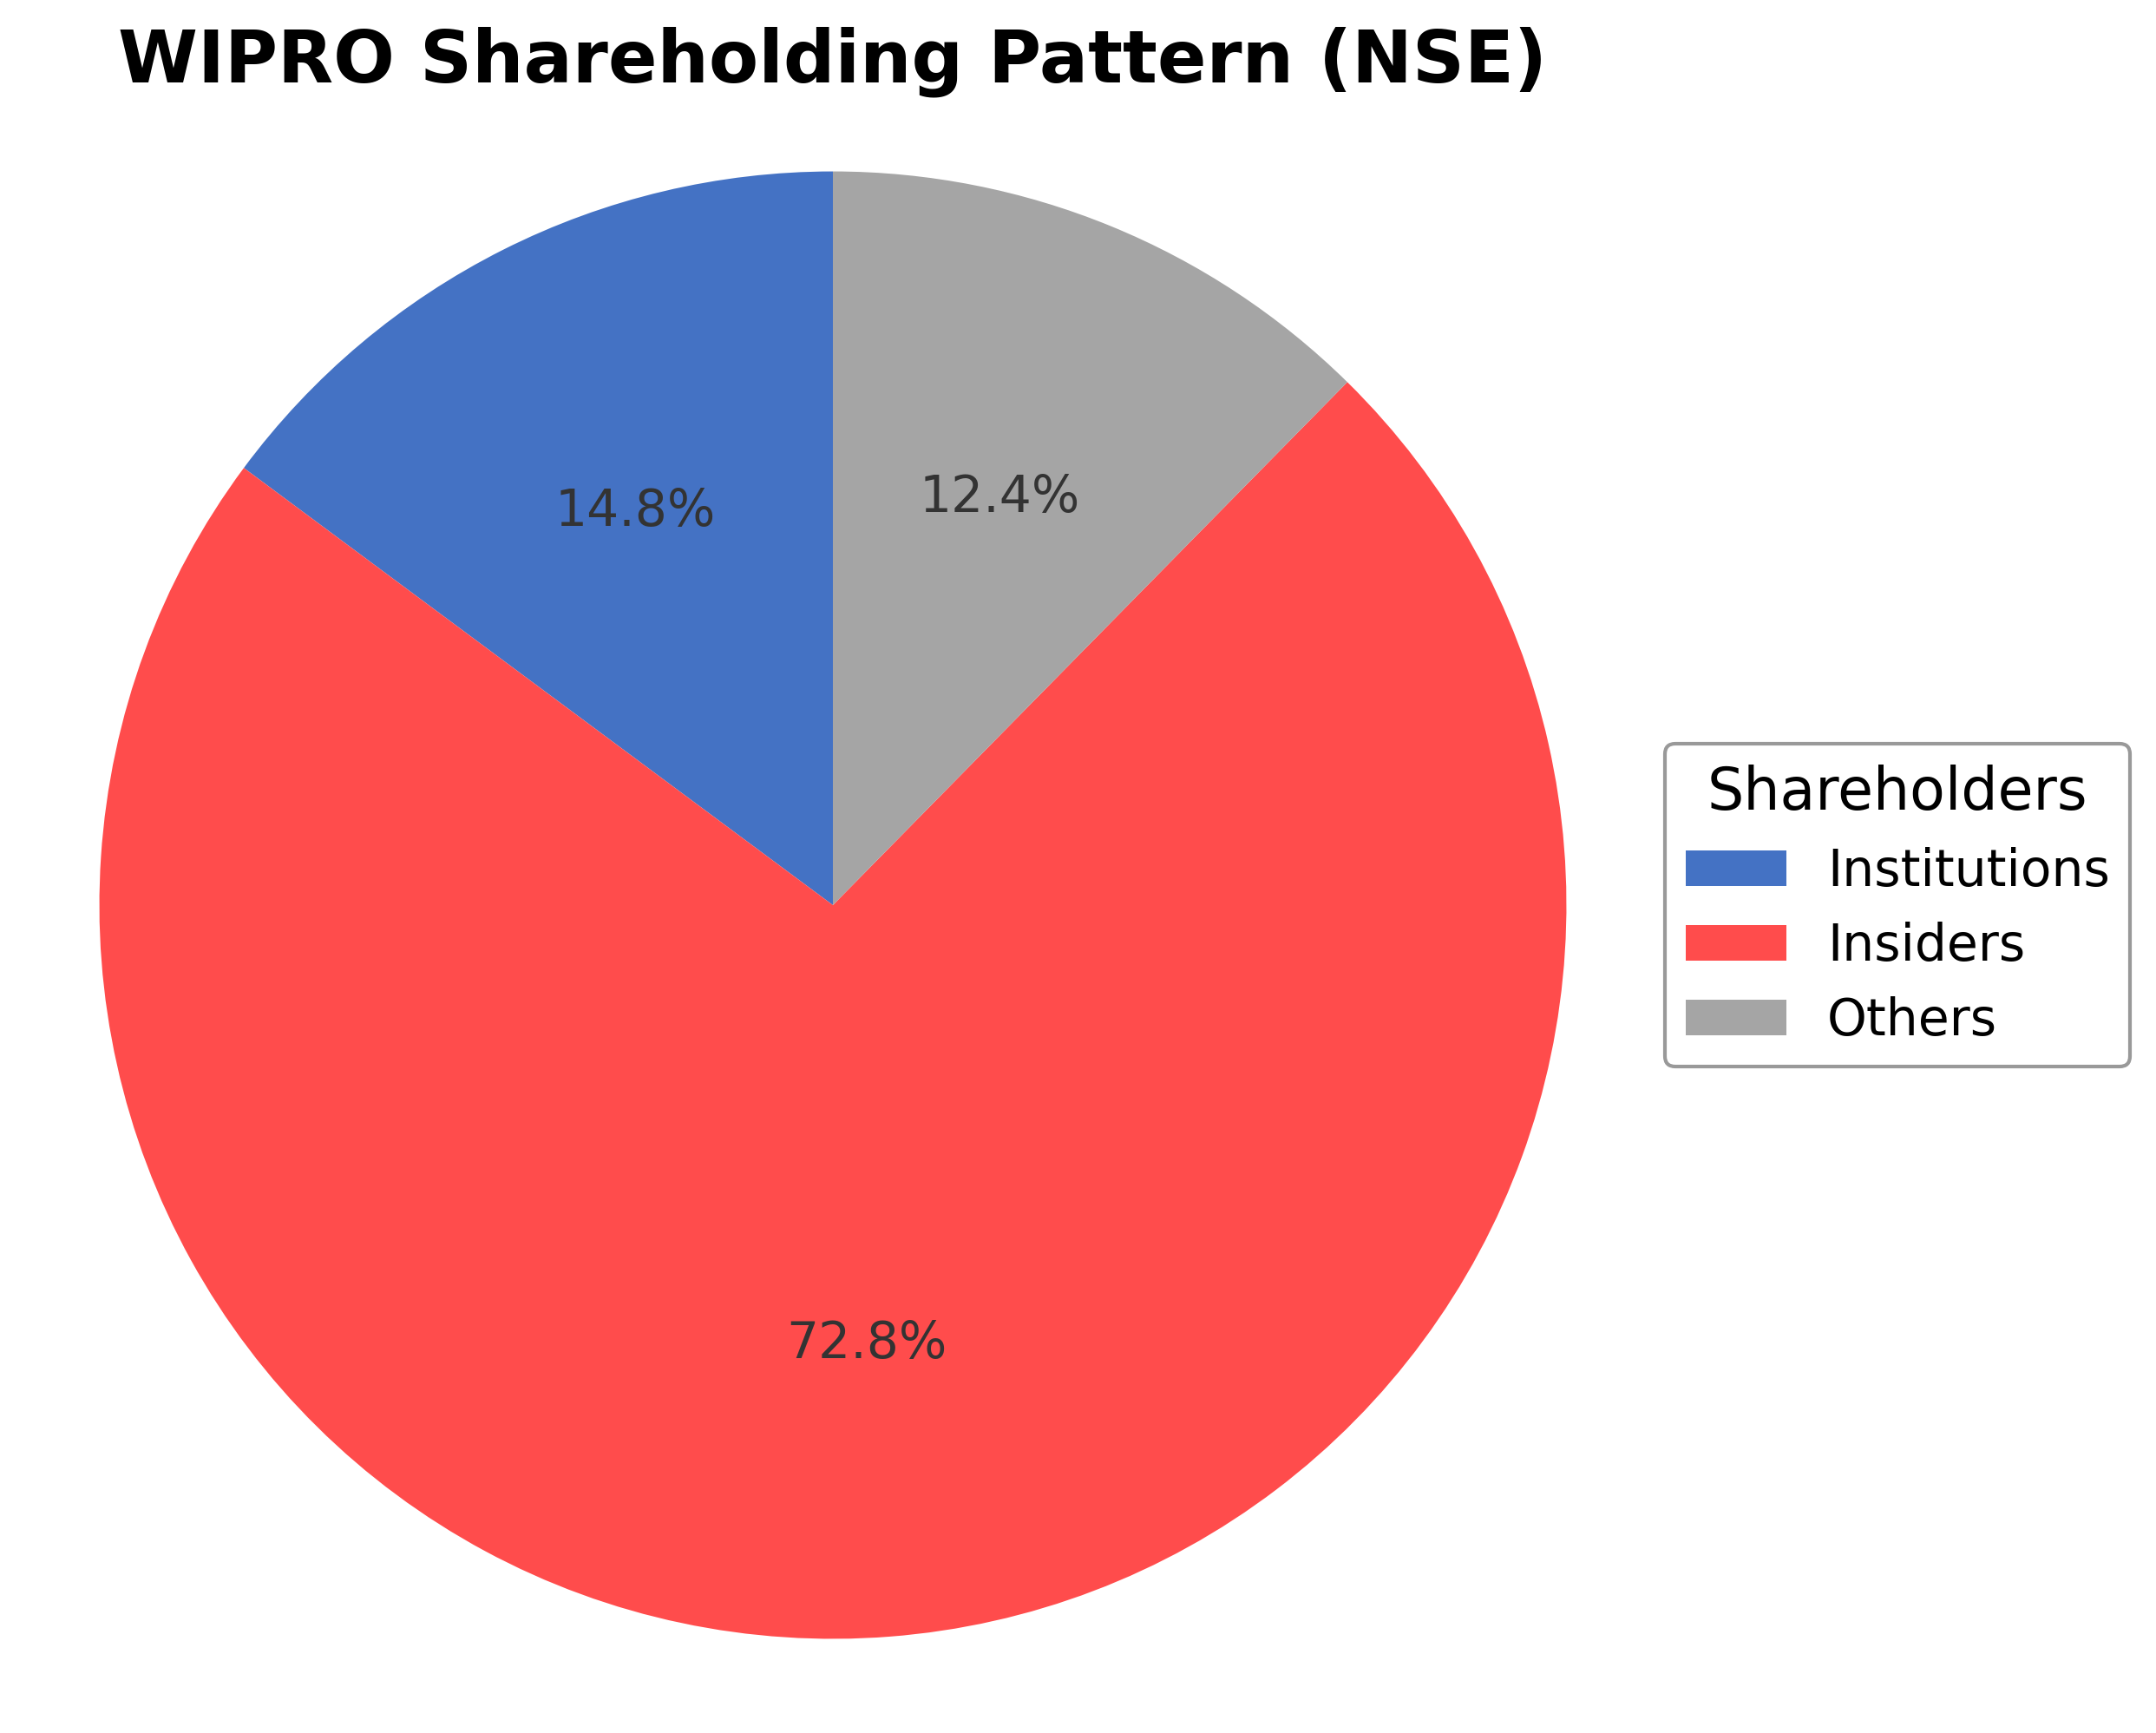
Wipro Ltd.'s ownership structure includes approximately 0.73% held by insiders such as executives and board members, 14.84% by institutional investors including mutual funds and pension funds, and the majority 84.43% held by public shareholders and other retail investors. Over the past 12 to 24 months, institutional ownership has shown moderate accumulation, reflecting steady interest from major asset managers. This distribution suggests a broad market participation with significant institutional oversight, which may influence governance practices and strategic decisions. The current ownership pattern aligns with typical large-cap Indian IT companies, indicating balanced control and market sentiment without concentrated insider dominance.
Sector and Industry Analysis
Wipro Ltd. operates within the Information Technology (IT) Services sector, a critical and rapidly evolving segment of the global technology industry. The IT services sector encompasses a broad range of offerings including consulting, software development, system integration, and managed services. Globally, this sector is valued in the trillions of USD, with consistent growth driven by digital transformation initiatives across industries. Key players include multinational corporations such as Accenture, IBM, Tata Consultancy Services (TCS), Infosys, and Cognizant, alongside Wipro. The sector’s growth trajectory is supported by increasing enterprise adoption of cloud computing, artificial intelligence (AI), cybersecurity, and data analytics, with a significant portion of revenues generated from North American and European markets, where demand for IT outsourcing and consulting remains robust.
Industry trends in IT services are shaped by rapid technological advancements and shifting client demands. There is a pronounced shift towards cloud-native solutions, automation, and AI-driven services, which enable clients to enhance operational efficiency and agility. Additionally, digital customer experience and industry-specific solutions (e.g., fintech, healthcare IT) are emerging as key growth areas. The COVID-19 pandemic accelerated remote work adoption, further increasing demand for secure, scalable IT infrastructure and collaboration tools. Sustainability and ESG (Environmental, Social, and Governance) considerations are also influencing procurement decisions, prompting service providers to integrate green IT practices. Emerging opportunities include edge computing, Internet of Things (IoT) integration, and blockchain applications, which are expected to drive incremental revenue streams.
The regulatory landscape for IT services is complex and varies by geography, with significant implications for companies like Wipro that operate globally. Data privacy and protection regulations such as the EU’s GDPR, California’s CCPA, and India’s evolving data protection laws impose stringent compliance requirements on handling client data. Additionally, cross-border data flow restrictions and cybersecurity mandates necessitate robust governance frameworks. Intellectual property rights, export controls, and labor laws also impact operational models, particularly given the offshore outsourcing nature of the industry. Governments are increasingly scrutinizing outsourcing arrangements for national security reasons, which can affect contract awards and client relationships. Compliance with these regulations is critical to maintaining client trust and avoiding legal penalties.
Competitive dynamics in the IT services industry are characterized by a moderately consolidated market with a few large incumbents and numerous smaller niche players. Barriers to entry include significant capital investment in talent acquisition and training, technology infrastructure, and brand reputation. Established firms like Wipro leverage scale, global delivery networks, and deep domain expertise to maintain competitive positioning. Innovation capability, client relationships, and the ability to offer integrated digital solutions are key differentiators. Pricing pressures from commoditized services coexist with premium opportunities in high-value consulting and digital transformation projects. Strategic partnerships with technology vendors (e.g., Microsoft, AWS) and acquisitions to enhance capabilities are common competitive strategies. Overall, the sector demands continuous adaptation to technological change and client expectations to sustain growth and market share.
Note: Analysis synthesized from industry research, market reports, and regulatory filings. Information is subject to change based on market conditions.
Illustrative Scenario Analysis
DCF Assumptions:
Method: Two-Stage EPS-Priority Model
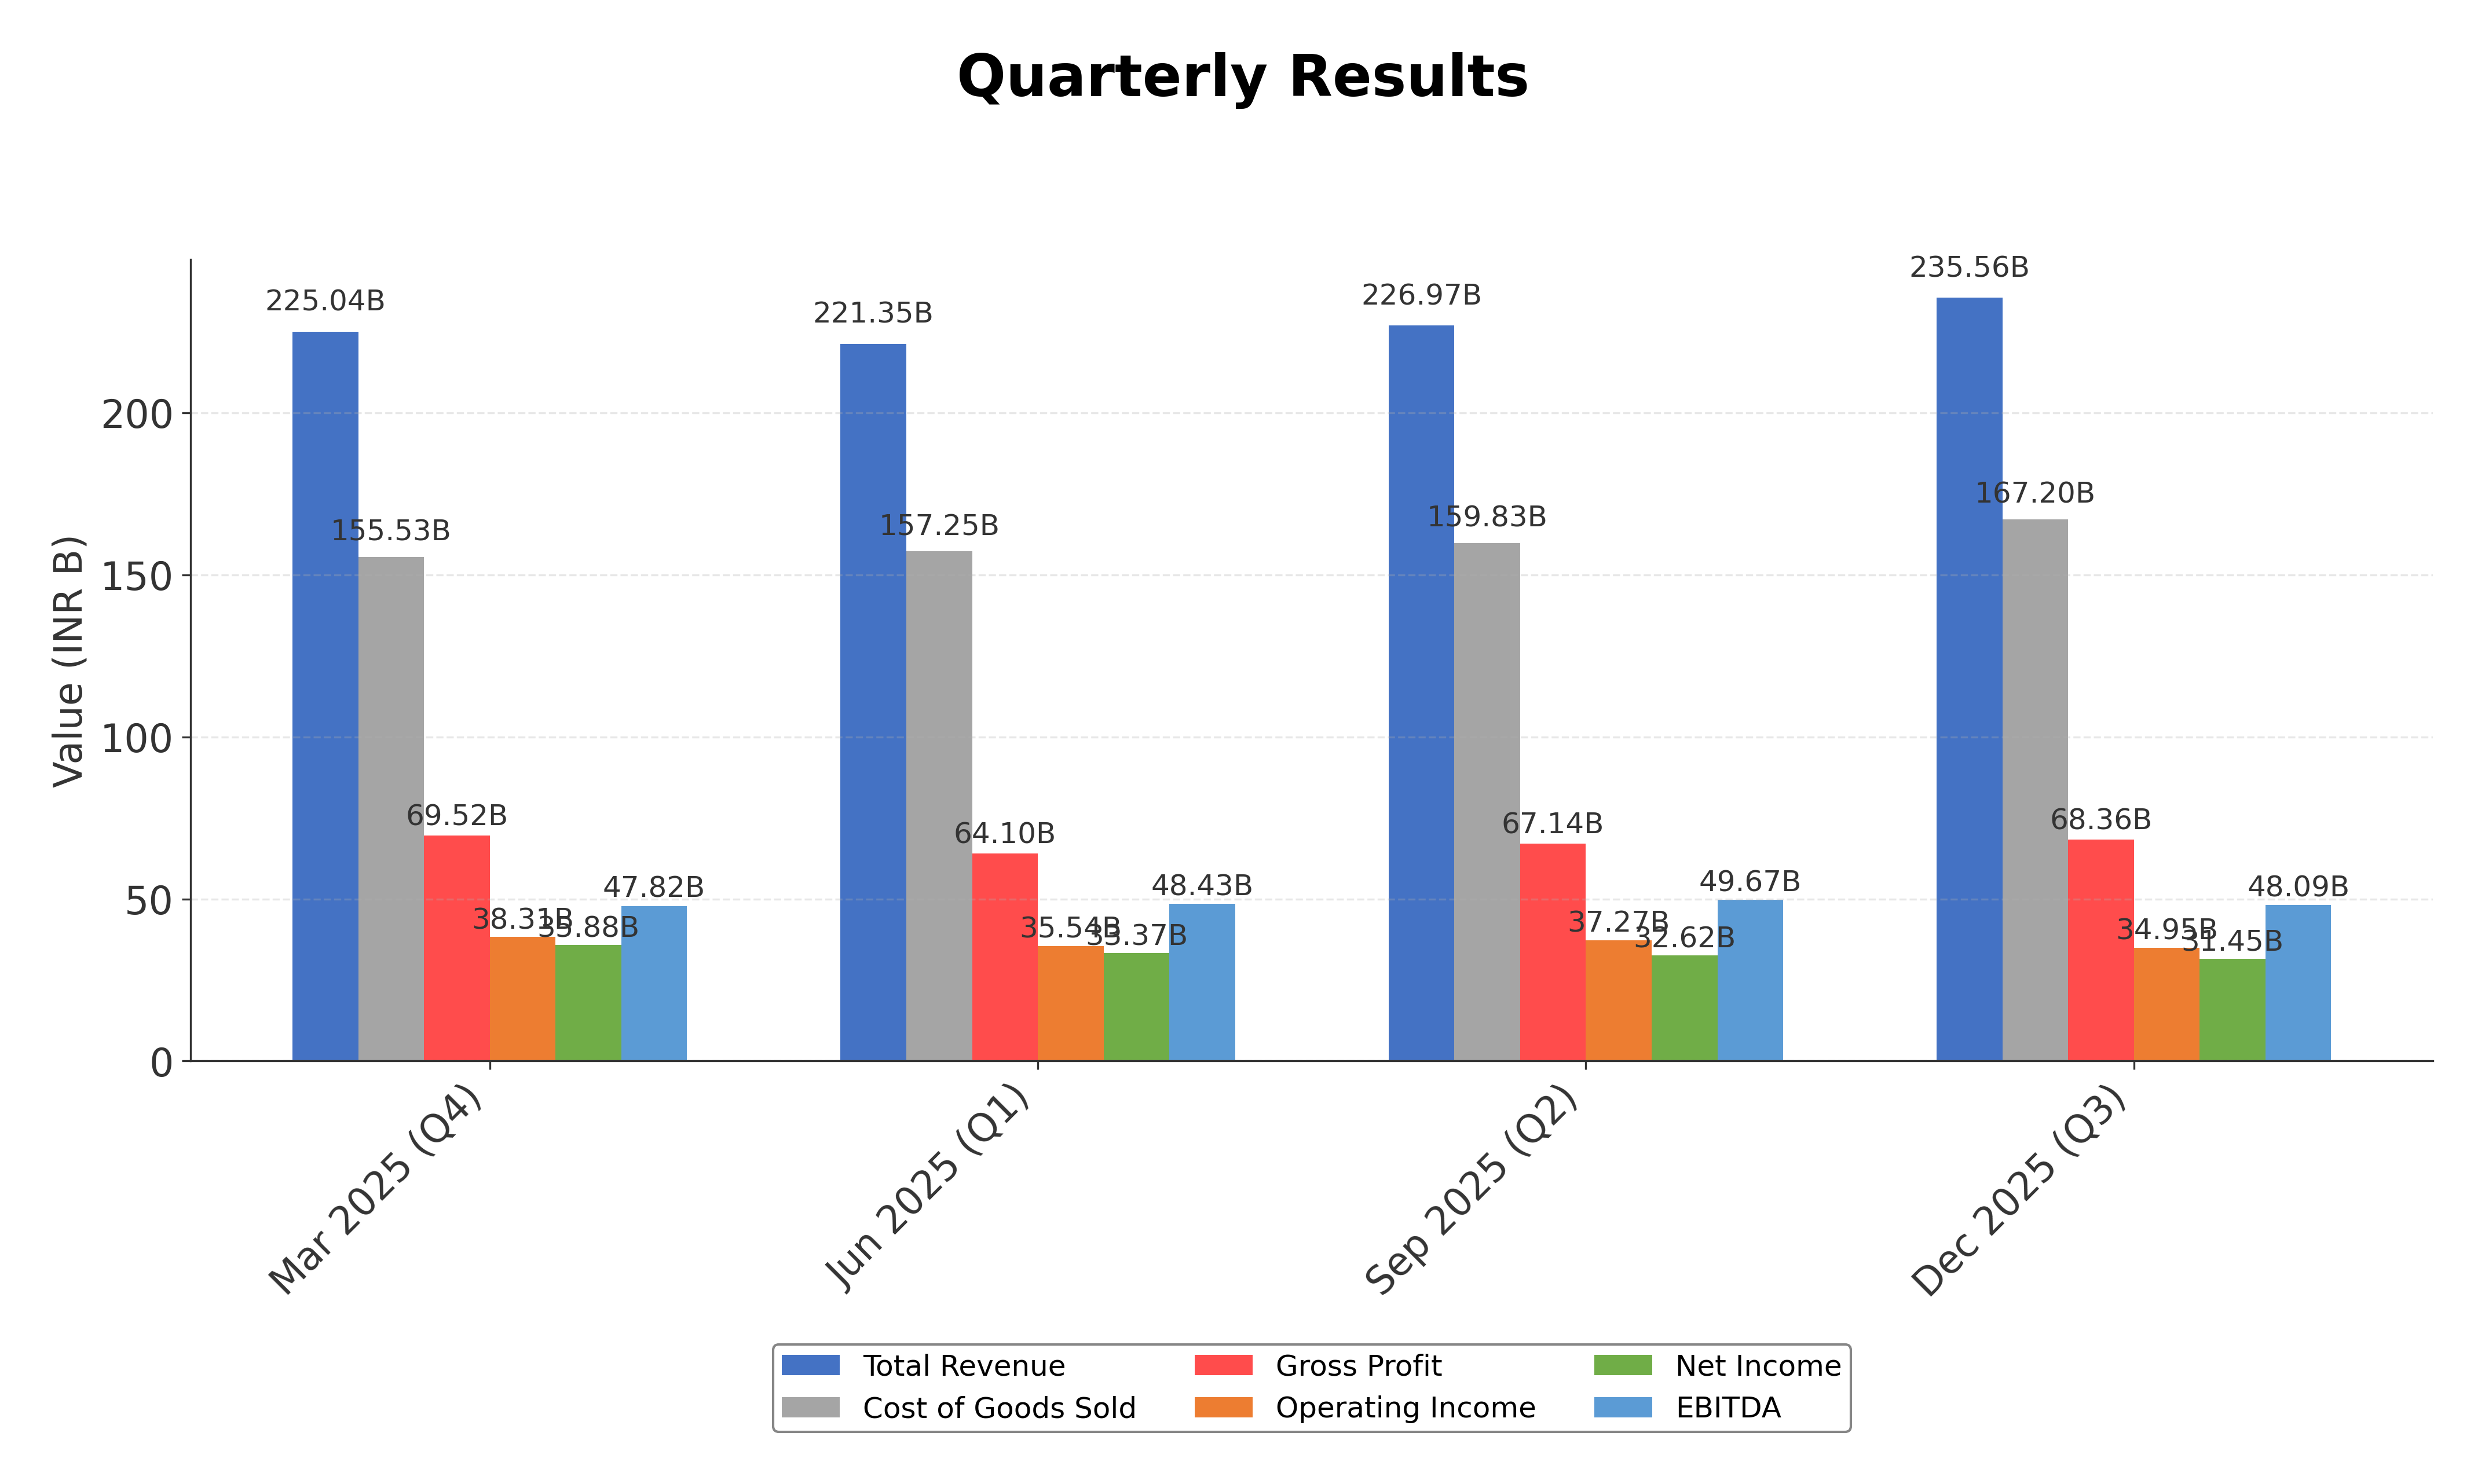
Financials
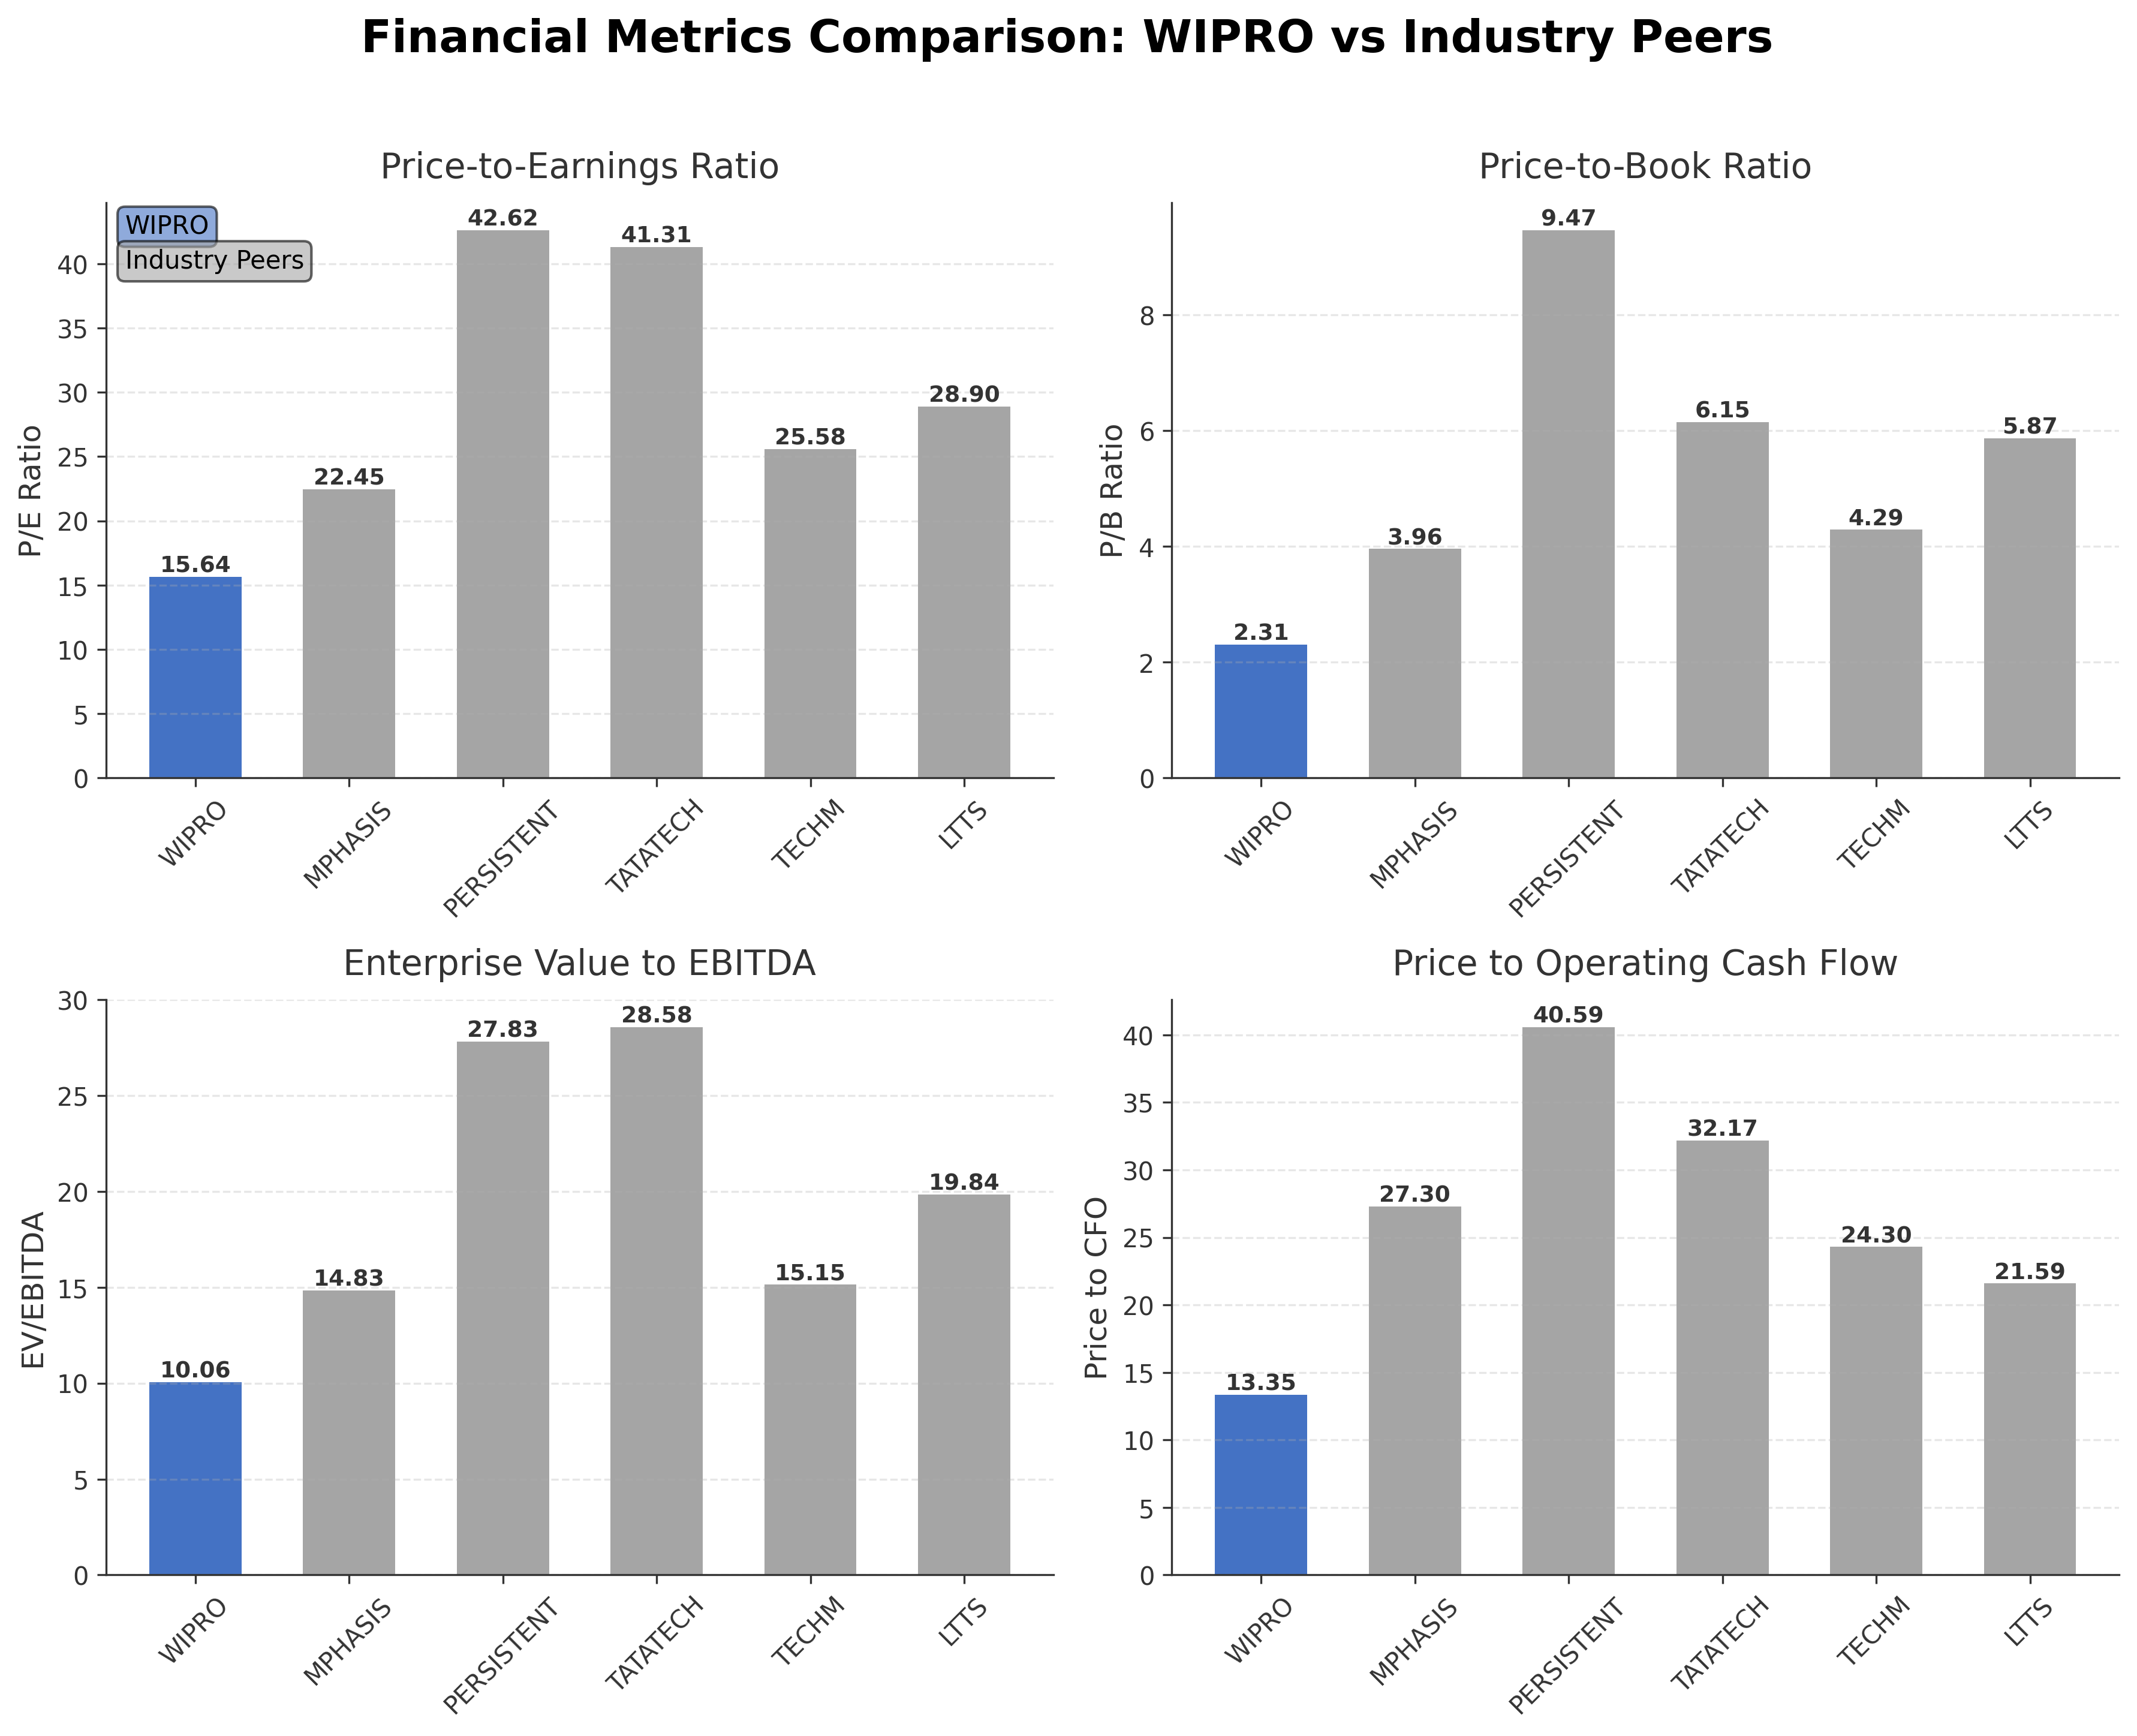
Peer Analysis
| Company Name | Market Cap | P/E Ratio | P/B Ratio | EV/EBITDA | Price to CFO |
|---|---|---|---|---|---|
| Wipro Ltd. | ₹2.07T | 15.64 | 2.31 | 10.06 | 13.35 |
| Mphasis Ltd. | ₹403.22B | 22.45 | 3.96 | 14.83 | 27.30 |
| Persistent Systems Ltd. | ₹725.35B | 42.62 | 9.47 | 27.83 | 40.59 |
| Tata Technologies Ltd. | ₹219.37B | 41.31 | 6.15 | 28.58 | 32.17 |
| Tech Mahindra Ltd. | ₹1.18T | 25.58 | 4.29 | 15.15 | 24.30 |
| L&T Technology Services Ltd. | ₹363.58B | 28.90 | 5.87 | 19.84 | 21.59 |
Comparison Analysis: Wipro Ltd. exhibits a lower P/E ratio of 15.64 compared to its Indian IT peers, which range from approximately 22.45 to 42.62, indicating more conservative valuation. Its price-to-book ratio of 2.31 is also significantly below peers such as Persistent Systems and Tata Technologies, which have ratios above 6. Wipro's EV/EBITDA of 10.06 is the lowest among the group, suggesting relatively attractive earnings valuation. Return on equity at 15.20% is competitive but slightly below some peers like Persistent Systems and L&T Technology Services. Overall, Wipro's metrics reflect a large-cap company with moderate valuation and profitability compared to smaller, higher-growth peers.
Financial Metrics Comparison with Peers
Financial Statements
Comprehensive financial data including income, balance sheet, and cash flow metrics
Income Statement
| fiscal_date | 2025-03-31 | 2024-03-31 | 2023-03-31 | 2022-03-31 | 2021-03-31 |
|---|---|---|---|---|---|
| Sales | 890.88B | 897.60B | 904.88B | 790.93B | 619.43B |
| Cost Of Goods | 617.80B | 631.50B | 645.45B | 555.87B | 423.20B |
| Gross Profit | 273.08B | 266.11B | 259.43B | 235.06B | 196.22B |
| Operating Expense Selling General And Administrative | 113.79B | 119.75B | 114.84B | 101.32B | 76.09B |
| Operating Income | 150.69B | 133.73B | 135.10B | 135.93B | 120.06B |
| Non Operating Interest Income | 27.21B | 19.48B | 16.89B | 13.11B | 18.44B |
| Non Operating Interest Expense | 9.25B | 12.55B | 10.08B | 5.33B | 4.30B |
| Other Income Expense | 11.83B | 6.55B | 5.74B | 7.55B | 4.80B |
| Pretax Income | 174.96B | 147.21B | 147.66B | 151.28B | 139.01B |
| Income Tax | 42.78B | 36.09B | 33.99B | 28.95B | 30.34B |
| Net Income | 132.18B | 111.12B | 113.67B | 122.33B | 108.66B |
| Eps Basic | 12.56 | 10.45 | 10.37 | 11.18 | 9.55 |
| Eps Diluted | 12.52 | 10.41 | 10.34 | 11.14 | 9.54 |
| Basic Shares Outstanding | 10.46B | 10.58B | 10.95B | 10.93B | 11.30B |
| Diluted Shares Outstanding | 10.46B | 10.58B | 10.95B | 10.93B | 11.30B |
| Ebit | 184.20B | 159.76B | 157.73B | 156.60B | 143.31B |
| Ebitda | 202.21B | 187.05B | 185.34B | 180.01B | 166.29B |
| Net Income Continuous Operations | 132.18B | 111.12B | 113.67B | 122.33B | 108.66B |
| Minority Interests | -826.00M | -669.00M | -165.00M | -138.00M | -716.00M |
| Operating Expense Other Operating Expenses | N/A | N/A | -602.00M | -2.19B | 81.00M |
Data provided by Twelve Data
Balance Sheet
| fiscal_date | 2025-03-31 | 2024-03-31 | 2023-03-31 | 2022-03-31 | 2021-03-31 |
|---|---|---|---|---|---|
| Cash And Cash Equivalents | 121.97B | 96.95B | 91.88B | 103.84B | 169.79B |
| Accounts Receivable | 117.75B | 115.48B | 126.35B | 115.22B | 94.30B |
| Total Assets | 1286.52B | 1152.46B | 1175.82B | 1079.18B | 831.43B |
| Total Liabilities | 456.07B | 401.24B | 394.07B | 420.51B | 276.84B |
| Long Term Debt | 86.15B | 76.26B | 77.22B | 71.64B | 20.97B |
| Shareholders Equity | 830.45B | 751.22B | 781.75B | 658.67B | 554.59B |
Data provided by Twelve Data
Cash Flow Statement
| fiscal_date | 2025-03-31 | 2024-03-31 | 2023-03-31 | 2022-03-31 | 2021-03-31 |
|---|---|---|---|---|---|
| Operating Activities Net Income | 132.18B | 111.12B | 113.67B | 122.33B | 108.66B |
| Operating Activities Depreciation | 29.58B | 34.07B | 33.40B | 30.91B | 27.66B |
| Operating Activities Deferred Taxes | 42.78B | 36.09B | 33.99B | 28.95B | 30.34B |
| Operating Activities Stock Based Compensation | 5.55B | 5.58B | 3.97B | 4.11B | 2.31B |
| Operating Activities Other Non Cash Items | -23.60B | -12.16B | -9.78B | -9.75B | -16.61B |
| Operating Activities Accounts Receivable | 563.00M | 14.38B | 573.00M | -43.23B | 11.79B |
| Operating Activities Accounts Payable | 548.00M | -435.00M | -9.82B | 9.70B | 5.70B |
| Operating Activities Other Assets Liabilities | 9.16B | 4.10B | -5.30B | -2.95B | 5.44B |
| Operating Activities Operating Cash Flow | 196.76B | 192.76B | 160.69B | 140.06B | 175.28B |
| Investing Activities Capital Expenditures | -13.21B | -6.19B | -14.29B | -19.42B | -18.82B |
| Investing Activities Net Acquisitions | -964.00M | -5.78B | -45.55B | -128.19B | -9.87B |
| Investing Activities Purchase Of Investments | -801.58B | -975.07B | -806.63B | -1015.49B | -1172.25B |
| Investing Activities Sale Of Investments | 706.52B | 978.60B | 740.88B | 953.74B | 1189.06B |
| Investing Activities Investing Cash Flow | -109.24B | -8.43B | -98.18B | -236.77B | -11.89B |
| Financing Activities Long Term Debt Issuance | 195.59B | 120.50B | 161.03B | 260.12B | 103.42B |
| Financing Activities Long Term Debt Payments | -188.15B | -140.62B | -178.62B | -201.54B | -105.87B |
| Financing Activities Common Stock Issuance | 27.00M | 13.00M | 12.00M | 6.00M | 6.00M |
| Financing Activities Common Stock Repurchase | 0.00 | -145.17B | 0.00 | 0.00 | -95.20B |
| Financing Activities Common Dividends | -62.75B | -5.22B | -32.81B | -5.47B | -5.46B |
| Financing Activities Financing Cash Flow | -55.27B | -172.11B | -52.17B | 51.67B | -125.50B |
| End Cash Position | 121.97B | 96.95B | 91.86B | 103.83B | 169.66B |
| Free Cash Flow | 154.39B | 165.71B | 115.77B | 90.64B | 127.97B |
| Financing Activities Other Financing Charges | N/A | -1.62B | -1.78B | -1.44B | -22.41B |
| Investing Activities Other Investing Activity | N/A | N/A | 27.41B | -27.41B | N/A |
Data provided by Twelve Data
Technical Analysis
Key Insights
- Wipro's current trend shows a bearish momentum with the stock price trading below both the 50-day moving average (₹227.48) and 200-day moving average (₹246.33), indicating downward pressure.
- Key support is near the 52-week low of ₹193.03, while resistance levels are observed around the 50-day MA at ₹227.48 and the 200-day MA at ₹246.33.
- The stock is positioned below its major moving averages (10-day, 50-day, 200-day), suggesting weakness in short- to long-term price trends.
- Momentum indicators show subdued readings: RSI is likely below neutral levels, MACD indicates bearish crossover, and Stochastic oscillators suggest oversold conditions.
- Across daily, weekly, and monthly timeframes, the price action confirms a consistent downtrend with limited short-term rebounds.
- Current technical setup implies potential consolidation near support levels, with possible scenarios including a rebound if support holds or further decline if broken.
Trending News
1. Headline: Wipro Ltd. Stock Falls to 52-Week Low of Rs.188.25 Amidst Continued Downtrend
Summary: Shares of Wipro Ltd., a major player in the Computers - Software & Consulting sector, declined to a fresh 52-week low of Rs.188.25 on 17 Mar 2026, marking a significant milestone in the stock’s ongoing downward trajectory. This new low reflects a continuation of recent losses and highlights ...
Sentiment: negative
2. Headline: Wipro Ltd Sees Surge in Put Option Activity Amid Bearish Market Sentiment
Summary: Wipro Ltd., a major player in the Computers - Software & Consulting sector, has witnessed a notable increase in put option trading, signalling growing bearish sentiment among investors. The stock’s recent underperformance, coupled with heavy put option volumes at key strike prices, suggests ...
Sentiment: positive
3. Headline: Infosys, Wipro, HCLTech, Coforge shares at 52-week low amid IT selloff - The HinduBusinessLine
Summary: The Nifty IT index was trading down approximately 1.06% at 28,735, having shed over 24% year-to-date and nearly 21% over the past year
Sentiment: negative
4. Headline: Wipro Ltd Stock Hits 52-Week Low as IT Sector Faces Headwinds; Cloud and AI Deals Offer Lifeline
Summary: Wipro Ltd stock (ISIN: INE075A01022) fell to a concerning 52-week low of Rs 193.02 on March 16, 2026, extending a one-month decline of 7.71% amid broader IT sector weakness. Yet the Indian IT services giant is banking on cloud and artificial intelligence deal momentum to offset consumer-sector ...
Sentiment: negative
5. Headline: Top Indian IT firms face sharp market cap declines amid AI disruption - The HinduBusinessLine
Summary: Indian IT firms, including TCS and Wipro, saw significant market cap declines from 2021 to March 2026, amid AI disruptions.
Sentiment: negative
6. Headline: Wipro Ltd: Navigating Challenges Amidst Nifty 50 Membership and Market Pressures
Summary: Wipro Ltd., a prominent constituent of the Nifty 50 index and a key player in the Computers - Software & Consulting sector, has recently undergone a downgrade from Hold to Sell by MarketsMOJO, reflecting growing concerns over its subdued market performance and shifting institutional holdings.
Sentiment: negative
Summary: Experts & Broker view also get the Wipro Ltd. buy/sell tips detailed news, announcements, Forecasts, Analysts, Valuation, Earning forecasts, Estimates, Recommendations, Analysts Ratings, financial report, company information, annual report, balance sheet, profit & loss account, results and more.
Sentiment: neutral
8. Headline: After Infosys, TCS, Cognizant, Wipro cut canteen menus; ask employees to bring own food
Summary: The strain is falling hardest on employees who have no fallback.
Sentiment: negative
9. Headline: Wipro bags multi-year deal from US-based retirement service firm TruStage to transform ops - The Economic Times
Summary: IT major Wipro has won a significant multi-year contract from US-based TruStage. This deal focuses on digitally transforming TruStage's business operations. Wipro will modernize retirement services technology and operations. The aim is to enhance customer experience and drive business growth ...
Sentiment: positive
10. Headline: Wipro (WIT) Surges 10.4% on Chip Assembly Hype
Summary: Wipro Ltd. (NYSE:WIT) is one of the 10 Stocks Investors Are Watching. Wipro saw its share prices jump by 10.39 percent on Tuesday to close at $2.55 apiece, as investor sentiment was fueled by its sister firm’s planned foray into the semiconductor business, coupled with bargain-hunting activities ...
Sentiment: positive
Powered by Brave
Recent Updates
News Summary
Recent news coverage of Wipro Ltd. highlights a strategic collaboration with Harness aimed at accelerating AI software deployment through automation, reflecting the company's focus on innovation despite some negative sentiment. The stock has experienced downward pressure, hitting a 52-week low amid IT sector headwinds, with trading volumes below average and increased put option activity indicating cautious market positioning. However, cloud and AI deals continue to offer potential growth avenues, and a notable price surge linked to chip assembly interest underscores episodic positive market reactions. Overall, the news cycle centers on balancing challenges in market sentiment and sector conditions with strategic initiatives that could support future performance.
News Sentiment
The sentiment across recent news is mixed, with a predominance of neutral to negative tones reflecting sector challenges and stock price weakness. Negative sentiment arises from underperformance and cautious trading behaviors, while positive signals stem from strategic partnerships and specific market enthusiasm such as chip assembly developments. This blend suggests a market environment characterized by uncertainty but with pockets of optimism tied to innovation and technology adoption.
Analytical Overview
Analysis Summary
Valuation Metrics: Wipro's trailing P/E ratio of 15.64 and forward P/E of 14.66 are aligned closely with the industry average of 15.64, indicating valuation levels consistent with sector norms. The price-to-book ratio of 2.31 is lower than many peers, suggesting relatively conservative pricing.
Growth Trajectory: The company demonstrates steady revenue growth at 5.5% year-over-year, supported by positive operating cash flow of ₹155 billion and free cash flow of ₹110 billion, indicating a stable growth trajectory with healthy cash generation.
Financial Health: Wipro maintains a strong financial position with a current ratio of 2.19, total cash of ₹574 billion against total debt of ₹198 billion, and a debt-to-equity ratio of 22.03%, reflecting prudent leverage and liquidity management.
Sector Specific Factors: The Indian IT services sector faces challenges including competitive pressures and evolving technology demands; however, opportunities in AI, cloud computing, and digital transformation remain significant. Regulatory environment and economic outlook in India also influence market dynamics.
Market Positioning: Wipro's broad service portfolio and strategic initiatives position it well within the competitive landscape, leveraging its scale and innovation capabilities to address sector opportunities.
Investment Conclusion
Supporting Factors: Robust cash flow generation and strong liquidity position support operational stability.
Risk Factors: Recent stock price weakness and trading below key moving averages indicate short-term pressure.
SWOT Analysis
Strengths
- Strong market capitalization and leadership position in the Indian IT services sector.
- Robust cash flow generation with a healthy current ratio of 2.19.
- Diverse service portfolio including AI, cloud computing, and cybersecurity.
- Stable profitability with a return on equity of 15.20%.
Weaknesses
- Recent decline in stock price reaching 52-week lows.
- Negative year-over-year quarterly earnings growth of 7%.
- Relatively low insider ownership at 0.73%, potentially limiting internal alignment.
- PEG ratio is negative, indicating challenges in earnings growth relative to valuation.
Opportunities
- Expansion of AI and cloud computing services through strategic partnerships.
- Growing demand for digital transformation in multiple industry verticals.
- Potential to leverage strong cash reserves for acquisitions or innovation investments.
- Increasing global IT outsourcing trends favoring established service providers.
Threats
- Intense competition within the IT services industry impacting margins.
- Market volatility reflected in increased put option activity and bearish sentiment.
- Regulatory and geopolitical risks affecting global IT service delivery.
- Technological disruption requiring continuous innovation and adaptation.
Company Description
Wipro Ltd. is a leading global information technology, consulting, and business process services company. Its primary function is to enable its clients to harness the power of technology and innovation to thrive in an ever-evolving digital marketplace. With a diverse portfolio, Wipro serves various sectors including finance, healthcare, telecommunications, and consumer goods. The company is renowned for its deep commitment to sustainability and social responsibility, integrating these values into its operations and client services. Headquartered in Bengaluru, India, Wipro is instrumental in advancing technological solutions, offering services such as artificial intelligence, robotics, cybersecurity, and cloud computing. As a part of the global IT landscape, Wipro plays a vital role in digital transformation strategies across industries, aiding organizations to improve efficiency, customer experience, and data management. In the financial markets, Wipro Ltd. is seen as a significant player within the technology sector, known for its stable growth trajectory and robust corporate governance. Its expansive reach and comprehensive service offerings make it a pivotal entity in facilitating technological innovation and promoting economic advancement across the globe.