
Western Carriers India Ltd (WCIL)
Stock Analysis Report
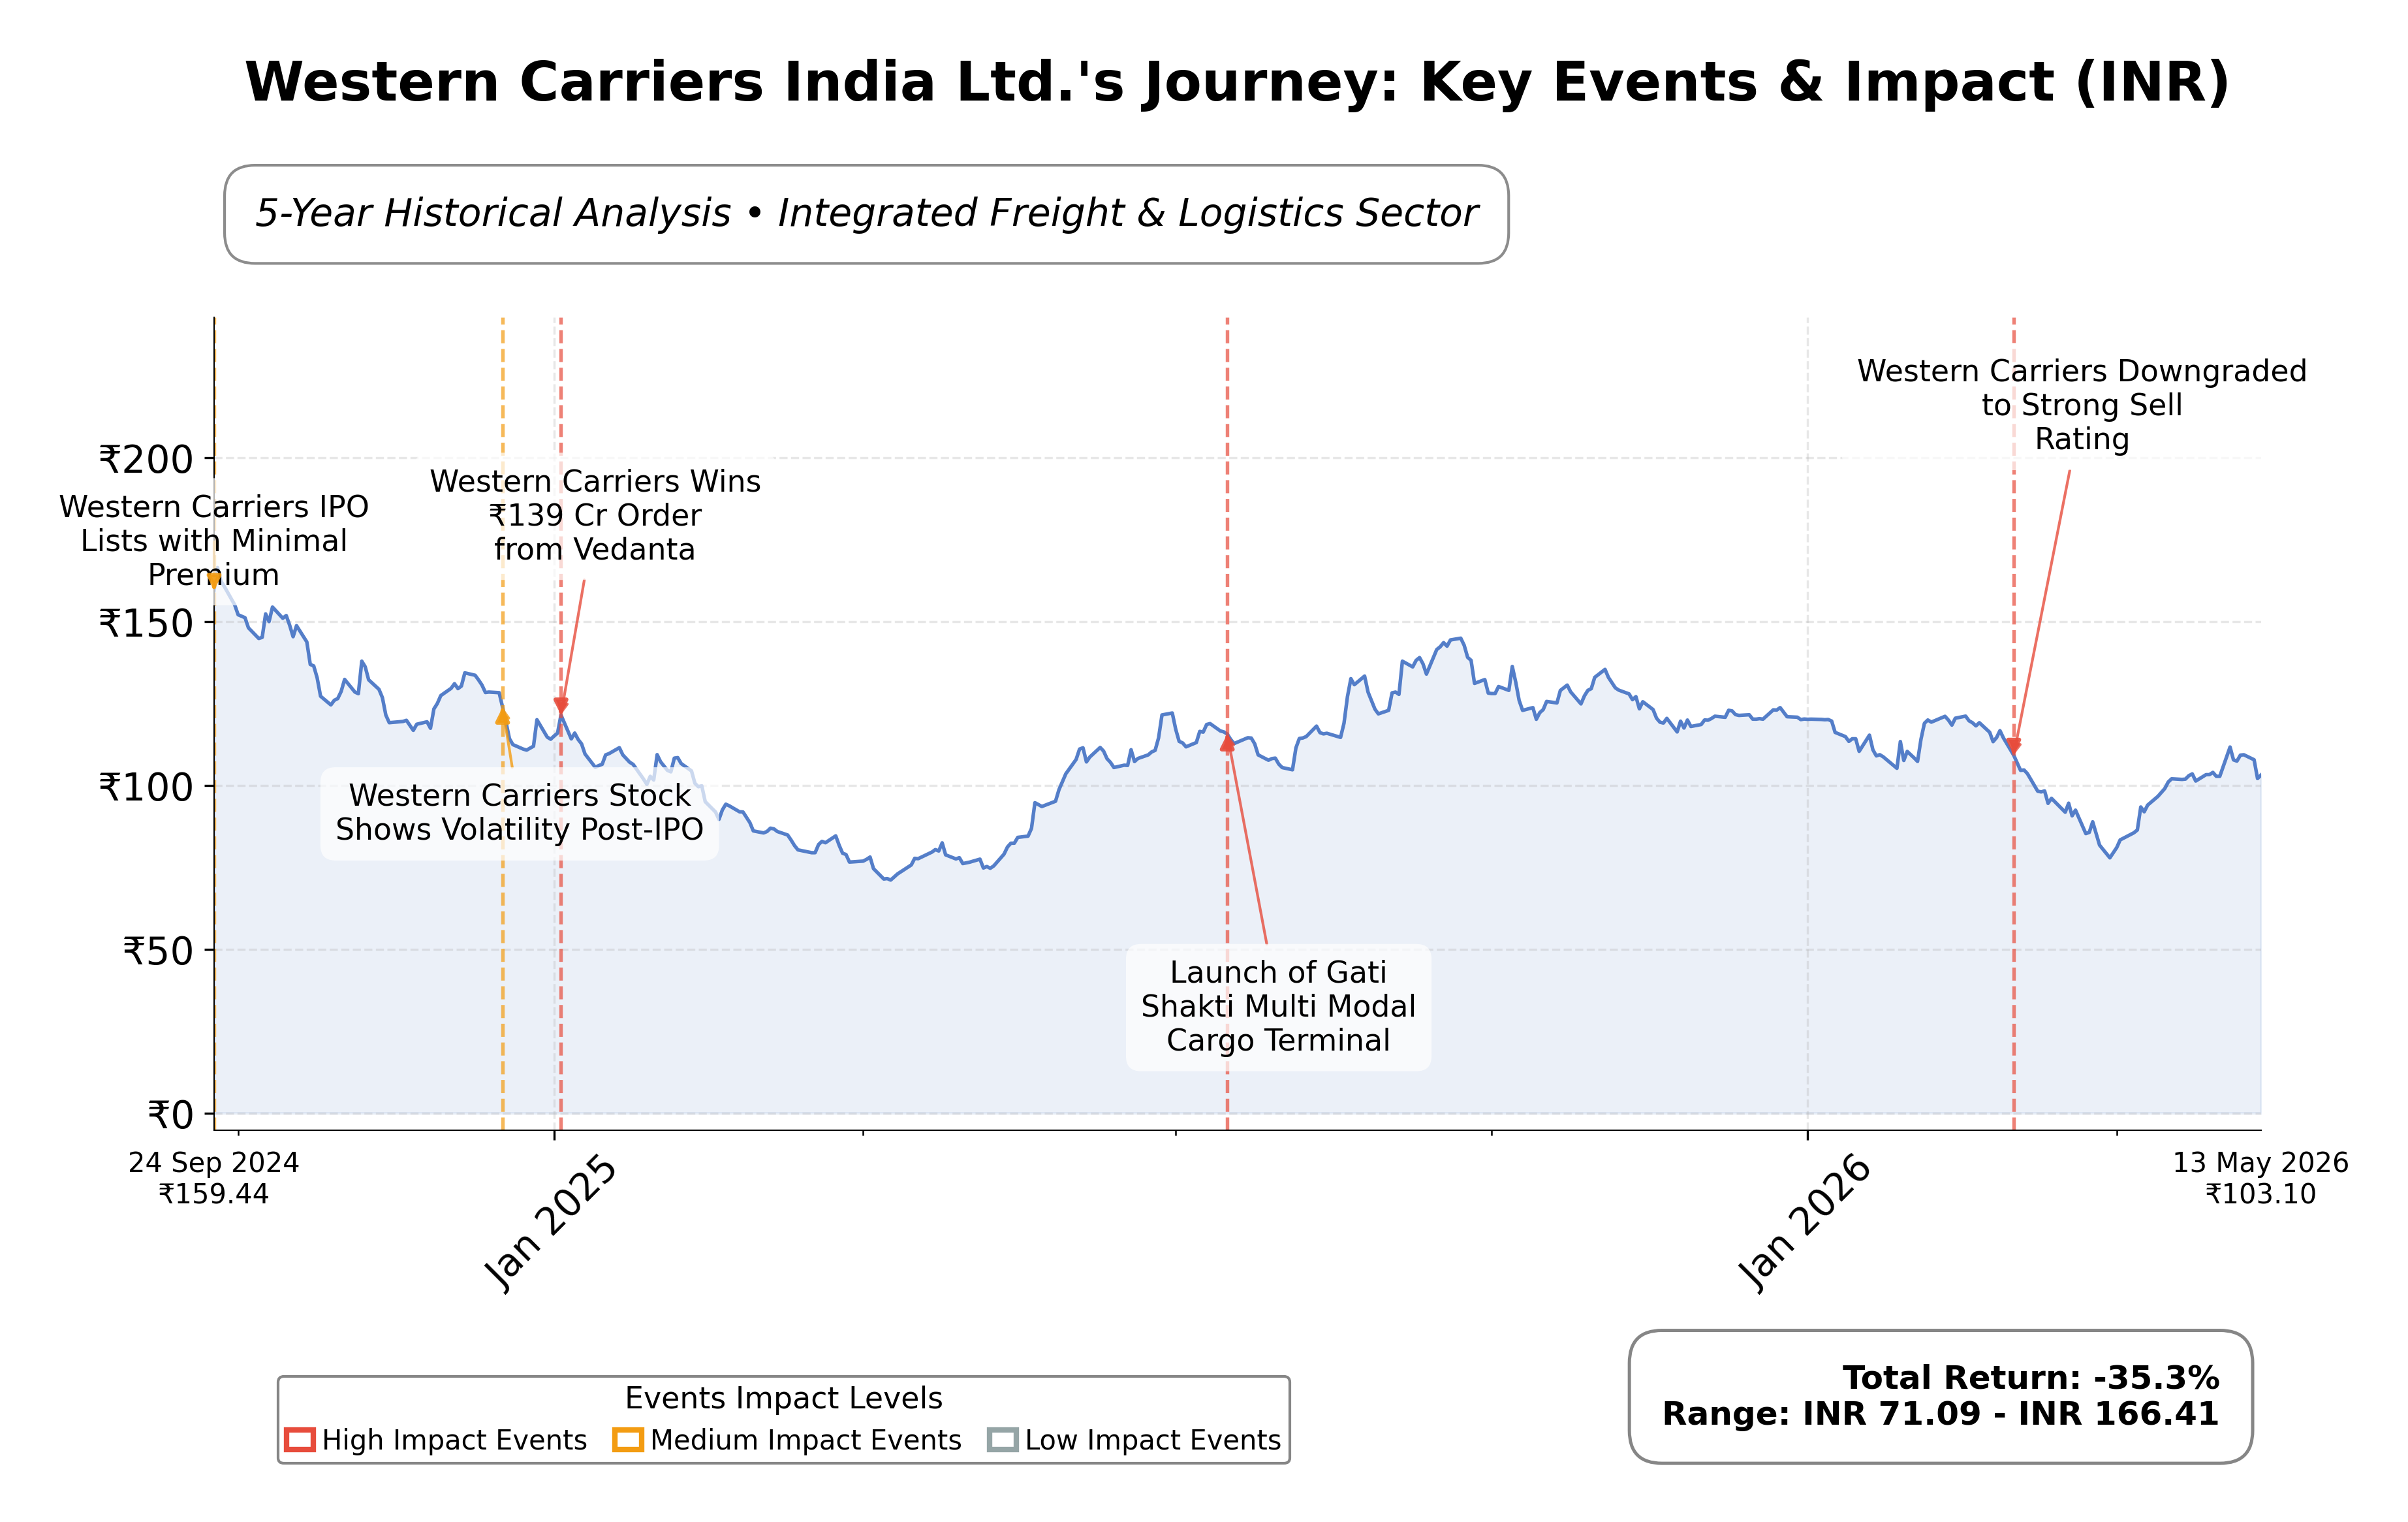
Stock Journey
Key Positives and Key Risks
Pros
- Market capitalization of ₹10.51 billion reflects a stable micro-cap presence in the logistics sector.
- Strong current ratio of 3.28 indicates robust short-term liquidity and financial stability.
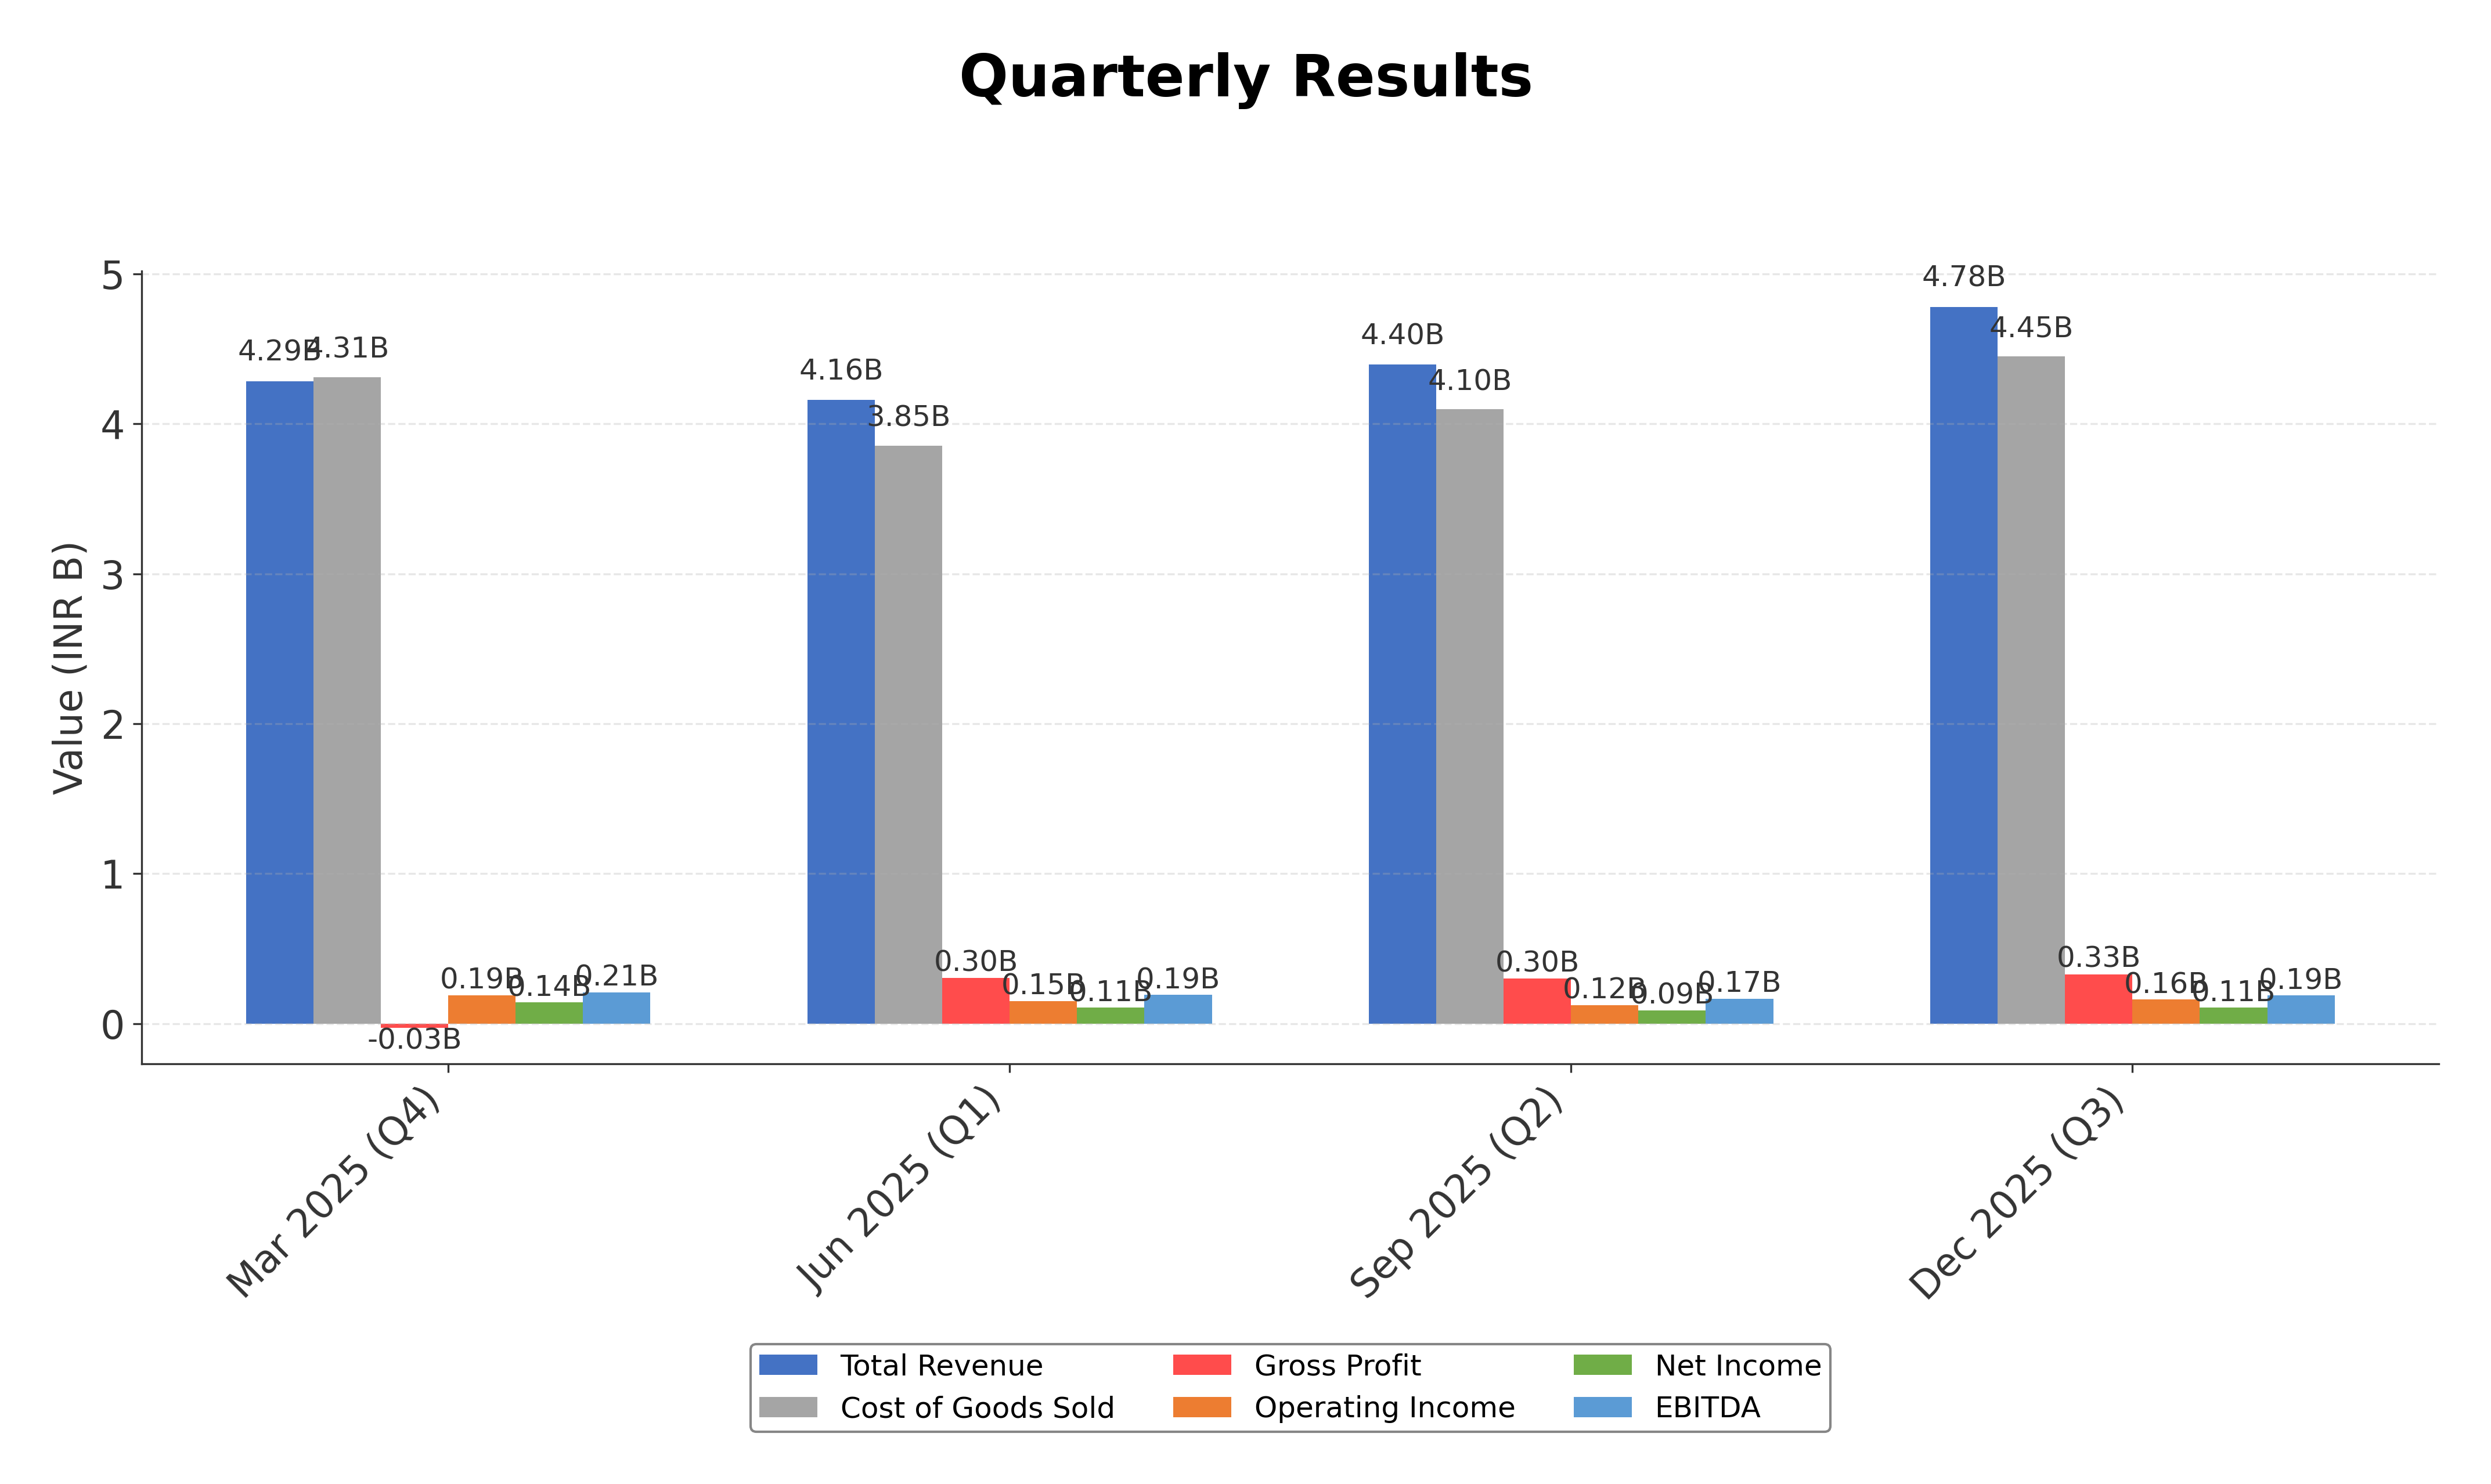
- Revenue growth of 7.9% in the latest quarter demonstrates steady operational expansion.
Cons
- Negative operating cash flow of INR -92.31 million raises concerns about core cash generation.
- Negative PEG ratio (-5.35) suggests challenges in sustaining earnings growth relative to price.
- Delay in fleet expansion due to unutilized IPO funds (₹913 million) impacts capital deployment.
Disclosure: This information is for general awareness and does not constitute investment advice
Report Summary
Western Carriers India Ltd. operates primarily in the integrated freight and logistics sector, providing comprehensive cargo transportation services across India. Listed on the NSE under the industrials sector, the company specializes in road, rail, and sea logistics, serving diverse industries such as automotive, consumer goods, electronics, and pharmaceuticals. Its market positioning is supported by a broad network and technology-driven logistics management systems, enabling efficient and reliable goods movement within the domestic market.
Financially, Western Carriers reported trailing twelve months (TTM) revenue of approximately INR 17.62 billion, with a gross margin of 6.9%, operating margin of 3.35%, and net profit margin of 2.53%. The company’s return on equity (ROE) stands at 7.87%, return on assets (ROA) at 5.9%, and return on invested capital (ROIC) is reflected by an enterprise value to EBITDA ratio of 12.5. These figures indicate modest profitability and operational efficiency within a competitive industry environment.
Valuation metrics show a trailing price-to-earnings (P/E) ratio of 24.1 and a price-to-book (P/B) ratio of 1.25, with an enterprise value to revenue multiple of 0.605. The market capitalization is approximately INR 10.5 billion. The stock trades at INR 101.59, within a 52-week range of INR 77.02 to INR 147.29, currently positioned closer to the mid-range. The PEG ratio is negative at -5.35, reflecting challenges in earnings growth relative to price.
Key strengths include a strong current ratio of 3.28, indicating solid short-term liquidity, and a relatively low debt-to-equity ratio of 22.78%, suggesting manageable leverage. However, the company faces risks from regulatory scrutiny, competitive pressures in the logistics sector, and delays in fleet expansion due to ongoing electric vehicle technology reviews. Recent strategic actions include scheduled earnings calls and board meetings, with attention on IPO proceeds utilization and fleet modernization plans.
Technically, the stock shows mixed signals with price currently above the 50-day moving average but below the 200-day average, indicating potential consolidation. Momentum indicators reflect neutral to slightly bearish trends, with upcoming earnings announcements likely to influence market sentiment. Overall, the data suggests a cautious stance with attention to upcoming financial disclosures and operational updates.
Company and Industry Overview
Company Basics
Price Performance
Company Size
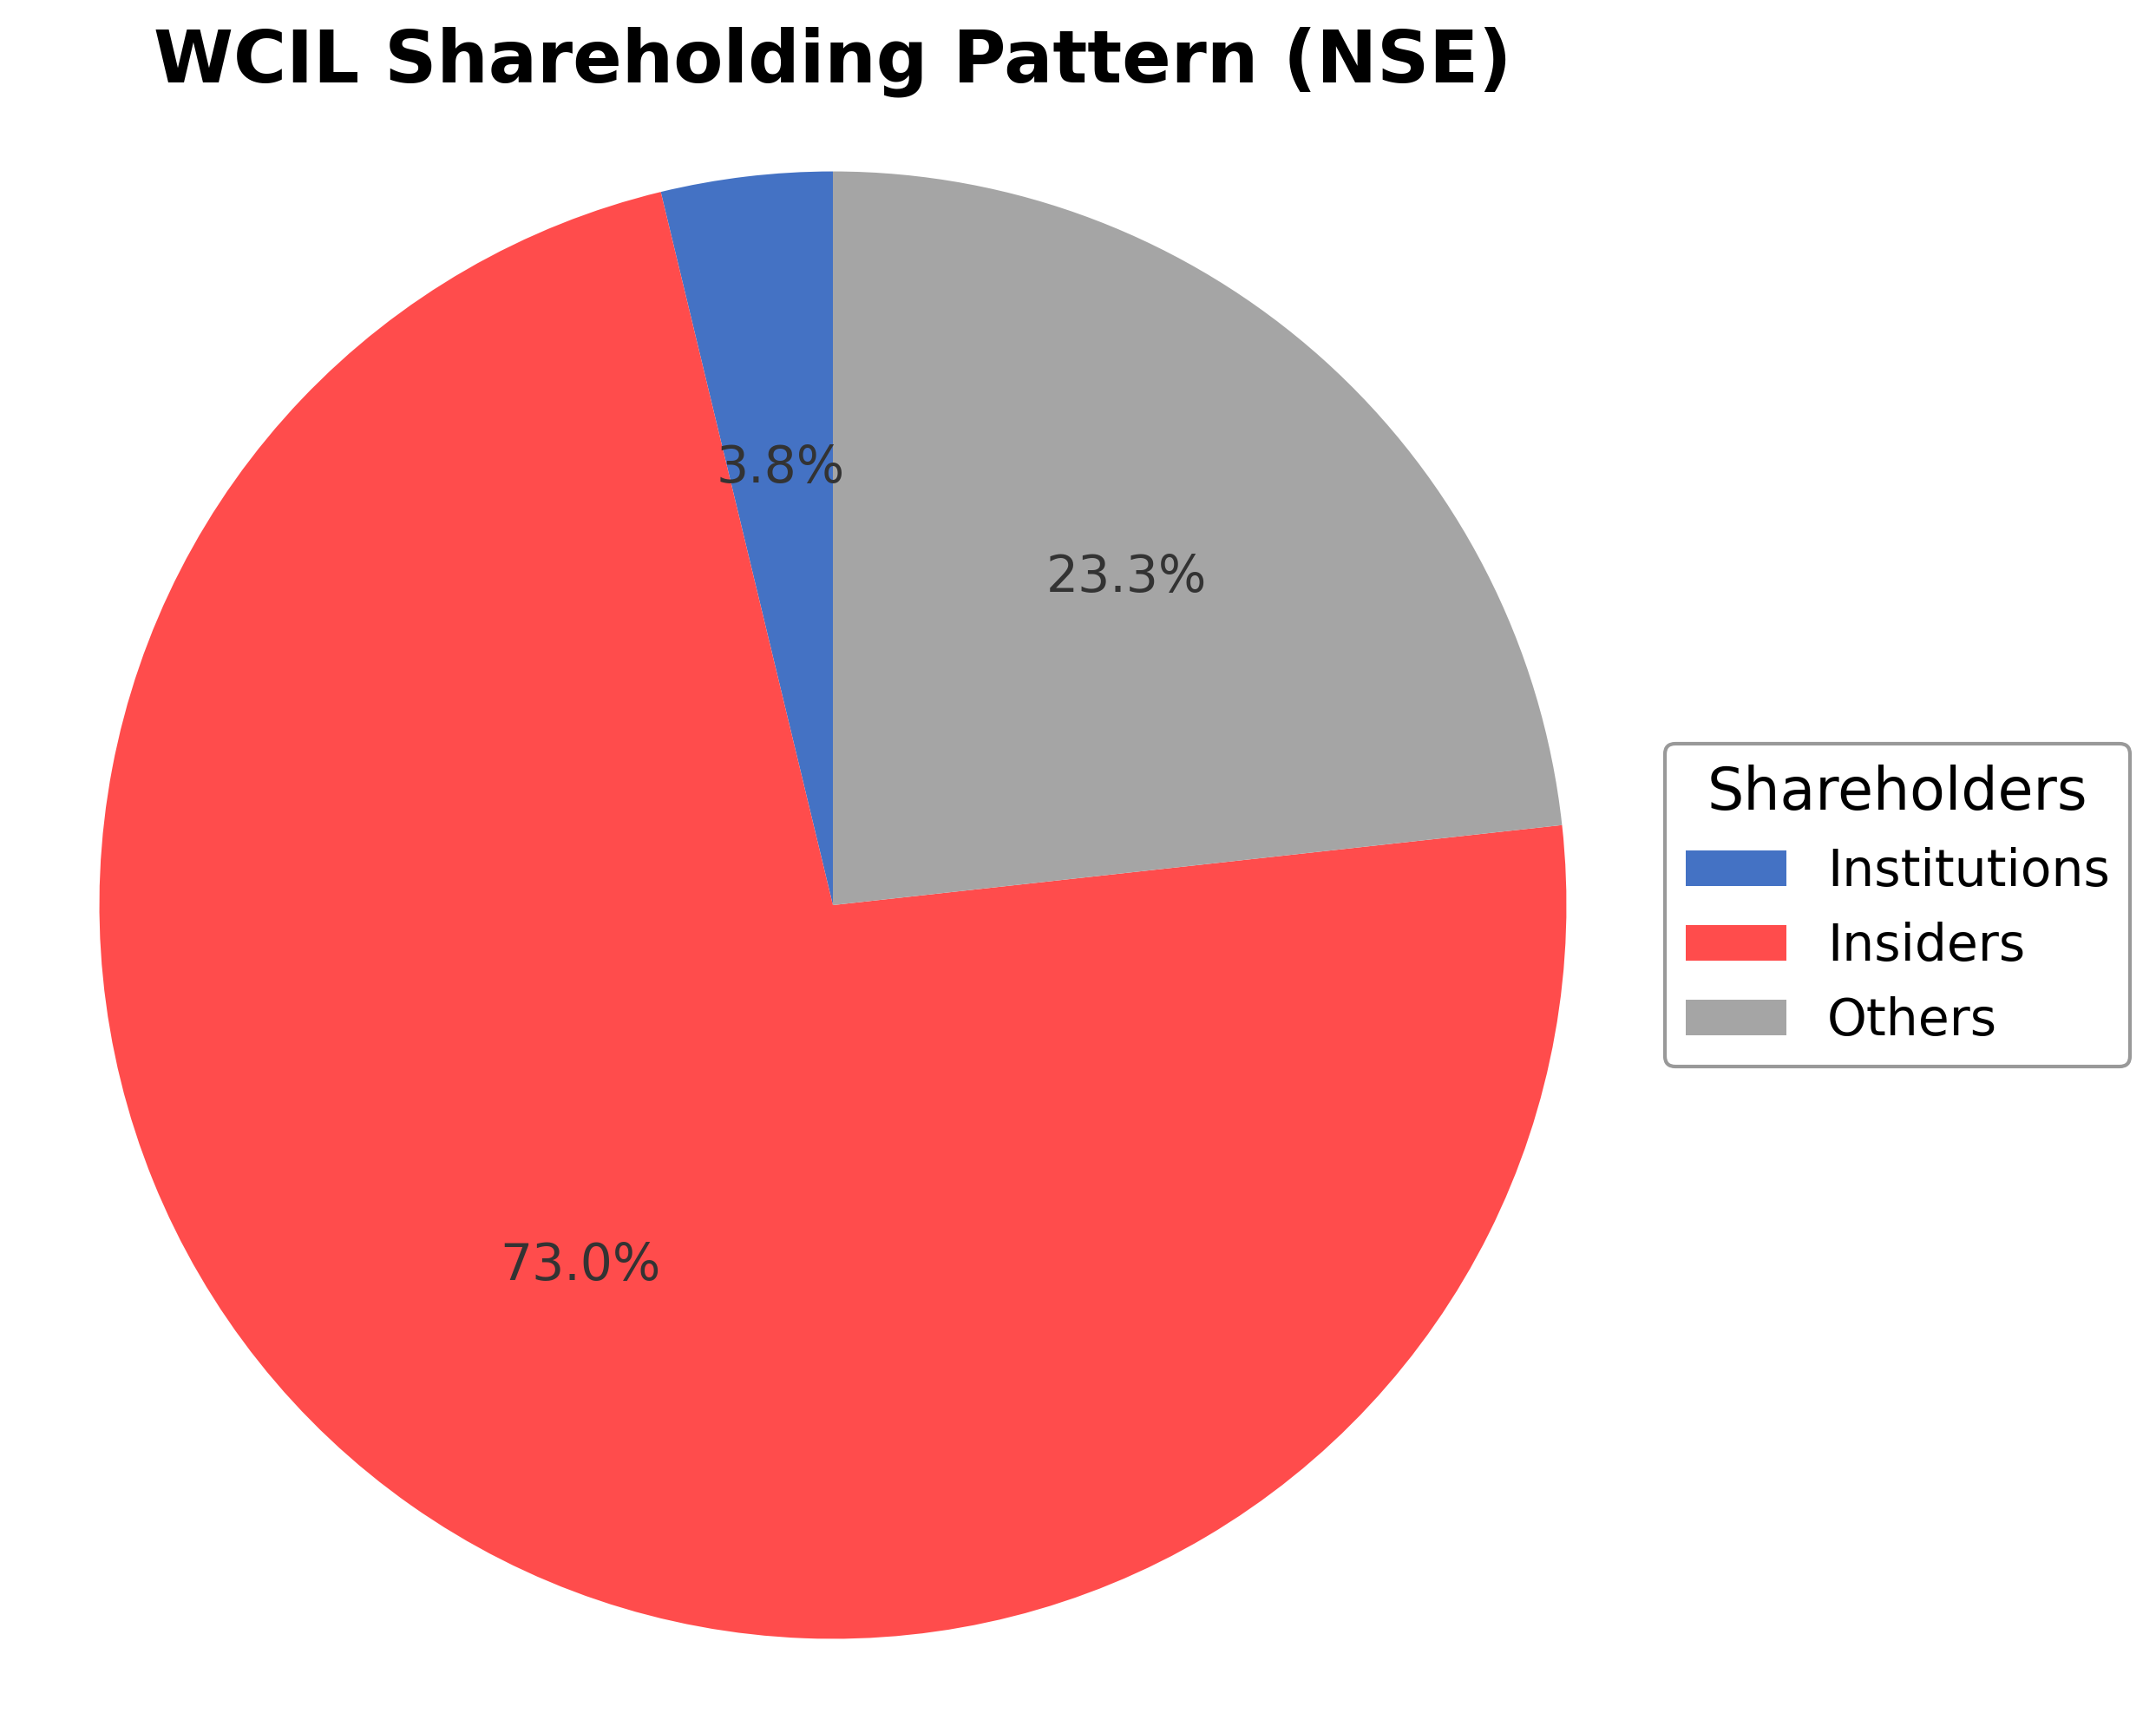
Shareholding Pattern
Sector and Industry Analysis
The Indian logistics sector is a critical component of the country's economy, valued at over $200 billion and projected to grow at a CAGR of around 10-12% over the next few years. It encompasses diverse segments including road, rail, air, and maritime transport, warehousing, and supply chain management. Major players include large integrated logistics firms and asset-light third-party logistics providers, with companies like Western Carriers India Ltd operating in multi-modal logistics with a focus on rail and customized supply chain solutions.
Industry trends highlight a shift towards multi-modal and technology-driven logistics services to enhance efficiency and reduce costs. There is increasing adoption of asset-light models and fourth-party logistics (4PL) services that offer end-to-end supply chain management, leveraging rail and river transport alongside road networks. Competitive dynamics are shaped by the need for scale, network reach, and technological integration, with barriers to entry including capital intensity, regulatory compliance, and the complexity of managing multi-modal operations.
The regulatory environment is evolving with initiatives such as the Goods and Services Tax (GST) simplifying interstate logistics and promoting seamless movement of goods. Government policies encouraging infrastructure development, including dedicated freight corridors and logistics parks, are expected to improve sector efficiency. Compliance with safety, environmental, and labor regulations remains critical, influencing operational costs and service standards in the logistics industry.
Note: Analysis synthesized from industry research, market reports, and regulatory filings. Information is subject to change based on market conditions.
Financial Ratios Dashboard
Illustrative Scenario Analysis
DCF Assumptions:
Method: Two-Stage EPS-Priority Model
Financials
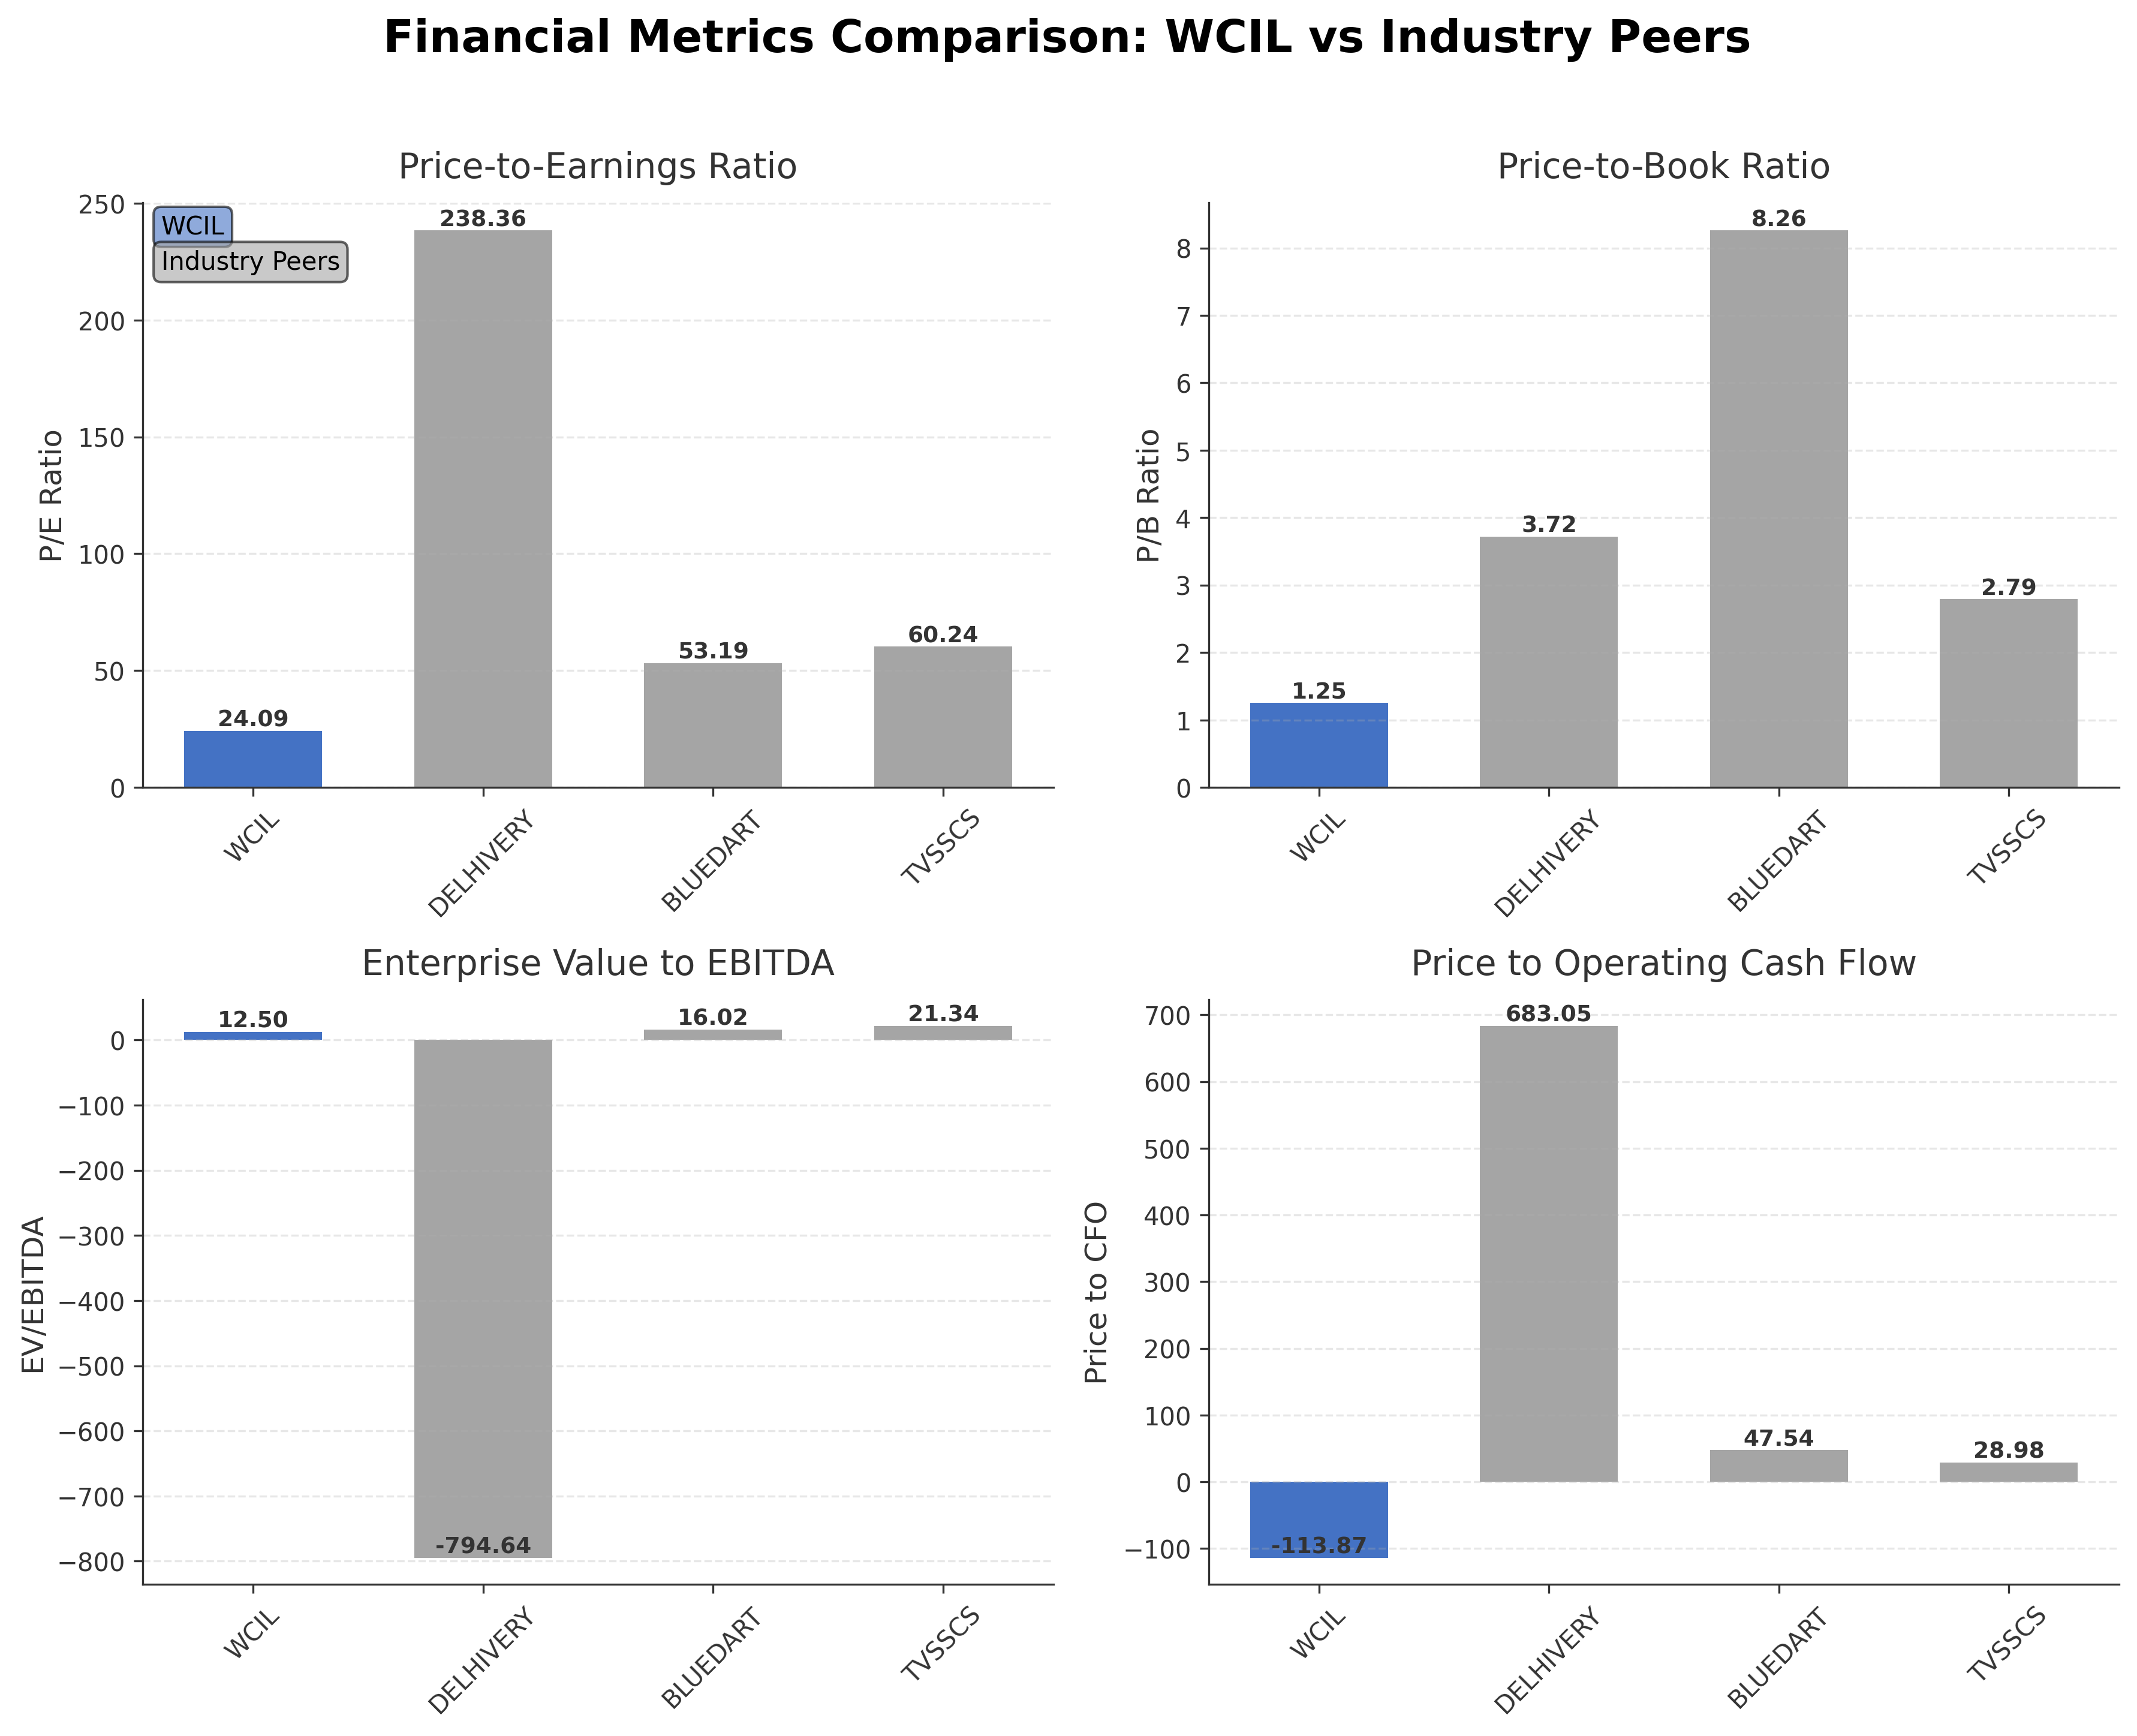
Peer Analysis
| Company Name | Market Cap | P/E Ratio | P/B Ratio | EV/EBITDA | Price to CFO |
|---|---|---|---|---|---|
| Western Carriers India Ltd. | ₹10.51B | 24.09 | 1.25 | 12.50 | -113.87 |
| Delhivery Ltd. | ₹358.70B | 238.36 | 3.72 | -794.64 | 683.05 |
| Blue Dart Express Ltd. | ₹134.82B | 53.19 | 8.26 | 16.02 | 47.54 |
| TVS Supply Chain Solutions Limited | ₹55.28B | 60.24 | 2.79 | 21.34 | 28.98 |
Comparison Analysis: Western Carriers India Ltd. trades at significantly lower valuation multiples compared to its larger peers such as Delhivery, Blue Dart Express, and TVS Supply Chain Solutions. Its P/E ratio of 24.09 is substantially below the peer range of 53.19 to 238.36, indicating a more conservative market pricing relative to earnings. The P/B ratio at 1.25 also suggests a more modest valuation compared to peers with ratios between 2.79 and 8.26. The EV/EBITDA multiple of 12.5 is lower than peers, reflecting potentially better operational efficiency or lower growth expectations. However, the negative price to CFO ratio contrasts with positive figures for peers, highlighting cash flow challenges. Overall, Western Carriers presents a lower valuation profile with moderate profitability relative to its industry competitors.
Financial Metrics Comparison with Peers
Financial Statements
Comprehensive financial data including income, balance sheet, and cash flow metrics
Income Statement
| fiscal_date | 2025-03-31 | 2024-03-31 | 2023-03-31 | 2022-03-31 | 2021-03-31 |
|---|---|---|---|---|---|
| Sales | 17.26B | 16.86B | 16.33B | 14.71B | 11.10B |
| Cost Of Goods | 16.03B | 15.05B | 15.06B | 13.60B | 10.28B |
| Gross Profit | 1.23B | 1.81B | 1.27B | 1.11B | 818.76M |
| Operating Expense Selling General And Administrative | 138.38M | 122.97M | 95.36M | 80.56M | 65.01M |
| Operating Expense Other Operating Expenses | 88.01M | 562.12M | 74.78M | 61.02M | 43.92M |
| Operating Income | 967.59M | 1.25B | 1.07B | 950.13M | 694.90M |
| Non Operating Interest Income | 116.29M | 46.42M | 31.46M | 35.07M | 23.64M |
| Non Operating Interest Expense | 201.45M | 221.78M | 144.65M | 131.67M | 124.92M |
| Pretax Income | 878.35M | 1.08B | 960.68M | 833.67M | 600.29M |
| Income Tax | 227.05M | 280.58M | 245.03M | 222.38M | 155.01M |
| Net Income | 651.30M | 803.47M | 715.65M | 611.29M | 445.28M |
| Eps Basic | 7.16 | 7.88 | 7.02 | 6.00 | 4.37 |
| Eps Diluted | 7.16 | 7.88 | 7.02 | 6.00 | 4.37 |
| Basic Shares Outstanding | 91.00M | 101.96M | 101.96M | 101.96M | 101.96M |
| Diluted Shares Outstanding | 91.00M | 101.96M | 101.96M | 101.96M | 101.96M |
| Ebit | 1.08B | 1.31B | 1.11B | 965.34M | 725.21M |
| Ebitda | 1.31B | 1.52B | 1.25B | 1.10B | 836.56M |
| Net Income Continuous Operations | 878.35M | 1.08B | 960.68M | 833.67M | 600.29M |
| Preferred Stock Dividends | 0.00 | 0.00 | 0.00 | 0.00 | 0.00 |
| Minority Interests | N/A | 0.00 | 0.00 | 0.00 | -10.00K |
Source: Financial statements and regulatory filings
Balance Sheet
| fiscal_date | 2025-03-31 | 2024-03-31 | 2023-03-31 | 2022-03-31 | 2021-03-31 |
|---|---|---|---|---|---|
| Cash And Cash Equivalents | 48.46M | 18.79M | 14.46M | 25.45M | 34.30M |
| Accounts Receivable | 6.20B | 5.25B | 3.90B | 3.11B | 2.52B |
| Total Assets | 11.04B | 7.54B | 6.04B | 4.90B | 4.25B |
| Total Liabilities | 2.75B | 3.56B | 2.86B | 2.33B | 2.29B |
| Long Term Debt | 213.28M | 258.92M | 395.01M | 234.03M | 276.16M |
| Shareholders Equity | 8.28B | 3.98B | 3.19B | 2.58B | 1.97B |
Source: Financial statements and regulatory filings
Cash Flow Statement
| fiscal_date | 2025-03-31 | 2024-03-31 | 2023-03-31 | 2022-03-31 | 2021-03-31 |
|---|---|---|---|---|---|
| Operating Activities Net Income | 878.35M | 1.08B | 960.68M | 833.67M | 600.29M |
| Operating Activities Other Non Cash Items | 98.84M | 175.36M | 120.14M | 127.62M | 106.33M |
| Operating Activities Accounts Receivable | -950.91M | -1.36B | -784.09M | -591.44M | -658.88M |
| Operating Activities Other Assets Liabilities | -118.59M | -58.28M | -12.45M | -54.24M | -148.88M |
| Operating Activities Operating Cash Flow | -92.31M | -160.13M | 284.28M | 315.61M | -101.14M |
| Investing Activities Capital Expenditures | -872.25M | -357.65M | -415.08M | -155.49M | -111.91M |
| Investing Activities Net Intangibles | -10.00K | -990.00K | -290.00K | -300.00K | -880.00K |
| Investing Activities Purchase Of Investments | -1.67B | -13.52M | N/A | -15.52M | -790.00K |
| Investing Activities Sale Of Investments | 0.00 | 7.90M | 42.05M | 0.00 | N/A |
| Investing Activities Investing Cash Flow | -2.54B | -353.17M | -373.03M | -182.01M | -112.70M |
| Financing Activities Long Term Debt Issuance | 211.85M | 199.44M | 361.31M | 76.11M | 234.37M |
| Financing Activities Long Term Debt Payments | -244.88M | -190.51M | -143.82M | -103.38M | -80.37M |
| Financing Activities Short Term Debt Issuance | -906.87M | 629.74M | 383.26M | 290.98M | 232.02M |
| Financing Activities Common Stock Issuance | 4.00B | 0.00 | N/A | N/A | N/A |
| Financing Activities Financing Cash Flow | 3.06B | 638.67M | 502.38M | 113.71M | 386.02M |
| End Cash Position | 48.46M | 18.79M | 14.46M | 25.45M | 34.30M |
| Free Cash Flow | -899.20M | -352.41M | -396.73M | -103.92M | -377.94M |
| Investing Activities Net Acquisitions | N/A | 10.10M | 0.00 | -11.00M | N/A |
| Financing Activities Common Stock Repurchase | N/A | 0.00 | 0.00 | -150.00M | 0.00 |
| Financing Activities Other Financing Charges | N/A | 1.00K | N/A | N/A | N/A |
| Financing Activities Common Dividends | N/A | N/A | -98.37M | N/A | N/A |
Source: Financial statements and regulatory filings
Technical Analysis
Key Insights
- The current trend shows consolidation with price trading above the 50-day moving average (₹96.45) but below the 200-day moving average (₹116.19), indicating mixed momentum.
- Key support levels are near ₹77.02 (52-week low) and ₹96, while resistance is observed around ₹116 and the 52-week high of ₹147.29.
- The stock price is positioned above the 10-day and 50-day moving averages but remains under the 200-day moving average, suggesting intermediate-term resistance.
- Momentum indicators such as RSI are neutral, MACD shows limited bullish crossover signals, and stochastic oscillators indicate sideways movement.
- Daily and weekly timeframes reflect sideways price action with no clear breakout, while monthly charts suggest a longer-term uptrend with periodic corrections.
- Potential scenarios include a breakout above the 200-day moving average leading to renewed upward momentum or a retest of support levels if downward pressure intensifies.
Trending News
1. Headline: Polycab India Ltd stock (INE455K01017): Surges 3% to record high on May 14
Summary: Polycab India Ltd shares jumped 3.0% to a day's high of Rs 9160 on May 14, 2026, outperforming the market amid strong technical signals and infrastructure tailwinds.
Sentiment: positive
2. Headline: Western Carriers (India) Limited Schedules Q4 & FY26 Earnings Conference Call for May 18, 2026
Summary: How has Western Carriers' stock price performed during the trading window closure period, and what volatility can be anticipated once results are published?fuzz it ... Western Carriers (India) Limited: Monitoring Agency Report on IPO Proceeds Utilisation for Quarter Ended March 31, 2026 1 day ago · Western Carriers (India) Promoters Declare No Encumbrance on Shares for Financial Year Ended March 31, 2026 8 days ago · Western Carriers (India) Ltd...
Sentiment: neutral
3. Headline: Western Carriers (India) Limited Schedules Board Meeting on May 16, 2026 to Approve Q4FY26 Audited Financial Results
Summary: Western Carriers (India) Ltd Announces Completion of Independent Director's Tenure Feb 26, 2026 ... Gaudium IVF and Women Health Limited Schedules Board Meeting for Q3FY26 Results on March 18, 2026 Mar 12, 2026 ... Power & Instrumentation Completes Major Warrant Conversion with 5.44 Lakh Share Allotment Mar 18, 2026 ... We’re building Scanx - to help you express your trading & investing idea, to help you analyse the markets better. Stock ...
Sentiment: neutral
4. Headline: Western Carriers Sets May 18 Date for Q4 FY26 Earnings Call | Whalesbook Corporate News
Summary: Western Carriers (India) Ltd. will hold its Q4 and Fiscal Year 2026 earnings conference call on May 18, 2026, at 1:00 PM IST. The company will discuss its operational and financial results for the fiscal year ending March 31, 2026, with investors keen on insights into its performance and future plans. ... Select the stocks ...
Sentiment: neutral
5. Headline: Western Carriers Board Meet May 16 for FY26 Audited Results | Whalesbook Corporate News
Summary: Western Carriers (India) Ltd announced its Board Meeting scheduled for May 16, 2026. The directors will convene to approve the audited financial results for the fiscal year and fourth quarter ended March 31, 2026, along with reviewing auditor reports. This announcement sets the stage for the company's full financial disclosure, crucial for investor assessment. ... Select the stocks ...
Sentiment: neutral
Recent Updates
News Summary
As of May 14, 2026. Western Carriers India Ltd. has scheduled its Q4 and fiscal year 2026 earnings conference call for May 18, 2026, with the CEO and CFO set to discuss operational and financial performance. A board meeting is planned for May 16, 2026, to approve audited financial results and review auditor reports, marking important steps toward transparency and investor communication. The company raised Rs 4,928 million in its IPO, with Rs 913 million still unutilized due to a cautious review of electric vehicle technology delaying fleet purchases. This delay impacts capital deployment and expansion plans, reflecting a prudent approach to integrating new technology. These developments highlight the company's focus on financial disclosure and strategic fleet modernization amid evolving market conditions.
News Sentiment
The overall sentiment from recent updates is neutral, reflecting routine corporate governance activities such as earnings calls and board meetings without significant operational surprises. The cautious stance on IPO fund utilization due to electric vehicle technology review tempers expansion enthusiasm but demonstrates prudent capital management. No major positive or negative events have been reported, maintaining a balanced outlook. Investor attention is likely focused on upcoming financial disclosures and strategic decisions regarding fleet upgrades.
Source List
Analytical Overview
Analysis Summary
Western Carriers India Ltd. trades at a trailing P/E of 24.09, which is aligned with the industry average of 24.09, indicating valuation in line with sector norms; however, the negative PEG ratio suggests challenges in earnings growth. The company’s revenue growth rate of 7.9% over the last quarter and positive free cash flow of INR 651 million indicate a stable growth trajectory, although operating cash flow remains negative. Financial health is supported by a strong current ratio of 3.28 and a low debt-to-equity ratio of 22.78%, reflecting manageable leverage and liquidity. Sector-specific challenges include regulatory scrutiny and competition in the logistics space, while opportunities arise from technology integration and fleet modernization. Considering India-specific factors, the regulatory environment and infrastructure developments play a crucial role in shaping operational dynamics and growth potential.
Overall Business and Market Assessment
Supporting Factors: No data
Risk Factors: delays in fleet expansion due to electric vehicle technology reviews and modest profitability margins
SWOT Analysis
Strengths
- Strong current ratio of 3.28 indicating solid short-term liquidity.
- Low debt-to-equity ratio of 22.78% reflecting manageable leverage.
- Diverse logistics services across road, rail, and sea enhancing market reach.
- Established technology integration for efficient logistics management.
Weaknesses
- Modest gross margin of 6.9% limiting profitability.
- Negative operating cash flow despite positive free cash flow.
- Limited institutional investor presence at 3.77%.
- Negative PEG ratio indicating earnings growth challenges.
Opportunities
- Fleet modernization with electric vehicle technology integration.
- Expanding logistics demand in India’s growing economy.
- Potential for strategic partnerships to enhance service offerings.
- Increasing adoption of technology-driven logistics solutions.
Threats
- Regulatory scrutiny impacting operational flexibility.
- Competitive pressures from larger logistics providers.
- Delays in capital deployment affecting expansion plans.
- Volatility in fuel prices influencing operating costs.
Company Description
Western Carriers India Ltd. is a key player in the logistics and transportation sector, offering comprehensive cargo services across India. The company's principal function is to provide end-to-end logistics solutions, specializing in the transportation of goods via road, rail, and sea. Western Carriers India Ltd. serves a diverse range of industries, including automotive, consumer goods, electronics, and pharmaceuticals, ensuring the efficient and reliable movement of goods through its expansive network. With a focus on technology integration, the company employs state-of-the-art tracking and management systems to optimize logistics operations and enhance customer service. In the highly competitive logistics industry, Western Carriers India Ltd. has established a strong market presence by maintaining high standards of service and safety, thus playing a significant role in facilitating domestic trade and commerce.