


Western Carriers India Ltd (WCIL)
Stock Analysis Report
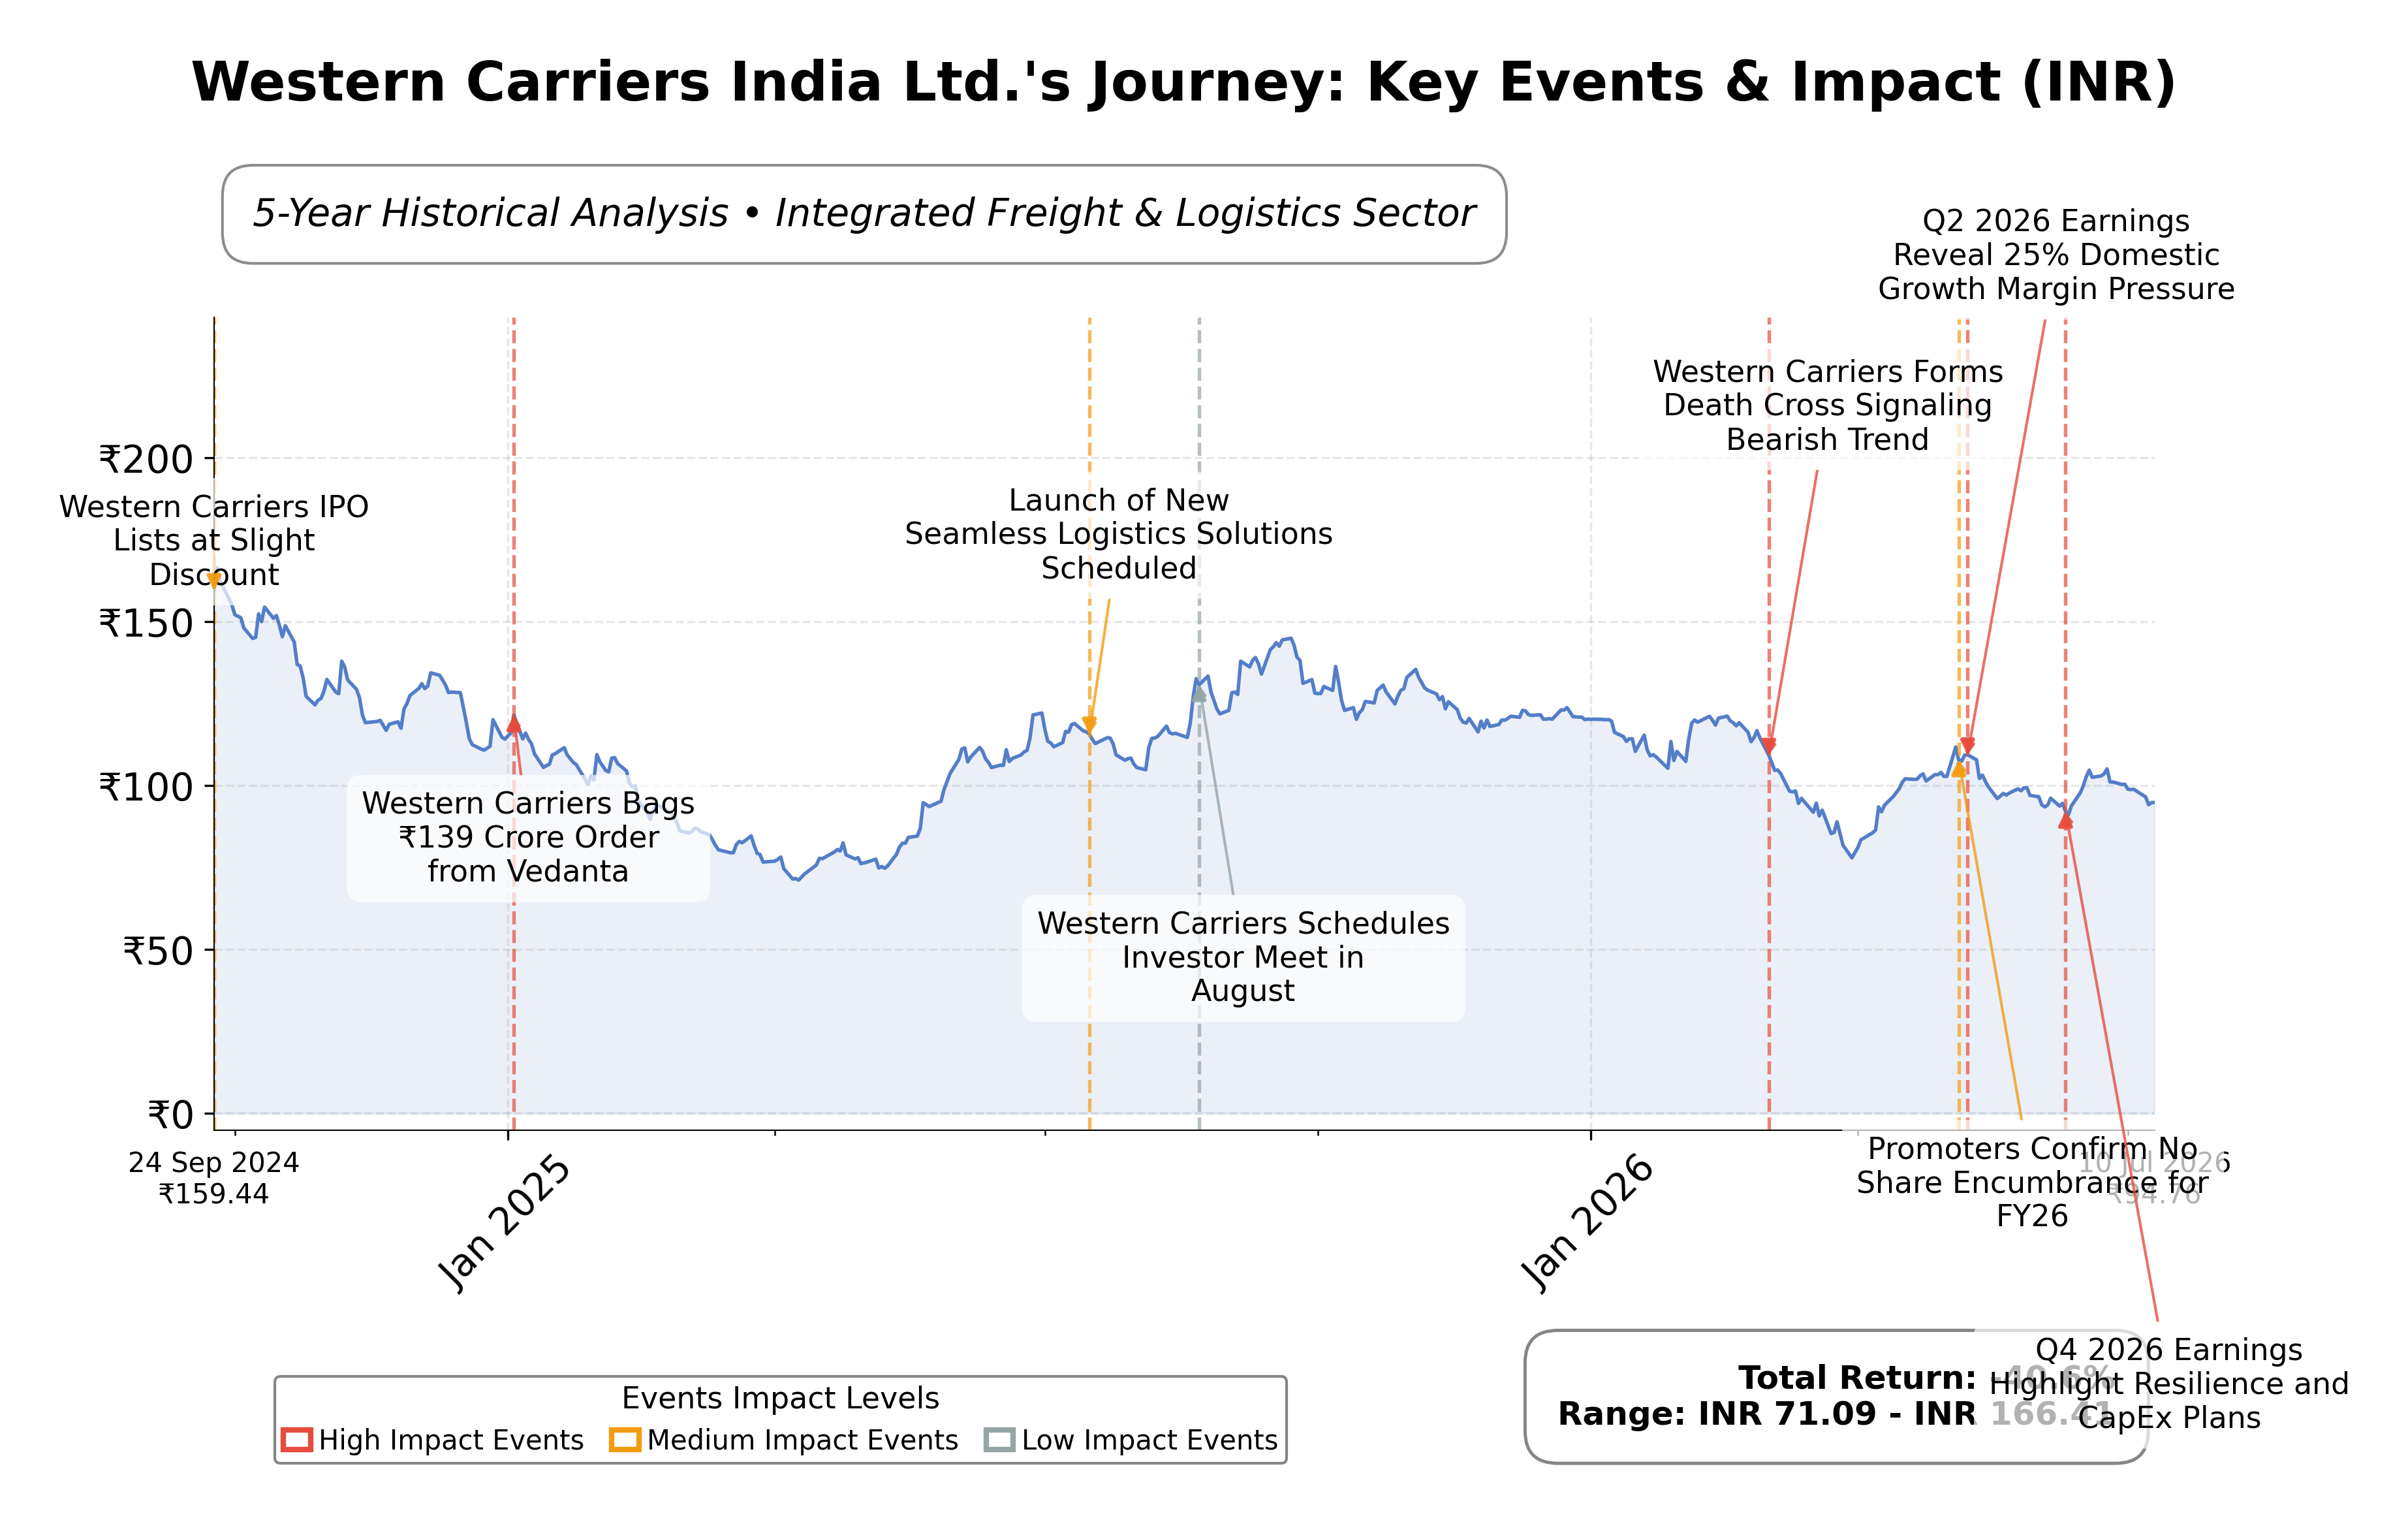
Stock Journey
Key Positives and Key Risks
Pros
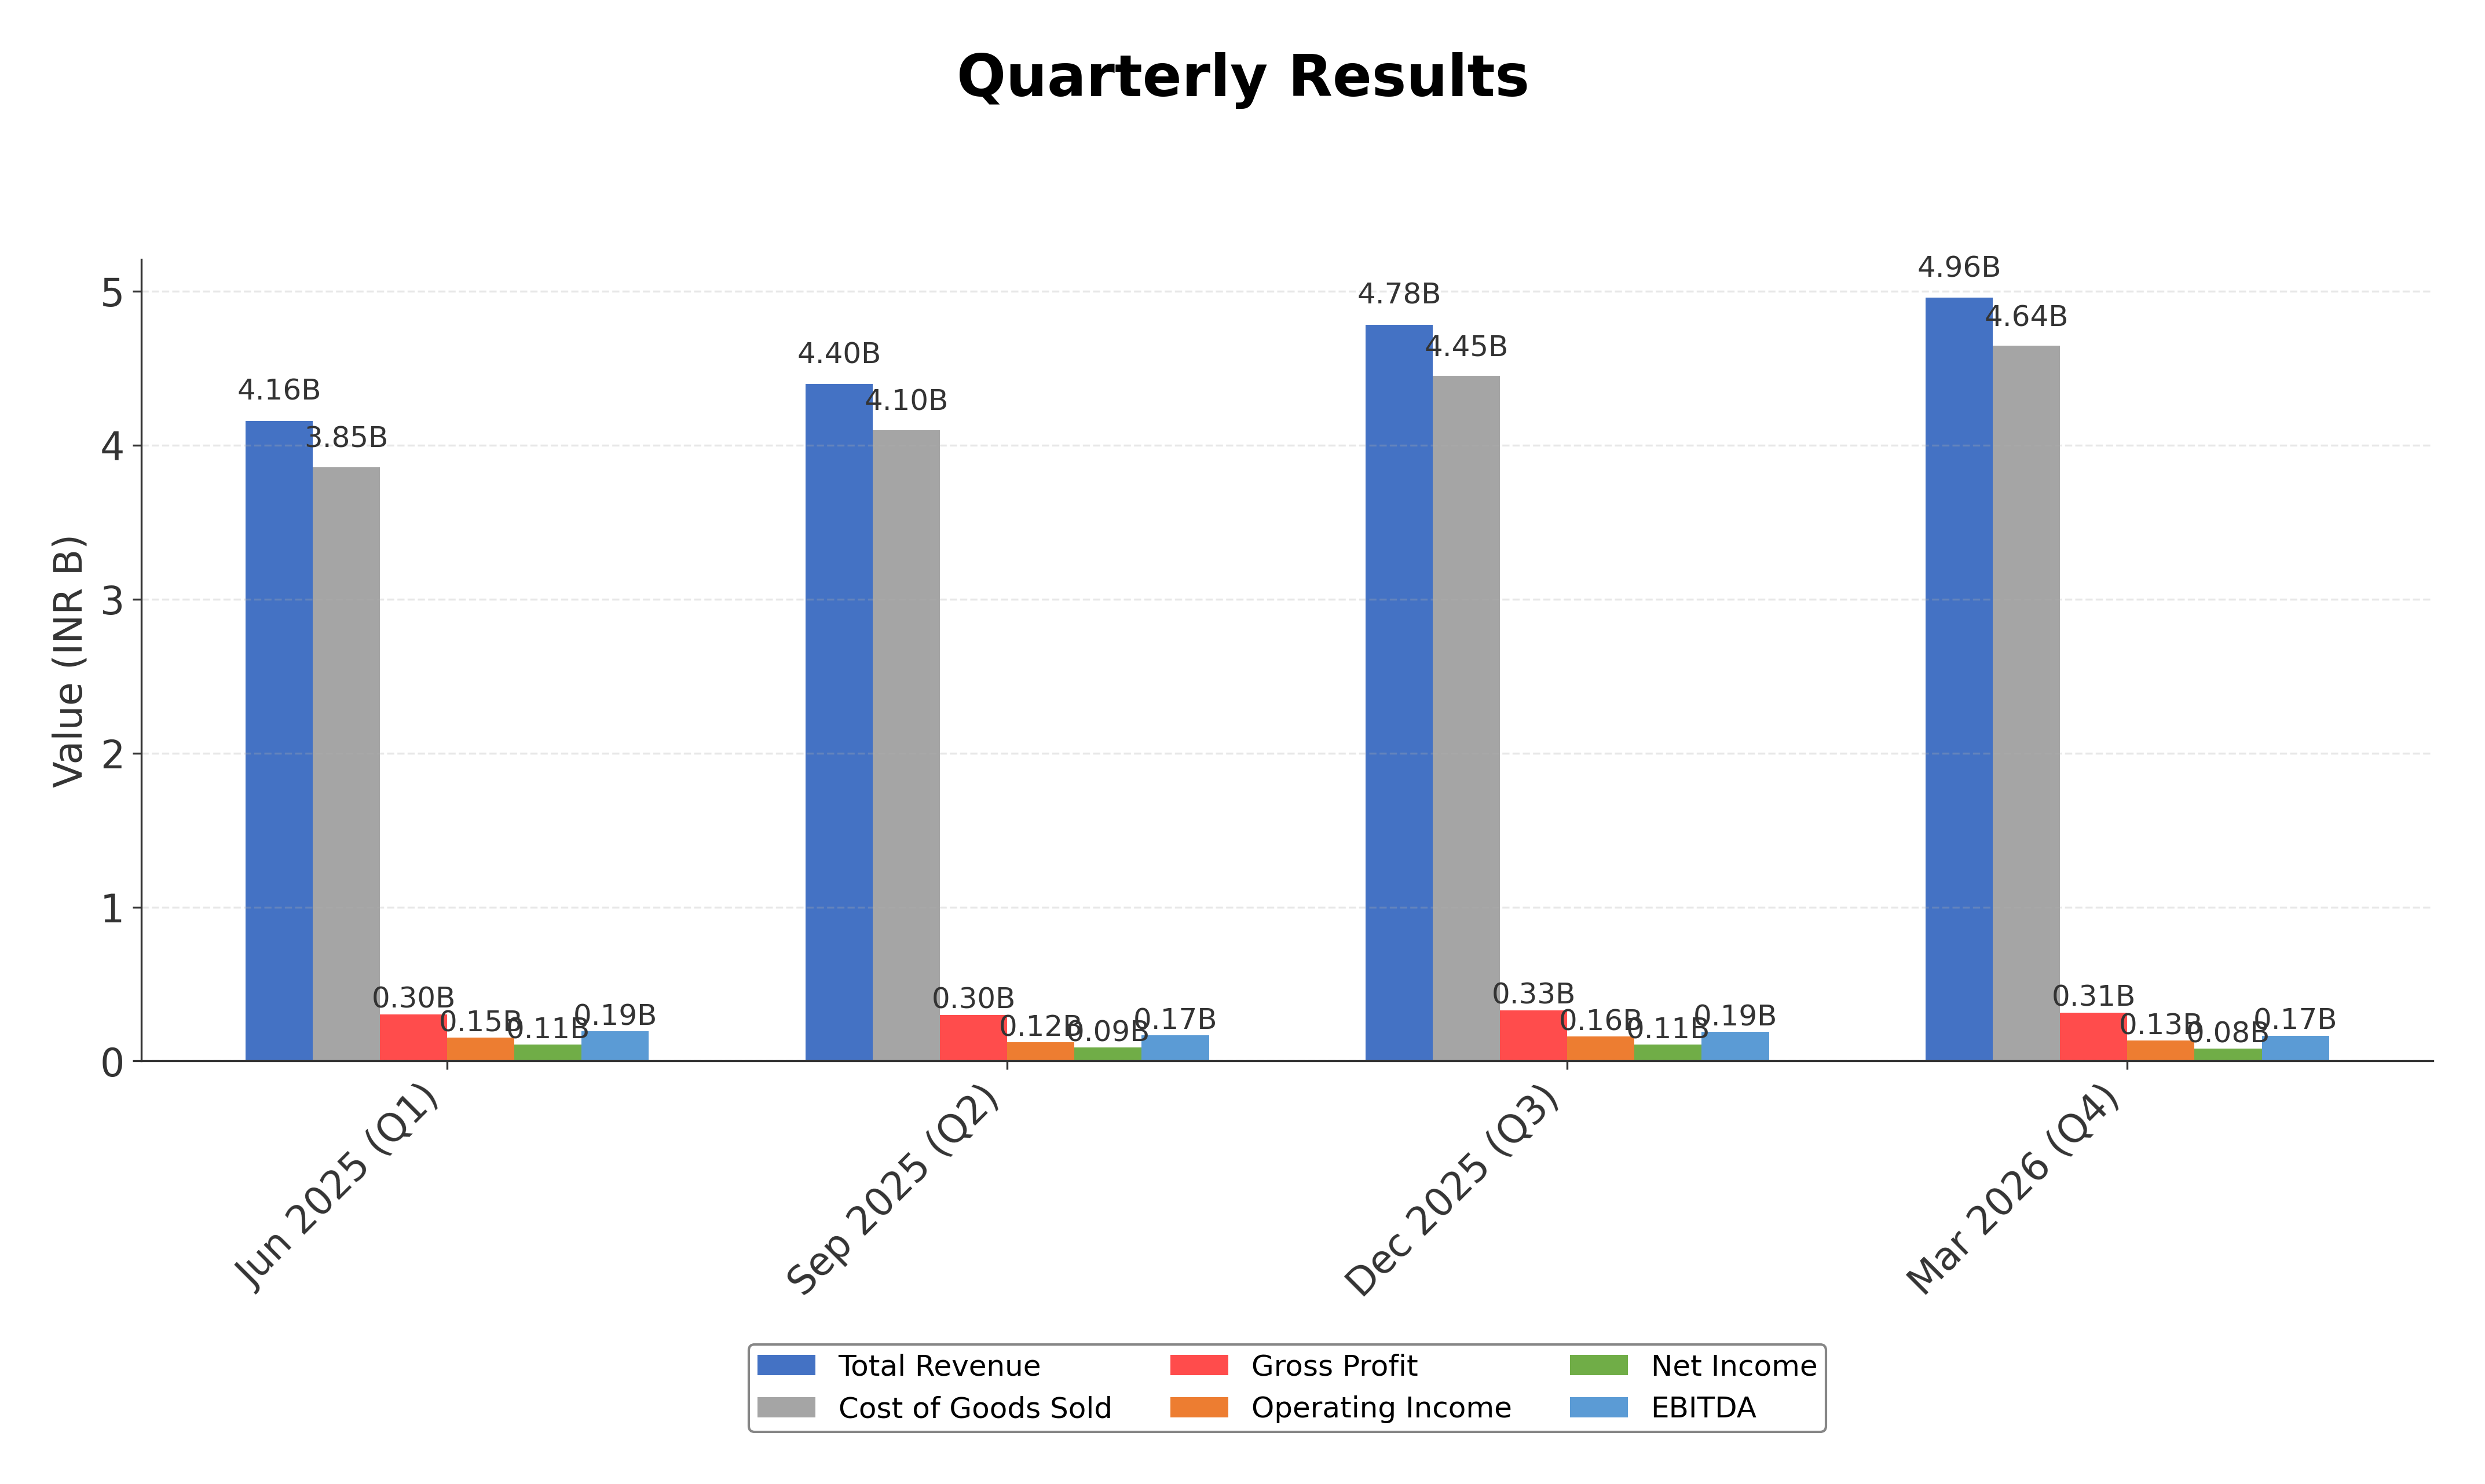
- Revenue growth of 15.7% quarter-over-quarter indicates positive top-line momentum.
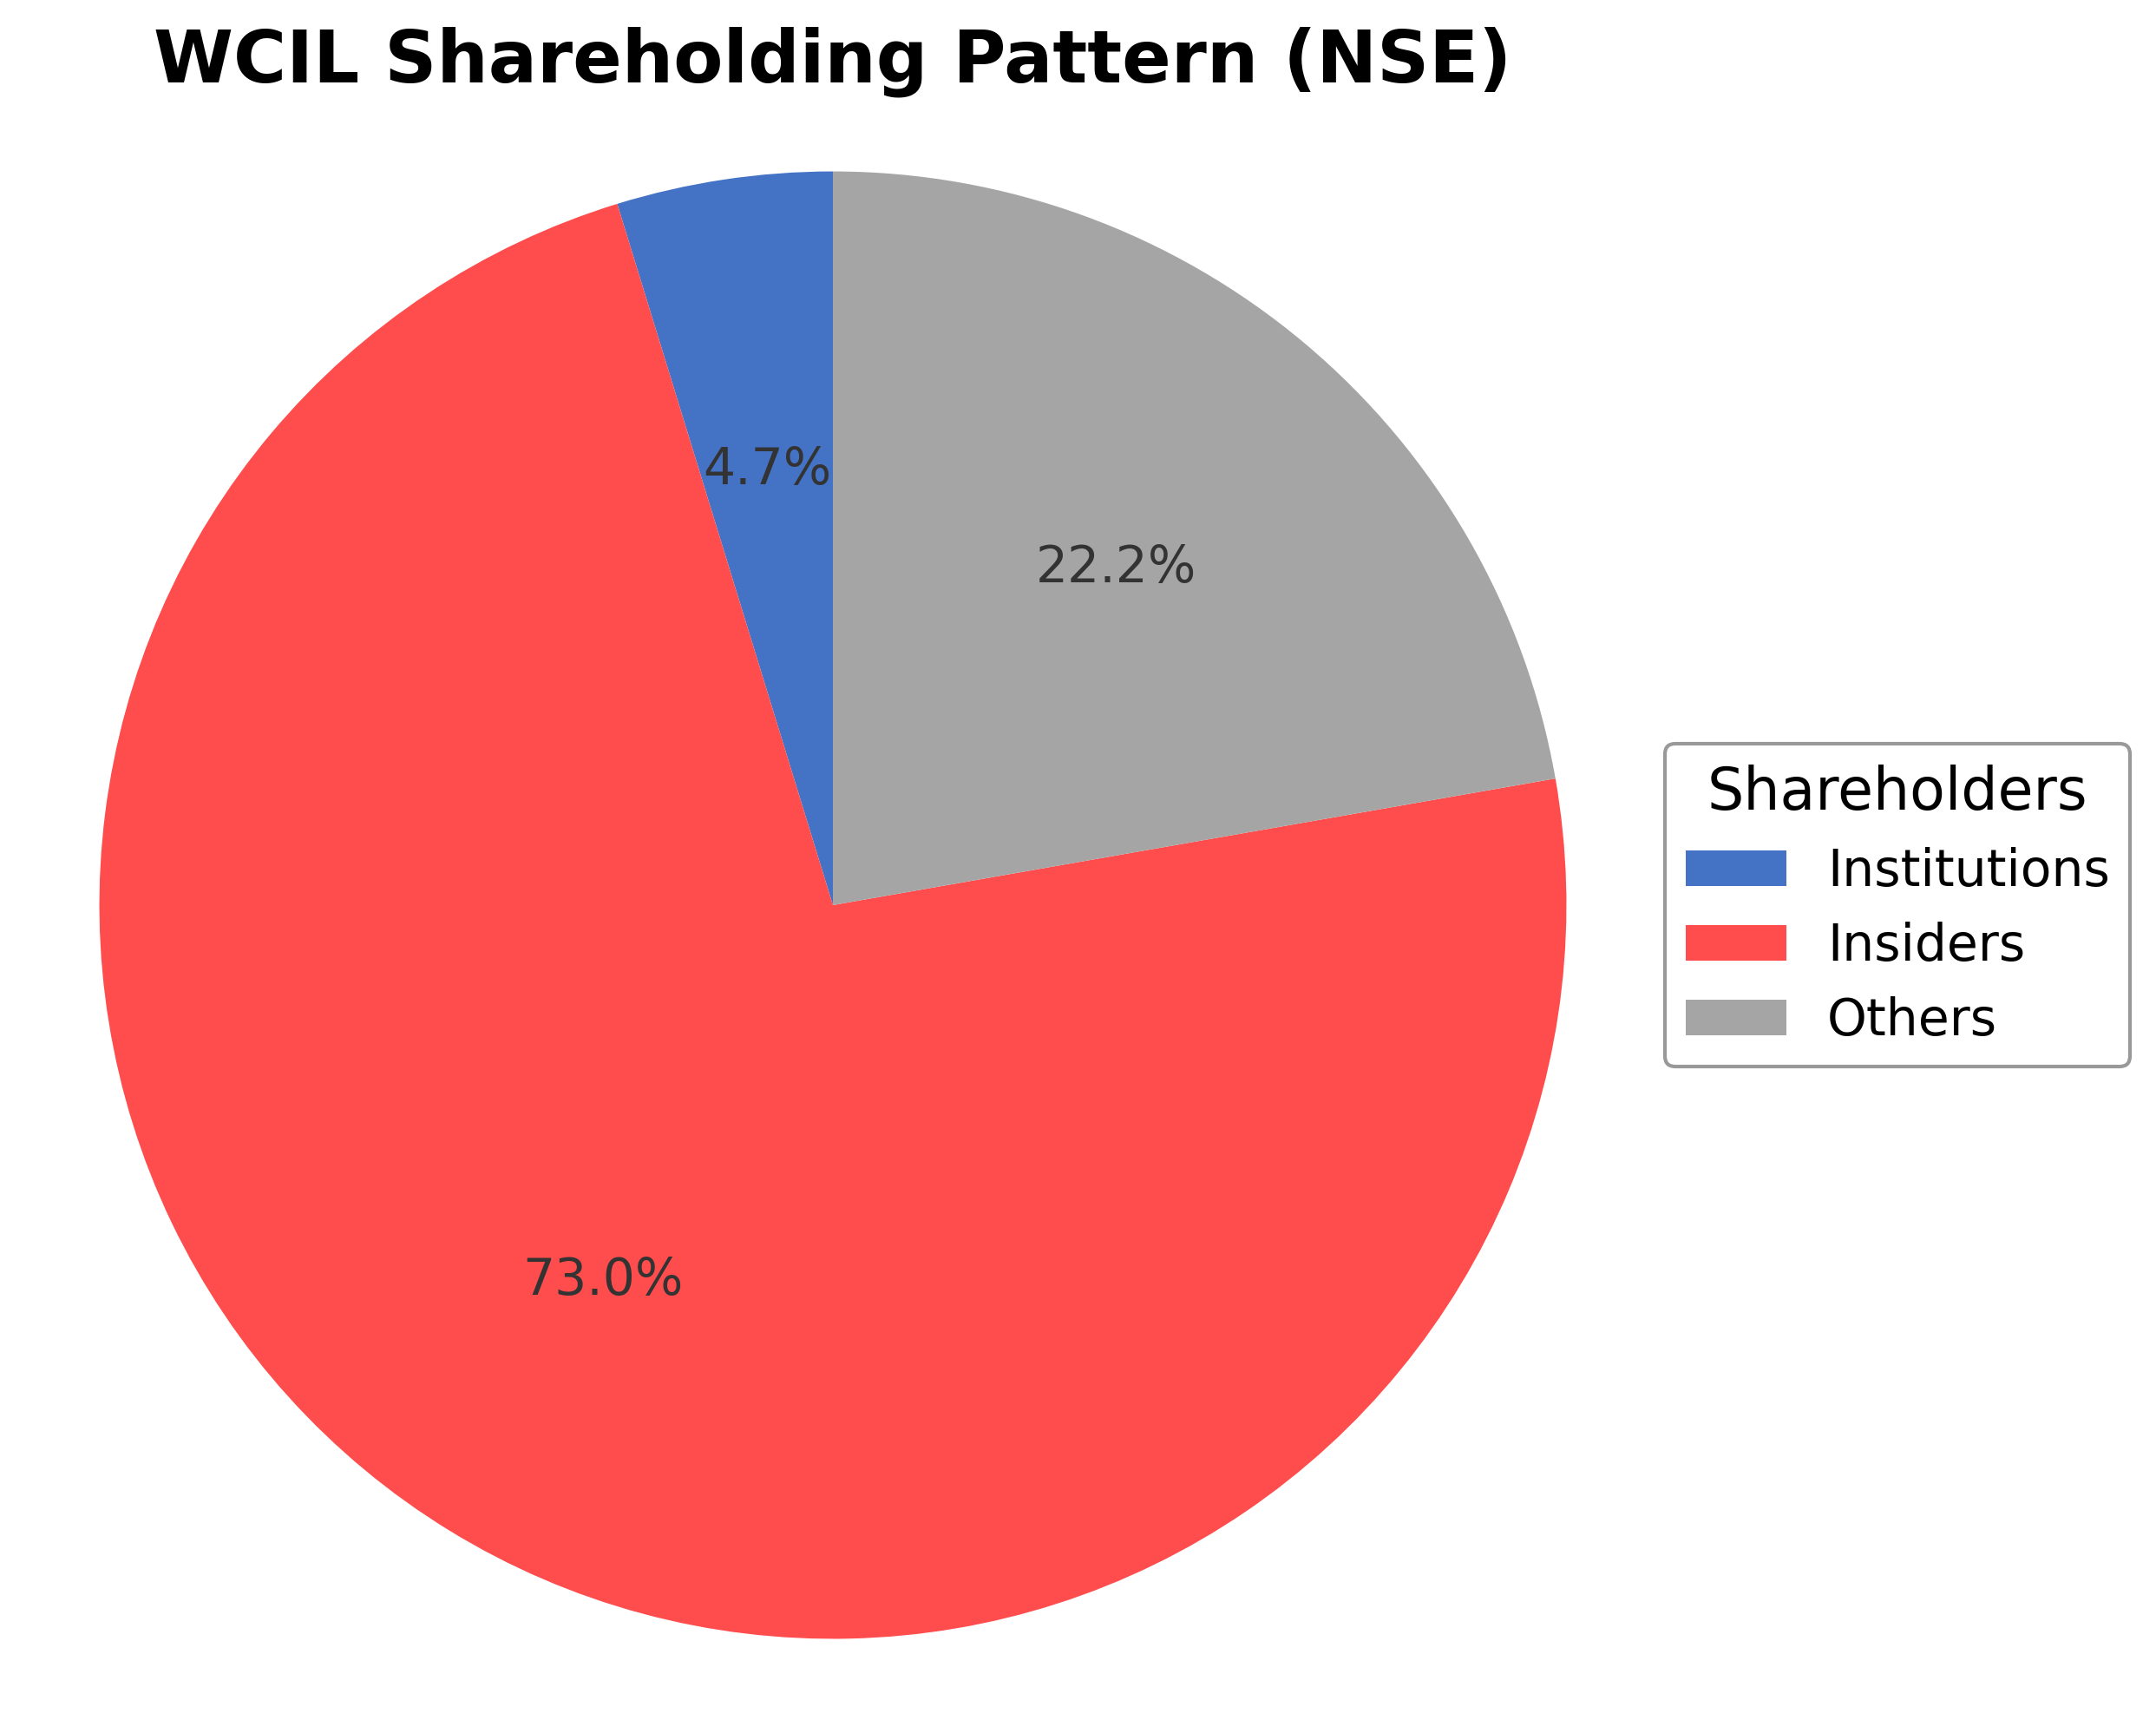
- Strong promoter ownership at 72.83% provides stable governance and strategic control.
- Free cash flow of ₹798 million reflects capacity to generate cash despite operational challenges.
Cons
- Net profit margin is low at approximately 2.12%, limiting profitability.
- Operating cash flow is negative at ₹-218 million, signaling operational cash constraints.
- Debt-to-equity ratio of 26.01 indicates relatively high leverage, increasing financial risk.
Disclosure: This information is for general awareness and does not constitute investment advice
Report Summary
Western Carriers India Ltd. operates primarily in the integrated freight and logistics sector, providing comprehensive cargo transportation services across India. Listed on the National Stock Exchange (NSE) under the symbol WCIL, the company serves diverse industries including automotive, consumer goods, electronics, and pharmaceuticals. Its business model emphasizes end-to-end logistics solutions via road, rail, and sea, supported by advanced technology for tracking and management. Positioned within the industrials sector, Western Carriers maintains a significant presence in the domestic logistics market.
Financially, the company reported trailing twelve months (TTM) revenue of approximately ₹18.29 billion with a gross margin of 6.32%, operating margin of 2.67%, and net profit margin of 2.12%. Return on equity (ROE) stands at 4.58%, and return on assets (ROA) at 3.07%, indicating modest profitability and asset utilization efficiency. The enterprise value to EBITDA ratio is 14.24, reflecting valuation relative to operating earnings. Despite positive revenue growth of 15.7% quarter-over-quarter, quarterly earnings declined by 41.3% year-over-year, highlighting some margin pressures.
Valuation metrics show a trailing price-to-earnings (P/E) ratio of 25.94 and price-to-book (P/B) ratio of 1.16, suggesting the stock trades near book value with moderate earnings multiples. The market capitalization is approximately ₹10.07 billion. The stock price currently trades around ₹96.80, within a 52-week range of ₹77.02 to ₹147.29, representing a downside risk of about 34% from the high. The enterprise value is ₹12.10 billion, indicating some leverage in the capital structure.
Key strengths include a strong promoter holding of over 72%, a healthy current ratio of 2.60 indicating liquidity, and a sizeable free cash flow of ₹798 million despite negative operating cash flow. Risks involve relatively high debt levels with a total debt to equity ratio of 26.01, low profit margins, and recent negative earnings growth. Recent strategic developments include incremental promoter share purchases signaling confidence. However, technical momentum has shifted to a mildly bearish stance, reflecting mixed investor sentiment.
The stock’s technical profile shows a transition from sideways to bearish trends with price near the 50-day moving average but below the 200-day average. Momentum indicators present mixed signals across daily and weekly timeframes. Recent news highlights promoter stake increases and some technical upgrades despite fundamental challenges. Overall, the data suggests a cautious stance with conditions warranting close monitoring of operational performance and market dynamics.
Company and Industry Overview
Company Basics
Price Performance
Company Size
Shareholding Pattern
Sector and Industry Analysis
The Indian logistics and transportation sector, encompassing road freight services like those offered by Western Carriers India Ltd., is a significant contributor to the country's GDP, valued at several hundred billion dollars. The sector has experienced steady growth, driven by expanding industrial output, e-commerce proliferation, and infrastructure development, with a compound annual growth rate (CAGR) of around 10-12% over recent years. Key players include both organized large-scale logistics firms and numerous regional operators, with Western Carriers positioned among established mid-sized companies.
Industry trends highlight increasing adoption of technology for fleet management, route optimization, and real-time tracking to enhance operational efficiency and customer service. Competitive dynamics are shaped by high fragmentation, moderate barriers to entry due to capital intensity and regulatory compliance, and rising fuel and maintenance costs impacting margins. Companies with strong asset bases, diversified service offerings, and efficient cost structures tend to maintain competitive advantages in this evolving landscape.
The regulatory environment for the logistics sector in India has been progressively streamlined with the implementation of the Goods and Services Tax (GST), which has simplified interstate transportation and reduced transit times. Compliance with safety, environmental, and labor regulations remains critical, influencing operational costs and practices. Continued government focus on infrastructure improvements and digitization initiatives is expected to support sector growth while imposing evolving regulatory requirements on industry participants.
Note: Analysis synthesized from industry research, market reports, and regulatory filings. Information is subject to change based on market conditions.
Financial Ratios Dashboard
Illustrative Scenario Analysis
DCF Assumptions:
Method: Two-Stage EPS-Priority Model
Financials
Peer Analysis
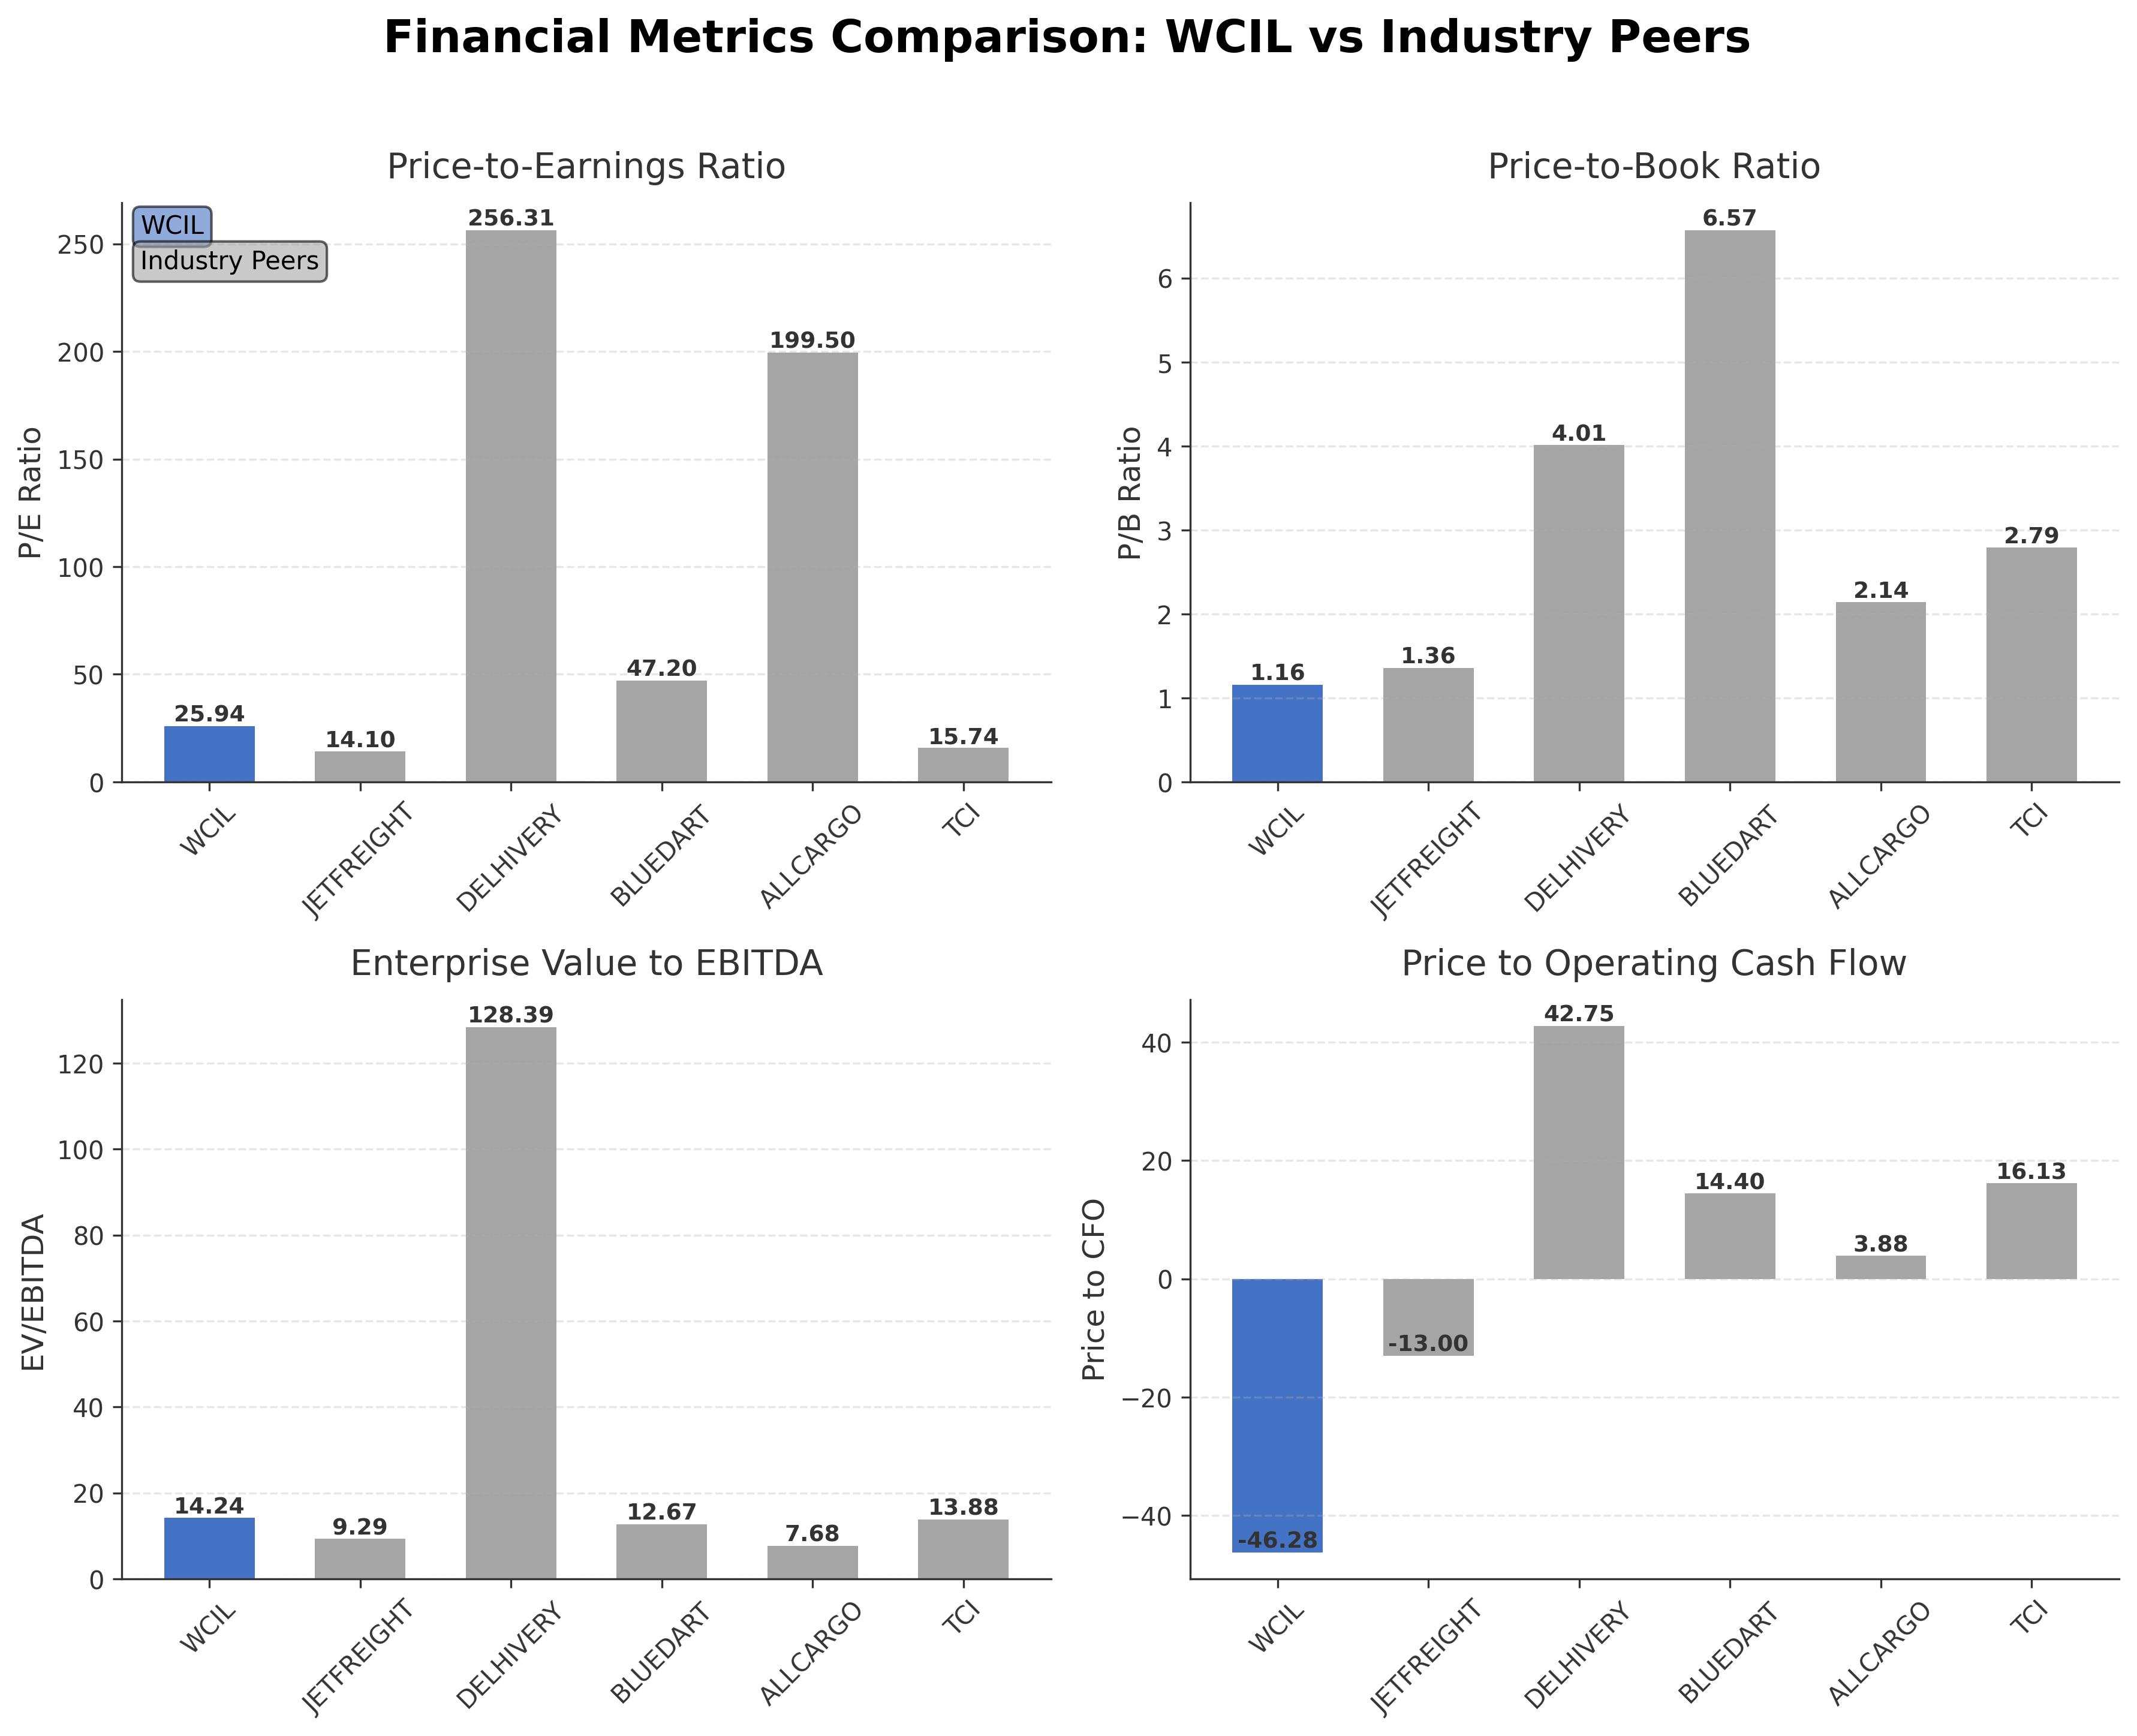
| Company Name | Market Cap | P/E Ratio | P/B Ratio | EV/EBITDA | Price to CFO |
|---|---|---|---|---|---|
| Western Carriers India Ltd. | ₹10.07B | 25.94 | 1.16 | 14.24 | -46.28 |
| Jet Freight Logistics Ltd. | ₹1.06B | 14.10 | 1.36 | 9.29 | -13.00 |
| Delhivery Ltd. | ₹389.63B | 256.31 | 4.01 | 128.39 | 42.75 |
| Blue Dart Express Ltd. | ₹116.70B | 47.20 | 6.57 | 12.67 | 14.40 |
| Allcargo Logistics Ltd. | ₹12.22B | 199.50 | 2.14 | 7.68 | 3.88 |
| Transport Corporation of India Ltd. | ₹71.68B | 15.74 | 2.79 | 13.88 | 16.13 |
Comparison Analysis: Western Carriers India Ltd. has a moderate market capitalization relative to its peers, ranking below large-cap companies like Delhivery and Blue Dart but above smaller players such as Jet Freight. Its P/E ratio of 25.94 is lower than high-growth peers like Delhivery (256.31) and Allcargo (199.50) but higher than Jet Freight (14.10) and TCI (15.74), reflecting a middle-ground valuation. The P/B ratio of 1.16 is the lowest among the group, indicating a relatively conservative book value pricing. The EV/EBITDA multiple of 14.24 is comparable to Blue Dart (12.67) and TCI (13.88), suggesting fair valuation on operating earnings. However, the negative price to CFO ratio (-46.28) contrasts with positive cash flow multiples of peers, signaling operational cash flow challenges. Return on equity at 4.58% is modest compared to peers like TCI (19.18%) and Blue Dart (14.83%), indicating room for improvement in profitability.
Financial Metrics Comparison with Peers
Financial Statements
Comprehensive financial data including income, balance sheet, and cash flow metrics
Income Statement
| fiscal_date | 2026-03-31 | 2025-03-31 | 2024-03-31 | 2023-03-31 | 2022-03-31 |
|---|---|---|---|---|---|
| Sales | 18.29B | 17.26B | 16.86B | 16.33B | 14.71B |
| Cost Of Goods | 17.05B | 16.03B | 15.05B | 15.06B | 13.60B |
| Gross Profit | 1.25B | 1.23B | 1.81B | 1.27B | 1.11B |
| Operating Expense Other Operating Expenses | 679.57M | 88.01M | 562.12M | 74.78M | 61.02M |
| Operating Income | 566.55M | 967.59M | 1.25B | 1.07B | 950.13M |
| Non Operating Interest Expense | 184.53M | 201.45M | 221.78M | 144.65M | 131.67M |
| Pretax Income | 527.52M | 878.35M | 1.08B | 960.68M | 833.67M |
| Income Tax | 139.35M | 227.05M | 280.58M | 245.03M | 222.38M |
| Net Income | 388.17M | 651.30M | 803.47M | 715.65M | 611.29M |
| Ebit | 712.05M | 1.08B | 1.31B | 1.11B | 965.34M |
| Ebitda | 995.24M | 1.31B | 1.52B | 1.25B | 1.10B |
| Net Income Continuous Operations | 527.52M | 878.35M | 1.08B | 960.68M | 833.67M |
| Preferred Stock Dividends | 0.00 | 0.00 | 0.00 | 0.00 | 0.00 |
| Operating Expense Selling General And Administrative | N/A | 138.38M | 122.97M | 95.36M | 80.56M |
| Non Operating Interest Income | N/A | 116.29M | 46.42M | 31.46M | 35.07M |
| Eps Basic | N/A | 7.16 | 7.88 | 7.02 | 6.00 |
| Eps Diluted | N/A | 7.16 | 7.88 | 7.02 | 6.00 |
| Basic Shares Outstanding | N/A | 91.00M | 101.96M | 101.96M | 101.96M |
| Diluted Shares Outstanding | N/A | 91.00M | 101.96M | 101.96M | 101.96M |
| Minority Interests | N/A | N/A | 0.00 | 0.00 | 0.00 |
Data provided by Twelve Data
Balance Sheet
| fiscal_date | 2026-03-31 | 2025-03-31 | 2024-03-31 | 2023-03-31 | 2022-03-31 |
|---|---|---|---|---|---|
| Cash And Cash Equivalents | 92.20M | 48.46M | 18.79M | 14.46M | 25.45M |
| Accounts Receivable | 6.95B | 6.20B | 5.25B | 3.90B | 3.11B |
| Total Assets | 12.05B | 11.04B | 7.54B | 6.04B | 4.90B |
| Total Liabilities | 3.38B | 2.75B | 3.56B | 2.86B | 2.33B |
| Long Term Debt | 127.97M | 213.28M | 258.92M | 395.01M | 234.03M |
| Shareholders Equity | 8.67B | 8.28B | 3.98B | 3.19B | 2.58B |
Data provided by Twelve Data
Cash Flow Statement
| fiscal_date | 2026-03-31 | 2025-03-31 | 2024-03-31 | 2023-03-31 | 2022-03-31 |
|---|---|---|---|---|---|
| Operating Activities Net Income | 527.52M | 878.35M | 1.08B | 960.68M | 833.67M |
| Operating Activities Other Non Cash Items | 54.71M | 98.84M | 175.36M | 120.14M | 127.62M |
| Operating Activities Accounts Receivable | -747.52M | -950.91M | -1.36B | -784.09M | -591.44M |
| Operating Activities Other Assets Liabilities | -19.13M | -118.59M | -58.28M | -12.45M | -54.24M |
| Operating Activities Operating Cash Flow | -184.42M | -92.31M | -160.13M | 284.28M | 315.61M |
| Investing Activities Capital Expenditures | -805.87M | -872.25M | -357.65M | -415.08M | -155.49M |
| Investing Activities Net Intangibles | -50.00K | -10.00K | -990.00K | -290.00K | -300.00K |
| Investing Activities Sale Of Investments | 730.02M | 0.00 | 7.90M | 42.05M | 0.00 |
| Investing Activities Investing Cash Flow | -75.85M | -2.54B | -353.17M | -373.03M | -182.01M |
| Financing Activities Long Term Debt Issuance | 15.15M | 211.85M | 199.44M | 361.31M | 76.11M |
| Financing Activities Long Term Debt Payments | -254.25M | -244.88M | -190.51M | -143.82M | -103.38M |
| Financing Activities Short Term Debt Issuance | 690.71M | -906.87M | 629.74M | 383.26M | 290.98M |
| Financing Activities Common Stock Issuance | 0.00 | 4.00B | 0.00 | N/A | N/A |
| Financing Activities Financing Cash Flow | 451.61M | 3.06B | 638.67M | 502.38M | 113.71M |
| End Cash Position | 92.20M | 48.46M | 18.79M | 14.46M | 25.45M |
| Free Cash Flow | -1.02B | -899.20M | -352.41M | -396.73M | -103.92M |
| Investing Activities Purchase Of Investments | N/A | -1.67B | -13.52M | N/A | -15.52M |
| Investing Activities Net Acquisitions | N/A | N/A | 10.10M | 0.00 | -11.00M |
| Financing Activities Common Stock Repurchase | N/A | N/A | 0.00 | 0.00 | -150.00M |
| Financing Activities Other Financing Charges | N/A | N/A | 1.00K | N/A | N/A |
| Financing Activities Common Dividends | N/A | N/A | N/A | -98.37M | N/A |
Data provided by Twelve Data
Technical Analysis
Key Insights
- Current trend direction shows a transition from sideways movement to a mildly bearish trend with recent price action indicating increased selling pressure.
- Key support levels are identified near ₹90, while resistance is observed around ₹105 and ₹115, marking critical price points for potential reversals.
- The stock price is trading slightly below the 50-day moving average (~₹100.42) and well below the 200-day moving average (~₹111.40), indicating medium to long-term bearish momentum.
- Momentum indicators present mixed readings: RSI is near neutral levels, MACD shows weakening bullish momentum, and Stochastic oscillators suggest potential oversold conditions.
- Multi-timeframe analysis reveals bearish signals on daily and weekly charts, while monthly charts indicate a longer-term consolidation phase.
- Potential market scenarios include continued consolidation with downside risk if support at ₹90 breaks, or a recovery attempt if the price surpasses resistance near ₹105.
Trending News
Summary: Coal India Share Price: Find the latest news on Coal India Stock Price. Get all the information on Coal India with historic price charts for NSE / BSE. Experts & Broker view also get the Coal India Ltd. buy/sell tips detailed news, announcements, Forecasts, Analysts, Valuation, Earning forecasts, ...
Sentiment: neutral
2. Headline: Wells Fargo raises Western Digital stock price target on demand outlook By Investing.com
Summary: In other recent news, Western Digital Corporation has been active with several significant developments. The company announced the integration of post-quantum cryptography into its Ultrastar UltraSMR hard disk drives, aimed at enhancing security features for hyperscale customers. Additionally, Western Digital entered into exchange agreements with institutional investors to trade 653,203 shares of Sandisk Corporation for 1,865,801 shares of its own common stock...
Sentiment: positive
3. Headline: Stocks To Watch Today: SBI, Tata Steel, Indian Bank, HFCL, Phoenix Mills, SML Mahindra
Summary: TVS Motor Company Ltd. will also be in focus after it announced a partnership with Oil Corporation to deploy TVS King Kargo HD vehicles across IndianOil's LPG distributor network for last-mile LPG cylinder delivery.
Sentiment: neutral
4. Headline: Western Digital Stock Rallies As Wall Street Targets Soar - StocksToTrade
Summary: Western Digital Corporation stocks have been trading up by 4.79 percent amid strong AI-driven storage demand and optimistic earnings outlook. Key Takeaways Goldman Sachs lifted its Western Digital (WDC) target to $650 from $400, with WDC near $589 and jumping about 9.35% on the upgrade amid ...
Sentiment: positive
5. Headline: Western Carriers (India) Ltd Faces Technical Momentum Shift Amid Bearish Signals
Summary: Western Carriers (India) Ltd, a micro-cap player in the Transport Services sector, has experienced a notable shift in its technical momentum, signalling a cautious outlook for investors. Recent technical indicators reveal a transition from sideways movement to a mildly bearish trend, compounded by mixed signals from key momentum oscillators and moving averages. This analysis delves into the evolving technical landscape of the stock...
Sentiment: negative
Powered by Brave
Recent Updates
News Summary
As of June 30, 2026. Rajendra Sethia, the promoter, Chairman, and Managing Director of Western Carriers India Ltd, has increased his stake in the company through open market purchases, raising his holding to approximately 72.83% of the paid-up share capital. The acquisitions occurred on June 29 and 30, 2026, involving 6,106 shares, funded entirely via the open market route. This incremental share purchase consolidates promoter control and signals confidence in the company’s prospects. The total equity share capital remains at 101,955,213 shares with a face value of ₹5 each. These developments reflect a strategic move by the promoter to strengthen ownership without altering the capital structure.
News Sentiment
The overall sentiment from recent updates is neutral to positive, driven primarily by the promoter’s incremental share acquisitions which indicate confidence and control consolidation. There is no indication of material changes in encumbrances or convertible securities, maintaining stability in ownership structure. While the news does not include operational or financial performance updates, the promoter’s stake increase may positively influence market perception. The absence of significant institutional activity or regulatory events tempers the sentiment to a balanced outlook. Overall, the updates suggest a steady governance environment with promoter commitment.
Source List
Analytical Overview
Analysis Summary
Western Carriers India Ltd.’s valuation metrics, including a trailing P/E ratio of 25.94, align closely with the industry average of 25.94, suggesting the stock is fairly valued relative to peers. The absence of forward P/E and PEG ratio limits forward-looking valuation insights. The company’s revenue growth of 15.7% quarter-over-quarter indicates a positive growth trajectory, although a 41.3% decline in quarterly earnings year-over-year points to margin pressures. Cash flow trends show negative operating cash flow but positive levered free cash flow, reflecting some operational challenges offset by financing activities. The debt-to-equity ratio of 26.01 indicates moderate leverage, necessitating monitoring of financial health. Sector-specific challenges include intense competition and regulatory compliance in the Indian logistics market, while opportunities arise from increasing demand for integrated freight solutions. India’s regulatory environment and evolving consumer trends in logistics also impact the company’s positioning.
Overall Business and Market Assessment
Supporting Factors: steady revenue growth and strong promoter control with a 72.83% stake, which may facilitate strategic decision-making
Risk Factors: No data
SWOT Analysis
Strengths
- Strong promoter holding of over 72%, ensuring stable governance.
- Healthy current ratio of 2.60 indicating good short-term liquidity.
- Significant free cash flow generation despite negative operating cash flow.
- Established market presence in integrated freight and logistics across India.
Weaknesses
- Low profit margins with net margin at approximately 2.12%.
- Negative operating cash flow indicating operational cash challenges.
- High debt-to-equity ratio of 26.01 reflecting leverage concerns.
- Limited institutional investor participation at 4.75%.
Opportunities
- Growing demand for integrated logistics solutions in India.
- Increasing adoption of technology for logistics optimization.
- Potential for market share expansion through promoter-led initiatives.
- Favorable regulatory environment supporting logistics sector growth.
Threats
- Intense competition within the Indian logistics and freight industry.
- Volatility in fuel prices impacting transportation costs.
- Regulatory changes affecting operational compliance and costs.
- Macroeconomic factors influencing trade volumes and logistics demand.
Company Description
Western Carriers India Ltd. is a key player in the logistics and transportation sector, offering comprehensive cargo services across India. The company's principal function is to provide end-to-end logistics solutions, specializing in the transportation of goods via road, rail, and sea. Western Carriers India Ltd. serves a diverse range of industries, including automotive, consumer goods, electronics, and pharmaceuticals, ensuring the efficient and reliable movement of goods through its expansive network. With a focus on technology integration, the company employs state-of-the-art tracking and management systems to optimize logistics operations and enhance customer service. In the highly competitive logistics industry, Western Carriers India Ltd. has established a strong market presence by maintaining high standards of service and safety, thus playing a significant role in facilitating domestic trade and commerce.