
Waaree Energies Ltd (WAAREEENER)
Stock Analysis Report
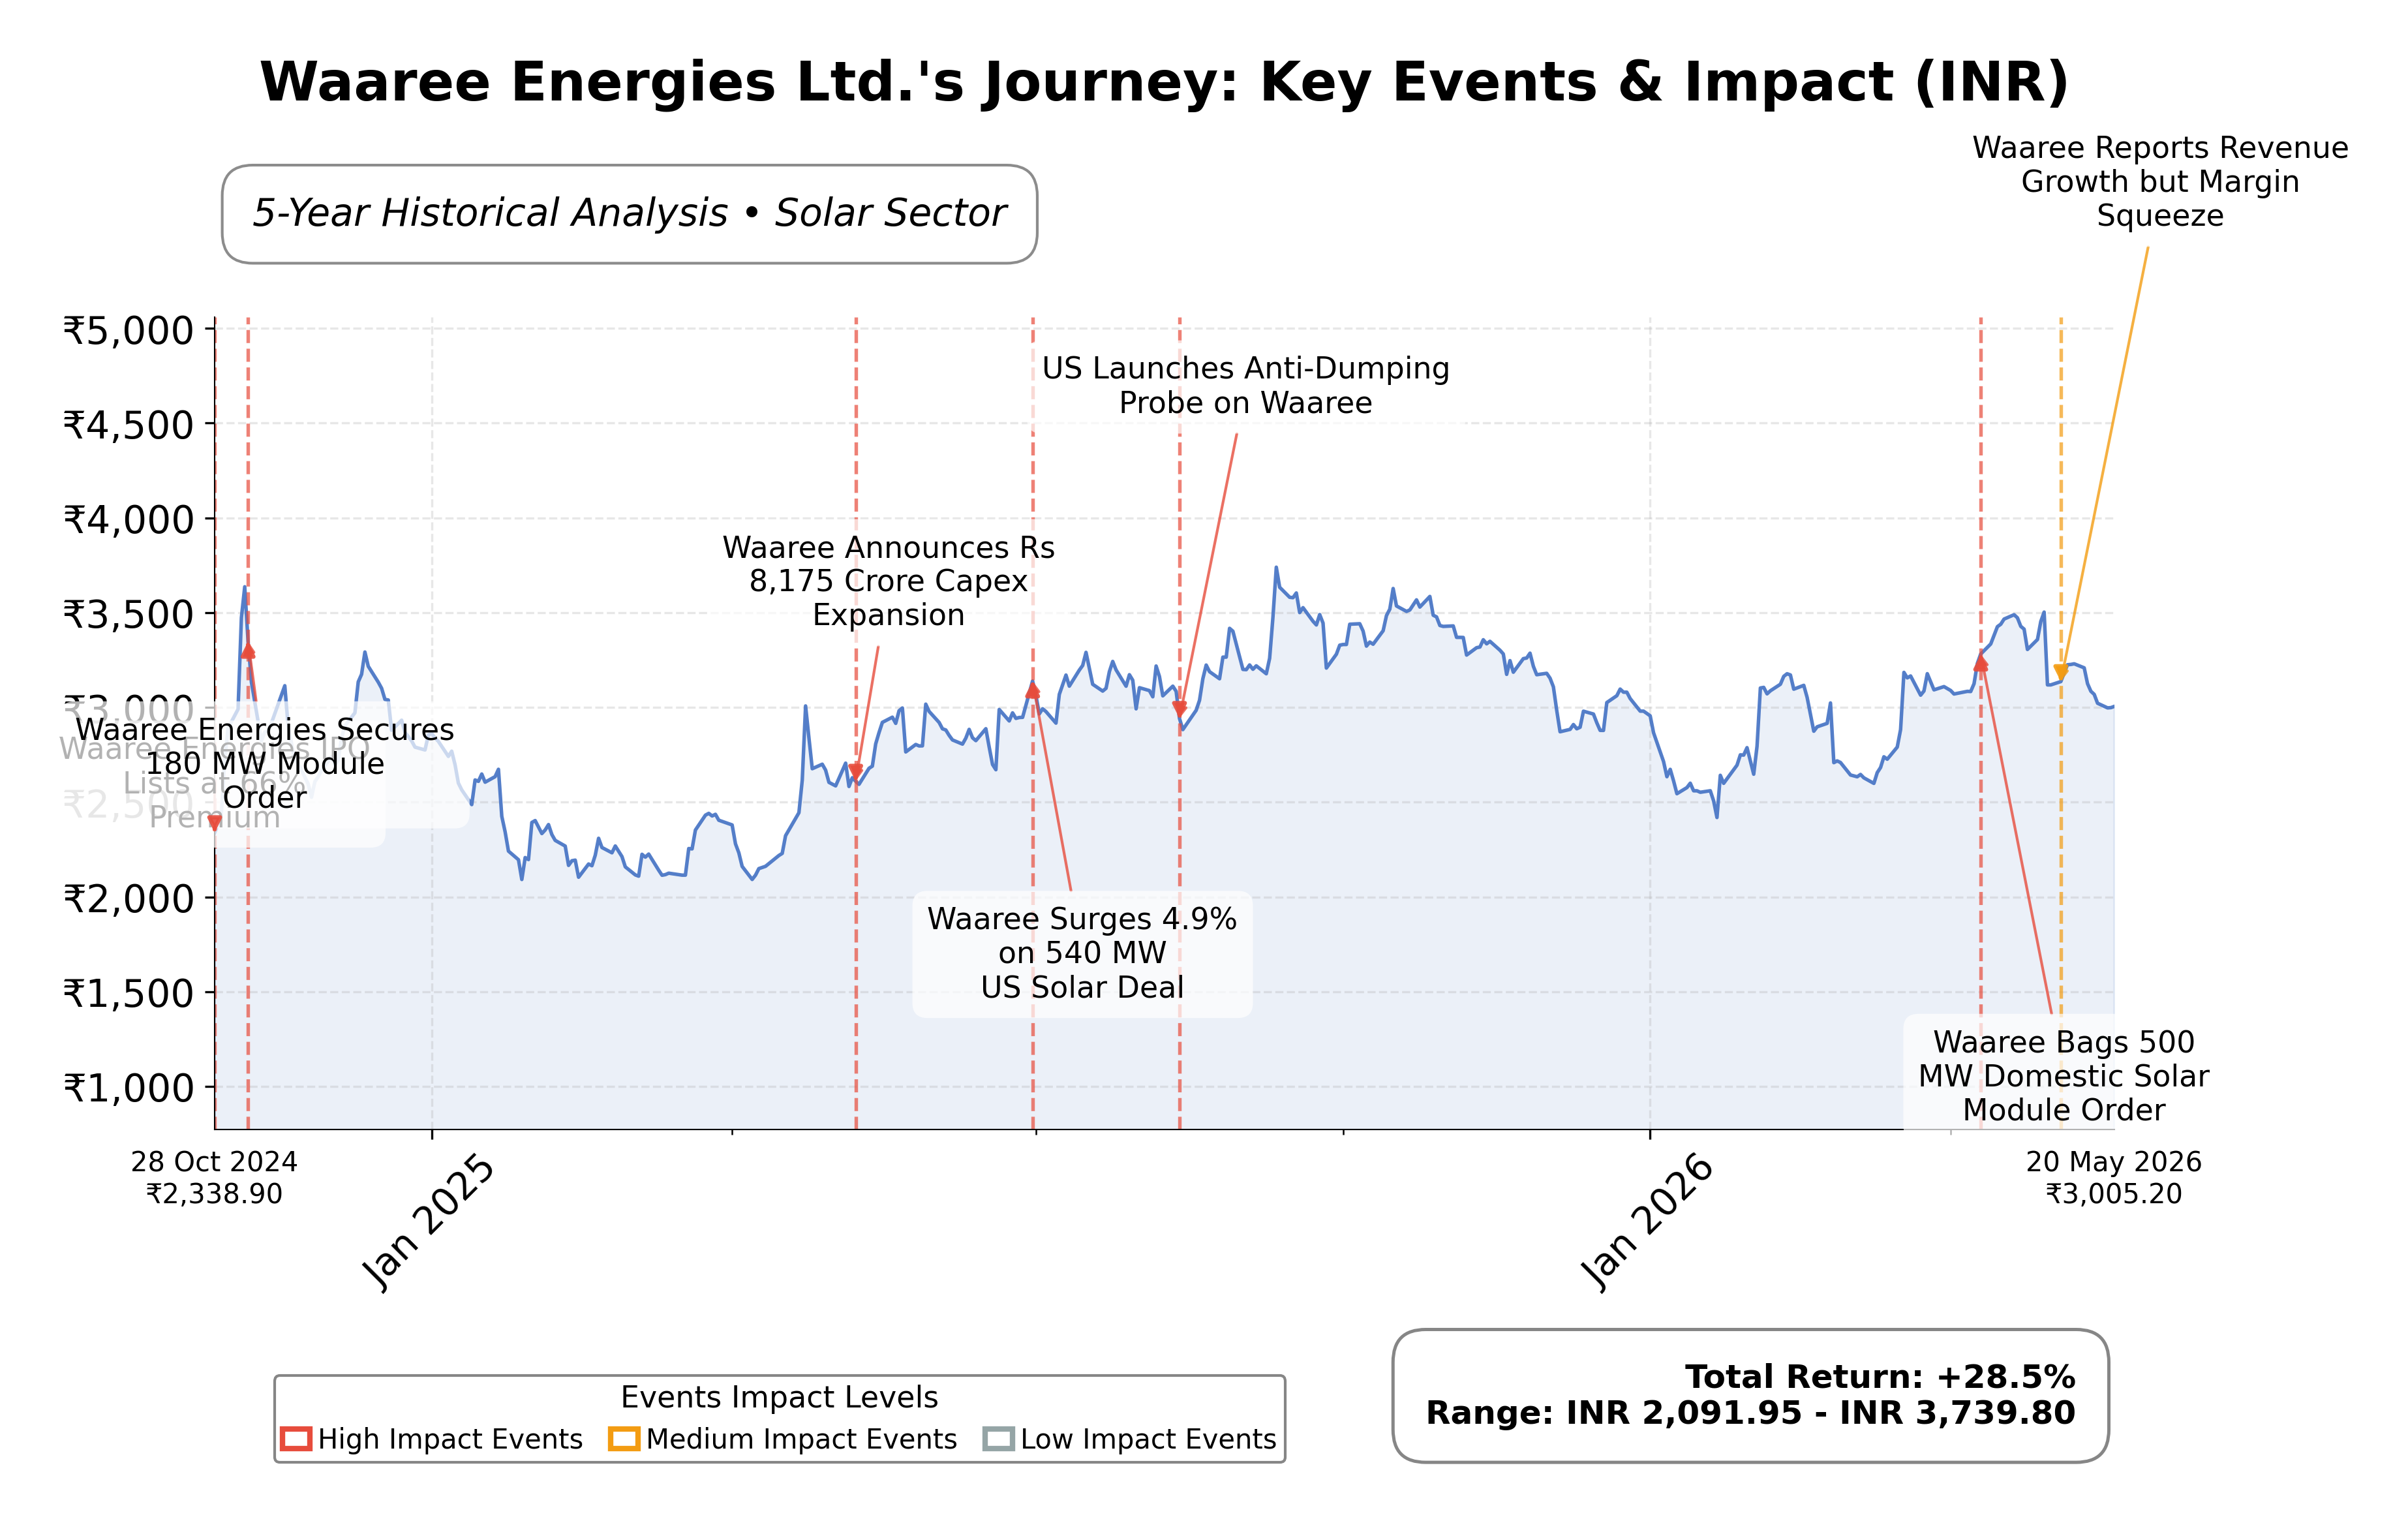
Stock Journey
Key Positives and Key Risks
Pros
- Strong revenue growth with 111.8% YoY increase in Q4 FY26 demonstrating robust demand.
- Low debt-to-equity ratio of 0.25 indicating conservative leverage and financial stability.
- PEG ratio of 0.18 suggests attractive valuation relative to expected earnings growth.
Cons
- Margin compression in Q4 FY26 highlights profitability pressures.
- High capital expenditure requirements increase execution risk.
- Price-to-book ratio of 8.66 reflects a premium valuation that may limit downside protection.
Disclosure: This information is for general awareness and does not constitute investment advice
Report Summary
Waaree Energies Ltd. is a leading Indian company in the renewable energy sector, specializing in the manufacturing and distribution of solar photovoltaic modules. Listed on the NSE under the symbol WAAREEENER, it operates within the technology sector, focusing primarily on solar energy solutions. The company boasts one of the largest solar panel production facilities in India and extends its services to project development and EPC (engineering, procurement, and construction) for large-scale solar installations. Its market positioning reflects a strong commitment to sustainable energy and technological innovation in the solar industry.
Financially, Waaree Energies reported a trailing twelve months (TTM) revenue of approximately INR 220.6 billion, with a gross margin of 35.6%, operating margin of 21.95%, and net profit margin of 14.82%. The company’s return on equity (ROE) stands at 19.46%, return on assets (ROA) at 9.46%, and return on invested capital (ROIC) is reflected in an EV/EBITDA ratio of 19.95, indicating efficient capital use and profitability. These metrics underscore the company’s solid operational performance and profitability within the renewable energy sector.
From a valuation perspective, Waaree Energies trades at a trailing P/E ratio of 30.48 and a forward P/E of 20.79, with a price-to-book ratio of 8.66 and a PEG ratio of 0.18, suggesting growth expectations relative to earnings. The market capitalization is approximately INR 981.75 billion, with the stock currently priced at INR 3,056, situated between its 52-week low of INR 2,403 and high of INR 3,865. This pricing context reflects a premium valuation relative to industry peers, supported by strong growth prospects and market leadership.
The company’s strengths include robust cash flow generation with operating cash flow of INR 28.2 billion and levered free cash flow of INR 18.7 billion, a low debt-to-equity ratio of 0.25, and a significant order book valued at INR 53,000 crore. Key risks involve margin pressures evidenced in recent quarters, execution risks related to high capital expenditure, and competitive dynamics in the global solar equipment market. Recent strategic developments include securing a 350 MW battery energy storage EPC project and benefiting from U.S. policies restricting Chinese solar equipment imports, which may enhance its competitive positioning internationally.
Technically, the stock is trading above its 50-day moving average but slightly below the 200-day moving average, with momentum indicators showing mixed signals across multiple timeframes. Recent news highlights strong quarterly earnings growth alongside margin challenges, suggesting a nuanced outlook. Overall, the data indicates a market environment where careful monitoring of operational execution and valuation metrics is prudent, with conditions neither strongly favoring accumulation nor immediate realization of gains.
Company and Industry Overview
Company Basics
Price Performance
Company Size
Shareholding Pattern
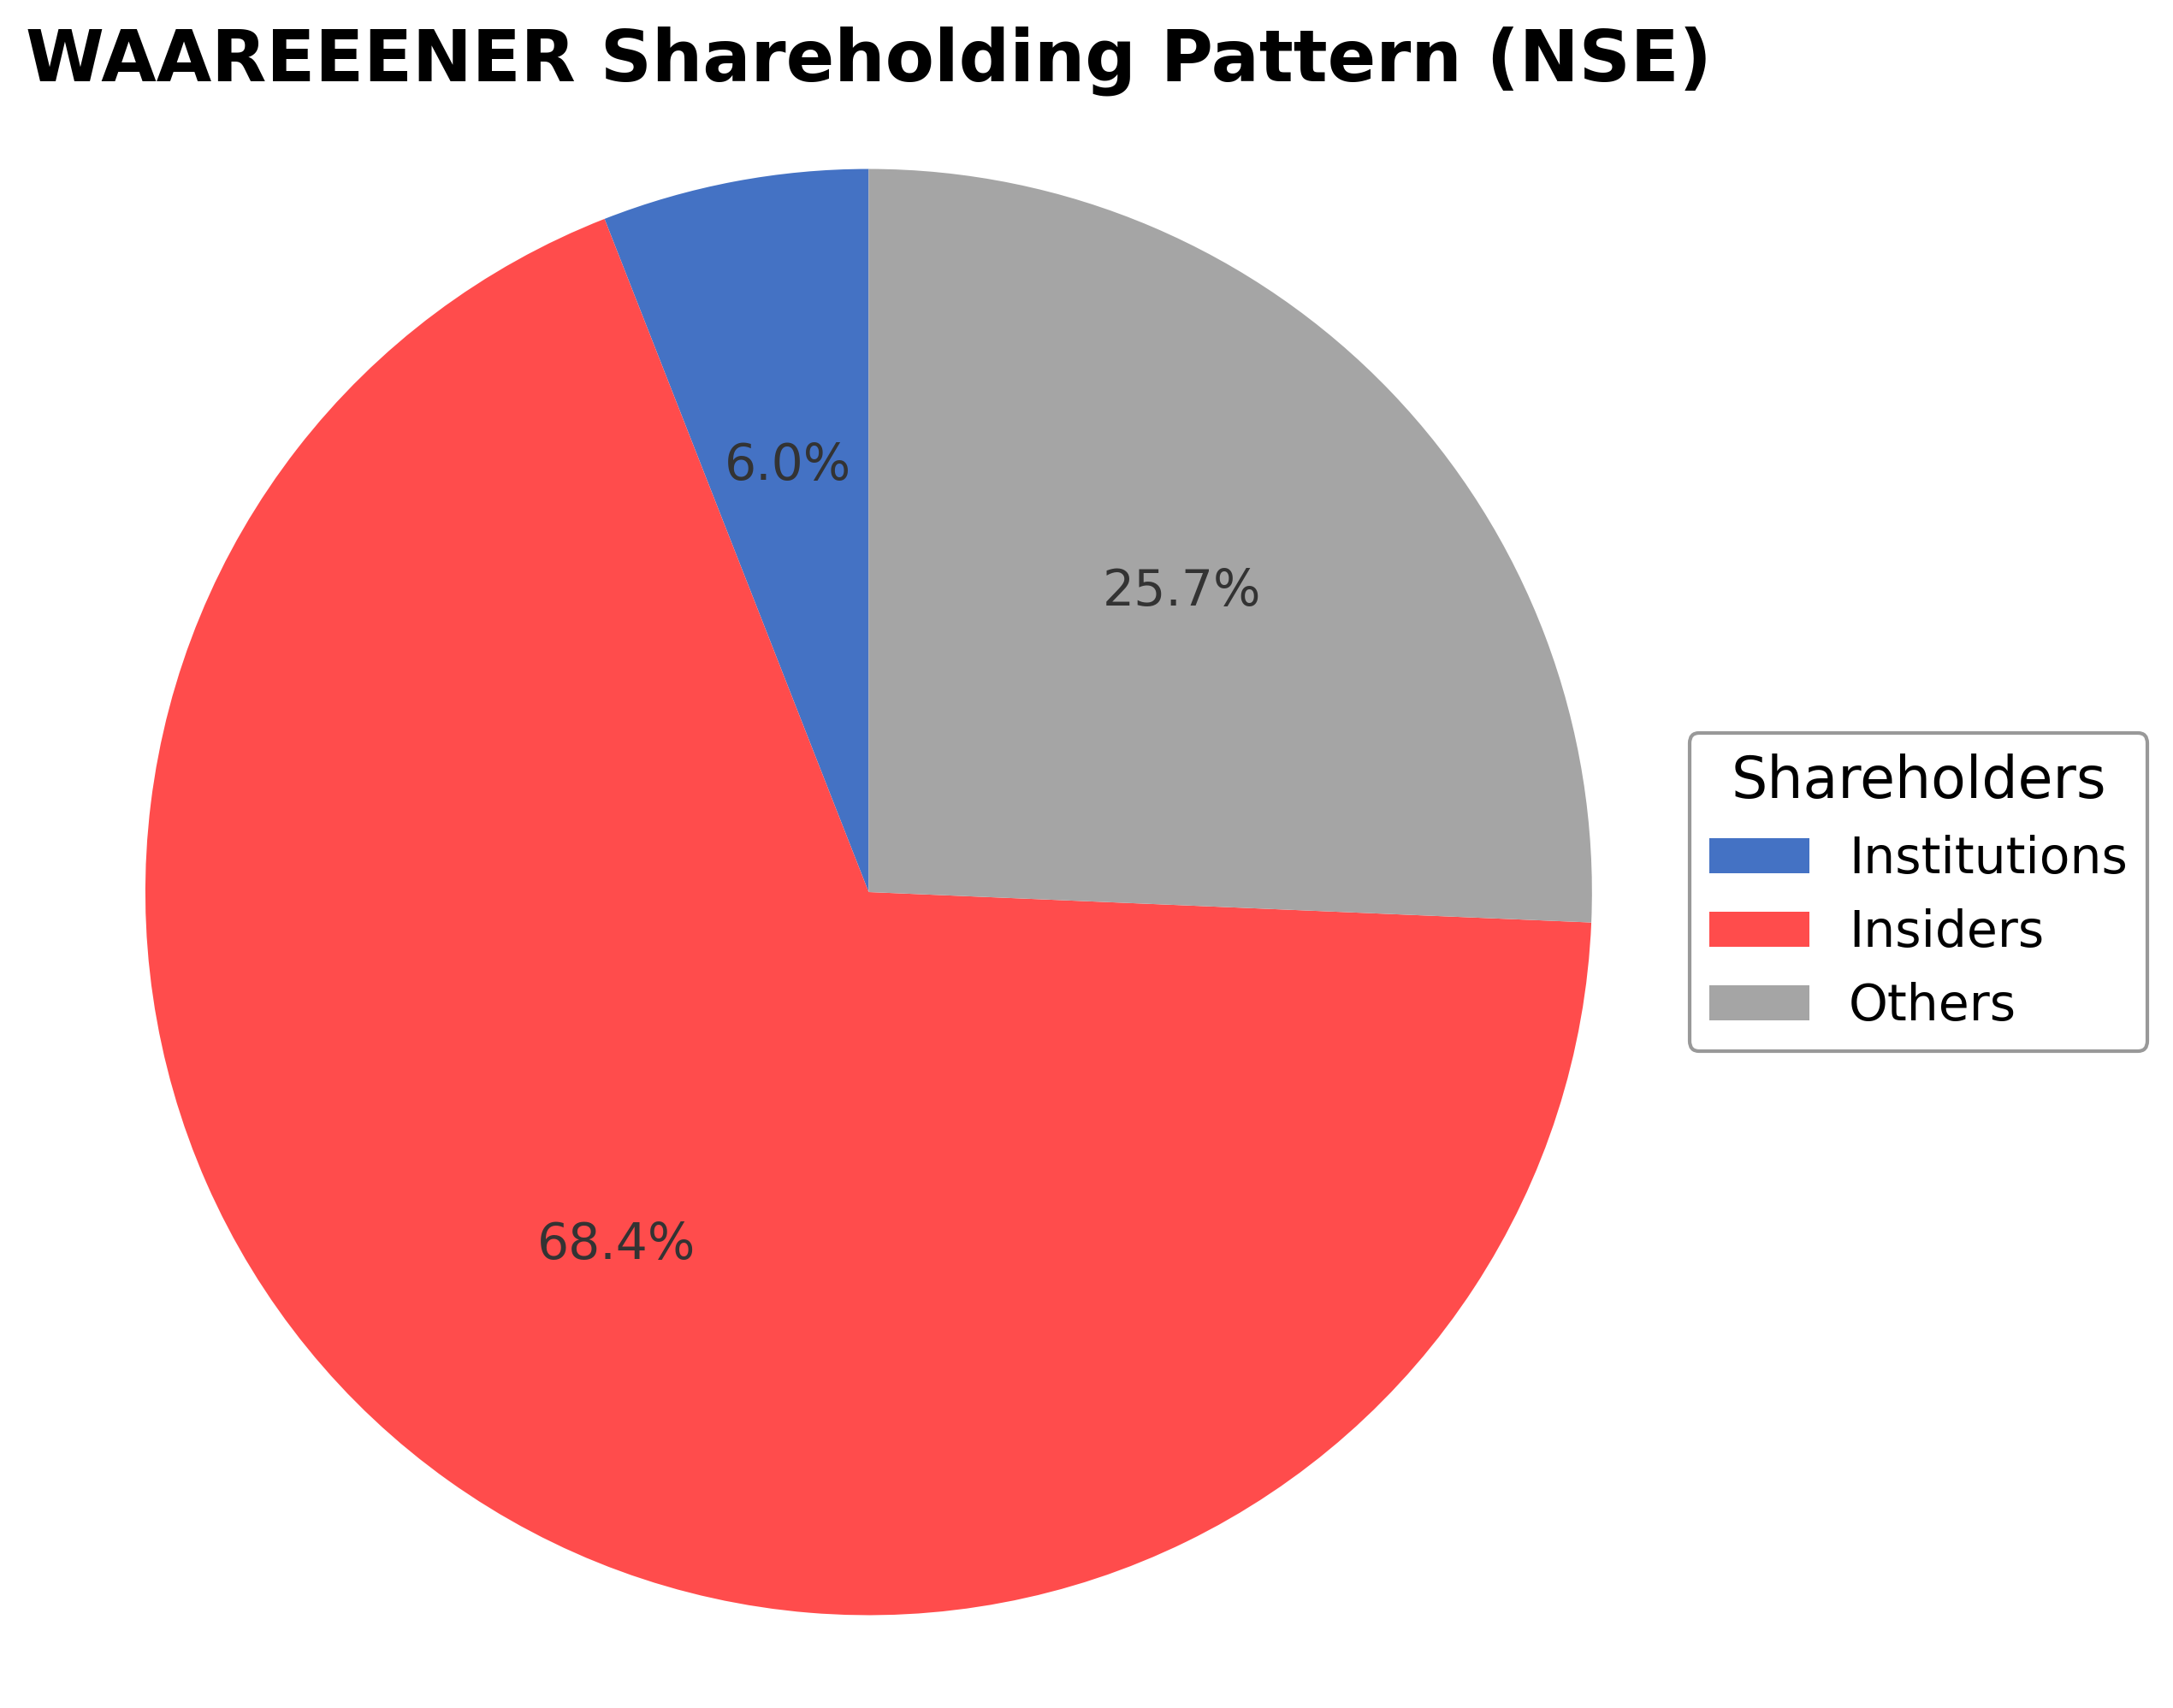
Waaree Energies Ltd. exhibits a shareholding structure dominated by insiders, including executives and board members, holding approximately 68.38% of shares, reflecting strong promoter control. Institutional investors account for 5.95%, indicating moderate institutional interest, while public and other shareholders hold the remaining 25.67%. Over the past 12 to 24 months, insider ownership has remained relatively stable, with no significant shifts in institutional accumulation or distribution reported. Major institutional stakeholders have maintained steady positions, suggesting a balanced market sentiment. This ownership pattern implies concentrated governance influence by promoters, which may affect strategic decisions and corporate actions, while institutional presence provides some external oversight. The structure aligns with typical Indian mid-to-large cap renewable energy firms, balancing promoter control with growing institutional participation.
Sector and Industry Analysis
The solar energy sector has experienced rapid expansion globally, driven by increasing demand for renewable energy and declining costs of photovoltaic (PV) technology. The market size has grown substantially, with installed solar capacity reaching multiple gigawatts annually, supported by government incentives and corporate sustainability goals. Key players include large multinational manufacturers, with Waaree Energies standing out as the largest non-Chinese solar module manufacturer, reflecting the sector's competitive scale and geographic diversification.
Industry trends highlight a shift towards higher efficiency PV modules, vertical integration, and scaling of manufacturing capacities to reduce costs and improve margins. Competitive dynamics are marked by intense price competition, technological innovation, and supply chain optimization, which create significant barriers to entry for new players. Established firms like Waaree leverage scale, operational efficiency, and market presence to maintain leadership, while smaller firms face challenges in achieving comparable cost structures and distribution networks.
The regulatory landscape is shaped by national and international policies promoting clean energy adoption, including subsidies, tax incentives, and import tariffs aimed at protecting domestic manufacturers. In India, government initiatives such as the National Solar Mission and production-linked incentives bolster local manufacturing and capacity expansion. These regulations support sector growth but also impose compliance requirements that influence investment decisions and operational strategies across the industry.
Note: Analysis synthesized from industry research, market reports, and regulatory filings. Information is subject to change based on market conditions.
Financial Ratios Dashboard
Illustrative Scenario Analysis
DCF Assumptions:
Method: Two-Stage EPS-Priority Model
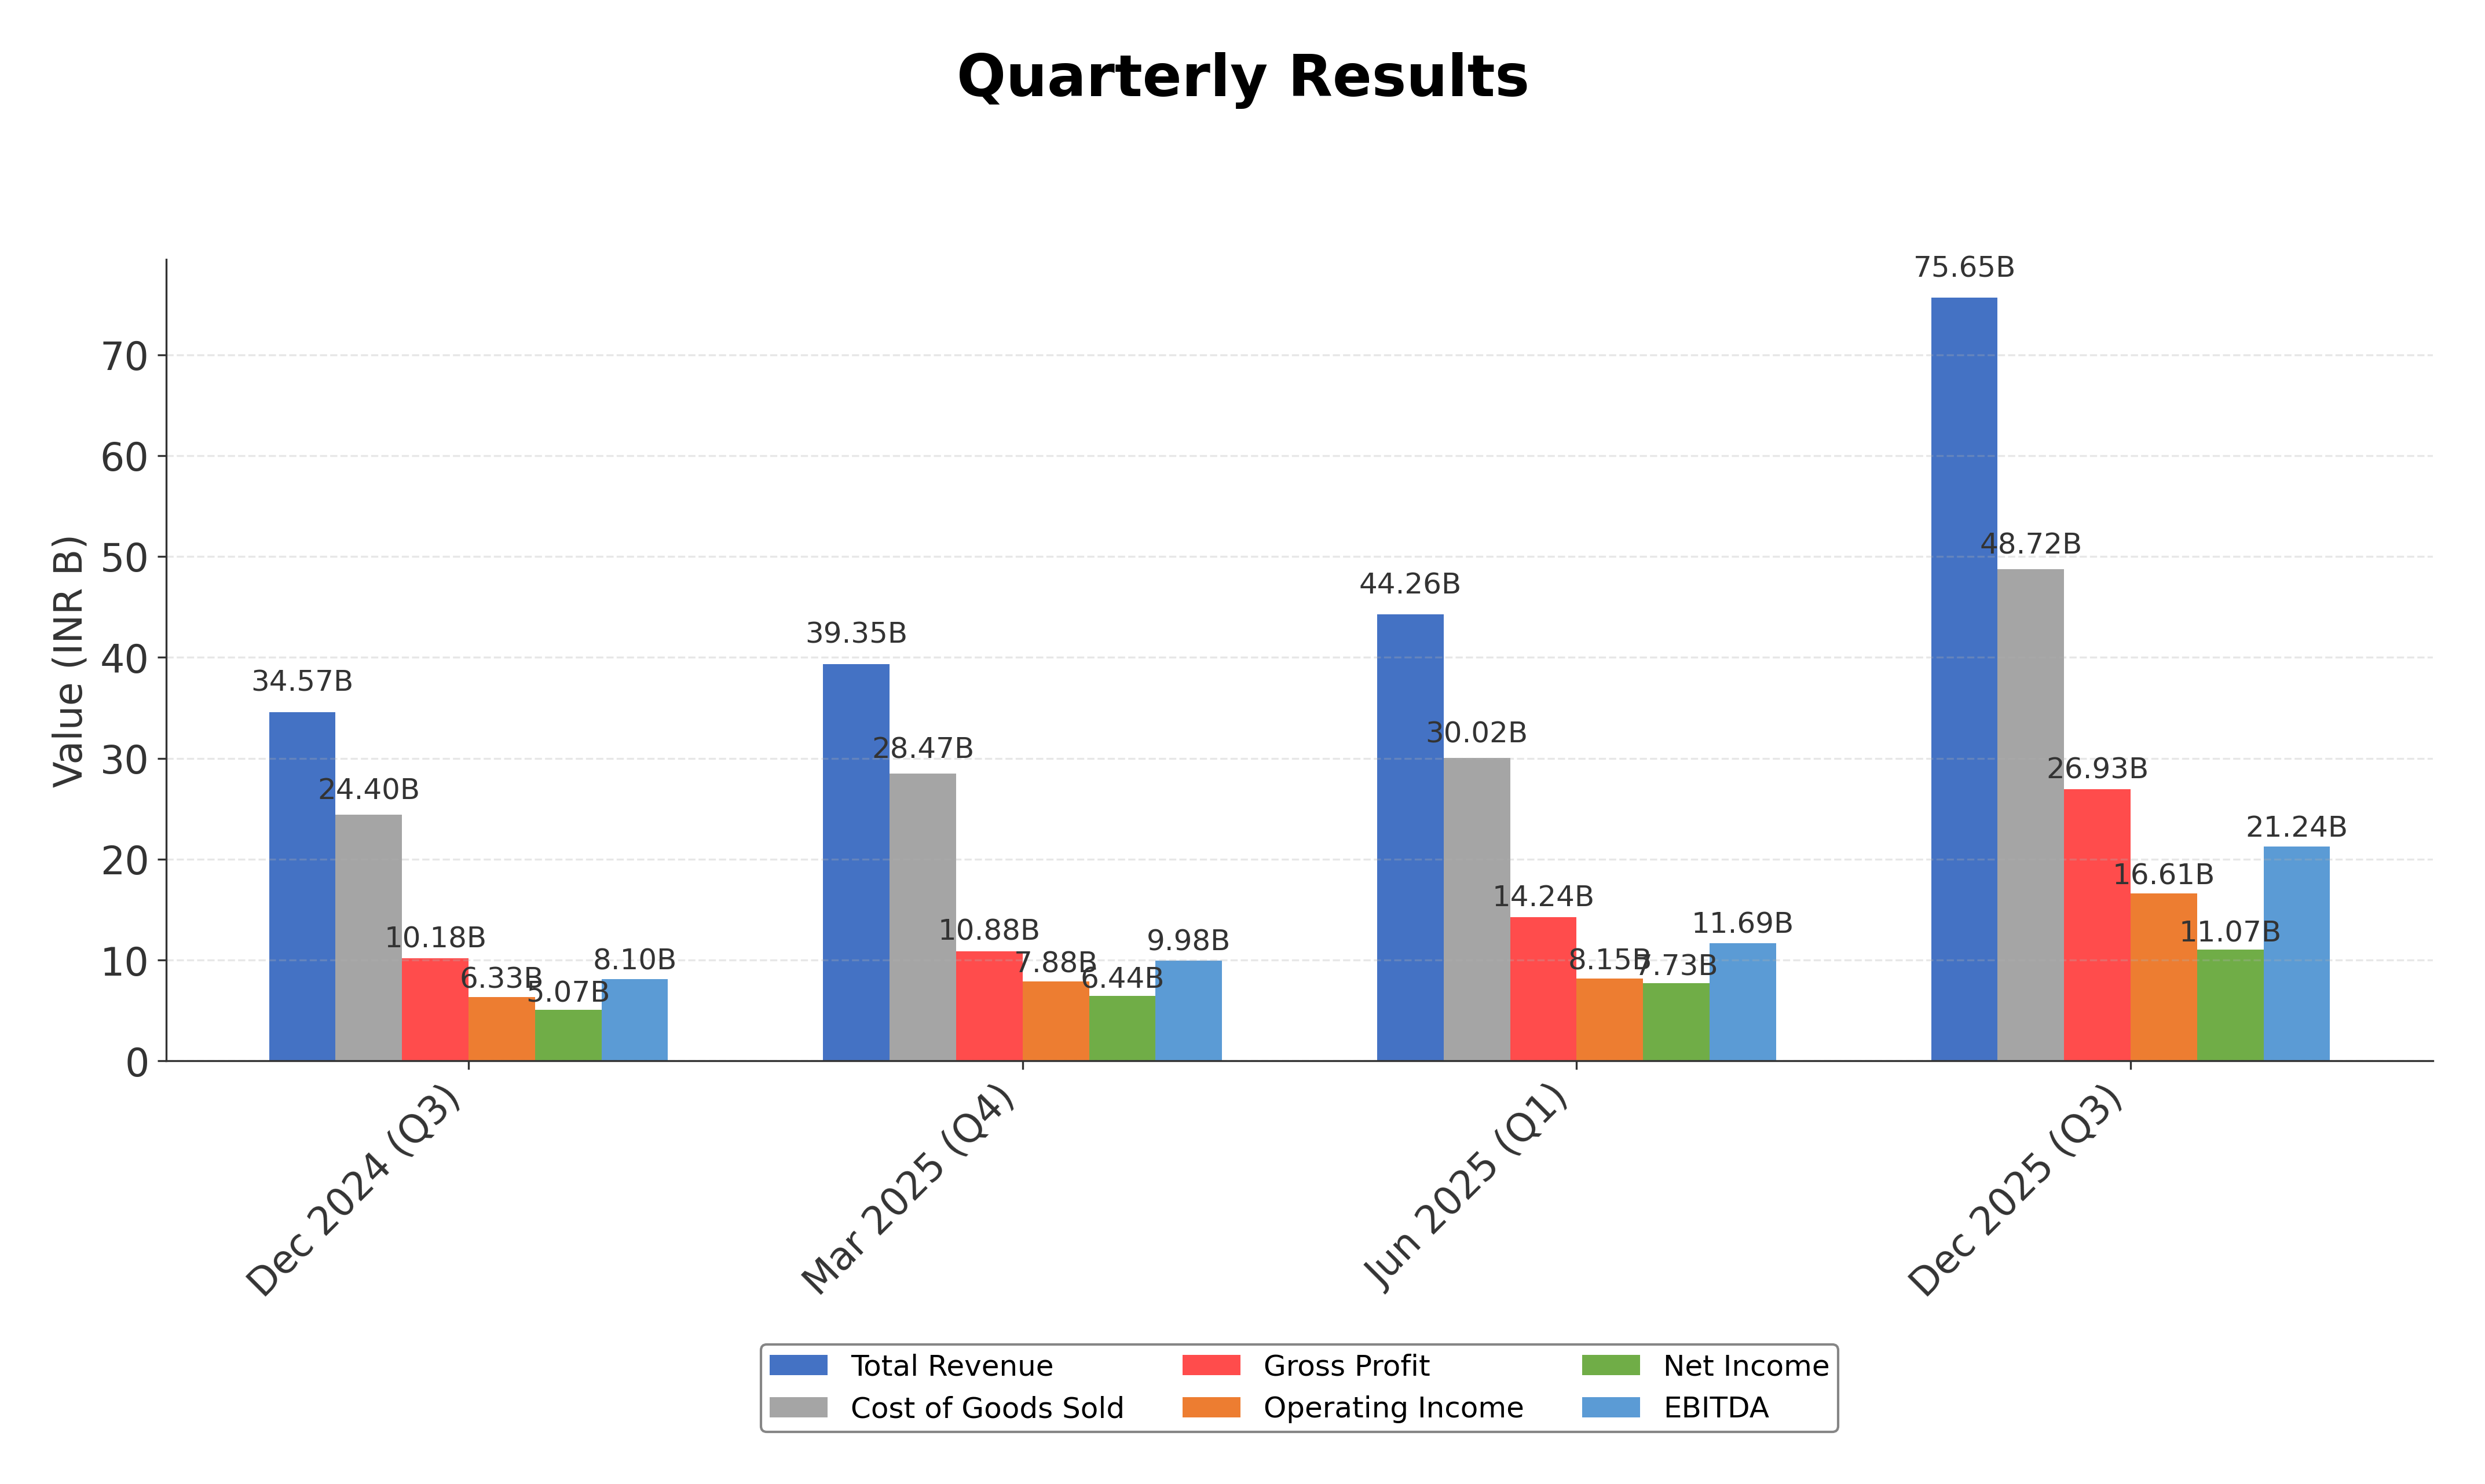
Financials
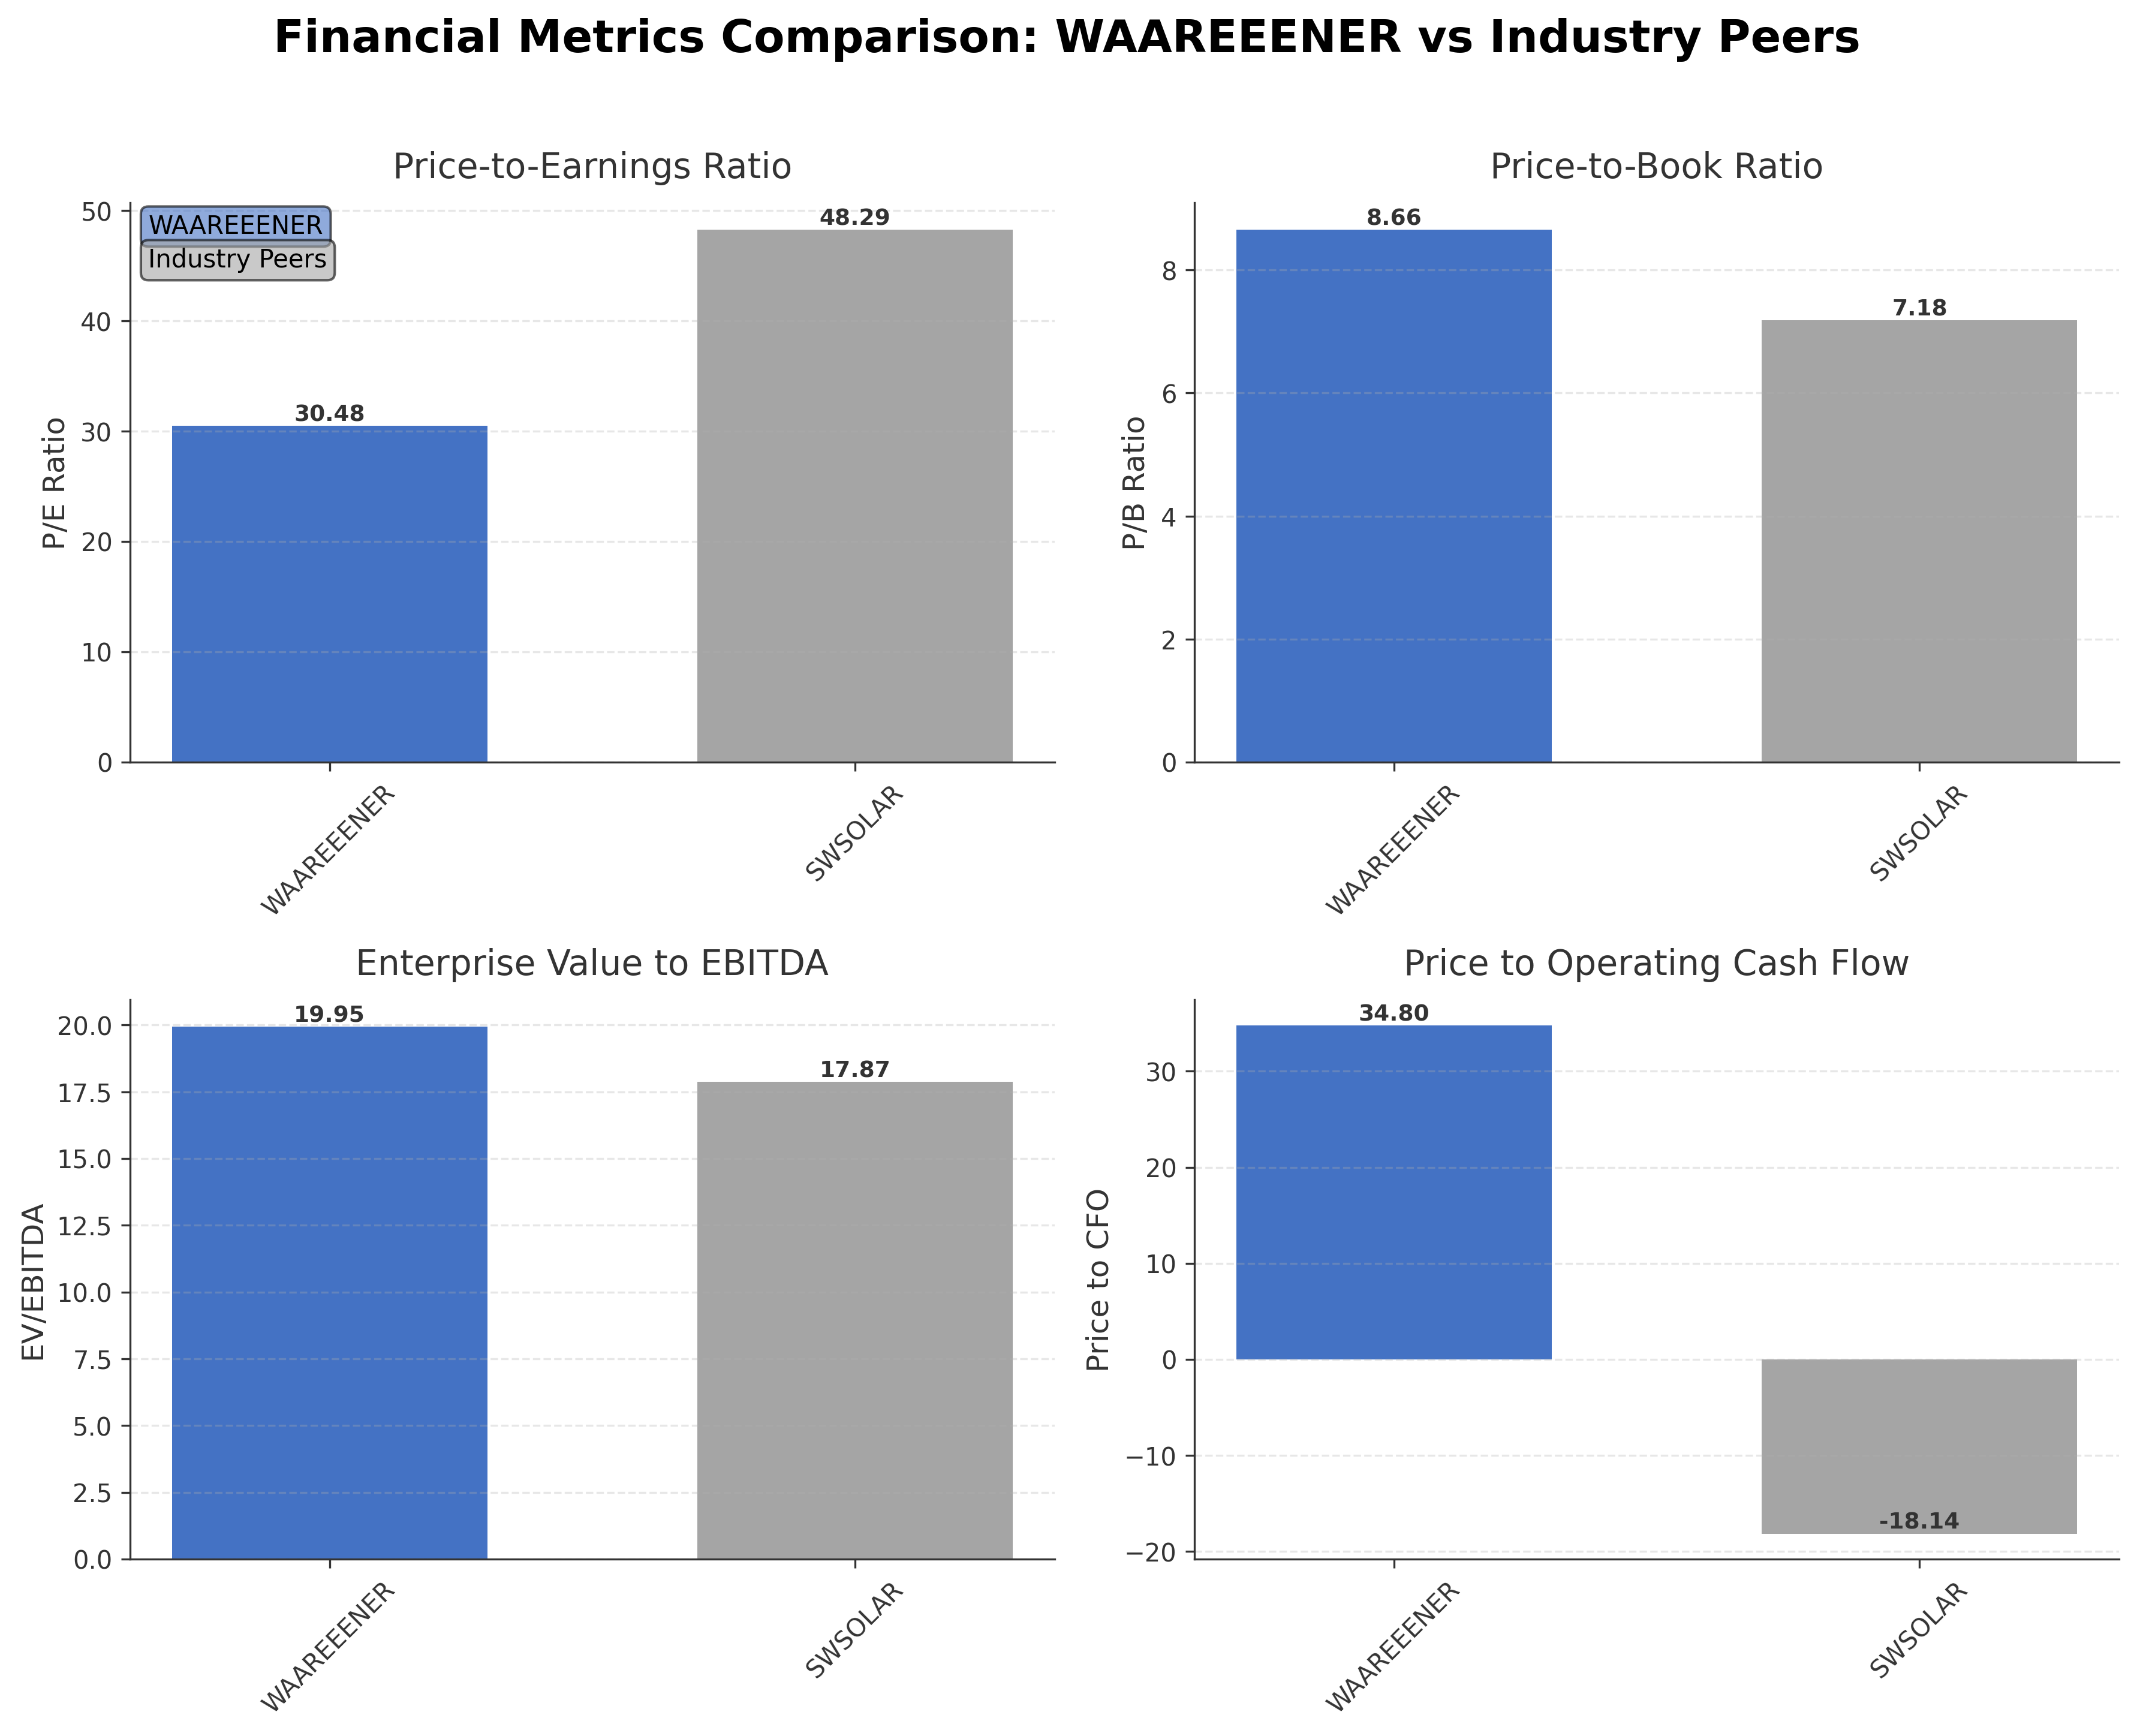
Peer Analysis
| Company Name | Market Cap | P/E Ratio | P/B Ratio | EV/EBITDA | Price to CFO |
|---|---|---|---|---|---|
| Waaree Energies Ltd. | ₹981.75B | 30.48 | 8.66 | 19.95 | 34.80 |
| Sterling and Wilson Renewable Energy Limited | ₹46.68B | 48.29 | 7.18 | 17.87 | -18.14 |
Comparison Analysis: Waaree Energies Ltd. significantly outpaces its peer Sterling and Wilson Renewable Energy Limited in market capitalization, with nearly 21 times greater valuation. Waaree's P/E ratio of 30.48 is notably lower than Sterling and Wilson's 48.29, indicating relatively more attractive earnings valuation. The price-to-book ratio of Waaree at 8.66 exceeds Sterling and Wilson's 7.18, reflecting a higher premium on net assets. Enterprise value to EBITDA is slightly higher for Waaree at 19.95 compared to 17.87, suggesting a more expensive valuation relative to operating earnings. Waaree's positive return on equity of 19.46% contrasts with Sterling and Wilson's negative ROE, highlighting stronger profitability and operational efficiency. Overall, Waaree Energies demonstrates superior financial performance and market stature within the Indian solar industry peer group.
Financial Metrics Comparison with Peers
Financial Statements
Comprehensive financial data including income, balance sheet, and cash flow metrics
Income Statement
| fiscal_date | 2025-03-31 | 2024-03-31 | 2023-03-31 | 2022-03-31 | 2021-03-31 |
|---|---|---|---|---|---|
| Sales | 143.76B | 113.98B | 66.08B | 28.44B | 19.42B |
| Cost Of Goods | 106.51B | 90.14B | 53.63B | 24.09B | 16.73B |
| Gross Profit | 37.24B | 23.84B | 12.45B | 4.35B | 2.69B |
| Operating Expense Selling General And Administrative | 7.12B | 6.32B | 4.26B | 2.71B | 1.34B |
| Operating Expense Other Operating Expenses | 144.60M | 176.49M | 9.69M | 51.67M | 18.68M |
| Operating Income | 23.38B | 12.98B | 6.75B | 708.88M | 673.19M |
| Non Operating Interest Income | 3.66B | 1.51B | 509.04M | 93.35M | 175.12M |
| Non Operating Interest Expense | 889.10M | 1.40B | 694.42M | 360.62M | 253.17M |
| Pretax Income | 25.65B | 17.34B | 6.77B | 1.18B | 665.45M |
| Income Tax | 6.37B | 4.60B | 1.77B | 387.23M | 209.40M |
| Net Income | 19.28B | 12.74B | 5.00B | 796.50M | 456.05M |
| Eps Basic | 68.24 | 43.06 | 16.80 | 2.63 | 1.62 |
| Eps Diluted | 67.96 | 43.06 | 16.80 | 2.63 | 1.62 |
| Basic Shares Outstanding | 273.67M | 287.28M | 287.28M | 287.28M | 287.28M |
| Diluted Shares Outstanding | 273.67M | 287.28M | 287.28M | 287.28M | 287.28M |
| Ebit | 26.54B | 18.74B | 7.47B | 1.54B | 918.62M |
| Ebitda | 30.62B | 18.10B | 9.25B | 1.87B | 1.19B |
| Net Income Continuous Operations | 25.65B | 17.34B | 6.77B | 1.18B | 665.45M |
| Minority Interests | -607.40M | -372.00M | -175.17M | -40.11M | 9.89M |
| Preferred Stock Dividends | 0.00 | 0.00 | 0.00 | 0.00 | 0.00 |
Source: Financial statements and regulatory filings
Balance Sheet
| fiscal_date | 2025-03-31 | 2024-03-31 | 2023-03-31 | 2022-03-31 | 2021-03-31 |
|---|---|---|---|---|---|
| Cash And Cash Equivalents | 5.10B | 1.21B | 1.97B | 477.57M | 63.16M |
| Accounts Receivable | 11.85B | 9.71B | 3.13B | 925.24M | 1.18B |
| Total Assets | 197.47B | 113.14B | 74.20B | 22.37B | 12.93B |
| Total Liabilities | 101.52B | 71.65B | 55.58B | 17.98B | 9.00B |
| Long Term Debt | 2.48B | 3.10B | 1.84B | 2.32B | 2.33B |
| Shareholders Equity | 95.95B | 41.48B | 18.62B | 4.40B | 3.93B |
Source: Financial statements and regulatory filings
Cash Flow Statement
| fiscal_date | 2025-03-31 | 2024-03-31 | 2023-03-31 | 2022-03-31 | 2021-03-31 |
|---|---|---|---|---|---|
| Operating Activities Net Income | 25.65B | 17.34B | 6.77B | 1.18B | 665.45M |
| Operating Activities Stock Based Compensation | 146.40M | 98.30M | 366.81M | 0.00 | 0.00 |
| Operating Activities Other Non Cash Items | -2.77B | -265.60M | 185.38M | 267.48M | 83.76M |
| Operating Activities Accounts Receivable | -2.23B | -6.70B | -2.15B | 214.75M | 208.95M |
| Operating Activities Other Assets Liabilities | 7.42B | 10.46B | -1.38B | 3.36B | -911.47M |
| Operating Activities Operating Cash Flow | 28.21B | 20.94B | 3.79B | 5.03B | 46.69M |
| Investing Activities Capital Expenditures | -32.73B | -13.37B | -8.62B | -4.96B | -1.93B |
| Investing Activities Purchase Of Investments | -151.47B | -79.41B | -36.45B | -7.52B | -2.78B |
| Investing Activities Sale Of Investments | 113.06B | 58.24B | 23.81B | 4.90B | 1.98B |
| Investing Activities Investing Cash Flow | -71.14B | -34.54B | -21.26B | -7.16B | -2.77B |
| Financing Activities Long Term Debt Issuance | 8.09B | 7.79B | 163.95M | 1.72B | 2.01B |
| Financing Activities Long Term Debt Payments | -1.87B | -7.38B | -1.67B | -312.65M | -361.25M |
| Financing Activities Common Stock Issuance | 35.08B | 10.04B | 10.40B | 0.00 | 0.00 |
| Financing Activities Financing Cash Flow | 41.30B | 10.45B | 7.40B | 1.40B | 1.65B |
| End Cash Position | 5.10B | 1.21B | 2.54B | 1.39B | 128.20M |
| Free Cash Flow | -1.16B | 9.63B | 6.95B | 2.04B | -1.26B |
| Investing Activities Net Acquisitions | N/A | 0.00 | 0.00 | 416.14M | -37.29M |
| Financing Activities Common Dividends | N/A | -5.30M | -2.65M | -4.76M | N/A |
| Financing Activities Other Financing Charges | N/A | -600.00K | -1.49B | N/A | N/A |
Source: Financial statements and regulatory filings
Technical Analysis
Key Insights
- Waaree Energies is currently exhibiting a mixed trend with price action consolidating between the 50-day moving average at INR 3,020.47 and the 200-day moving average at INR 3,112.69, indicating a neutral to slightly bullish intermediate trend.
- Key support levels are identified near INR 2,950 and INR 2,800, while resistance is observed around INR 3,200 and the 52-week high of INR 3,865, which may act as a significant barrier.
- The stock price is trading above the 10-day moving average but remains below the 200-day moving average, suggesting short-term strength amid longer-term consolidation.
- Momentum indicators show the Relative Strength Index (RSI) hovering around neutral levels near 50, the MACD line is close to the signal line indicating limited momentum, and the Stochastic oscillator reflects a mid-range position, all pointing to an equilibrium between buying and selling pressures.
- Multi-timeframe analysis reveals that daily charts show sideways movement, weekly charts indicate a mild uptrend, and monthly charts suggest a longer-term consolidation phase.
- Potential market scenarios include a breakout above the 200-day moving average leading to renewed upward momentum or a breakdown below key support levels triggering increased selling pressure.
Trending News
1. Headline: Top stocks to buy today: Stock recommendations for May 20, 2026 - check list
Summary: India Business News: Stock market recommendations: Ashok Leyland, Bikaji Foods International, and Waaree Energies have been picked as the top stocks to buy on May 20, 2026.
Sentiment: neutral
2. Headline: Waaree Energies Share: How U.S. Policy Against Chinese Solar Equipment Is Benefiting the Company
Summary: India's largest solar module maker is moving fast. With geopolitical pressures reshaping global supply chains and US policy pushing hard against Chinese solar equipment, the company is treating this moment as a once-in-a-decade opportunity.
Sentiment: positive
3. Headline: Solar Stock in Focus After Securing 350 MW Battery Energy Storage System Project
Summary: The shares of this small cap company majorly engaged in the business of generation of power through renewable energy sources and also provides consultancy services, were in focus after it bags 350 MW battery storage EPC order.
Sentiment: neutral
4. Headline: Premier Energies: Buy, hold or sell this Waaree peer? 3 key triggers, share price targets - BusinessToday
Summary: Premier Energies: MOFSL said the key monitorables would be the timely commissioning and ramp-up of the upcoming 7GW cell manufacturing capacity
Sentiment: neutral
Summary: Waaree Energies Share Price: Find the latest news on Waaree Energies Stock Price. Get all the information on Waaree Energies with historic price charts for NSE / BSE. Experts & Broker view also get the Waaree Energies Ltd. buy/sell tips detailed news, announcements, Forecasts, Analysts, Valuation, ...
Sentiment: neutral
Recent Updates
News Summary
As of April 30, 2026. Waaree Energies released its Q4FY26 investor presentation highlighting record financial results with revenue of INR 8,480.25 crore, a 111.80% year-on-year increase, and profit after tax of INR 1,126.26 crore, up 74.76% YoY. For the full fiscal year FY26, the company reported revenue of INR 26,536.77 crore and PAT of INR 3,884.15 crore, demonstrating strong operational performance. Despite margin pressures in Q4, Waaree provided robust EBITDA guidance for FY27 between INR 7,000 and 7,700 crore, signaling confidence in future growth. The company also secured a significant 350 MW battery energy storage EPC project, expanding its renewable energy portfolio amid execution risks and high capital expenditure requirements.
News Sentiment
The overall sentiment from recent updates is cautiously optimistic, reflecting strong revenue and profit growth alongside strategic expansion in energy storage projects. Positive investor presentations and guidance contrast with margin pressures and execution risks, creating a balanced outlook. Market reactions have been mixed but generally supportive, with dividend announcements and operational milestones reinforcing confidence. The sentiment is tempered by concerns over near-term cost pressures and capital intensity, highlighting the importance of execution in sustaining growth momentum.
Source List
- https://scanx.trade/stock-market-news/companies/waaree-energies-schedules-q4fy26-investor-presentation-for-april-30-2026/39048816
- https://www.whalesbook.com/news/English/renewables/Waaree-Energies-Earnings-Hit-by-Margin-Squeeze-FY27-Guidance-Strong/69f867769d1c906648219503
- https://upstox.com/news/market-news/stocks/waaree-energies-ntpc-green-premier-energies-suzlon-energy-how-renewable-energy-stocks-are-performing-on-may-6-2026/article-193223/
Analytical Overview
Analysis Summary
Waaree Energies’ valuation metrics, including a trailing P/E of 30.48 and forward P/E of 20.79, are in line with the solar industry average P/E of 30.48, indicating a valuation consistent with sector expectations. The low PEG ratio of 0.18 suggests the market anticipates strong earnings growth relative to price. The company’s revenue growth of 18.8% quarter-over-quarter and positive cash flow trends, with operating cash flow of INR 28.2 billion and free cash flow of INR 18.7 billion, demonstrate a healthy growth trajectory and operational cash generation. Financial health is supported by a conservative debt-to-equity ratio of 0.25 and a current ratio near 1.5, indicating manageable leverage and liquidity. Sector-specific opportunities include favorable U.S. policy shifts benefiting domestic solar manufacturers and increasing demand for renewable energy infrastructure in India, while challenges include margin pressures and capital expenditure intensity. Given the company’s Indian market base, regulatory frameworks promoting clean energy and evolving consumer trends toward sustainability further influence its growth prospects.
Overall Business and Market Assessment
Supporting Factors: Waaree Energies’ strong revenue and profit growth, robust cash flow generation, and strategic positioning benefiting from geopolitical shifts in solar equipment supply chains
Risk Factors: margin compression, execution challenges related to high capital investments, and competitive pressures in the renewable energy sector
SWOT Analysis
Strengths
- Leading solar photovoltaic manufacturer with one of India’s largest production facilities.
- Strong revenue growth with 111.8% YoY increase in Q4 FY26.
- Robust cash flow generation and low debt-to-equity ratio of 0.25.
- Strategic advantage from U.S. policies restricting Chinese solar imports.
Weaknesses
- Margin pressures observed in recent quarters.
- High capital expenditure requirements pose execution risks.
- Price-to-book ratio of 8.66 indicates premium valuation.
- Limited institutional ownership at 5.95% may constrain external oversight.
Opportunities
- Expanding battery energy storage projects with 350 MW EPC order secured.
- Growing demand for renewable energy in India and globally.
- Favorable regulatory environment promoting clean energy adoption.
- Potential to increase international market share due to geopolitical shifts.
Threats
- Competitive pressures from global and domestic solar equipment manufacturers.
- Execution risks associated with rapid capacity expansion.
- Volatility in raw material prices impacting margins.
Company Description
Waaree Energies Ltd. is a prominent player in the renewable energy sector, primarily focusing on the manufacturing and distribution of solar photovoltaic modules. The company's core mission is to harness solar energy's potential to provide sustainable power solutions across India and globally. Known for its advanced photovoltaic manufacturing capabilities, Waaree Energies operates one of the largest solar panel production facilities in India, showcasing its commitment to high-quality and efficient solar technology. Beyond manufacturing, the company extends its expertise to project development and engineering, procurement, and construction (EPC) services, supporting large-scale solar installations and infrastructure. Waaree Energies significantly influences sectors such as residential, commercial, and utility solar energy markets, contributing to the broader global agenda of reducing carbon footprints and promoting clean energy alternatives. In the financial markets, Waaree Energies plays a vital role, illustrating the growing importance and economic impact of renewable energy initiatives worldwide. The company is pivotal in driving technological advancements and fostering sustainable energy policies, underpinning its stature in shaping the future energy landscape.