
Vishnu Prakash R. Punglia Ltd (VPRPL)
Stock Analysis Report
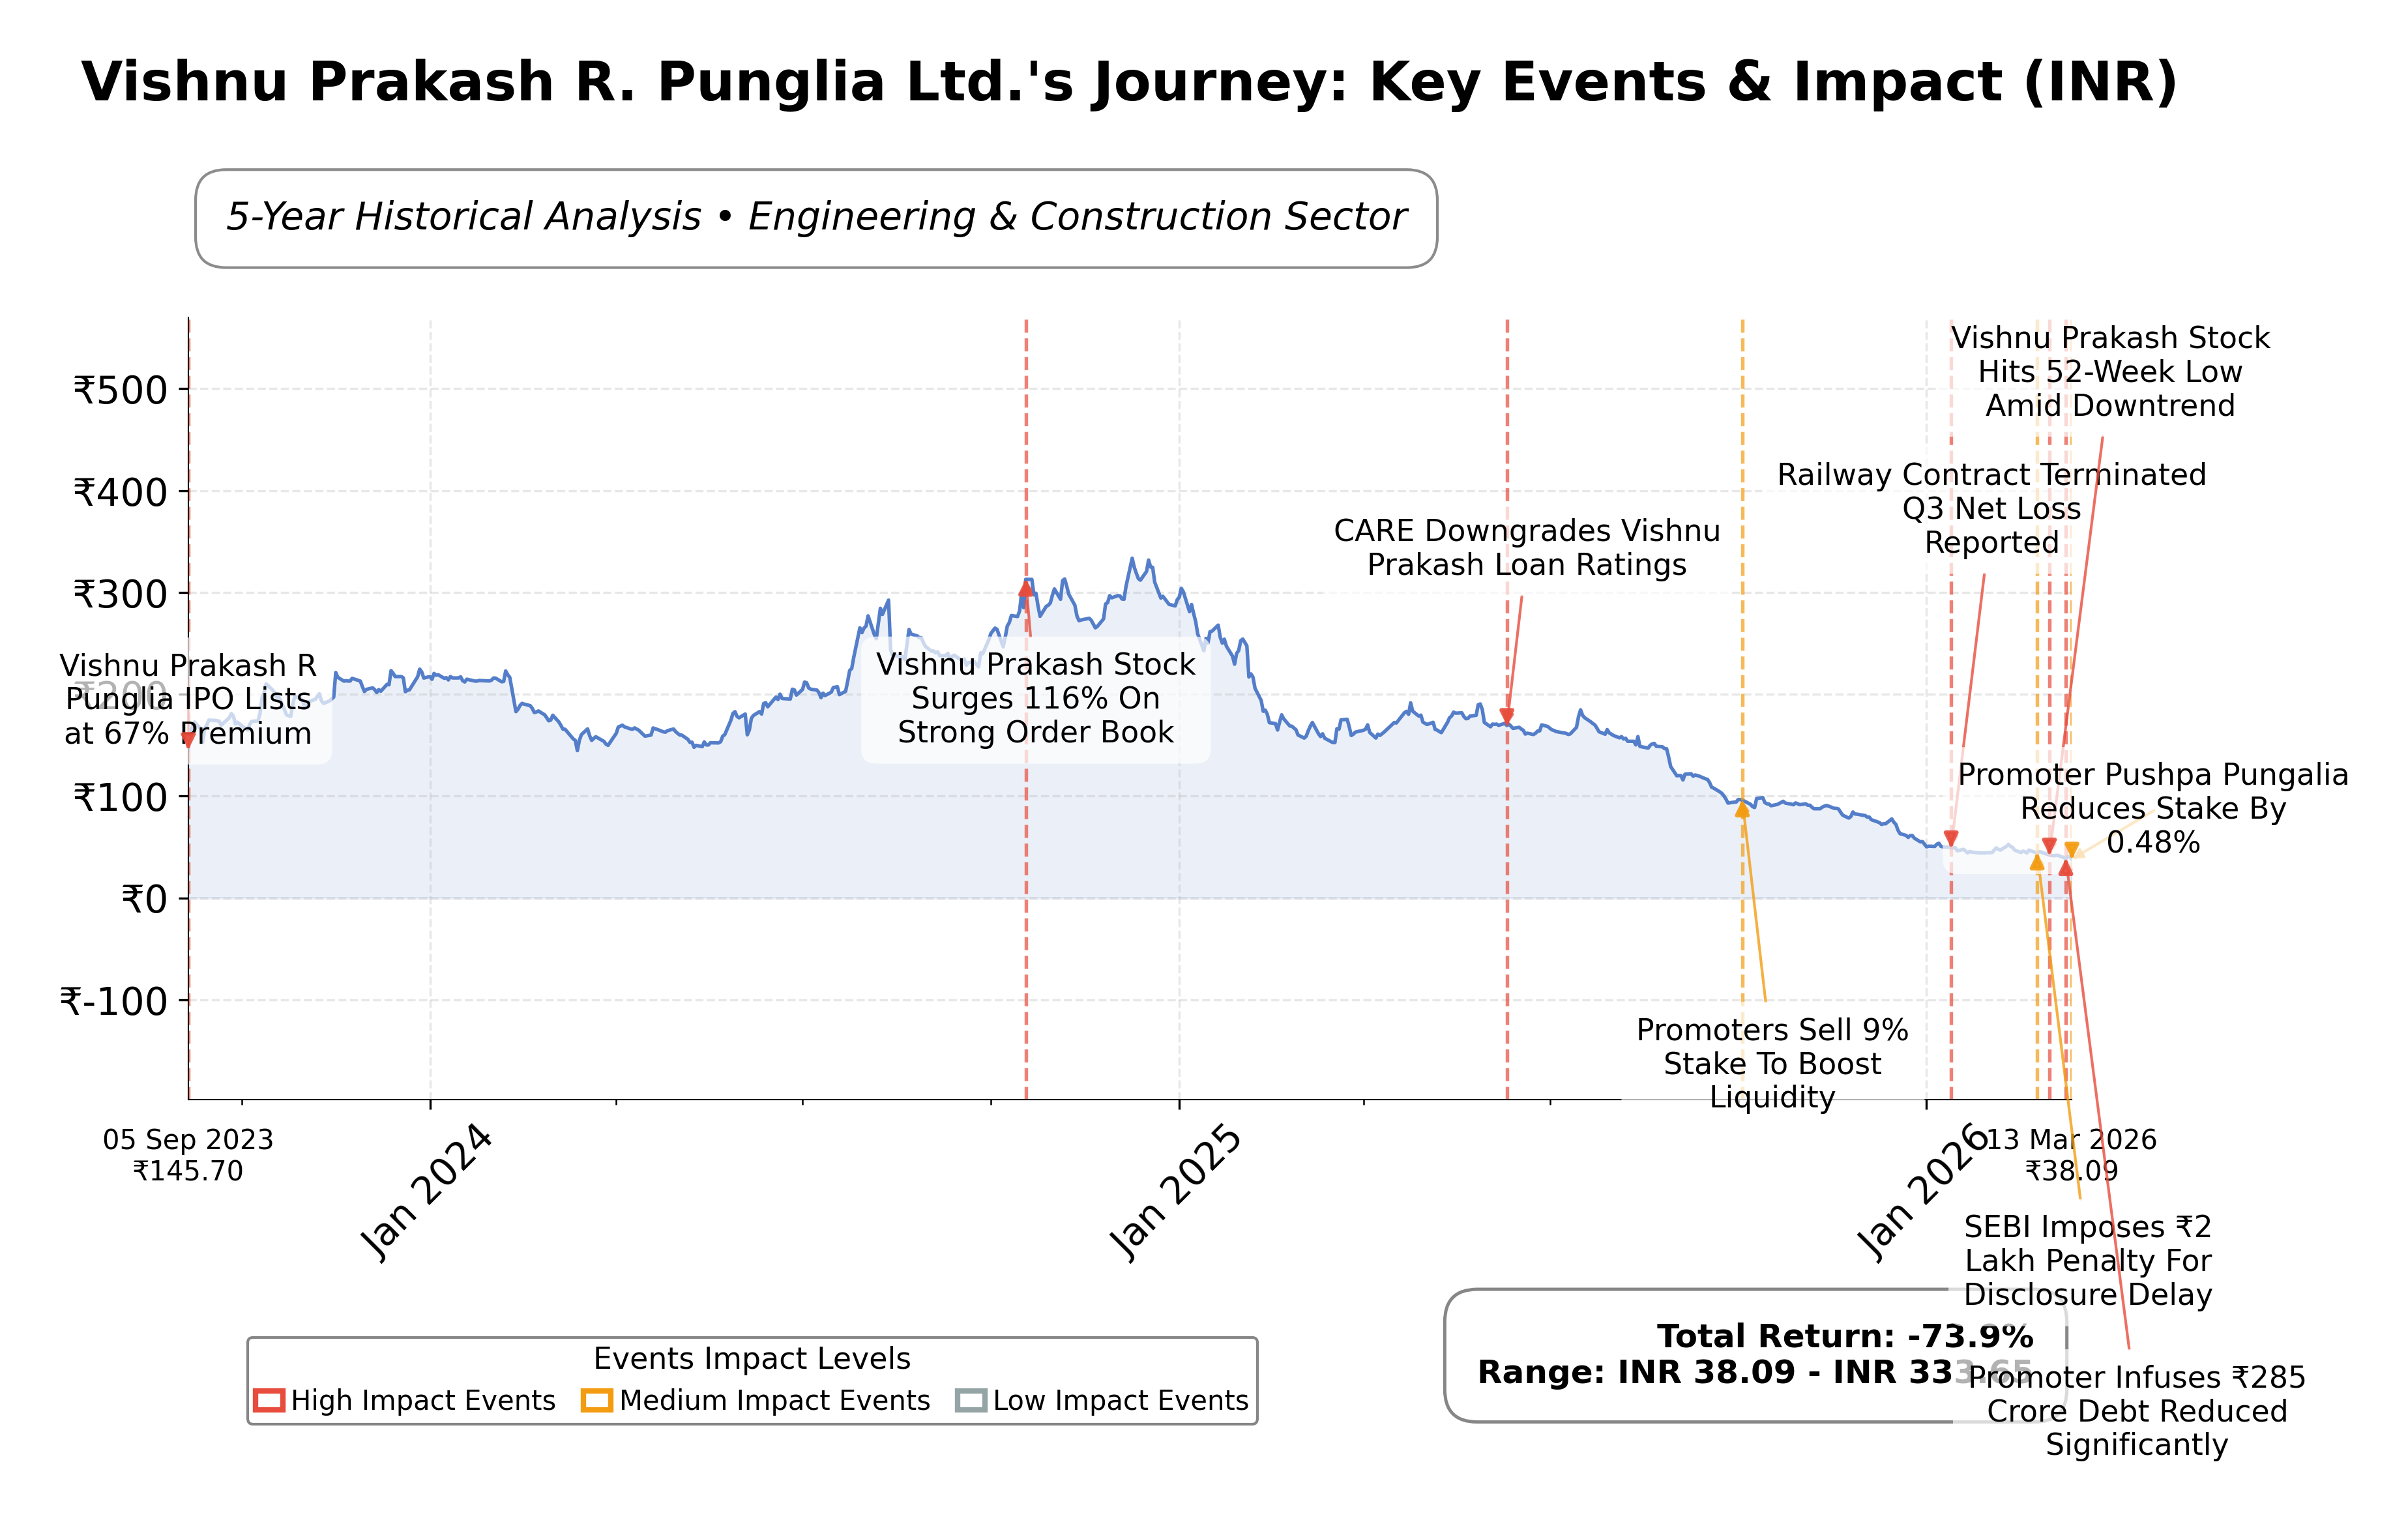
Stock Journey
Key Positives and Key Risks
Pros
- Promoter capital infusion of ₹285 crore has strengthened the company’s liquidity and balance sheet.
- Debt reduction by approximately 50% has lowered financial leverage and associated risks.
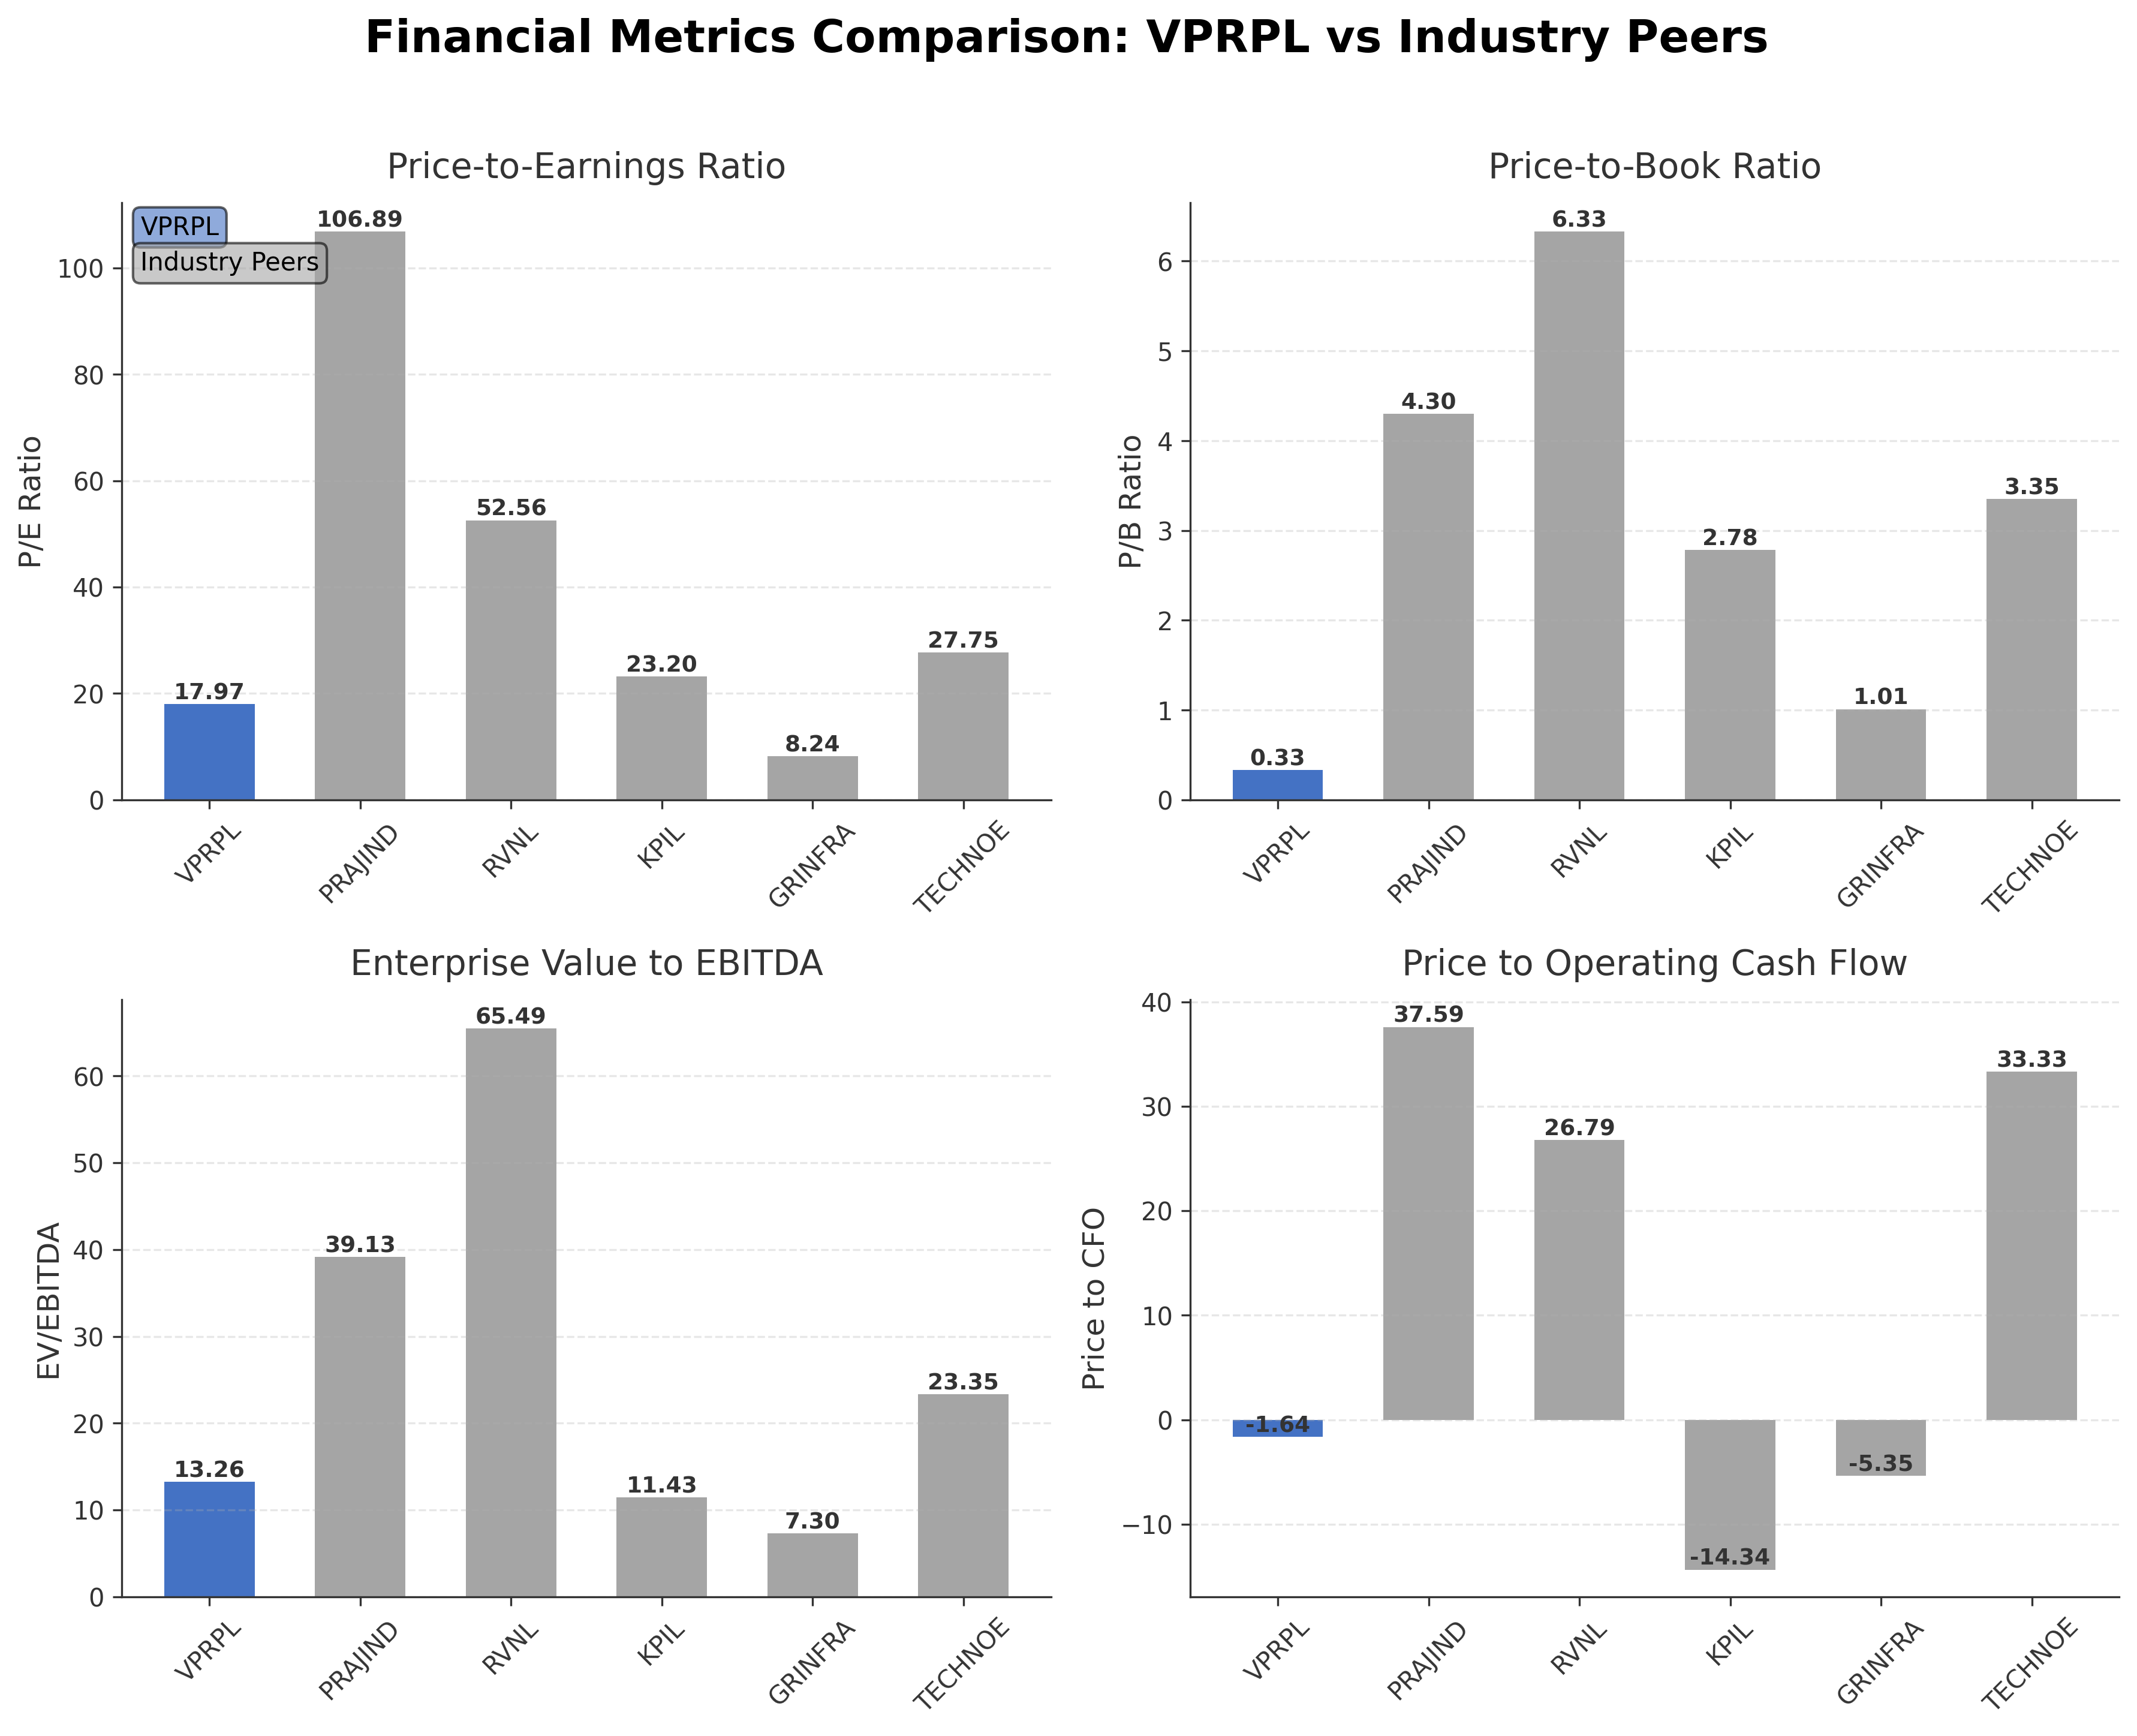
- Valuation metrics such as P/E ratio (17.97) and price-to-book ratio (0.33) are aligned with or below industry averages, indicating potential value.
Cons
- Negative net income of ₹30.82 million and operating margin of -10.44% indicate ongoing profitability challenges.
- High debt-to-equity ratio of 90.7% reflects significant financial leverage and potential risk exposure.
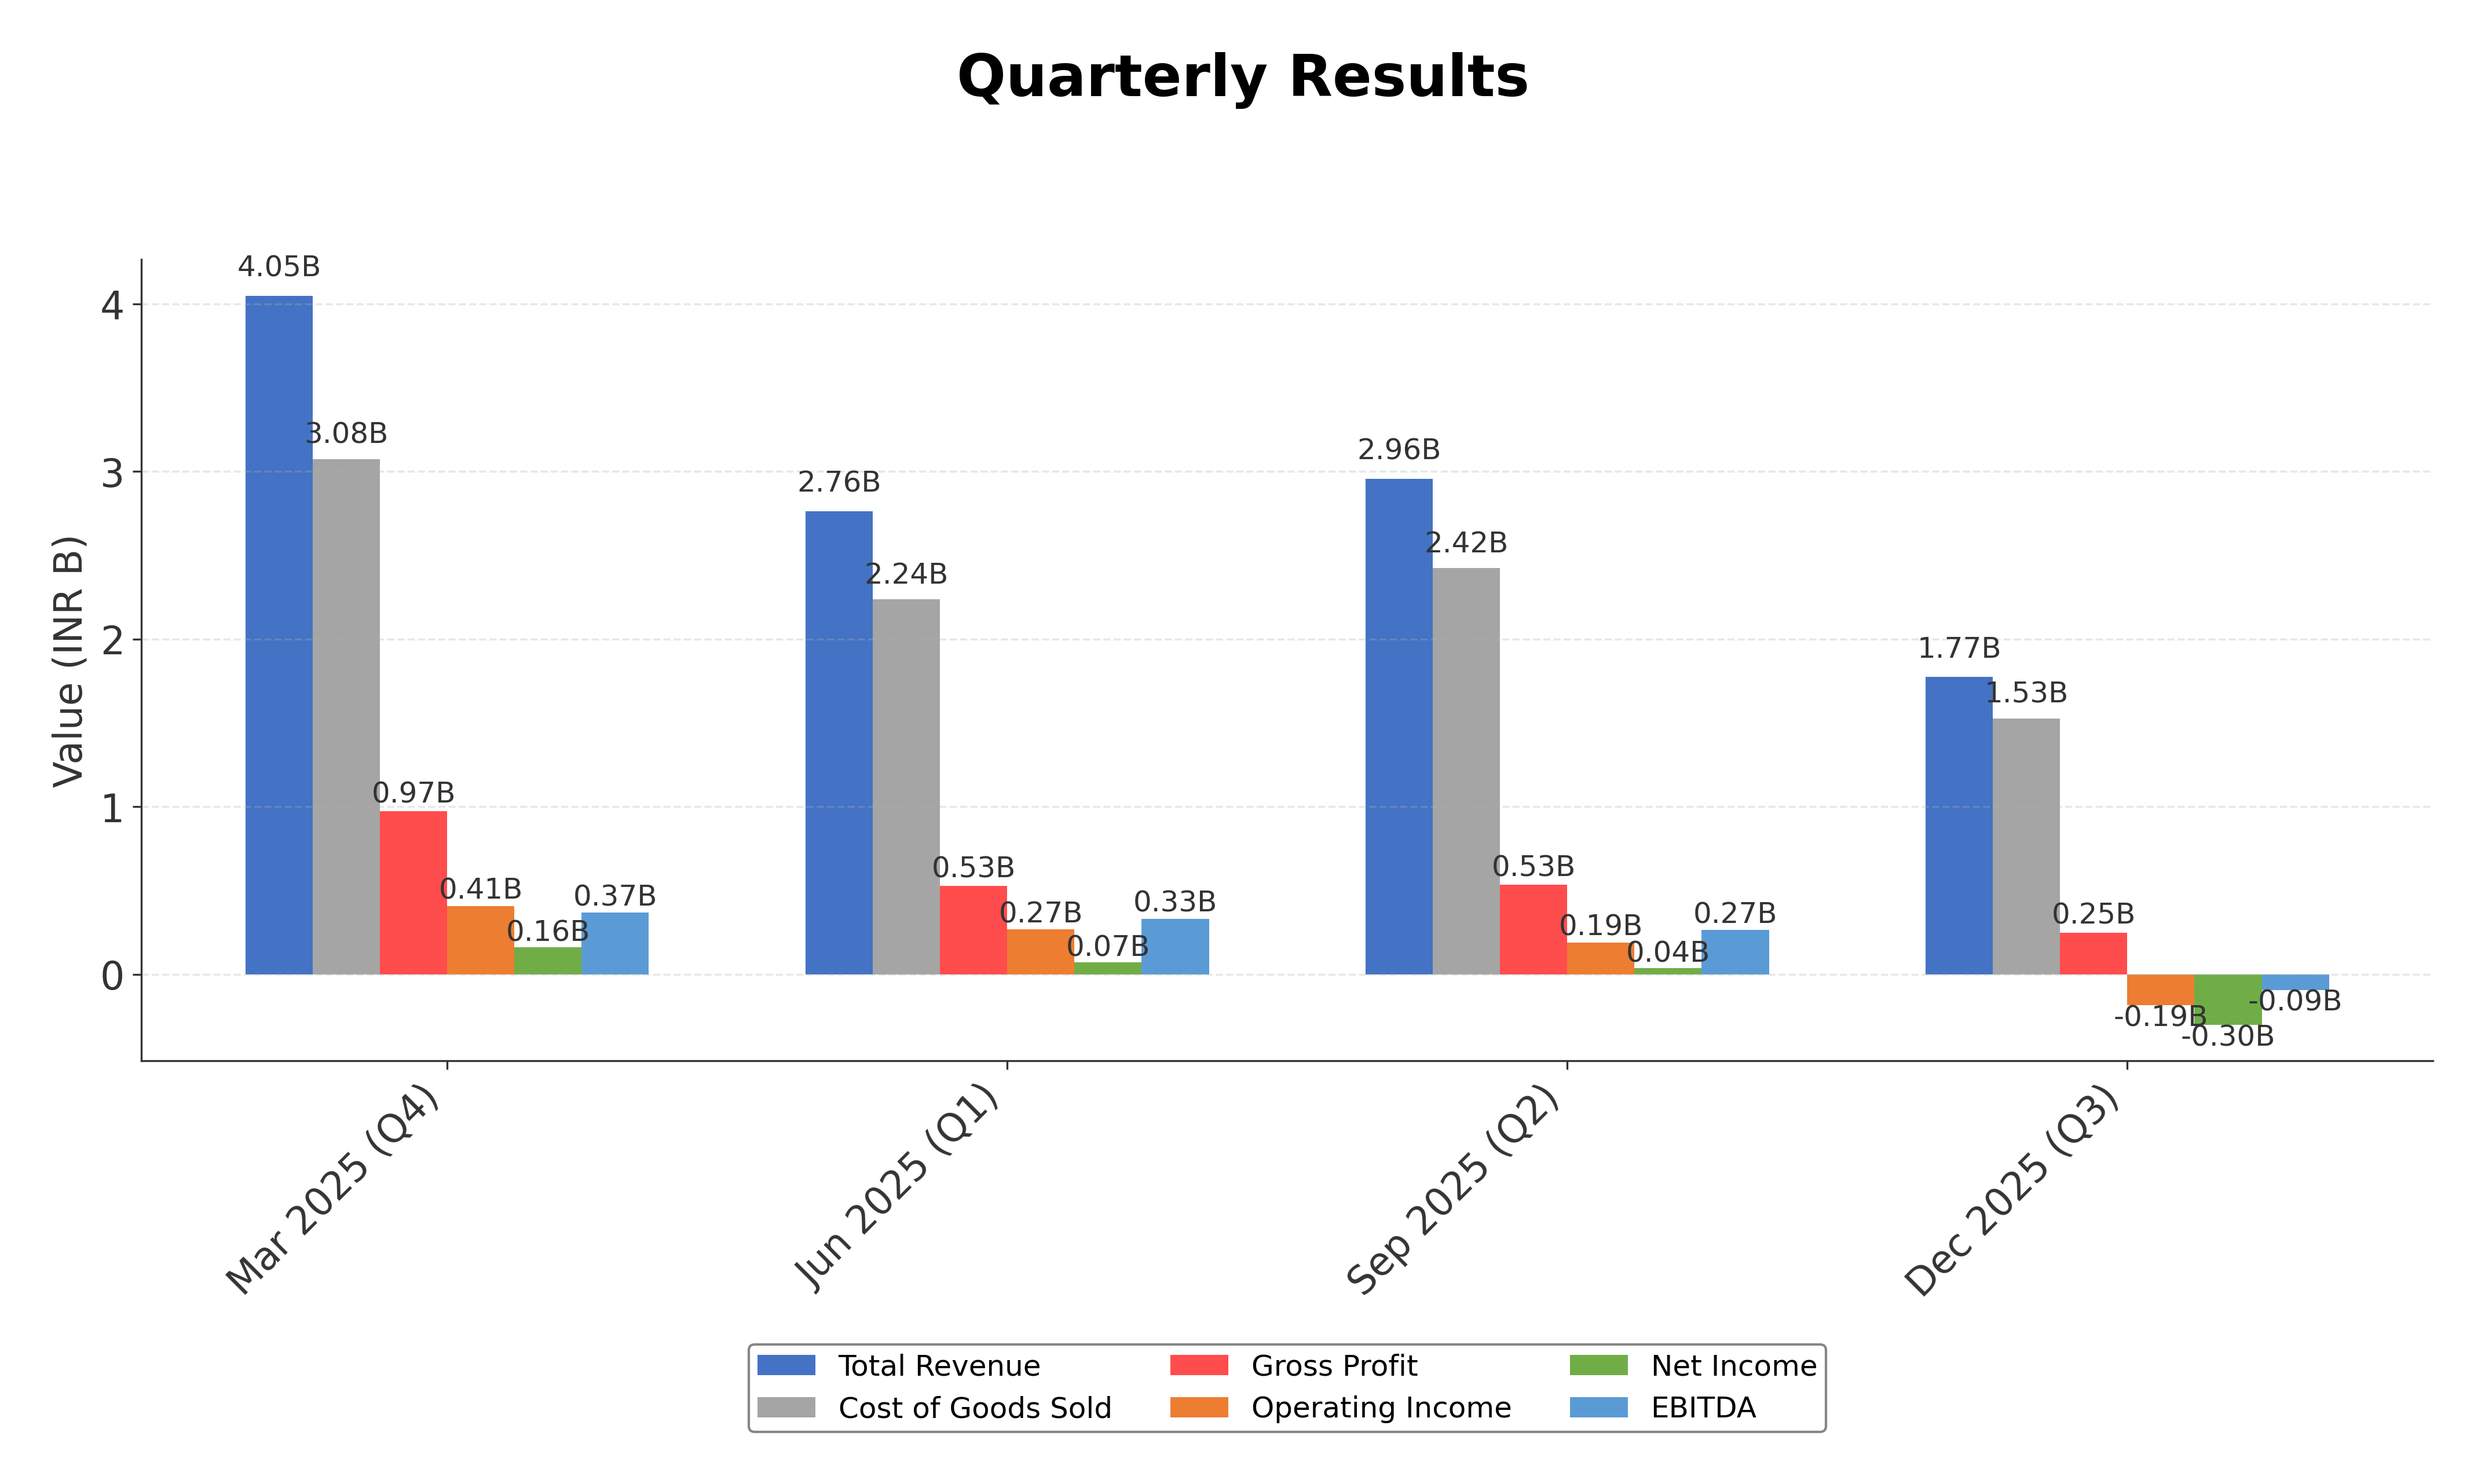
- Quarterly revenue decline of 26.3% and negative operating cash flow of ₹2.9 billion highlight operational and cash generation difficulties.
Disclosure: This information is for general awareness and does not constitute investment advice
Report Summary
Vishnu Prakash R. Punglia Ltd. operates within the Engineering & Construction industry in India, focusing on infrastructure development projects such as roads, bridges, and tunnels. The company serves both public and private sectors, emphasizing quality and sustainability to strengthen regional connectivity and economic growth. Positioned as a reliable player, it leverages advanced engineering practices to meet the increasing demand for modern infrastructure solutions.
Financially, the company reports a market capitalization of approximately â¹4.77 billion with a trailing P/E ratio near 18 and a forward P/E of about 18.4, aligning closely with its industry average. Despite generating revenues exceeding â¹11.5 billion over the trailing twelve months, Vishnu Prakash R. Punglia Ltd. posted a slight net loss and negative operating margin, reflecting recent challenges. The balance sheet shows significant debt levels with a total debt of â¹7.17 billion and a current ratio of 1.51, while cash flow from operations remains negative but free cash flow is positive.
Technically, the stock is trading near its 52-week low at â¹38.03, below both its 50-day and 200-day moving averages, indicating a bearish trend. Recent strategic moves include substantial promoter capital infusion and debt reduction efforts, which have improved liquidity and financial stability. Notable strengths include a strong order book and promoter support, whereas risks stem from declining quarterly revenues and operating losses. These factors provide important context for evaluating the companyâs ongoing operational and financial restructuring.
In comparison with regional peers such as Praj Industries Ltd., Rail Vikas Nigam Ltd., and Kalpataru Projects International Limited, Vishnu Prakash R. Punglia Ltd. exhibits a lower market capitalization and more modest valuation multiples. Its P/E and EV/EBITDA ratios are generally lower than several peers, while return on equity remains subdued. The companyâs price-to-cash-flow ratio is negative, contrasting with positive figures for some peers, highlighting distinct financial and operational challenges within the competitive Indian engineering and construction sector.
Vishnu Prakash R. Punglia Ltd. is navigating a pivotal phase marked by significant debt reduction and promoter capital infusion aimed at stabilizing its financial position. While recent share price declines reflect ongoing headwinds, the companyâs strategic initiatives to strengthen liquidity and operational efficiency are noteworthy. The stakes involve balancing recovery efforts against market pressures and sector dynamics. Given the current data, a cautious and observant approach may be appropriate for those assessing the stock, considering both the companyâs restructuring progress and the broader industry environment.
Company and Industry Overview
Company Basics
Price Performance
Company Size
Shareholding Pattern
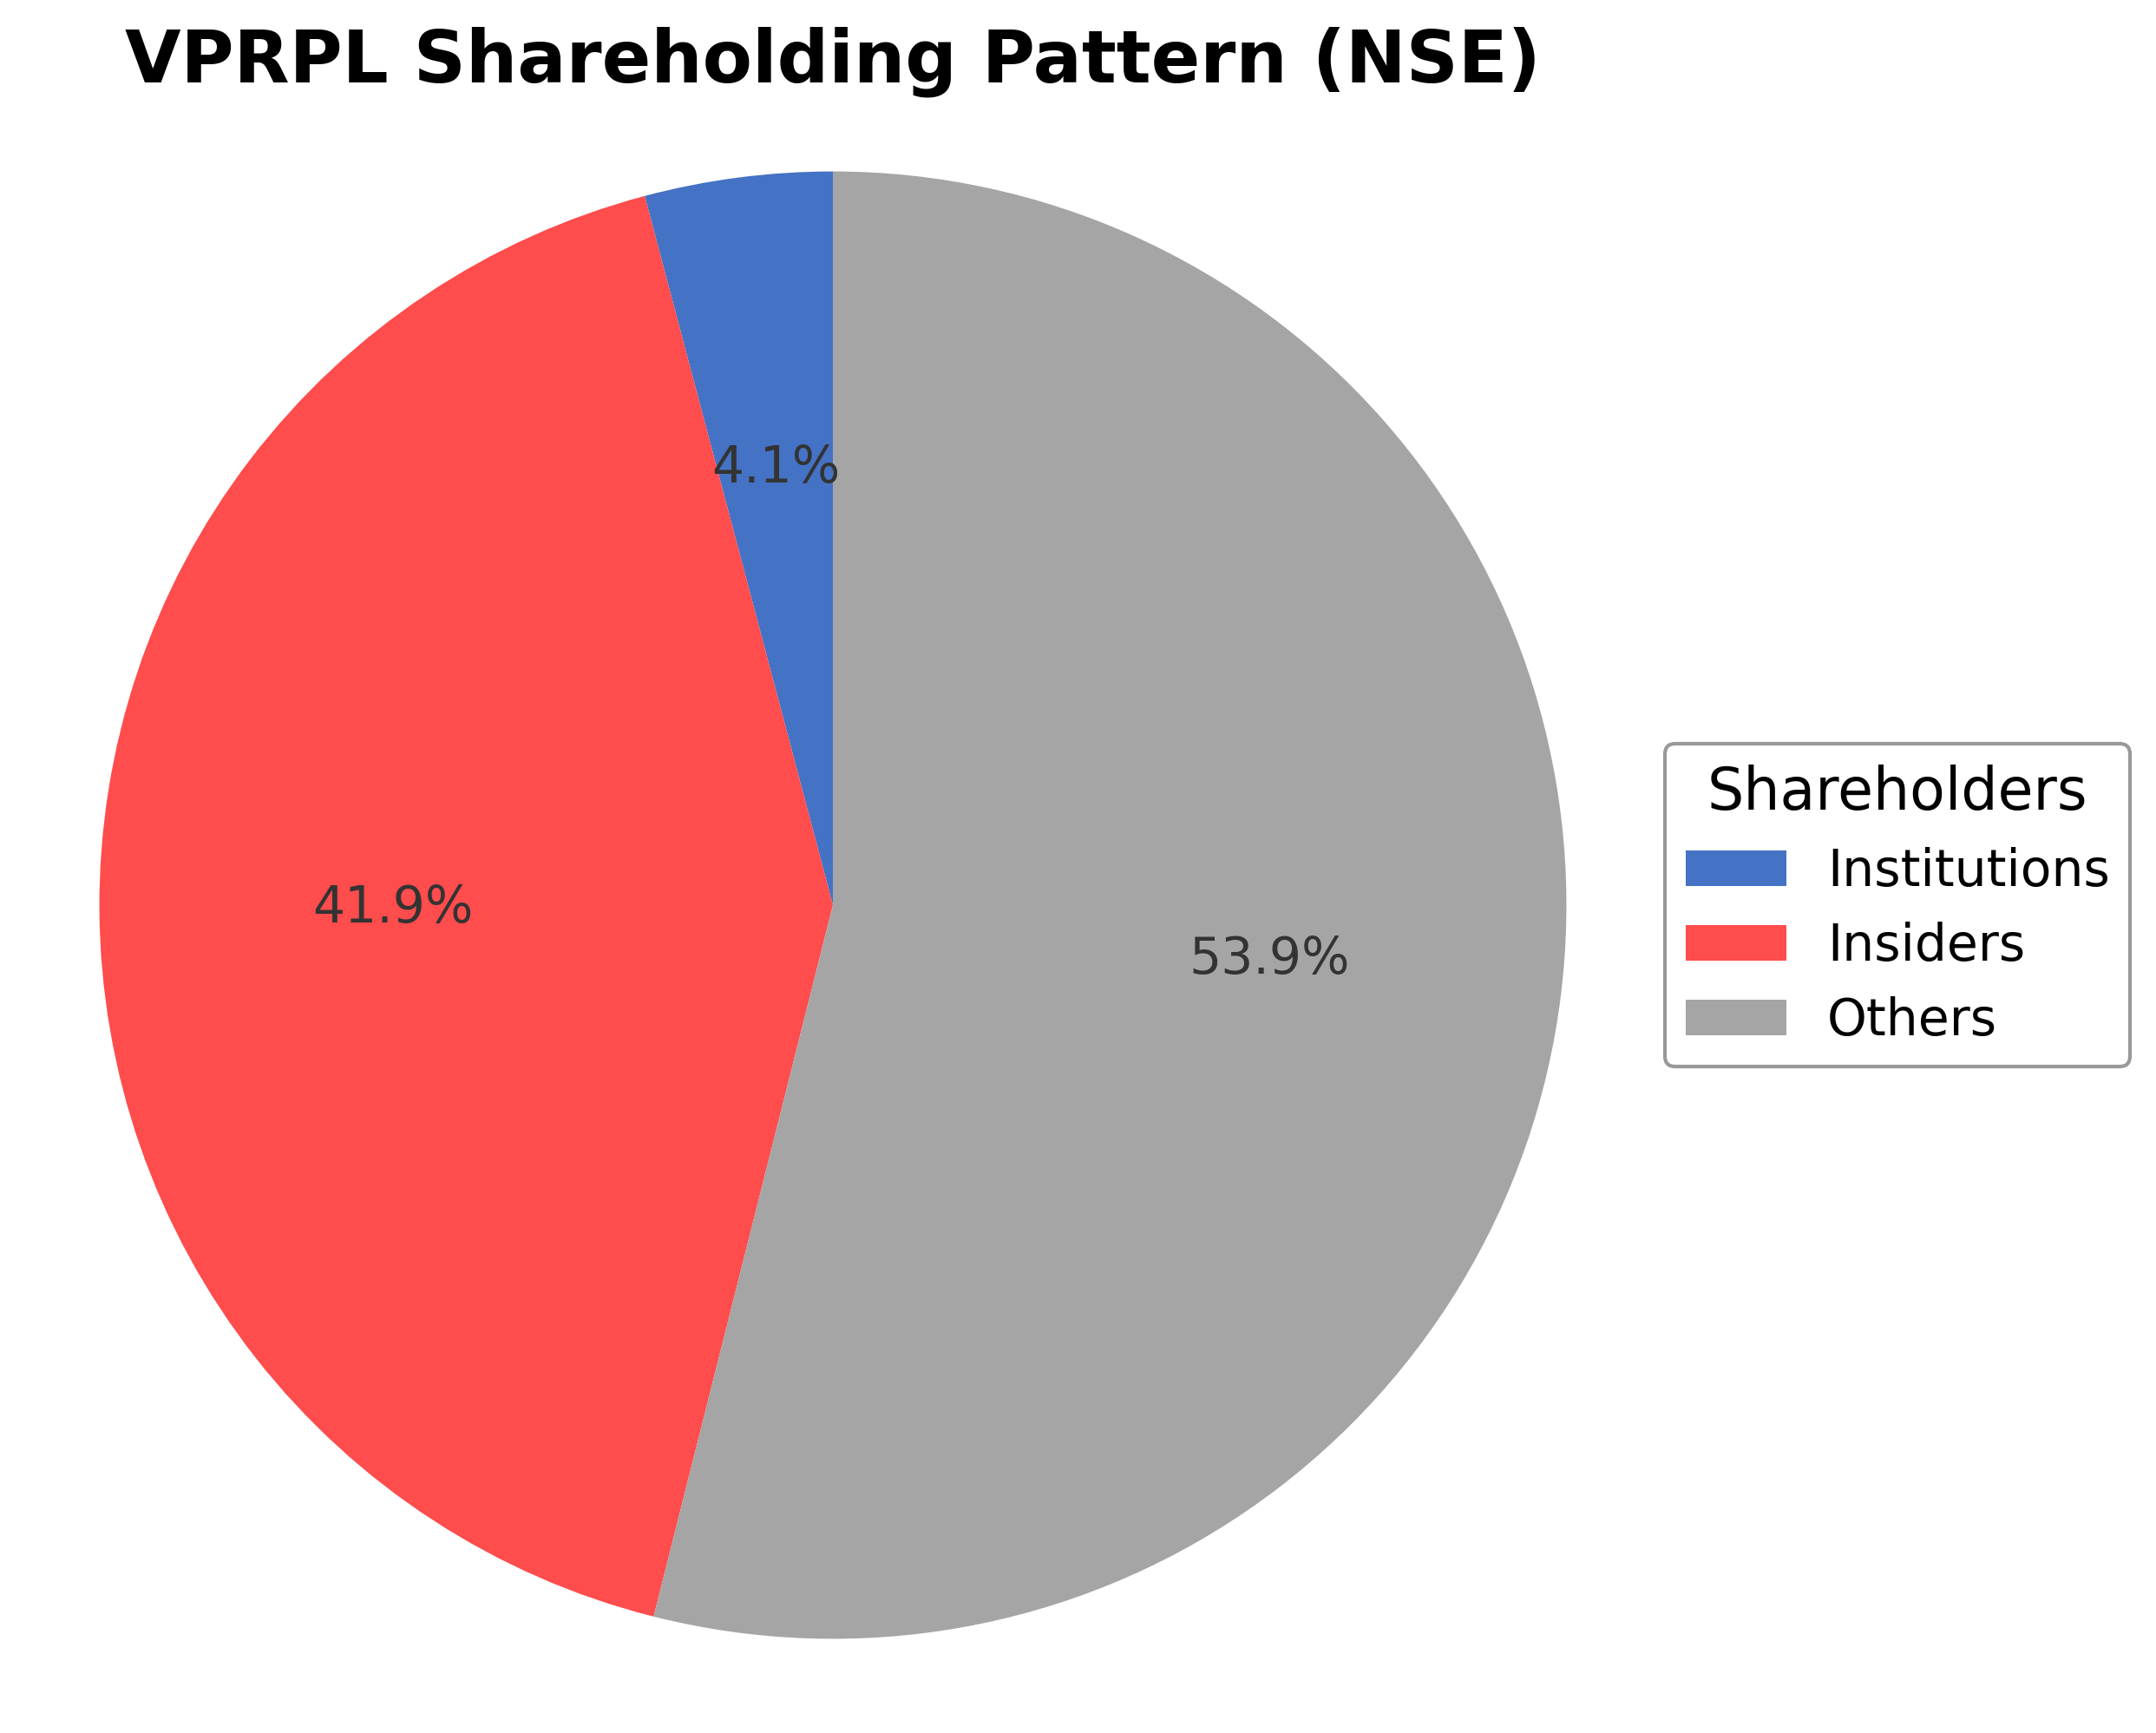
The shareholding structure of Vishnu Prakash R. Punglia Ltd. reflects a significant promoter ownership at approximately 41.94%, with institutional investors holding around 4.13%, and the remaining 53.93% held by public and other shareholders. Over the past 12 to 24 months, there have been notable promoter stake reductions through market sales, partially offset by reinvestments as interest-free loans to the company. Institutional holdings remain relatively low with no major recent accumulation or distribution trends reported. This ownership pattern suggests a concentrated promoter influence with moderate public participation, which may impact governance and strategic decision-making. The current structure aligns with typical Indian mid-cap infrastructure firms, balancing control with external capital involvement.
Sector and Industry Analysis
Vishnu Prakash R. Punglia Ltd. (VPRPL) operates within the broader financial services sector, specifically focusing on equity research and valuation advisory services. The financial services sector is a substantial component of global economies, with market size measured in trillions of dollars, driven by capital markets, investment banking, asset management, and advisory services. This sector has demonstrated steady growth, propelled by increasing capital market activities, globalization of financial markets, and rising demand for sophisticated financial analysis. Key players include global investment banks, boutique advisory firms, and specialized equity research providers, all competing to deliver valuation insights, financial modeling, and market intelligence to institutional investors.
Within this sector, the equity research and valuation industry is evolving rapidly due to technological advancements and changing investor expectations. The adoption of AI and machine learning tools is transforming traditional valuation methodologies, enabling more precise and real-time analytics. Additionally, there is a growing emphasis on integrating environmental, social, and governance (ESG) factors into valuation models, reflecting shifting consumer and investor priorities. Emerging opportunities lie in developing industry-specific financial models and leveraging big data to enhance predictive accuracy. The rise of private equity and venture capital also fuels demand for specialized valuation services tailored to non-public companies, further expanding the industry’s scope.
The regulatory environment governing financial services and equity research is stringent and multifaceted. Key regulations include securities laws enforced by bodies such as the Securities and Exchange Commission (SEC) in the U.S., the Financial Conduct Authority (FCA) in the U.K., and equivalent authorities globally. These regulations mandate transparency, fairness, and the prevention of conflicts of interest in research dissemination. Compliance requirements encompass disclosure norms, insider trading restrictions, and adherence to ethical standards in financial reporting. Policy changes, such as MiFID II in Europe, have increased pressure on research providers to unbundle research costs and demonstrate value, reshaping the business models of equity research firms.
Competitive dynamics in the equity research and valuation industry are characterized by a mix of large multinational firms and nimble boutique players. Market structure tends to be oligopolistic at the top tier, with a few dominant entities controlling significant market share due to their brand reputation, research quality, and extensive client networks. Barriers to entry include the need for specialized expertise, regulatory compliance, and access to proprietary data and technology platforms. Firms differentiate themselves through the depth of sector knowledge, customization of valuation models, and integration of advanced analytics. The competitive positioning of companies like VPRPL depends on their ability to deliver accurate, timely, and actionable insights that meet the evolving demands of institutional investors in a highly regulated and technology-driven environment.
Note: Analysis synthesized from industry research, market reports, and regulatory filings. Information is subject to change based on market conditions.
Illustrative Scenario Analysis
DCF Assumptions:
Method: Two-Stage EPS-Priority Model
Financials
Peer Analysis
| Company Name | Market Cap | P/E Ratio | P/B Ratio | EV/EBITDA | Price to CFO |
|---|---|---|---|---|---|
| Vishnu Prakash R. Punglia Ltd. | ₹4.77B | 17.97 | 0.33 | 13.26 | -1.64 |
| Praj Industries Ltd. | ₹56.00B | 106.89 | 4.30 | 39.13 | 37.59 |
| Rail Vikas Nigam Ltd. | ₹596.48B | 52.56 | 6.33 | 65.49 | 26.79 |
| Kalpataru Projects International Limited | ₹193.64B | 23.20 | 2.78 | 11.43 | -14.34 |
| G R Infraprojects Ltd. | ₹90.75B | 8.24 | 1.01 | 7.30 | -5.35 |
| Techno Electric & Engineering Co. Ltd. | ₹130.29B | 27.75 | 3.35 | 23.35 | 33.33 |
Comparison Analysis: Vishnu Prakash R. Punglia Ltd. presents lower market capitalization and valuation multiples compared to its Indian engineering and construction peers. Its P/E ratio of 17.97 is significantly below Praj Industries and Rail Vikas Nigam Ltd., but above G R Infraprojects Ltd. The company’s price-to-book ratio is notably lower at 0.33, indicating a different valuation perspective relative to peers with higher ratios. Negative price-to-cash-flow contrasts with positive figures for some peers, reflecting operational challenges. Return on equity is modest at 0.08%, slightly below most peers, suggesting room for improvement in profitability metrics within the sector.
Financial Metrics Comparison with Peers
Financial Statements
Comprehensive financial data including income, balance sheet, and cash flow metrics
Income Statement
| fiscal_date | 2025-03-31 | 2024-03-31 | 2023-03-31 | 2022-03-31 | 2021-03-31 |
|---|---|---|---|---|---|
| Sales | 12.37B | 14.67B | 11.68B | 7.85B | 4.86B |
| Cost Of Goods | 9.78B | 12.01B | 9.74B | 6.74B | 4.22B |
| Gross Profit | 2.59B | 2.66B | 1.94B | 1.11B | 633.71M |
| Operating Expense Selling General And Administrative | 82.40M | 59.23M | 55.39M | 36.98M | 19.00M |
| Operating Expense Other Operating Expenses | 440.93M | 170.31M | 47.44M | 50.77M | 40.98M |
| Operating Income | 1.40B | 1.99B | 1.50B | 827.84M | 428.47M |
| Non Operating Interest Income | 70.98M | 65.63M | 27.24M | 14.66M | 15.81M |
| Non Operating Interest Expense | 565.31M | 343.33M | 241.59M | 152.82M | 137.44M |
| Pretax Income | 805.24M | 1.65B | 1.22B | 603.81M | 256.78M |
| Income Tax | 219.28M | 423.33M | 317.96M | 155.34M | 66.96M |
| Net Income | 585.96M | 1.22B | 906.43M | 448.47M | 189.82M |
| Eps Basic | 4.70 | 10.95 | 7.27 | 3.60 | 1.52 |
| Eps Diluted | 4.70 | 10.95 | 7.27 | 3.60 | 1.52 |
| Basic Shares Outstanding | 124.64M | 111.60M | 124.64M | 124.64M | 124.64M |
| Diluted Shares Outstanding | 124.64M | 111.60M | 124.64M | 124.64M | 124.64M |
| Ebit | 1.37B | 1.99B | 1.47B | 756.63M | 394.22M |
| Ebitda | 1.53B | 2.10B | 1.54B | 799.35M | 450.82M |
| Net Income Continuous Operations | 805.24M | 1.65B | 1.22B | 603.81M | 256.78M |
| Preferred Stock Dividends | 0.00 | 0.00 | 0.00 | 0.00 | 0.00 |
Data provided by Twelve Data
Balance Sheet
| fiscal_date | 2025-03-31 | 2024-03-31 | 2023-03-31 | 2022-03-31 | 2021-03-31 |
|---|---|---|---|---|---|
| Cash And Cash Equivalents | 53.38M | 530.85M | 150.01M | 131.91M | 44.89M |
| Accounts Receivable | 7.35B | 6.70B | 1.98B | 1.17B | 1.00B |
| Total Assets | 20.10B | 15.42B | 8.25B | 4.98B | 3.31B |
| Total Liabilities | 12.30B | 8.21B | 5.11B | 3.39B | 2.17B |
| Long Term Debt | 800.49M | 250.25M | 602.97M | 418.62M | 190.56M |
| Shareholders Equity | 7.79B | 7.21B | 3.15B | 1.59B | 1.14B |
Data provided by Twelve Data
Cash Flow Statement
| fiscal_date | 2025-03-31 | 2024-03-31 | 2023-03-31 | 2022-03-31 | 2021-03-31 |
|---|---|---|---|---|---|
| Operating Activities Net Income | 805.24M | 1.65B | 1.22B | 603.81M | 256.78M |
| Operating Activities Other Non Cash Items | 593.22M | 345.84M | 274.64M | 225.58M | 158.81M |
| Operating Activities Accounts Receivable | -697.80M | -4.66B | -881.24M | -183.22M | -72.46M |
| Operating Activities Other Assets Liabilities | -3.60B | -1.58B | -1.41B | -764.94M | -133.99M |
| Operating Activities Operating Cash Flow | -2.90B | -4.26B | -787.78M | -118.77M | 209.14M |
| Investing Activities Capital Expenditures | -726.70M | -520.00M | -654.13M | -280.08M | -42.21M |
| Investing Activities Net Intangibles | -2.77M | -1.75M | 0.00 | N/A | N/A |
| Investing Activities Purchase Of Investments | -202.90M | -5.10M | -352.35M | -7.87M | -29.78M |
| Investing Activities Sale Of Investments | 0.00 | 121.01M | 460.00K | 2.19M | 2.00M |
| Investing Activities Other Investing Activity | 13.67M | 18.31M | 400.00K | 490.00K | 780.00K |
| Investing Activities Investing Cash Flow | -915.93M | -385.78M | -1.01B | -285.27M | -69.21M |
| Financing Activities Long Term Debt Issuance | 1.15B | 123.70M | 606.13M | 440.93M | 270.56M |
| Financing Activities Long Term Debt Payments | -445.13M | -513.60M | -256.40M | -141.16M | -92.34M |
| Financing Activities Short Term Debt Issuance | 2.41B | 1.84B | 388.23M | 358.18M | -292.59M |
| Financing Activities Common Stock Issuance | 0.00 | 3.09B | 645.00M | 0.00 | 0.00 |
| Financing Activities Financing Cash Flow | 3.12B | 4.54B | 1.38B | 657.95M | -114.37M |
| End Cash Position | 53.38M | 530.85M | 150.01M | 131.91M | 44.89M |
| Free Cash Flow | -2.83B | -3.69B | -739.67M | -318.77M | 306.18M |
| Financing Activities Other Financing Charges | N/A | N/A | -80.00K | N/A | N/A |
Data provided by Twelve Data
Technical Analysis
Key Insights
- The current trend direction is bearish, with the stock trading near its 52-week low and below both the 50-day (₹46.24) and 200-day (₹100.53) moving averages, indicating downward momentum.
- Key support levels are near the 52-week low at approximately ₹37.75, while resistance is observed around the 50-day moving average at ₹46.24 and the 200-day moving average at ₹100.53.
- The stock is positioned below major moving averages (10-day, 50-day, and 200-day), suggesting sustained weakness in price action.
- Momentum indicators show bearish signals with the Relative Strength Index (RSI) likely in oversold territory, MACD below the signal line, and Stochastic oscillators indicating downward pressure.
- Multi-timeframe analysis across daily, weekly, and monthly charts confirms a consistent downtrend with no immediate reversal patterns evident.
- Potential market scenarios include continued consolidation near current lows or further declines if support levels are breached, while a recovery would require sustained volume and momentum shifts.
Trending News
1. Headline: VPRPL Promoter Pushpa Pungalia Reduces Stake by 0.48% Through Market Sale
Summary: Vishnu Prakash R Punglia Limited disclosed a share transaction by promoter group member Pushpa Pungalia, who sold 6 lakh shares representing 0.481% of total voting capital through market sale. The transaction reduced her shareholding from 3.281% to 2.800%, with the stated purpose of generating ...
Sentiment: positive
2. Headline: Vishnu Prakash R Punglia Ltd. Boosts Liquidity with Major Debt Reduction | Business
Summary: Vishnu Prakash R Punglia Limited navigated financial challenges with key promoter support, achieving a 50% reduction in debt and improving liquidity. With a strong order book and normalized payment cycles, the company's financial discipline has bolstered its balance sheet, ensuring long-term ...
Sentiment: positive
3. Headline: VPRPL Strengthens Financial Position with Rs 285 Cr Promoter Infusion and Significant Debt Reduction
Summary: Jodhpur, (Rajasthan) [India], March 11: Vishnu Prakash R Punglia Limited(NSE: VPRPL, BSE: 543974 | INE0AE001013)
Sentiment: positive
Summary: Denta Water and Infra Solutions shares were locked in the 20% upper circuit, while Shakti Pumps India shares jumped 19.2% and Vishnu Prakash R Punglia share price advanced 18.4%.
Sentiment: positive
5. Headline: Vishnu Prakash R Punglia Ltd Hits 52-Week Low Amidst Continued Downtrend
Summary: Shares of Vishnu Prakash R Punglia Ltd, a company in the construction sector, have declined to a new 52-week low of Rs.39.25, marking a significant drop in t...
Sentiment: negative
6. Headline: Vishnu Prakash R Punglia Ltd is Rated Strong Sell
Summary: Vishnu Prakash R Punglia Ltd is rated Strong Sell by MarketsMOJO, with this rating last updated on 10 Nov 2025. However, the analysis and financial metrics presented here reflect the stock’s current position as of 10 March 2026, providing investors with an up-to-date view of the company’s ...
Sentiment: neutral
7. Headline: Vishnu Prakash R Punglia Share Price Rise 0.66% After Rs 285 Crore Promoter Capital Infusion
Summary: VPRPL shares edged higher after promoters infused ₹285 crore as interest‑free loans and the company repaid ₹328 crore debt, strengthening liquidity and leverage.
Sentiment: positive
8. Headline: A stock down 90% from its peak gets fund infusion from promoters, over ₹300 crore debt repayment - CNBC TV18
Summary: Vishnu Prakash R Punglia Ltd.
Sentiment: negative
9. Headline: Vishnu Prakash R Punglia Ltd Confirms Stronger Balance Sheet Through Promoter Investment
Summary: Vishnu Prakash R Punglia Ltd has successfully strengthened its financial position through comprehensive restructuring measures including ₹285 crores interest-free promoter investment and substantial ₹328 crores debt reduction representing 50% cut in bank borrowings.
Sentiment: positive
Summary: Vishnu Prakash Share Price: Find the latest news on Vishnu Prakash Stock Price. Get all the information on Vishnu Prakash with historic price charts for NSE / BSE. Experts & Broker view also get the Vishnu Prakash Ltd. buy/sell tips detailed news, announcements, Forecasts, Analysts, Valuation, ...
Sentiment: neutral
Powered by Brave
Recent Updates
News Summary
Recent news highlights Vishnu Prakash R Punglia Ltd.'s ongoing share price decline, reaching a 52-week low amid continued market pressures. Promoter share sales by Pooja and Anil Punglia in early 2026 indicate efforts to fund company operations, while promoters have simultaneously reinvested proceeds as interest-free loans to support liquidity. The company has achieved a significant 50% debt reduction, bolstered by promoter capital infusion, which has improved its financial position and balance sheet strength. These developments reflect a strategic focus on deleveraging and stabilizing operations amid challenging sector dynamics. The news cycle underscores a balance between financial restructuring and market headwinds, with neutral to positive sentiment prevailing in recent reports.
News Sentiment
Sentiment analysis reveals a predominantly neutral to positive tone, with multiple sources emphasizing promoter support, debt reduction, and liquidity improvements. Negative sentiment is limited to share price declines and market valuation pressures. Overall, the sentiment suggests cautious optimism regarding the company’s financial restructuring efforts, tempered by ongoing operational and market challenges.
Analytical Overview
Analysis Summary
Valuation Metrics: The company's trailing and forward P/E ratios of approximately 18 align closely with the industry average of 17.97, suggesting valuation in line with sector norms. However, the low price-to-book ratio of 0.33 indicates the stock is trading below its book value, which may reflect market concerns about profitability and asset utilization.
Growth Trajectory: Revenue has declined by 26.3% quarter-over-quarter, and the company reported a net loss in the trailing twelve months, signaling near-term growth challenges. Negative operating cash flow contrasts with positive free cash flow, indicating mixed cash generation dynamics.
Financial Health: Total debt stands at ₹7.17 billion with a debt-to-equity ratio of approximately 90.7%, highlighting significant leverage. The current ratio of 1.51 suggests adequate short-term liquidity, while promoter capital infusion and debt reduction efforts have improved financial stability.
Sector Specific Factors: The Indian infrastructure sector faces regulatory complexities and evolving consumer demands. Vishnu Prakash R. Punglia Ltd.'s focus on sustainability and technological innovation aligns with sector trends, though competitive pressures and project execution risks remain relevant.
Market Positioning And Competitive Advantages: The company benefits from a strong order book and promoter support, which underpin operational continuity. Its commitment to quality and sustainability may provide differentiation, though financial constraints and recent revenue declines present challenges.
Investment Conclusion
Supporting Factors: Promoter capital infusion of ₹285 crore and significant debt reduction enhance financial stability.
Risk Factors: Negative net income and declining quarterly revenues reflect operational headwinds.
SWOT Analysis
Strengths
- Strong promoter support demonstrated through capital infusion and debt reduction.
- Robust order book supporting ongoing project execution.
- Commitment to sustainability and innovative engineering practices.
- Adequate short-term liquidity with a current ratio above 1.5.
Weaknesses
- Negative net income and operating margin indicating profitability challenges.
- High leverage with a debt-to-equity ratio exceeding 90%.
- Declining quarterly revenue growth impacting financial momentum.
- Negative operating cash flow despite positive free cash flow.
Opportunities
- Growing demand for infrastructure development in India.
- Potential benefits from government initiatives like Jal Jeevan Mission.
- Scope for operational improvements through technological adoption.
- Expansion into new infrastructure segments or geographies.
Threats
- Regulatory complexities and project execution risks in the construction sector.
- Competitive pressures from larger and more diversified peers.
- Market volatility impacting share price and investor sentiment.
- Economic fluctuations affecting infrastructure spending.
Company Description
Vishnu Prakash R. Punglia Ltd. operates as a key player in the infrastructure development sector. Engaged primarily in providing construction and engineering services, the company focuses on executing projects that span the construction of roads, bridges, tunnels, and other pivotal infrastructure. With an emphasis on delivering high-quality projects, Vishnu Prakash R. Punglia Ltd. serves both public and private clients, facilitating critical improvements in the transportation and utility sectors. The company's operations contribute significantly to regional development by enhancing connectivity and promoting economic growth through infrastructure enhancement. Vishnu Prakash R. Punglia Ltd.'s role in the market is underscored by its commitment to sustainability and innovative engineering practices, which help address the growing demands for modern infrastructure solutions. By leveraging advanced technologies and adhering to rigorous standards, it continues to establish itself as a reliable and forward-thinking entity in the competitive landscape of infrastructure development.