
Venus Remedies Ltd (VENUSREM)
Stock Analysis Report
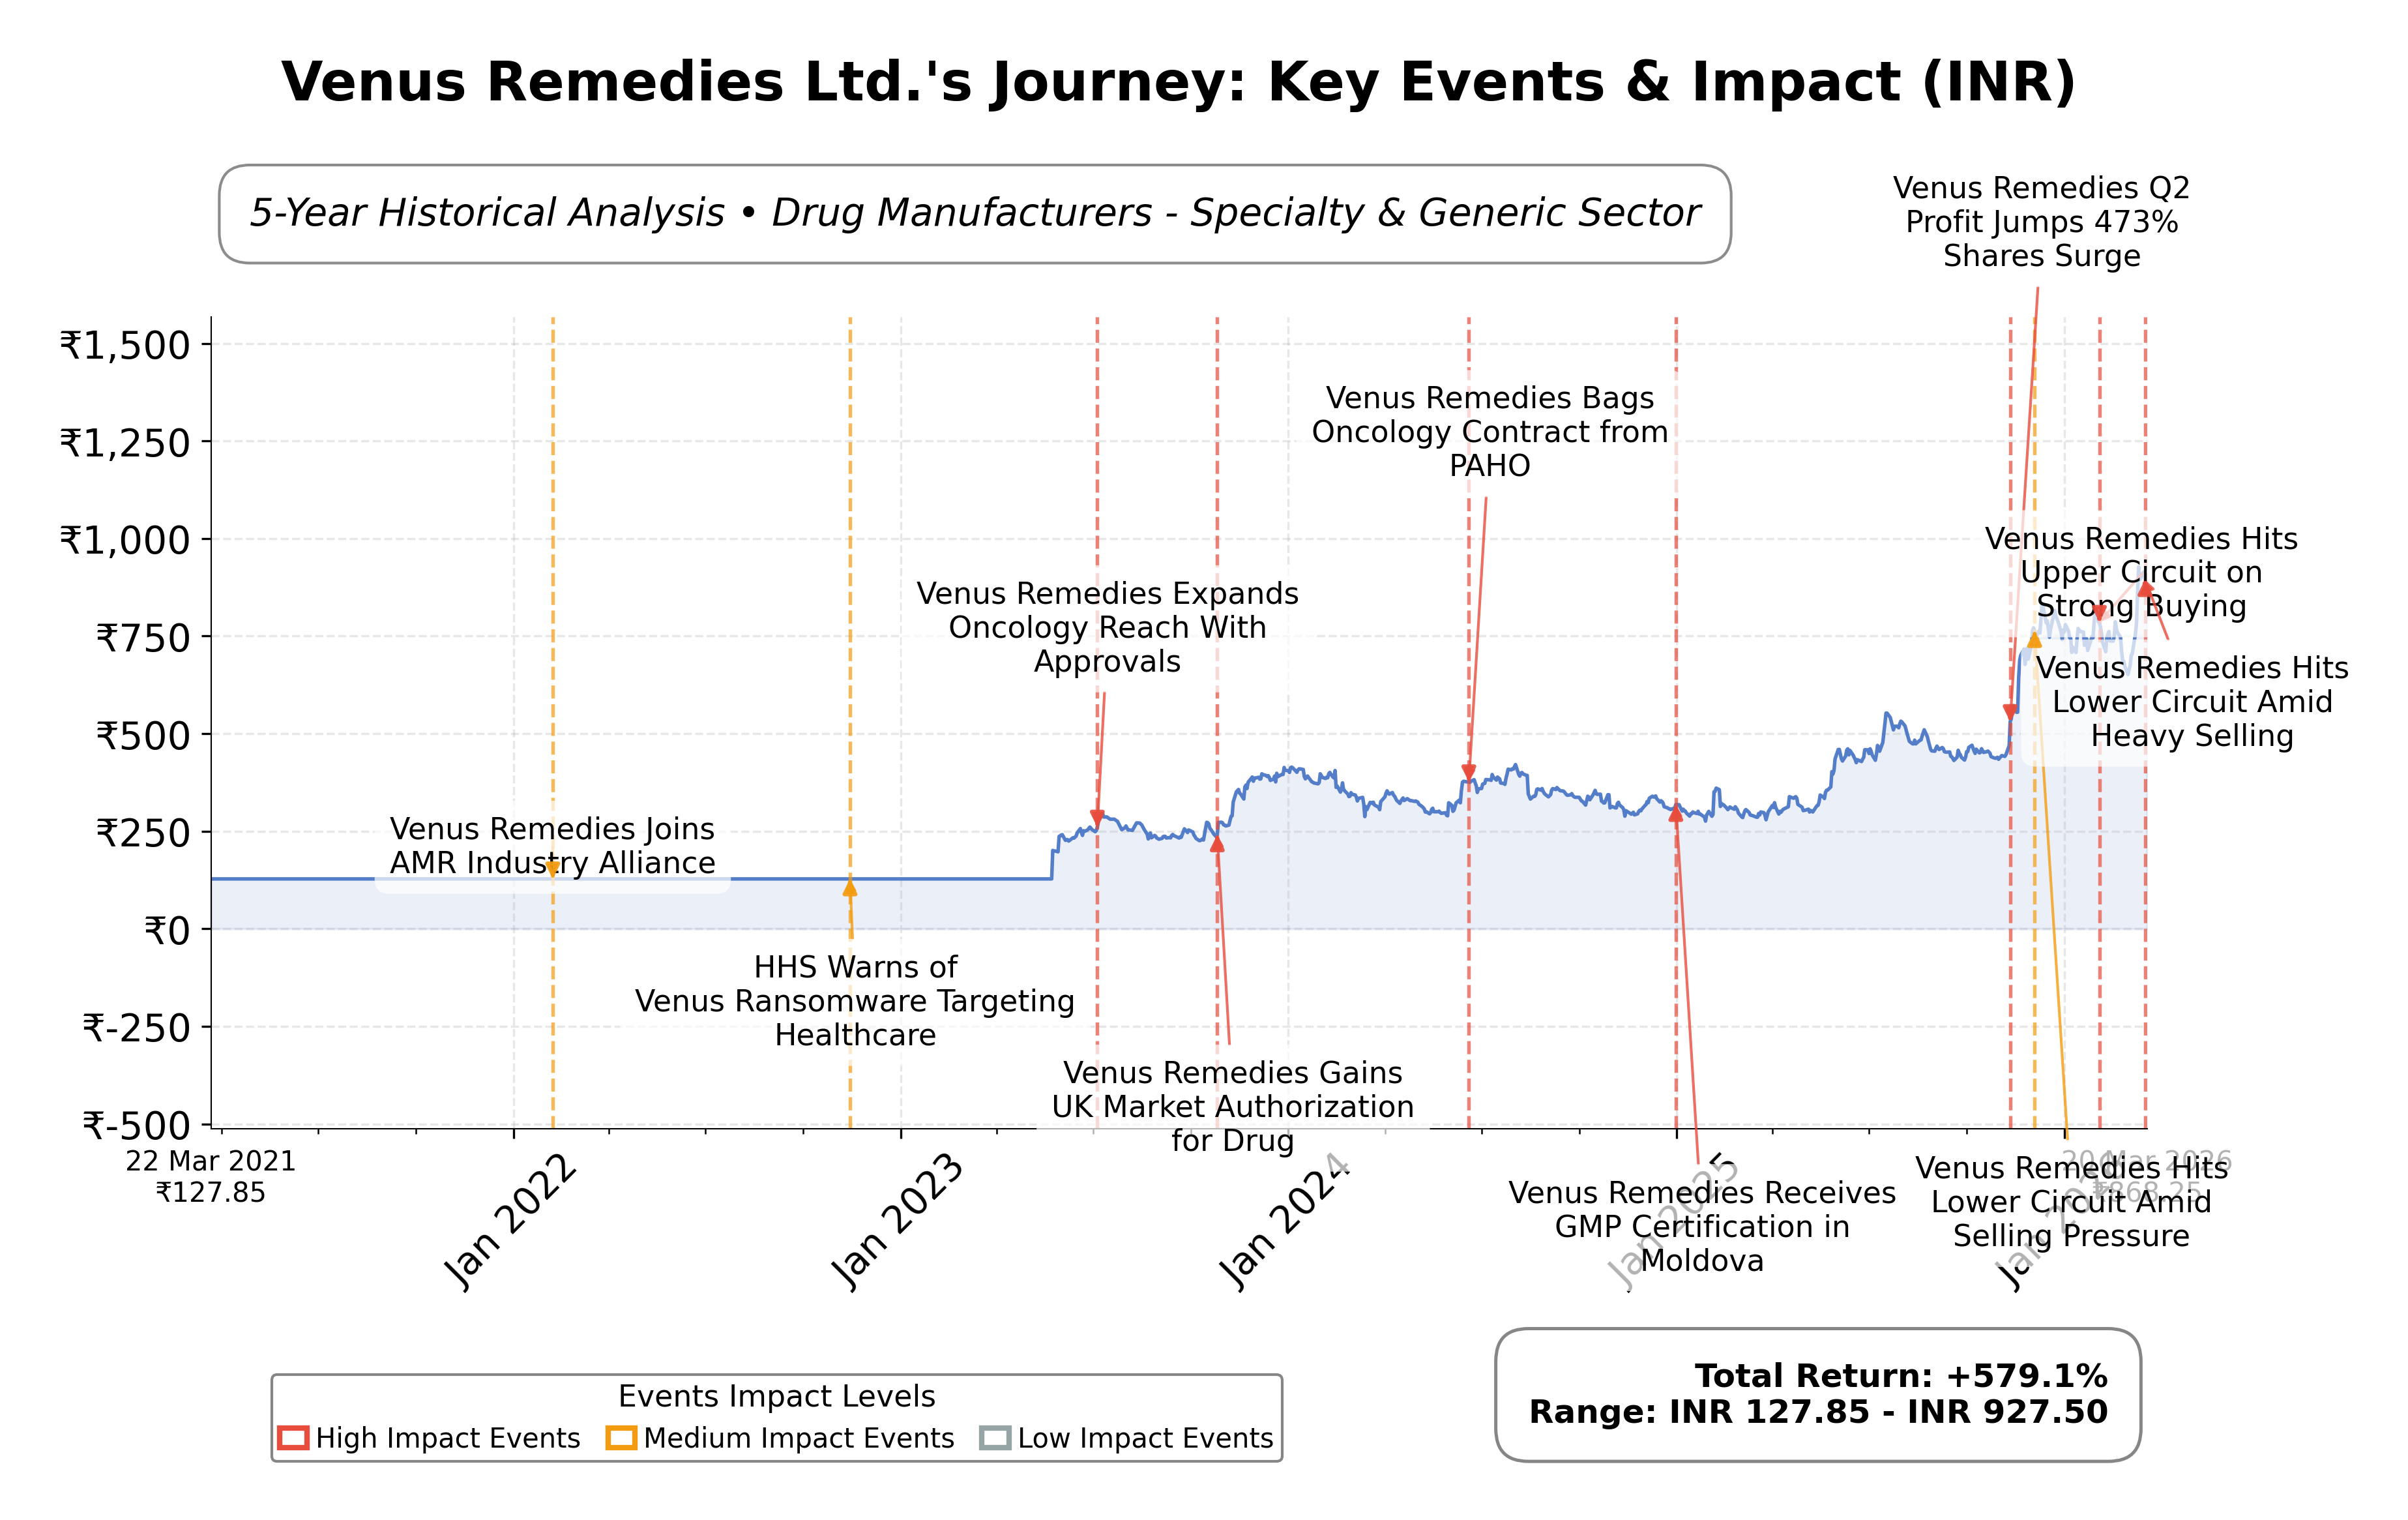
Stock Journey
Key Positives and Key Risks
Pros
- Trailing P/E ratio of 14.98 aligns with industry average, indicating reasonable valuation.
- Quarterly earnings growth of 30.5% year-over-year demonstrates strong profitability improvement.
- Current ratio of 3.40 reflects strong liquidity and short-term financial health.
Cons
- Debt-to-equity ratio of 2.42 suggests relatively high leverage compared to typical pharmaceutical standards.
- Limited institutional investor ownership at 1.15% may reduce external oversight and market confidence.
- Absence of forward P/E data restricts comprehensive future valuation assessment.
Disclosure: This information is for general awareness and does not constitute investment advice
Report Summary
Venus Remedies Ltd. is an Indian pharmaceutical company specializing in the research, development, manufacturing, and sales of specialty and generic drugs. The company focuses on therapeutic areas such as oncology, antibiotics, and pain management, operating within a highly regulated healthcare industry. Venus Remedies maintains a strong domestic presence while exporting globally, leveraging strategic collaborations and investments in research and development to enhance its market positioning.
Financially, Venus Remedies reported a trailing P/E ratio of approximately 15, aligning with the industry average, and a market capitalization near â¹11.62 billion. The company demonstrated a gross margin of 52.15% and a profit margin of 10.85%, with a return on equity around 8.08%. Its enterprise value to EBITDA ratio stands at 8.35, indicating moderate valuation, supported by a PEG ratio below 0.5, suggesting potential undervaluation relative to growth. The current stock price is â¹868.25, within a 52-week range of â¹277.95 to â¹944.75, reflecting significant price appreciation over the year.
Technical indicators show the stock trading above its 50-day and 200-day moving averages, suggesting a positive trend momentum. Recent strategic initiatives include securing Indonesian marketing approval for a combination antibiotic and a promoter group merger, reflecting active corporate restructuring and geographic expansion. Notable strengths include strong cash reserves and a solid current ratio above 3, while risks involve relatively high debt-to-equity levels and sector regulatory challenges. These factors provide important context for evaluating the companyâs operational resilience and growth prospects.
In peer comparison within the Indian pharmaceutical sector, Venus Remedies exhibits a lower market capitalization relative to large-cap peers like Dr. Reddy's Laboratories and Abbott India. Its valuation metrics such as P/E and EV/EBITDA ratios are more conservative compared to industry leaders, which show higher multiples but also higher returns on equity. The companyâs PEG ratio and price-to-cash-flow metrics suggest a more value-oriented profile relative to peers like Laurus Labs and AstraZeneca Pharma India, which trade at premium valuations with elevated growth expectations.
Venus Remedies navigates a competitive and evolving pharmaceutical landscape marked by regulatory scrutiny and innovation demands. Recent achievements include market approvals and internal restructuring, which position the company for potential growth while managing operational risks. The company faces pivotal moments in balancing expansion with financial discipline amid sector volatility. Given the current financial and market data, a measured approach emphasizing ongoing observation of valuation and operational developments may be appropriate for those assessing the stockâs prospects.
Company and Industry Overview
Company Basics
Price Performance
Company Size
Shareholding Pattern
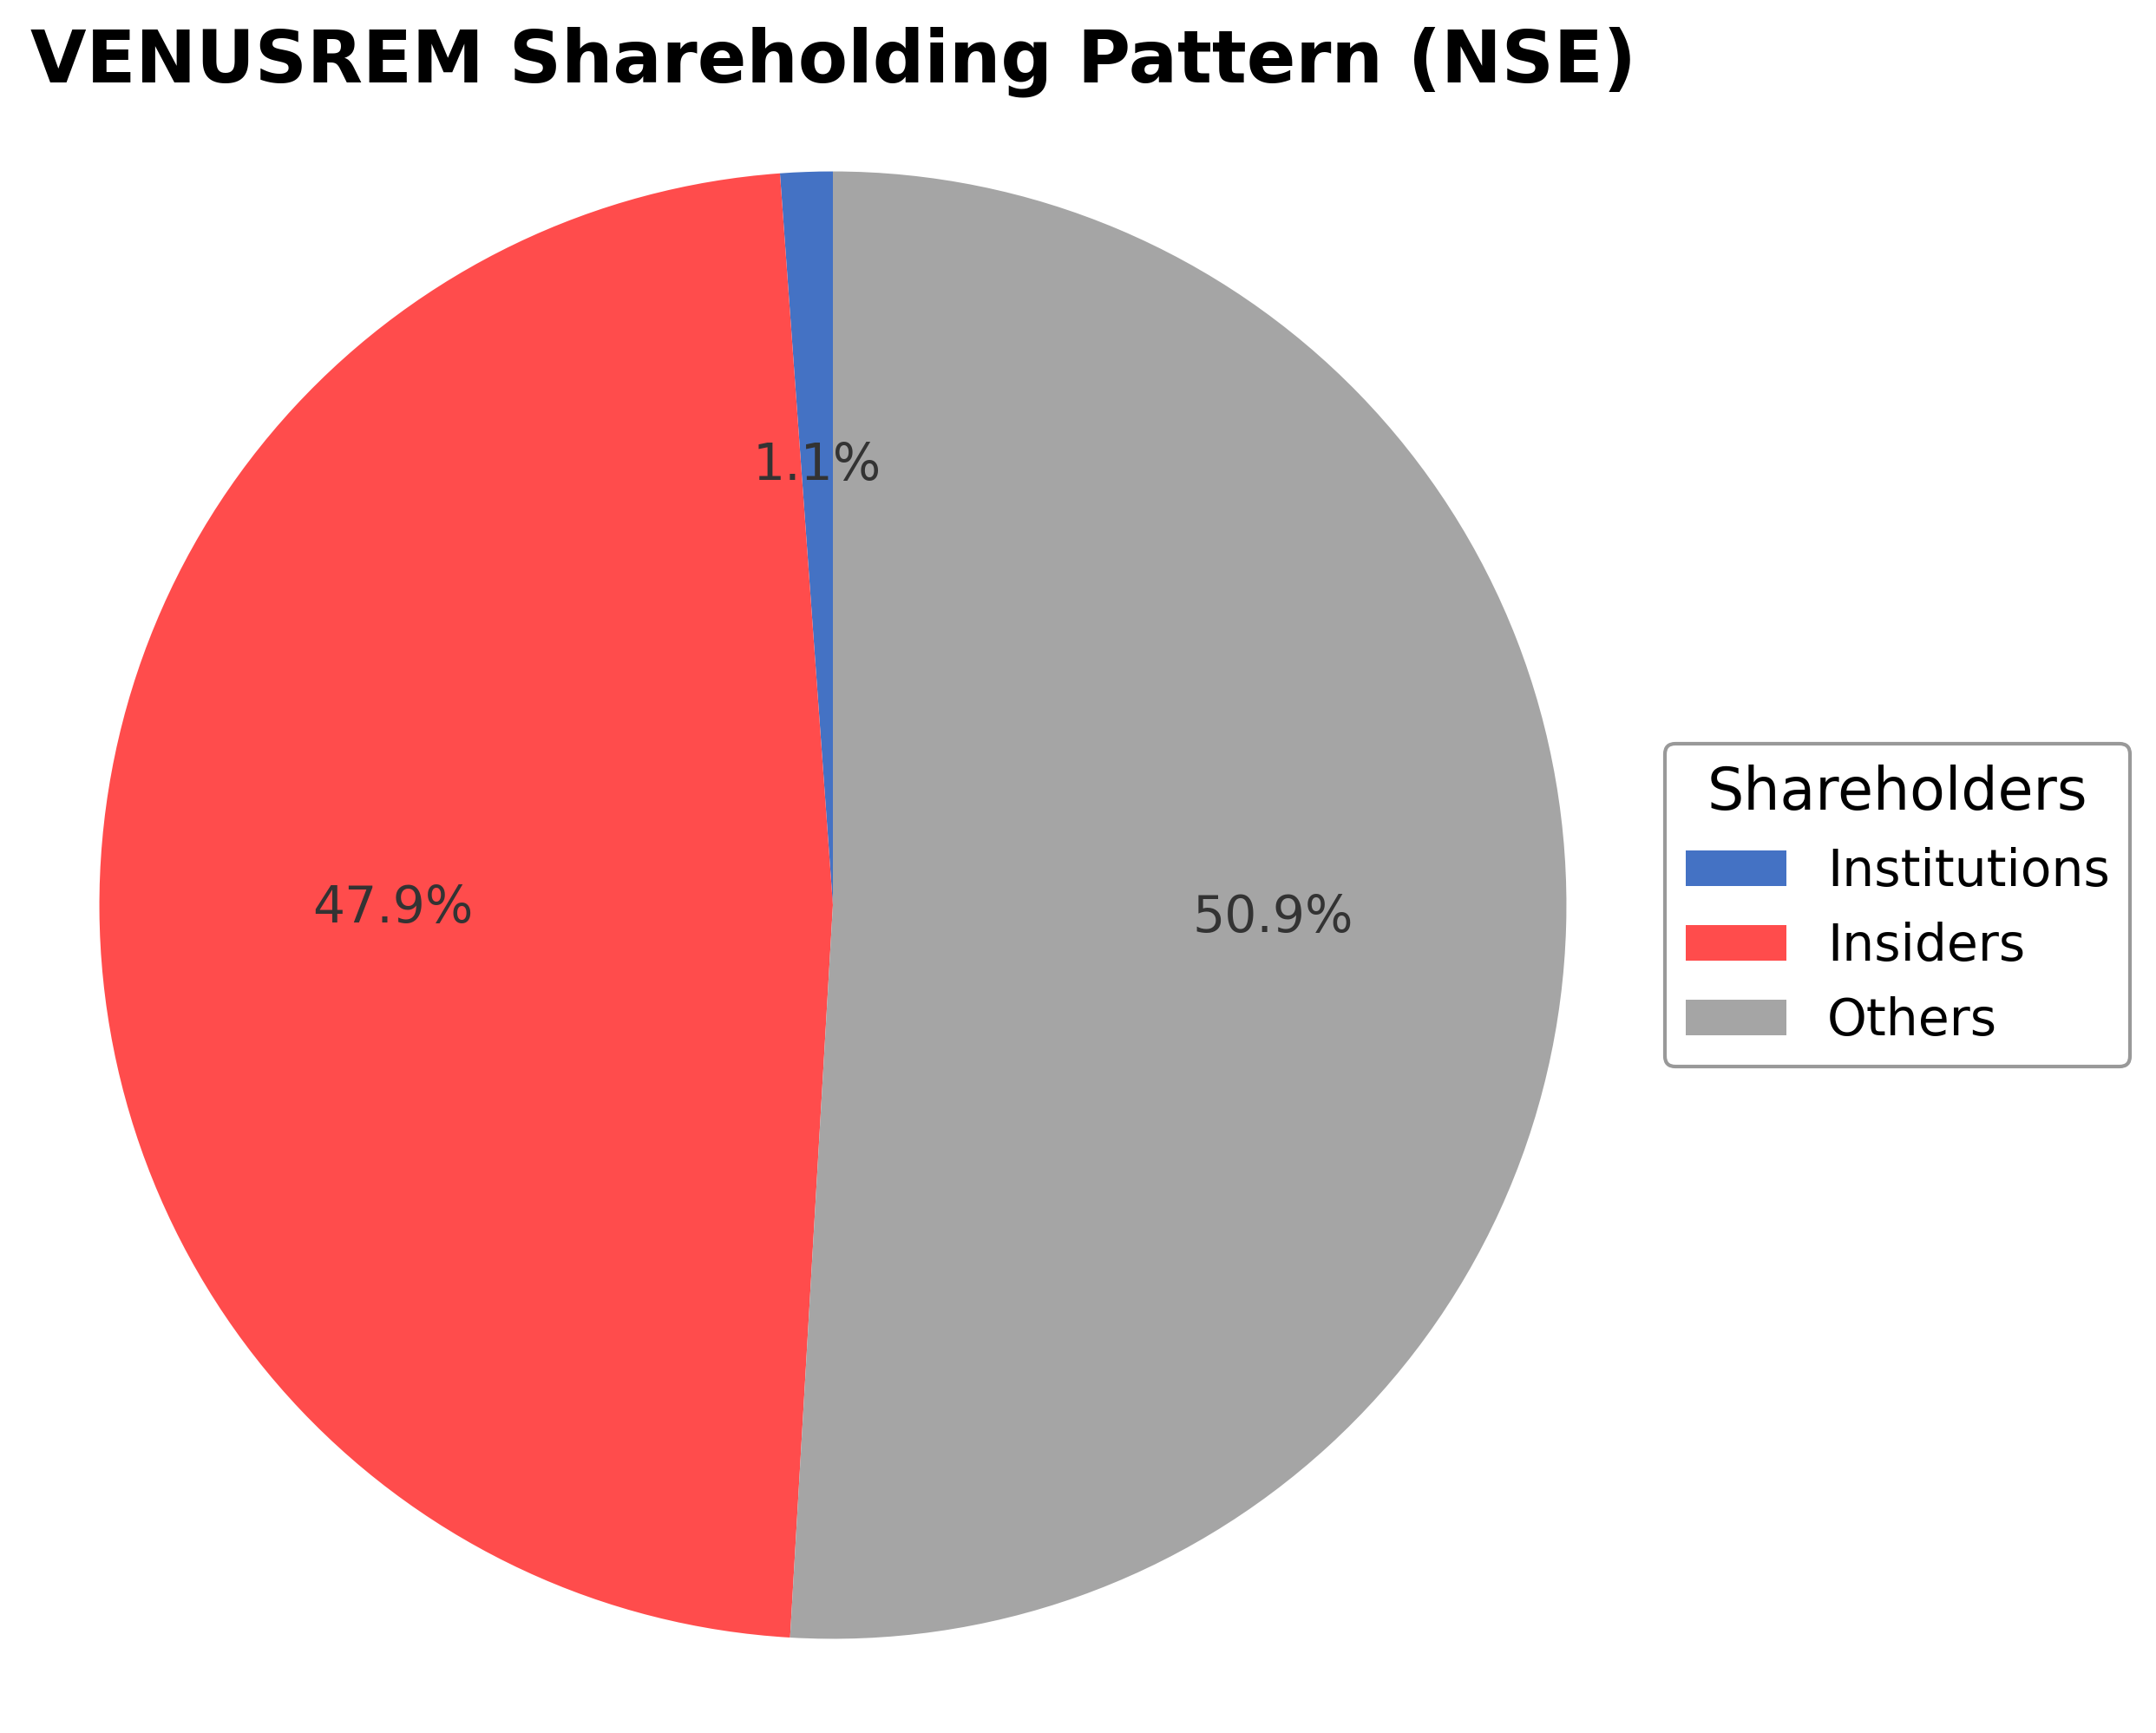
Venus Remedies Ltd.'s ownership structure comprises approximately 47.92% held by insiders including executives and promoter groups, 1.15% by institutional investors such as mutual funds and pension funds, and the remaining 50.93% by public shareholders including retail investors and employee stock plans. Over the past 12-24 months, the promoter group's stake has remained relatively stable, while institutional holdings have shown minor fluctuations without significant accumulation or distribution trends. Major institutional investors have maintained cautious positions, reflecting a balanced market sentiment. This ownership distribution suggests a governance framework influenced strongly by promoters with moderate institutional oversight, potentially impacting strategic decision-making and corporate actions. The company's position within the specialty and generic drug manufacturing industry in India aligns with sector dynamics characterized by regulatory oversight and competitive innovation.
Sector and Industry Analysis
Venus Remedies Ltd. operates within the Indian pharmaceutical sector, a critical segment of the broader healthcare industry. The pharmaceutical sector in India is among the largest globally, valued at over USD 50 billion and projected to grow at a CAGR of approximately 9-12% over the next five years, driven by rising healthcare demand, expanding middle-class income, and increased government healthcare spending. Key players in this sector include multinational corporations like Sun Pharma, Dr. Reddy’s Laboratories, and Cipla, alongside numerous domestic firms such as Venus Remedies that focus on niche therapeutic areas and contract manufacturing. The sector’s growth is fueled by both domestic demand and export opportunities, with India being a major global supplier of generic medicines.
Industry trends in the pharmaceutical space are marked by significant technological advancements and evolving consumer behavior. There is a pronounced shift towards biologics, biosimilars, and specialty drugs, alongside traditional generics. Digital transformation is accelerating, with increased adoption of AI-driven drug discovery, telemedicine, and e-pharmacies reshaping distribution and patient engagement. Consumer preferences are also shifting towards personalized medicine and wellness products, creating new avenues for innovation. Additionally, contract research and manufacturing services (CRAMS) are expanding rapidly, offering companies like Venus Remedies opportunities to leverage their manufacturing capabilities for global pharmaceutical firms.
The regulatory environment in India’s pharmaceutical sector is complex and evolving, governed primarily by the Drugs and Cosmetics Act, 1940, and regulated by the Central Drugs Standard Control Organization (CDSCO). Compliance with Good Manufacturing Practices (GMP), intellectual property rights, and pricing controls under the National Pharmaceutical Pricing Authority (NPPA) are critical. Recent policy initiatives such as the Pharmaceutical Policy 2020 emphasize boosting domestic manufacturing, encouraging innovation, and streamlining approvals to enhance competitiveness. However, regulatory scrutiny on quality standards and export compliance remains stringent, impacting operational flexibility and cost structures.
Competitive dynamics in the Indian pharmaceutical industry are characterized by a fragmented market structure with numerous small and mid-sized players alongside dominant large firms. Barriers to entry include high capital expenditure for manufacturing facilities, stringent regulatory approvals, and the need for robust R&D capabilities. Companies differentiate through product portfolios, manufacturing quality, regulatory compliance, and strategic partnerships. Venus Remedies, with a market capitalization of approximately ₹11.7 billion and a focus on contract manufacturing and niche formulations, competes in a moderately concentrated sub-sector where scale, cost efficiency, and regulatory adherence are key competitive levers. The industry’s competitive intensity is heightened by pricing pressures and the ongoing need for innovation to meet both domestic and international market demands.
Note: Analysis synthesized from industry research, market reports, and regulatory filings. Information is subject to change based on market conditions.
Illustrative Scenario Analysis
DCF Assumptions:
Method: Two-Stage EPS-Priority Model
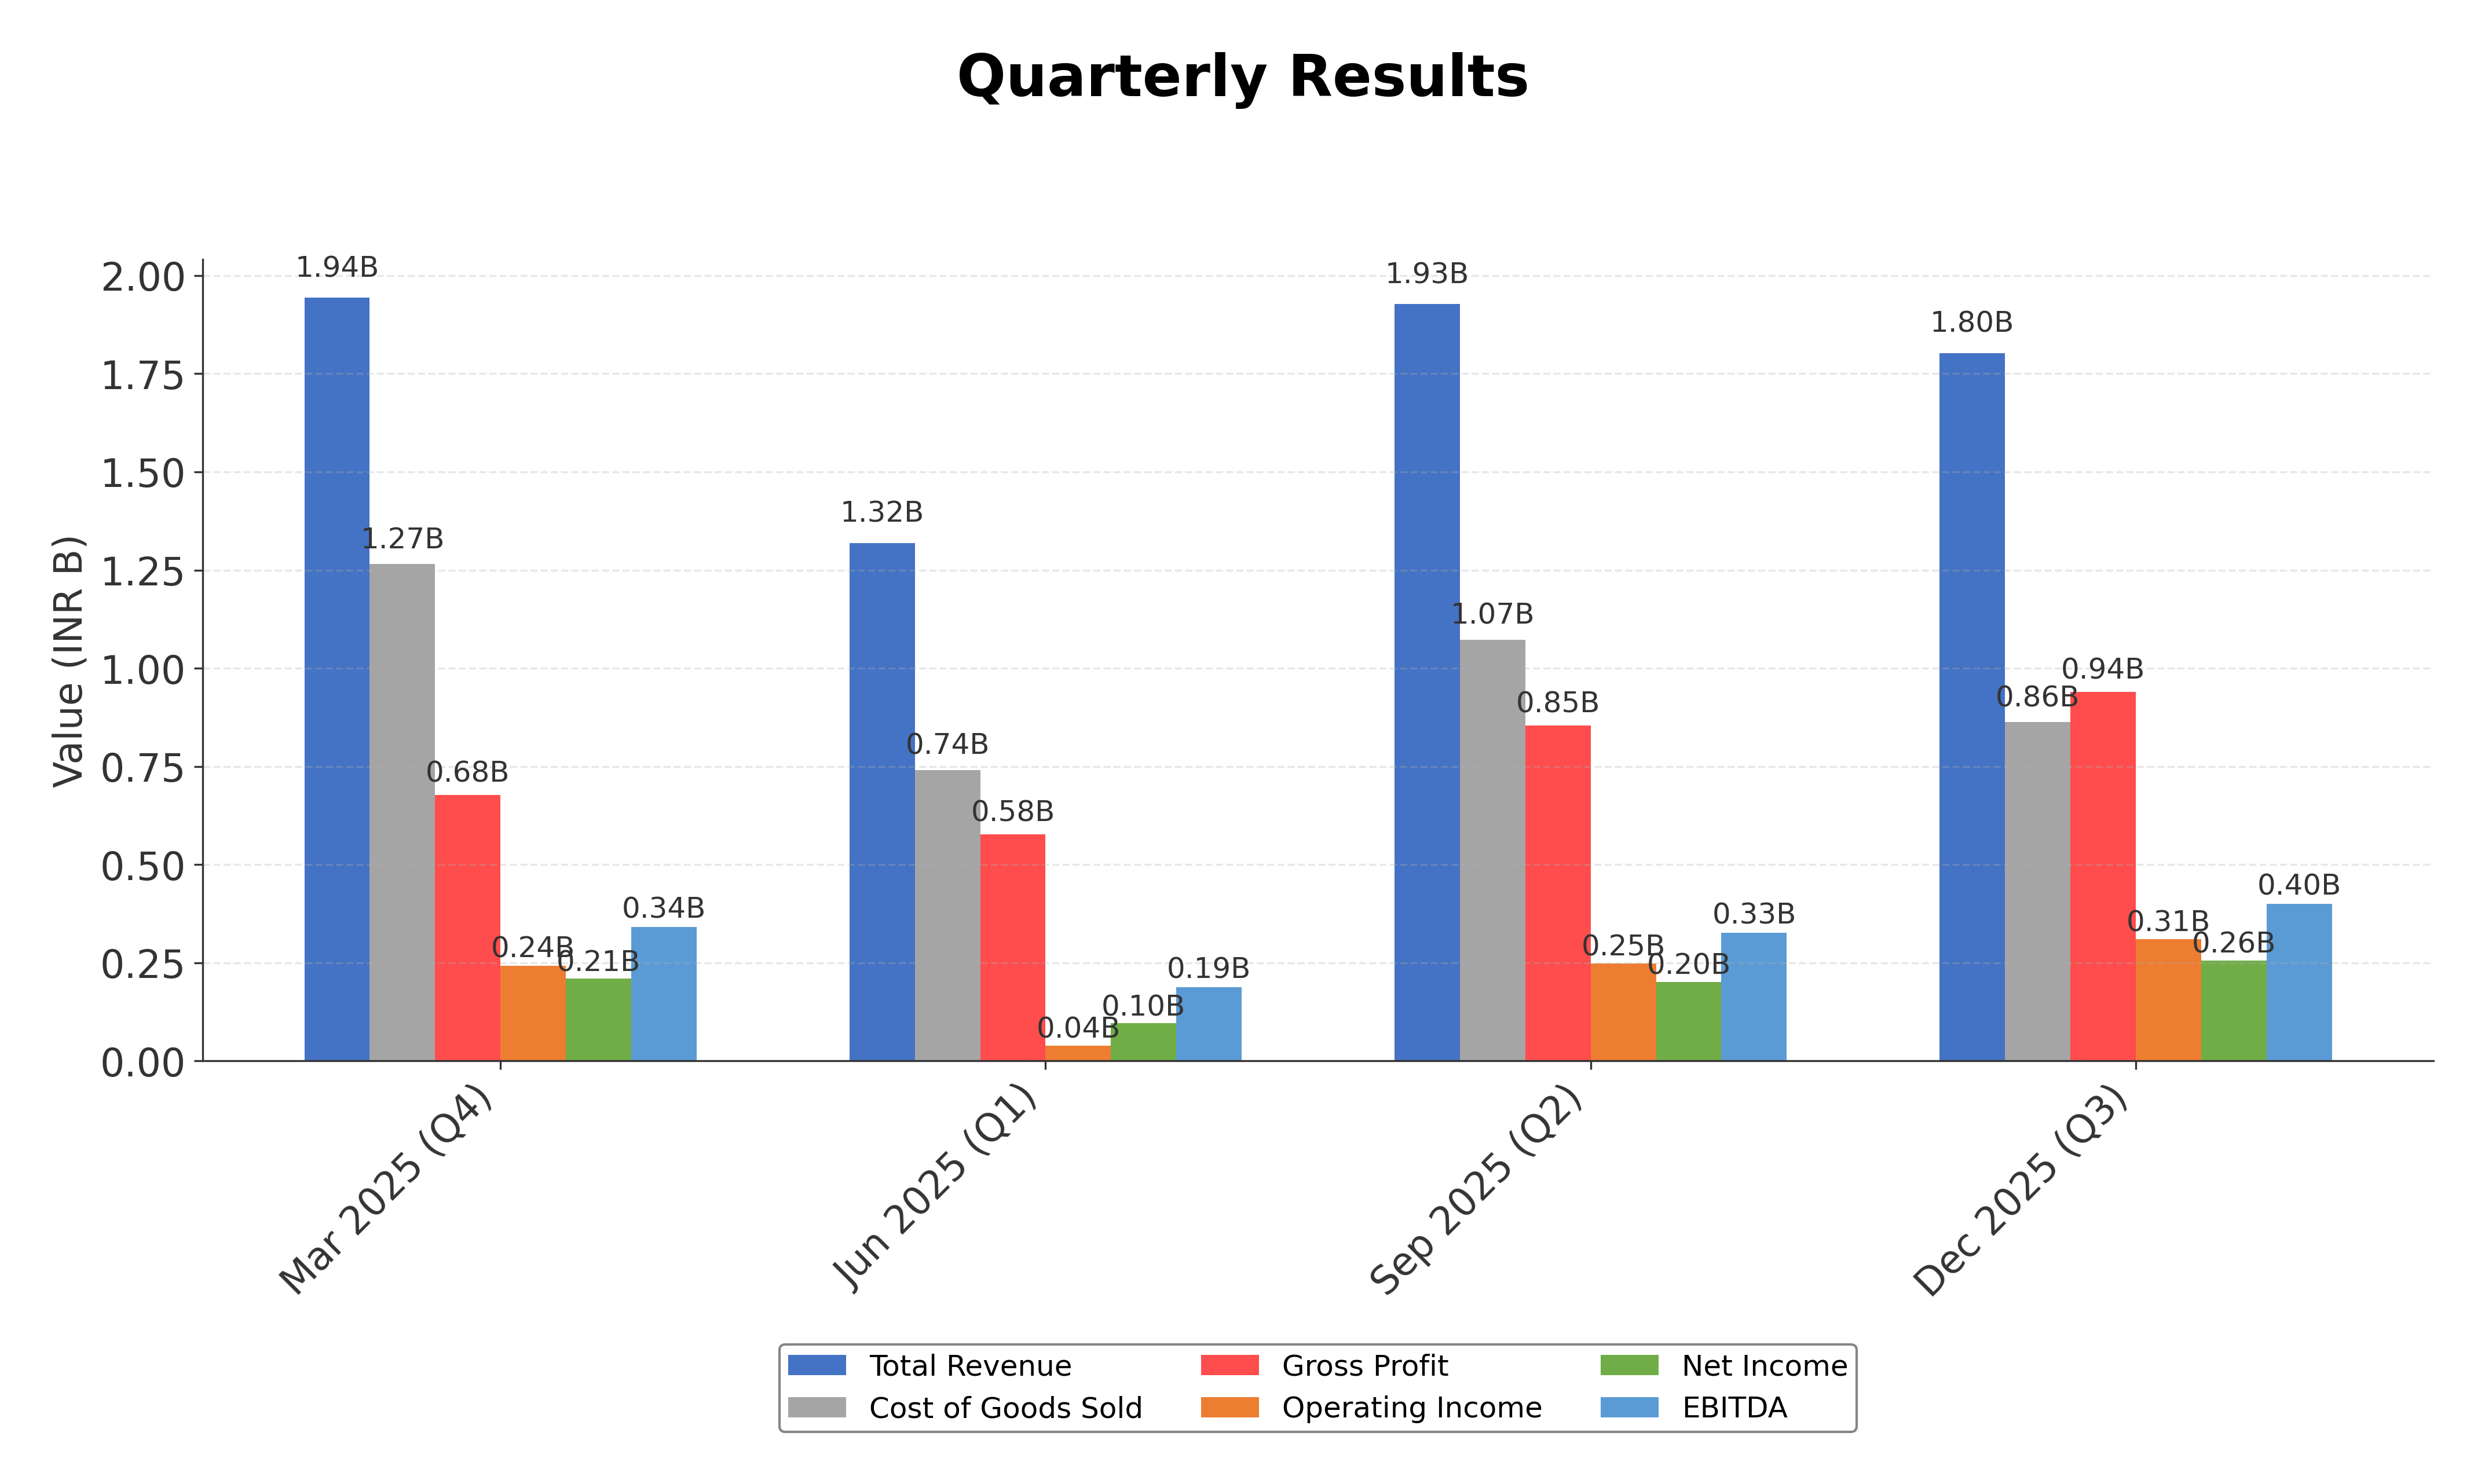
Financials
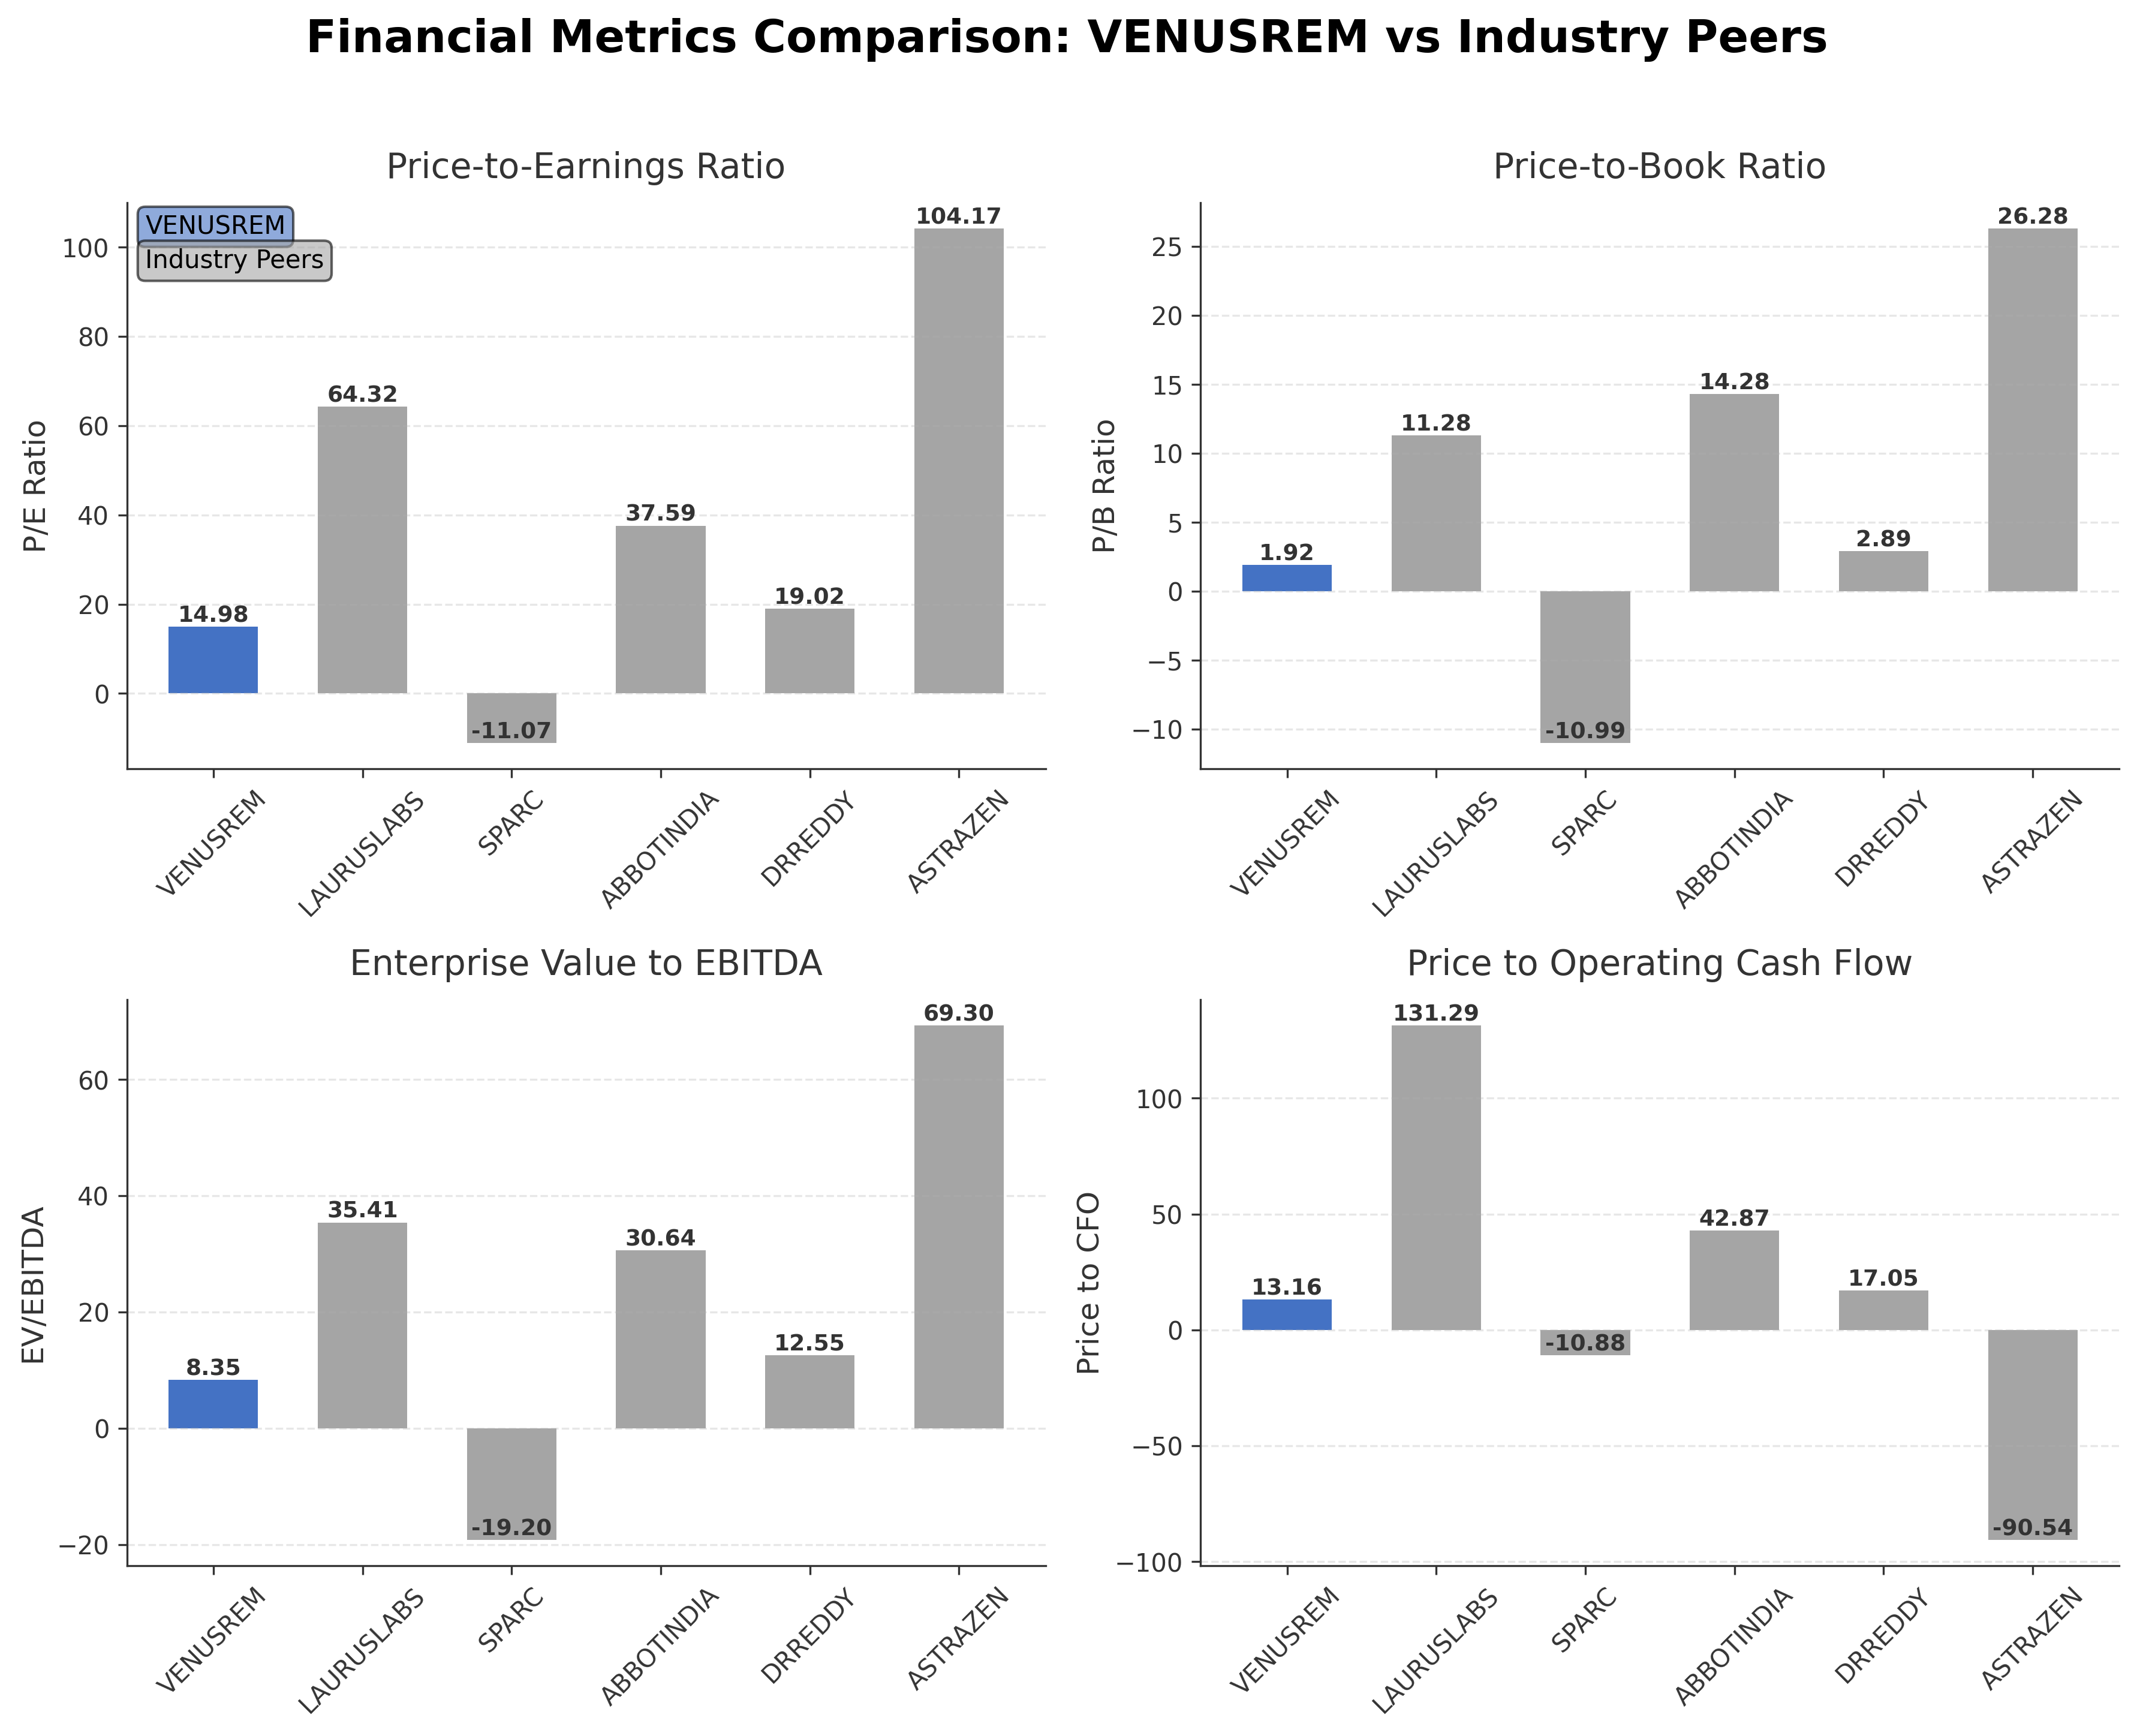
Peer Analysis
| Company Name | Market Cap | P/E Ratio | P/B Ratio | EV/EBITDA | Price to CFO |
|---|---|---|---|---|---|
| Venus Remedies Ltd. | ₹11.62B | 14.98 | 1.92 | 8.35 | 13.16 |
| Laurus Labs Ltd. | ₹541.82B | 64.32 | 11.28 | 35.41 | 131.29 |
| Sun Pharma Advanced Research Company Ltd. | ₹37.91B | -11.07 | -10.99 | -19.20 | -10.88 |
| Abbott India Ltd. | ₹572.88B | 37.59 | 14.28 | 30.64 | 42.87 |
| Dr. Reddy's Laboratories Ltd. | ₹1.08T | 19.02 | 2.89 | 12.55 | 17.05 |
| AstraZeneca Pharma India Ltd. | ₹210.03B | 104.17 | 26.28 | 69.30 | -90.54 |
Comparison Analysis: Venus Remedies Ltd. presents a more moderate valuation profile compared to its larger Indian pharmaceutical peers, with a trailing P/E ratio of 14.98 and an EV/EBITDA of 8.35, which are significantly lower than those of companies like Laurus Labs and AstraZeneca Pharma India. The company’s price-to-book ratio of 1.92 is also more conservative relative to peers trading above 10. Return on equity at 8.08% aligns with Laurus Labs but exceeds that of several larger peers, indicating efficient equity utilization. Price to cash flow metrics suggest Venus Remedies operates with better cash flow valuation compared to peers with extreme or negative values. Overall, Venus Remedies appears positioned as a value-oriented player within the specialty and generic pharmaceutical sector in India.
Financial Metrics Comparison with Peers
Financial Statements
Comprehensive financial data including income, balance sheet, and cash flow metrics
Income Statement
| fiscal_date | 2025-03-31 | 2024-03-31 | 2023-03-31 | 2022-03-31 | 2021-03-31 |
|---|---|---|---|---|---|
| Sales | 6.47B | 5.91B | 5.53B | 5.99B | 5.48B |
| Cost Of Goods | 4.02B | 3.73B | 3.45B | 4.00B | 3.52B |
| Gross Profit | 2.45B | 2.18B | 2.08B | 1.99B | 1.96B |
| Operating Expense Research And Development | 180.84M | 158.40M | 228.85M | 230.30M | 157.57M |
| Operating Expense Selling General And Administrative | 810.56M | 785.76M | 640.62M | 573.64M | 771.93M |
| Operating Expense Other Operating Expenses | 19.24M | 21.72M | 14.48M | 13.52M | 8.99M |
| Operating Income | 410.23M | 331.57M | 277.27M | 285.80M | 185.01M |
| Non Operating Interest Income | 129.95M | 41.66M | 18.99M | 8.16M | 1.22M |
| Non Operating Interest Expense | 654.00K | 937.00K | 1.18M | 1.98M | 70.10M |
| Pretax Income | 718.26M | 446.43M | 379.30M | 364.08M | 485.53M |
| Income Tax | 265.12M | 161.53M | 113.65M | -43.16M | -132.12M |
| Net Income | 453.15M | 284.91M | 265.66M | 407.24M | 617.65M |
| Eps Basic | 33.90 | 21.31 | 19.88 | 30.86 | 50.04 |
| Eps Diluted | 33.90 | 21.31 | 19.88 | 30.86 | 50.04 |
| Basic Shares Outstanding | 13.37M | 13.37M | 13.37M | 13.20M | 12.34M |
| Diluted Shares Outstanding | 13.37M | 13.37M | 13.37M | 13.20M | 12.34M |
| Ebit | 718.92M | 447.37M | 380.48M | 366.06M | 555.64M |
| Ebitda | 828.57M | 706.29M | 703.38M | 701.40M | 673.98M |
| Net Income Continuous Operations | 618.72M | 446.43M | 379.30M | 364.08M | 251.11M |
| Preferred Stock Dividends | 0.00 | 0.00 | 0.00 | 0.00 | 0.00 |
Data provided by Twelve Data
Balance Sheet
| fiscal_date | 2025-03-31 | 2024-03-31 | 2023-03-31 | 2022-03-31 | 2021-03-31 |
|---|---|---|---|---|---|
| Cash And Cash Equivalents | 575.23M | 489.56M | 212.12M | 432.56M | 288.79M |
| Accounts Receivable | 1.12B | 804.98M | 766.60M | 386.00M | 320.42M |
| Total Assets | 7.16B | 6.27B | 6.01B | 5.80B | 5.56B |
| Total Liabilities | 1.55B | 1.39B | 1.41B | 1.39B | 1.56B |
| Long Term Debt | 0.00 | 386.79M | 386.79M | 386.79M | 468.31M |
| Shareholders Equity | 5.61B | 4.88B | 4.60B | 4.40B | 4.00B |
Data provided by Twelve Data
Cash Flow Statement
| fiscal_date | 2025-03-31 | 2024-03-31 | 2023-03-31 | 2022-03-31 | 2021-03-31 |
|---|---|---|---|---|---|
| Operating Activities Net Income | 618.72M | 446.43M | 379.30M | 364.08M | 251.11M |
| Operating Activities Other Non Cash Items | -48.85M | -44.61M | -21.52M | -9.89M | 61.08M |
| Operating Activities Other Assets Liabilities | 313.30M | -136.89M | -252.01M | -225.27M | 606.66M |
| Operating Activities Operating Cash Flow | 883.16M | 264.93M | 105.78M | 128.93M | 918.85M |
| Investing Activities Capital Expenditures | -94.27M | -93.18M | -78.18M | N/A | 575.74M |
| Investing Activities Net Intangibles | -84.50M | -42.00M | 0.00 | N/A | N/A |
| Investing Activities Purchase Of Investments | -649.47M | 0.00 | -453.63M | -46.03M | -24.38M |
| Investing Activities Sale Of Investments | 16.28M | 12.71M | 84.00K | 0.00 | N/A |
| Investing Activities Other Investing Activity | 4.06M | 8.72M | 4.44M | -129.40M | 583.51M |
| Investing Activities Investing Cash Flow | -723.40M | -71.75M | -527.28M | -175.43M | 1.13B |
| Financing Activities Long Term Debt Payments | -9.54M | -9.89M | -4.50M | -90.16M | -1.69B |
| Financing Activities Common Stock Issuance | 0.00 | N/A | N/A | 0.00 | 137.52M |
| Financing Activities Financing Cash Flow | -9.54M | -9.89M | -4.50M | -92.99M | -2.37B |
| End Cash Position | 575.23M | 489.56M | 212.12M | 432.56M | 288.79M |
| Free Cash Flow | 683.65M | 237.68M | 288.09M | 411.02M | 1.32B |
| Financing Activities Other Financing Charges | N/A | 1.00K | N/A | -2.83M | -100.00K |
| Financing Activities Short Term Debt Issuance | N/A | N/A | N/A | 0.00 | -814.23M |
Data provided by Twelve Data
Technical Analysis
Key Insights
- The stock exhibits an upward trend, trading above both its 50-day moving average (~₹757.73) and 200-day moving average (~₹592.08), indicating sustained bullish momentum.
- Key support levels are near the 200-day moving average at approximately ₹592 and psychological support around ₹750; resistance is observed near the 52-week high at ₹944.75.
- The price remains comfortably above the 10-day, 50-day, and 200-day moving averages, reflecting positive medium- and long-term trend strength.
- Momentum indicators such as RSI and MACD suggest the stock is in a moderately overbought condition but without extreme divergence, while stochastic readings confirm short-term strength.
- Multi-timeframe analysis across daily, weekly, and monthly charts consistently shows a bullish bias with higher highs and higher lows.
- Potential market scenarios include continuation of the upward trend if support levels hold, with possible consolidation near resistance zones; a breach below the 50-day moving average could signal trend weakening.
Trending News
1. Headline: Venus Remedies Ltd Hits Upper Circuit Amid Strong Buying Pressure
Summary: Venus Remedies Ltd, a micro-cap player in the Pharmaceuticals & Biotechnology sector, surged to hit its upper circuit limit on 20 Mar 2026, reflecting strong buying interest. This price movement indicates heightened market attention and potential momentum in the stock, driven by recent positive developments and investor sentiment.
Sentiment: Positive
2. Headline: Venus Remedies receives Indonesian marketing approval for combination antibiotic, ceftazidime+avibactam
Summary: Venus Remedies has secured marketing approval in Indonesia for its combination antibiotic ceftazidime+avibactam. This regulatory milestone marks the company’s first generic entry of this antibiotic in the Indonesian market, potentially expanding its geographic footprint and product portfolio in Southeast Asia.
Sentiment: Neutral
3. Headline: Further Upside For Venus Remedies Limited (NSE:VENUSREM) Shares Could Introduce Price Risks After 25% Bounce
Summary: Following a significant price increase of approximately 25%, Venus Remedies shares face potential price risks due to valuation considerations. The report highlights that many Indian companies trade at higher P/E ratios, suggesting that the recent price surge may warrant cautious monitoring of valuation levels.
Sentiment: Neutral
4. Headline: Venus Remedies Limited Announces Promoter Group Merger Between Sunev Pharma Solutions and Spine Software Systems
Summary: Venus Remedies announced an internal promoter group merger whereby Sunev Pharma Solutions' 17.21% stake will transfer to Spine Software Systems upon scheme effectiveness. This restructuring aims to consolidate promoter holdings and streamline ownership within the group.
Sentiment: Neutral
5. Headline: Venus Remedies gets Indonesia nod for Ceftazidime–Avibactam; first generic entry in country
Summary: Venus Remedies Ltd has obtained regulatory approval in Indonesia for Ceftazidime-Avibactam, marking the first generic launch of this antibiotic in the country. This approval enhances the company's international market presence and product diversification in the antibiotic segment.
Sentiment: Positive
Powered by Brave
Recent Updates
News Summary
Recent news highlights for Venus Remedies Ltd. include a notable surge to the upper circuit limit on 20 March 2026, signaling strong market interest. The company achieved regulatory approval in Indonesia for its combination antibiotic ceftazidime+avibactam, marking a strategic expansion into Southeast Asian markets. Additionally, an internal promoter group merger was announced, consolidating a 17.21% stake transfer between affiliated entities, which may streamline ownership and governance. Market commentary indicates that after a 25% price increase, valuation risks warrant monitoring. These developments collectively underscore Venus Remedies' active efforts in geographic expansion, corporate restructuring, and market engagement amid evolving sector conditions.
News Sentiment
The overall sentiment from recent news is moderately positive, driven by regulatory approvals and strong buying interest reflected in price movements. Neutral tones prevail around corporate restructuring and valuation concerns, suggesting balanced market perspectives. Positive regulatory milestones and price momentum contribute to constructive sentiment, while caution is noted regarding valuation levels after recent gains. This mixed sentiment profile reflects ongoing market evaluation of the company's growth trajectory and operational initiatives.
Analytical Overview
Analysis Summary
Valuation Metrics: Venus Remedies' trailing P/E ratio of approximately 15 aligns closely with the industry average of 14.98, indicating a valuation consistent with sector norms. The PEG ratio below 0.5 suggests the stock may be undervalued relative to its earnings growth potential, though forward P/E data is unavailable for further assessment.
Growth Trajectory: The company exhibits modest revenue growth of 1.9% quarterly and a strong quarterly earnings growth of 30.5% year-over-year, supported by positive operating cash flow trends. These figures indicate a stable growth trajectory with improving profitability.
Financial Health: Venus Remedies maintains a healthy current ratio above 3, reflecting strong short-term liquidity, and a low total debt relative to equity at 2.42. Operating cash flow and free cash flow remain positive, supporting operational stability and financial flexibility.
Sector Specific Factors: Operating within India's regulated pharmaceutical sector, Venus Remedies faces challenges such as compliance demands and competitive pressures but benefits from growing domestic healthcare needs and export opportunities. Regulatory approvals in new markets like Indonesia highlight expansion potential.
Market Positioning: The company holds a niche position in specialty and generic drug manufacturing with strategic collaborations and a diversified product portfolio. Its moderate market capitalization and valuation metrics position it as a value-focused player amid larger industry competitors.
Investment Conclusion
Supporting Factors: Valuation metrics align with industry averages, supported by a low PEG ratio indicating potential value.
Risk Factors: Limited forward P/E data constrains comprehensive valuation assessment.
SWOT Analysis
Strengths
- Strong gross margin of over 52% supports profitability.
- Healthy current ratio above 3 indicates robust liquidity.
- Diverse product portfolio in specialty and generic pharmaceuticals.
- Positive quarterly earnings growth of 30.5% year-over-year.
Weaknesses
- Relatively high debt-to-equity ratio of 2.42 may increase financial risk.
- Limited institutional investor presence at approximately 1.15%.
- Forward P/E ratio data is unavailable, limiting forward valuation insight.
- Market capitalization is modest compared to larger industry peers.
Opportunities
- Regulatory approvals in new international markets like Indonesia expand growth potential.
- Strategic promoter group mergers may streamline governance and operational efficiency.
- Increasing demand for specialty and generic drugs in emerging markets.
- Investment in research and development supports innovation pipeline.
Threats
- Stringent regulatory environment in pharmaceutical industry poses compliance risks.
- Competitive pressures from larger pharmaceutical companies with higher market capitalization.
- Potential valuation risks following recent significant price appreciation.
- Economic and policy changes in domestic and export markets could impact operations.
Company Description
Venus Remedies Ltd. is a prominent pharmaceutical company involved in the research, development, manufacturing, and sales of a wide spectrum of high-quality pharmaceutical products. Primarily focused on therapeutic sectors such as oncology, antibiotics, and pain management, the company contributes significantly to the healthcare industry by providing advanced formulations and generic drugs. Venus Remedies operates within a highly regulated environment, ensuring strict compliance with international quality standards. The company's portfolio includes niche products that address both chronic and acute medical conditions, with a commitment to enhancing patient care through innovative drug delivery systems. Headquartered in India, Venus Remedies extends its market presence globally, exporting products to numerous countries while maintaining a robust domestic market share. Its strategic collaborations, expansion into emerging markets, and investment in research and development fortify its role as a key player in the pharmaceutical industry.