

Vedanta Ltd (VEDL)
Stock Analysis Report
Stock Journey
Key Positives and Key Risks
Pros
- Trailing P/E ratio of 14.37 and forward P/E of 8.84 indicate attractive valuation relative to industry average of 14.37.
- Strong operating cash flow of ₹395 billion demonstrates robust cash generation capacity.
Cons
- Quarterly revenue declined sharply by 41.3%, signaling near-term operational challenges.
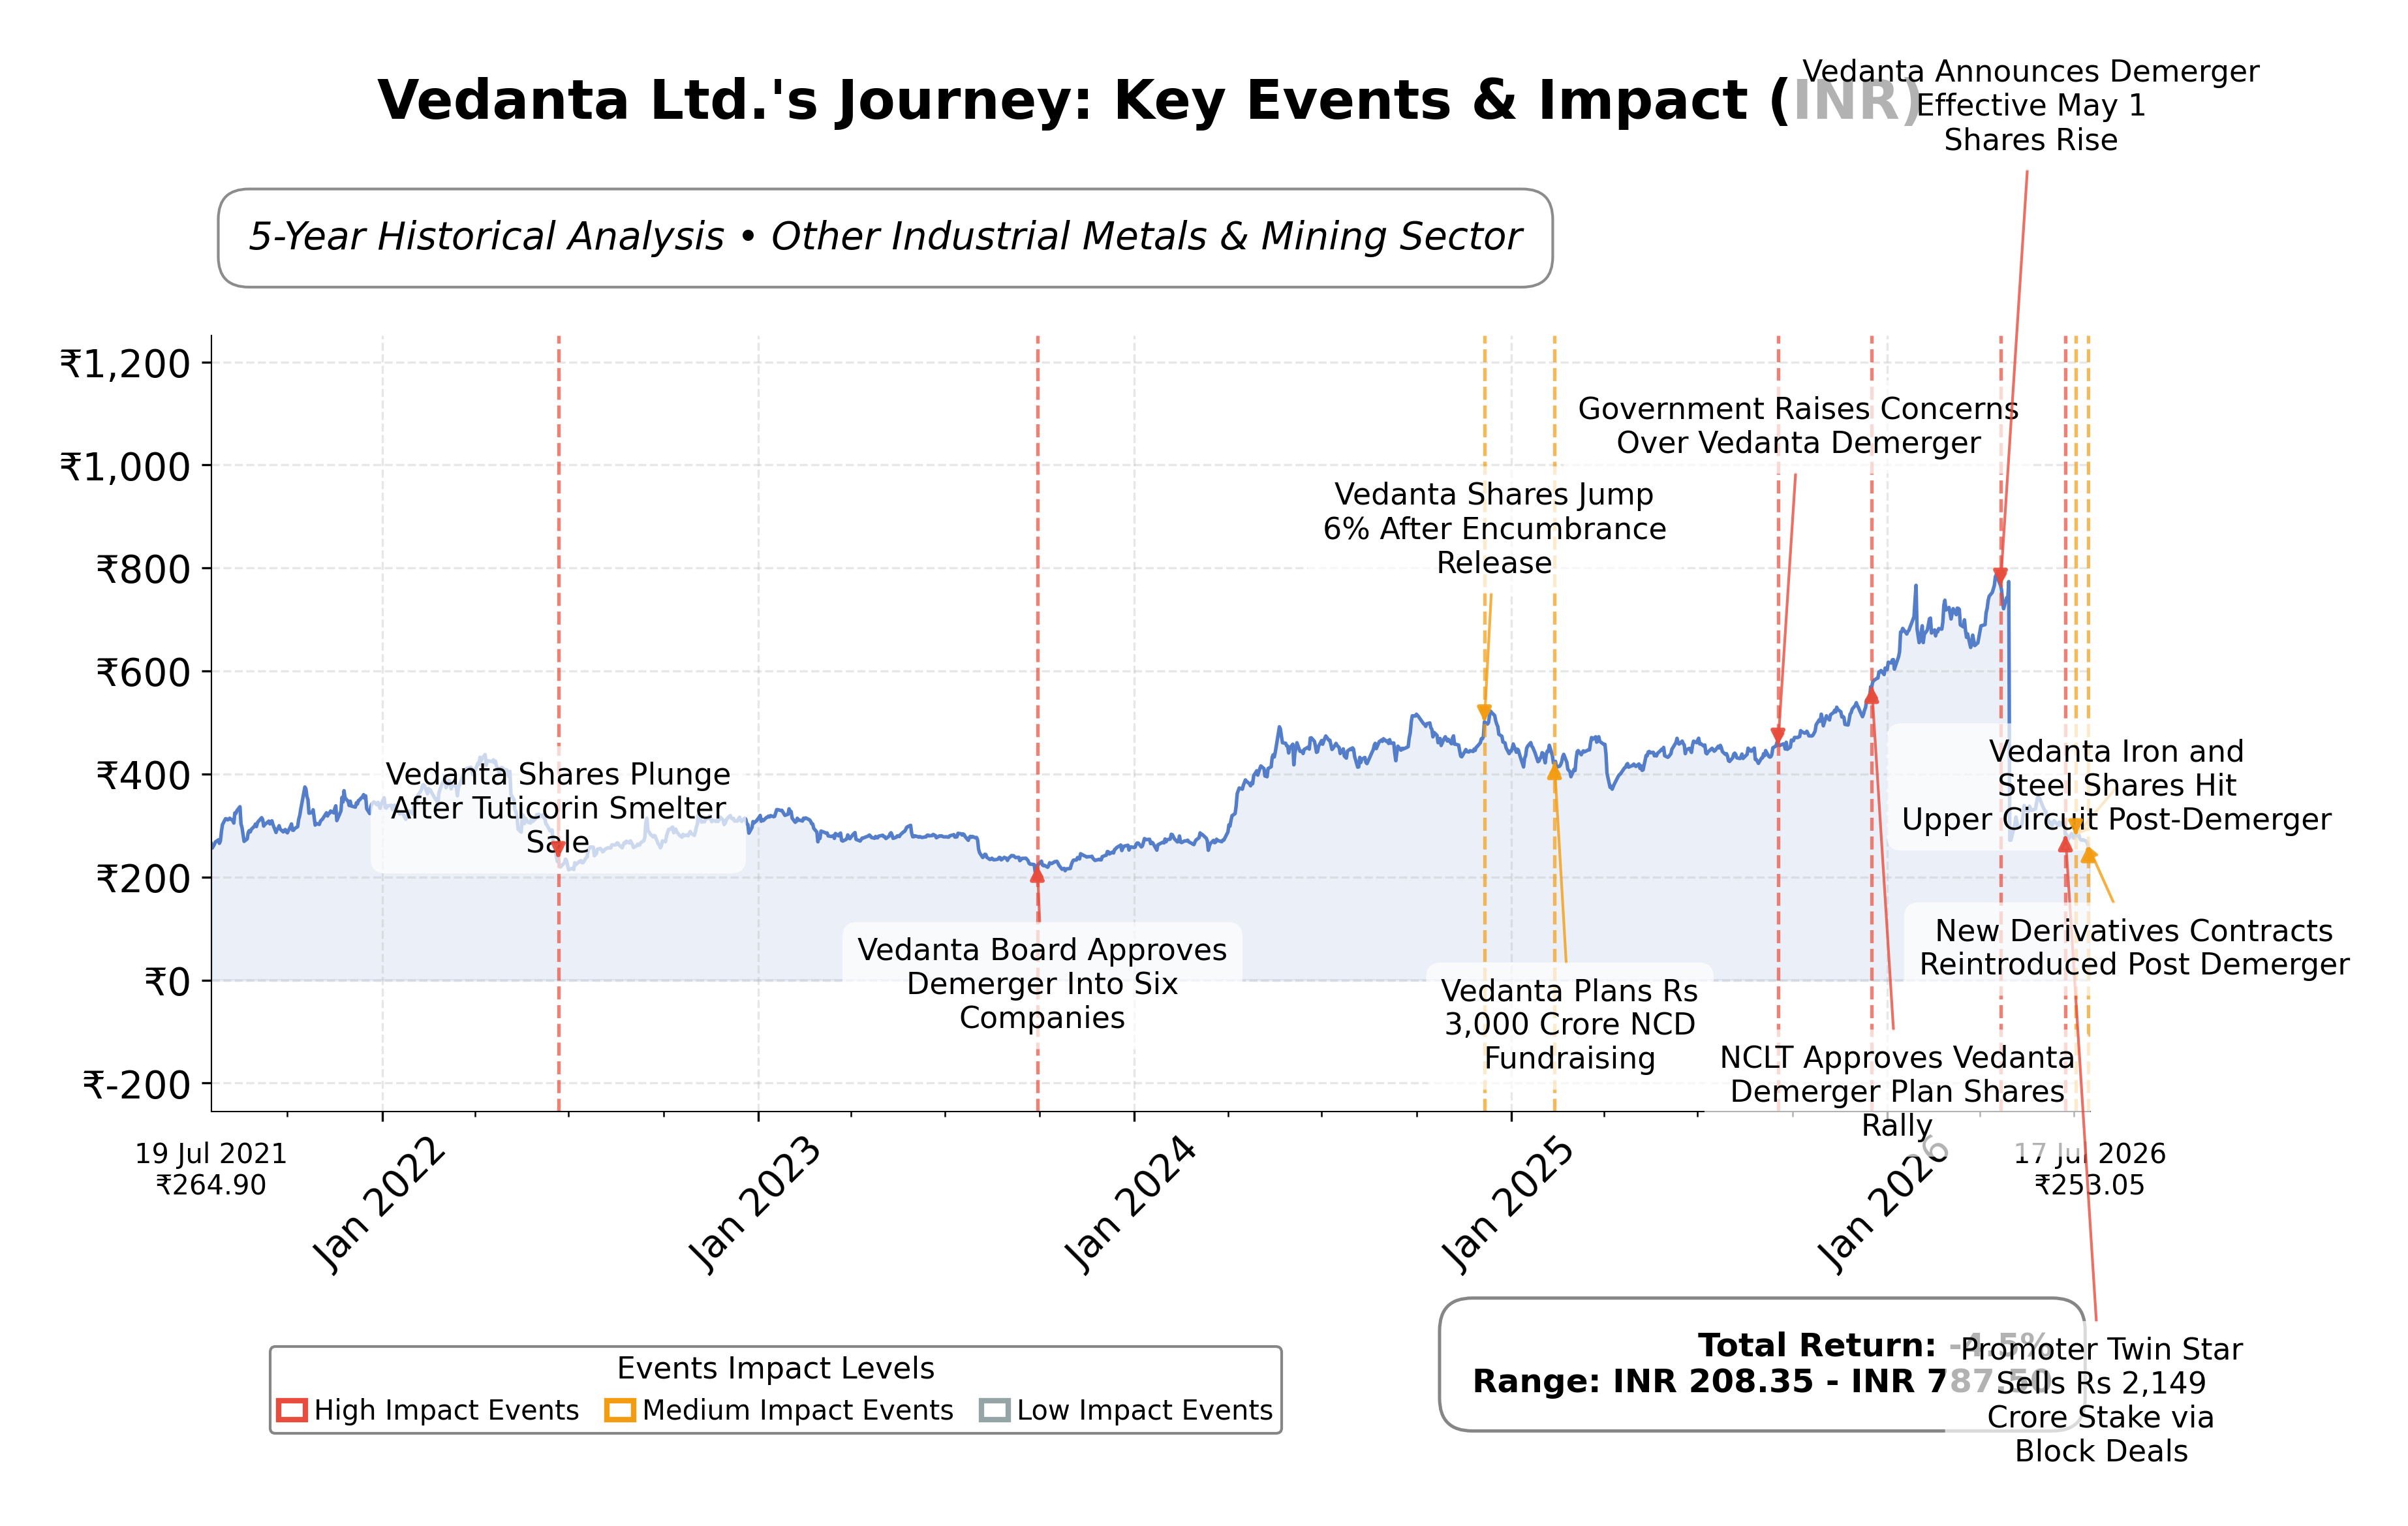
- Stock price is near 52-week low at ₹253, down over 79% from the high of ₹795, reflecting market concerns.
- Negative free cash flow of ₹-487.7 billion indicates heavy capital expenditure impacting liquidity.
Disclosure: This information is for general awareness and does not constitute investment advice
Report Summary
Vedanta Ltd. is a diversified natural resources company listed on the National Stock Exchange of India (NSE), operating primarily in the Basic Materials sector within the Other Industrial Metals & Mining industry. The company engages in exploration, extraction, and processing of metals such as zinc, lead, silver, copper, iron ore, and aluminum, alongside activities in oil and gas production and power generation. Vedanta’s integrated value chain and multi-country operations position it as a key player in supplying essential raw materials to various industrial sectors, including construction and automotive.
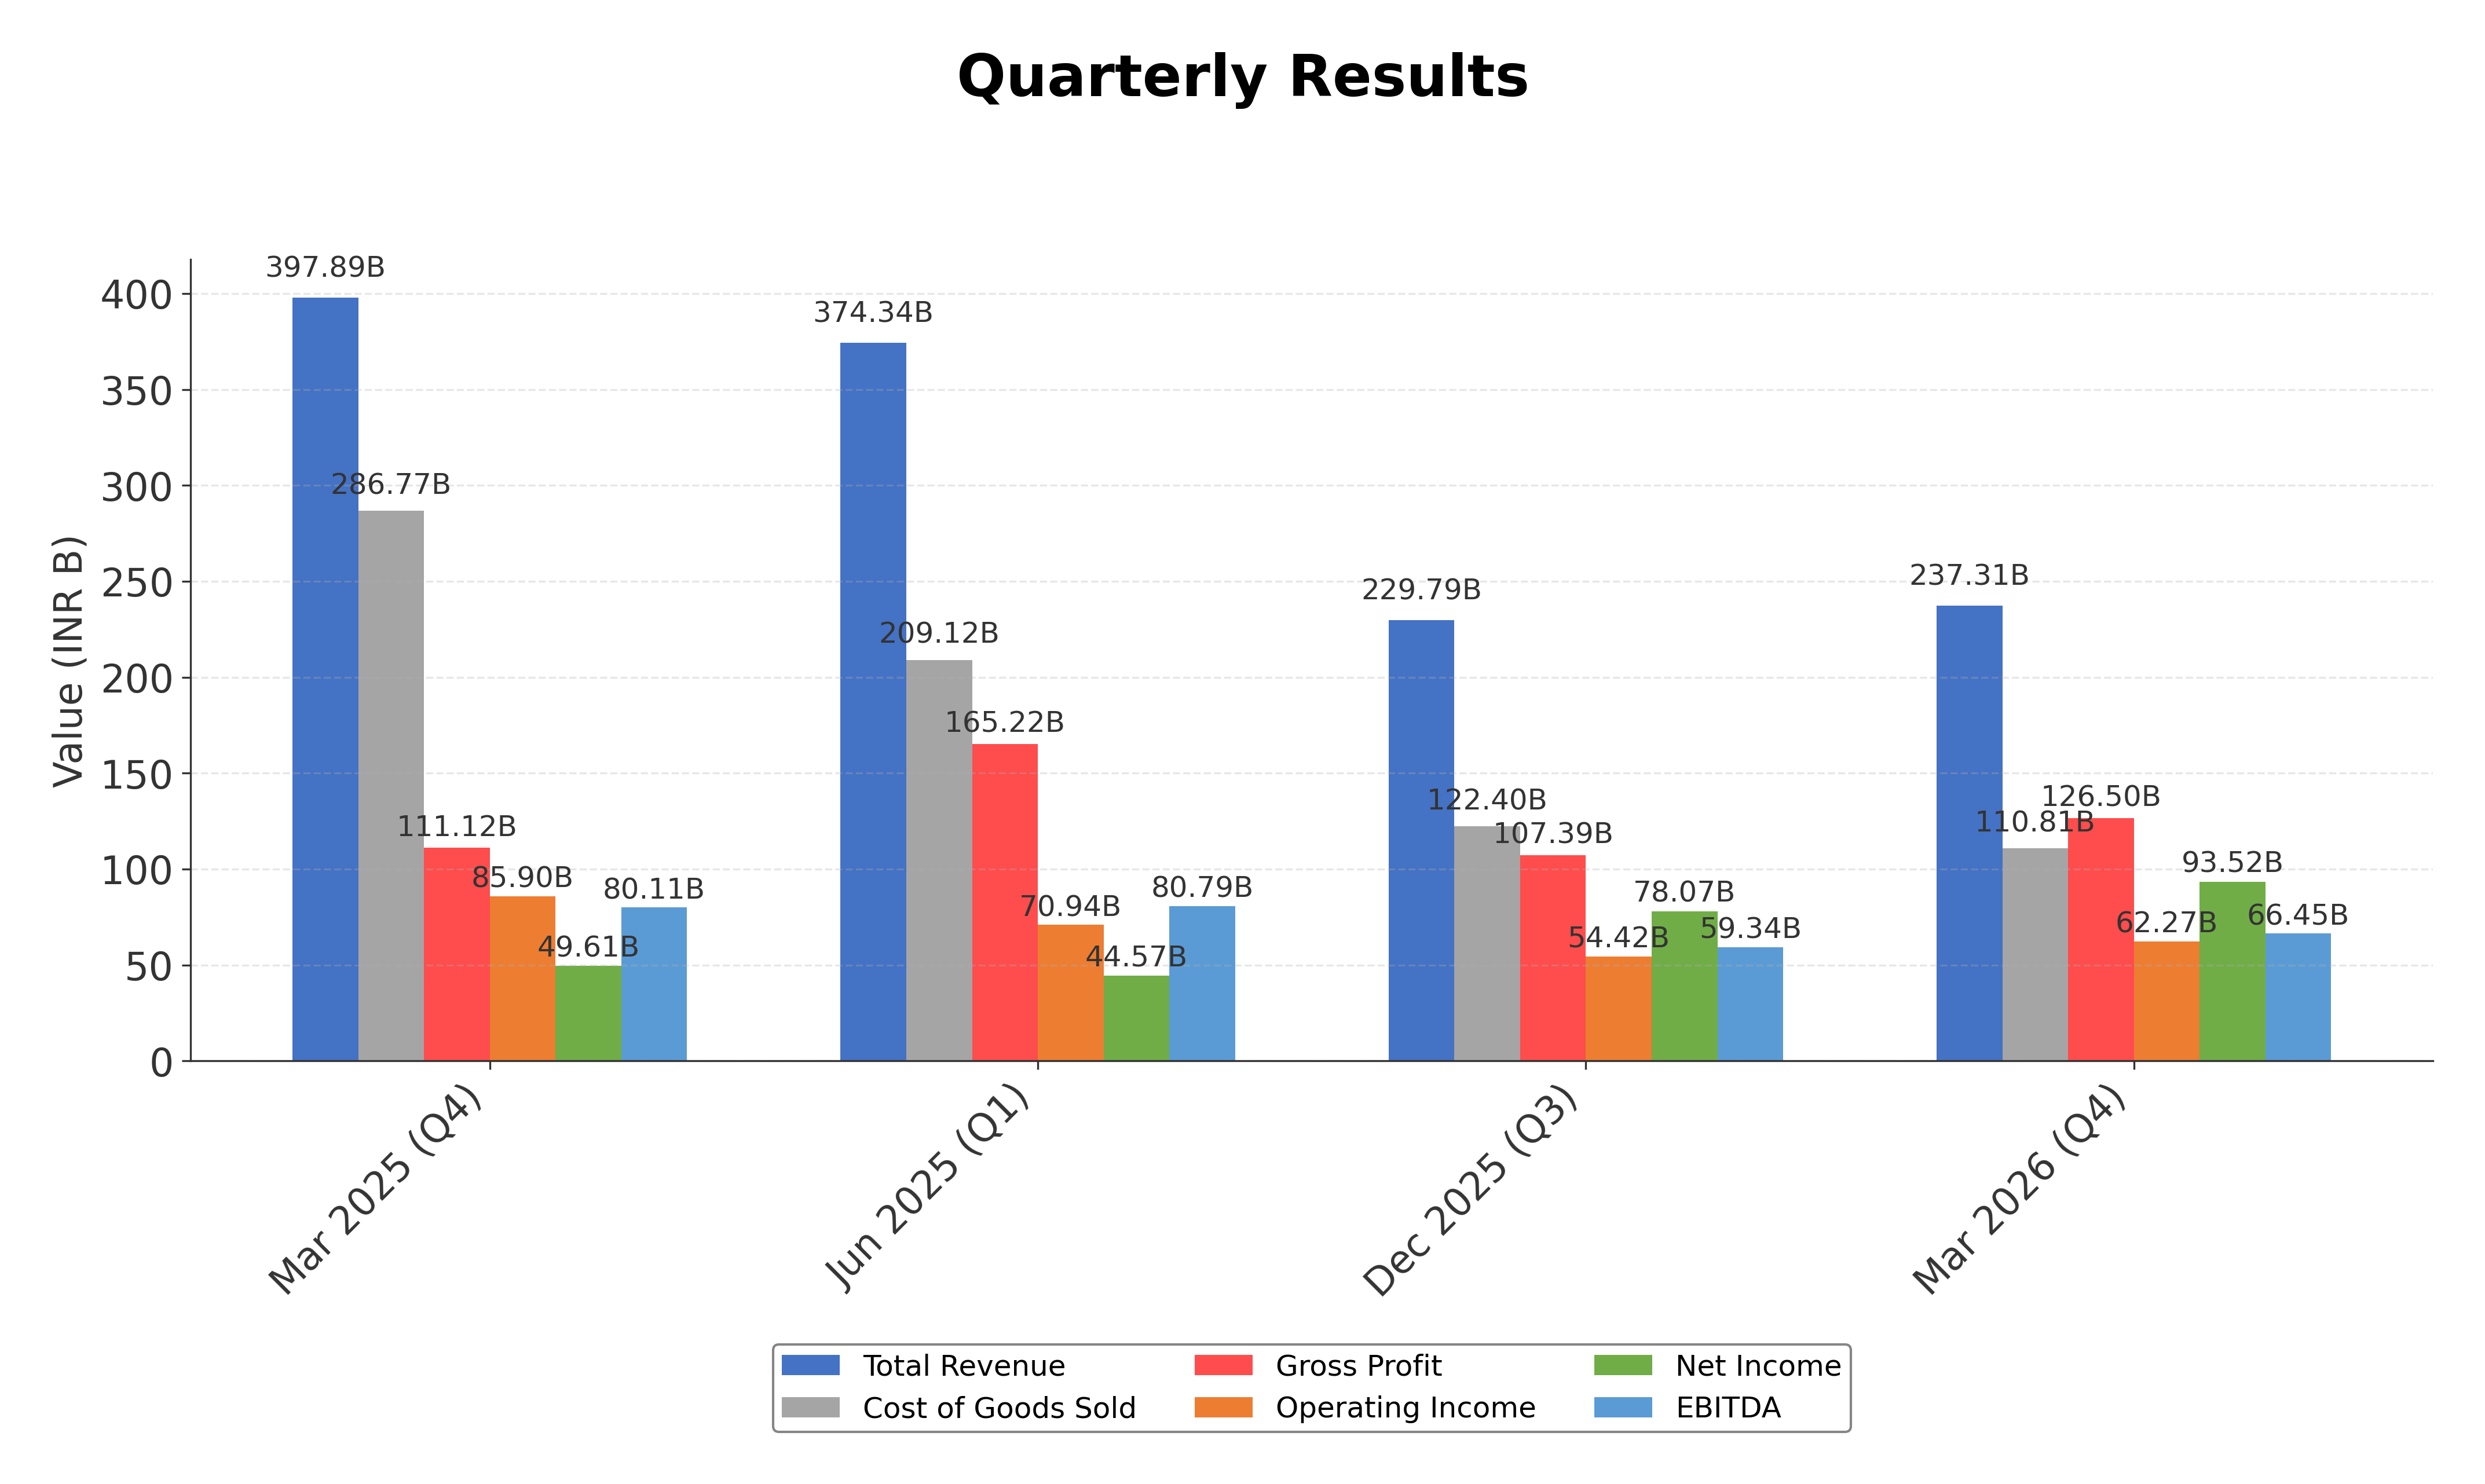
Financially, Vedanta reported trailing twelve months (TTM) revenue of approximately ₹768.87 billion with a gross margin of 53.3%, operating margin of 33.9%, and net profit margin of 22.6%. The company’s return on equity (ROE) stands at 20.4%, return on assets (ROA) at 5.3%, and return on invested capital (ROIC) is reflected in an enterprise value to EBITDA ratio of 4.89, indicating efficient capital utilization and solid profitability. Despite a quarterly revenue decline of 41.3%, the year-over-year earnings growth was strong at 92.3%, highlighting operational resilience.
Vedanta’s valuation metrics show a trailing price-to-earnings (P/E) ratio of 14.37 and a forward P/E of 8.84, with a price-to-book (P/B) ratio of 2.03 and an enterprise value to EBITDA (EV/EBITDA) of 4.89. The market capitalization is approximately ₹988.11 billion. The stock price currently trades near ₹253, close to its 52-week low of ₹249.7 and significantly below its 52-week high of ₹795, reflecting a substantial correction of over 79%. This pricing context suggests the stock is valued at a discount relative to its historical highs and sector averages.
Vedanta’s strengths include strong operating cash flow of nearly ₹395 billion, a manageable total debt to equity ratio of 48%, and leadership in multiple metals markets. The company is actively pursuing strategic expansion, notably a $5 billion investment in oil and gas to boost production fivefold and capacity increases in zinc, aluminum, and steel segments. Key risks involve regulatory scrutiny, commodity price volatility, and recent short-term stock price weakness. The recent demerger into sector-specific entities and rating upgrades from Crisil reflect strategic repositioning and market confidence.
Technically, Vedanta’s stock is in a short-term downtrend with oversold momentum indicators such as RSI at 26.8, trading below its 50-day and 200-day moving averages. Recent news highlights mixed sentiment with both negative price corrections and positive strategic developments. Overall, the data indicates a cautious environment where market participants may be assessing value opportunities amid volatility, warranting close observation of operational and market developments.
Company and Industry Overview
Company Basics
Price Performance
Company Size
Shareholding Pattern
Sector and Industry Analysis
The metals, mining, oil, and gas sector in India is a significant contributor to the economy, with a market size driven by domestic demand for infrastructure and global commodity trade. The sector has shown moderate growth, supported by rising commodity prices and increased production capacities, particularly in zinc and aluminum. Key players include Vedanta Ltd., Hindustan Zinc, and Cairn India, which dominate segments like zinc, aluminum, and oil production, respectively, with substantial operations both domestically and internationally.
Industry trends emphasize sustainability and cost efficiency, with companies investing heavily in renewable energy and emission reduction to meet ESG standards. Competitive dynamics are shaped by operational scale, resource access, and technological advancements, creating high barriers to entry due to capital intensity and regulatory compliance. Vedanta’s leadership in zinc and aluminum markets is reinforced by low production costs and diversified revenue streams, though exposure to commodity price volatility and governance concerns affect market positioning.
The regulatory landscape is increasingly stringent, with SEBI intensifying scrutiny on promoter-led conglomerates and enforcing compliance on research disclosures. Mining royalties, environmental regulations, and community opposition present ongoing challenges, potentially impacting operational costs and project approvals. The sector outlook depends on regulatory clarity and global commodity cycles, with companies needing to navigate financial leverage and governance risks amid evolving policy frameworks.
Note: Analysis synthesized from industry research, market reports, and regulatory filings. Information is subject to change based on market conditions.
Financial Ratios Dashboard
Illustrative Scenario Analysis
DCF Assumptions:
Method: Two-Stage EPS-Priority Model
Financials
Peer Analysis
| Company Name | Market Cap | P/E Ratio | P/B Ratio | EV/EBITDA | Price to CFO |
|---|---|---|---|---|---|
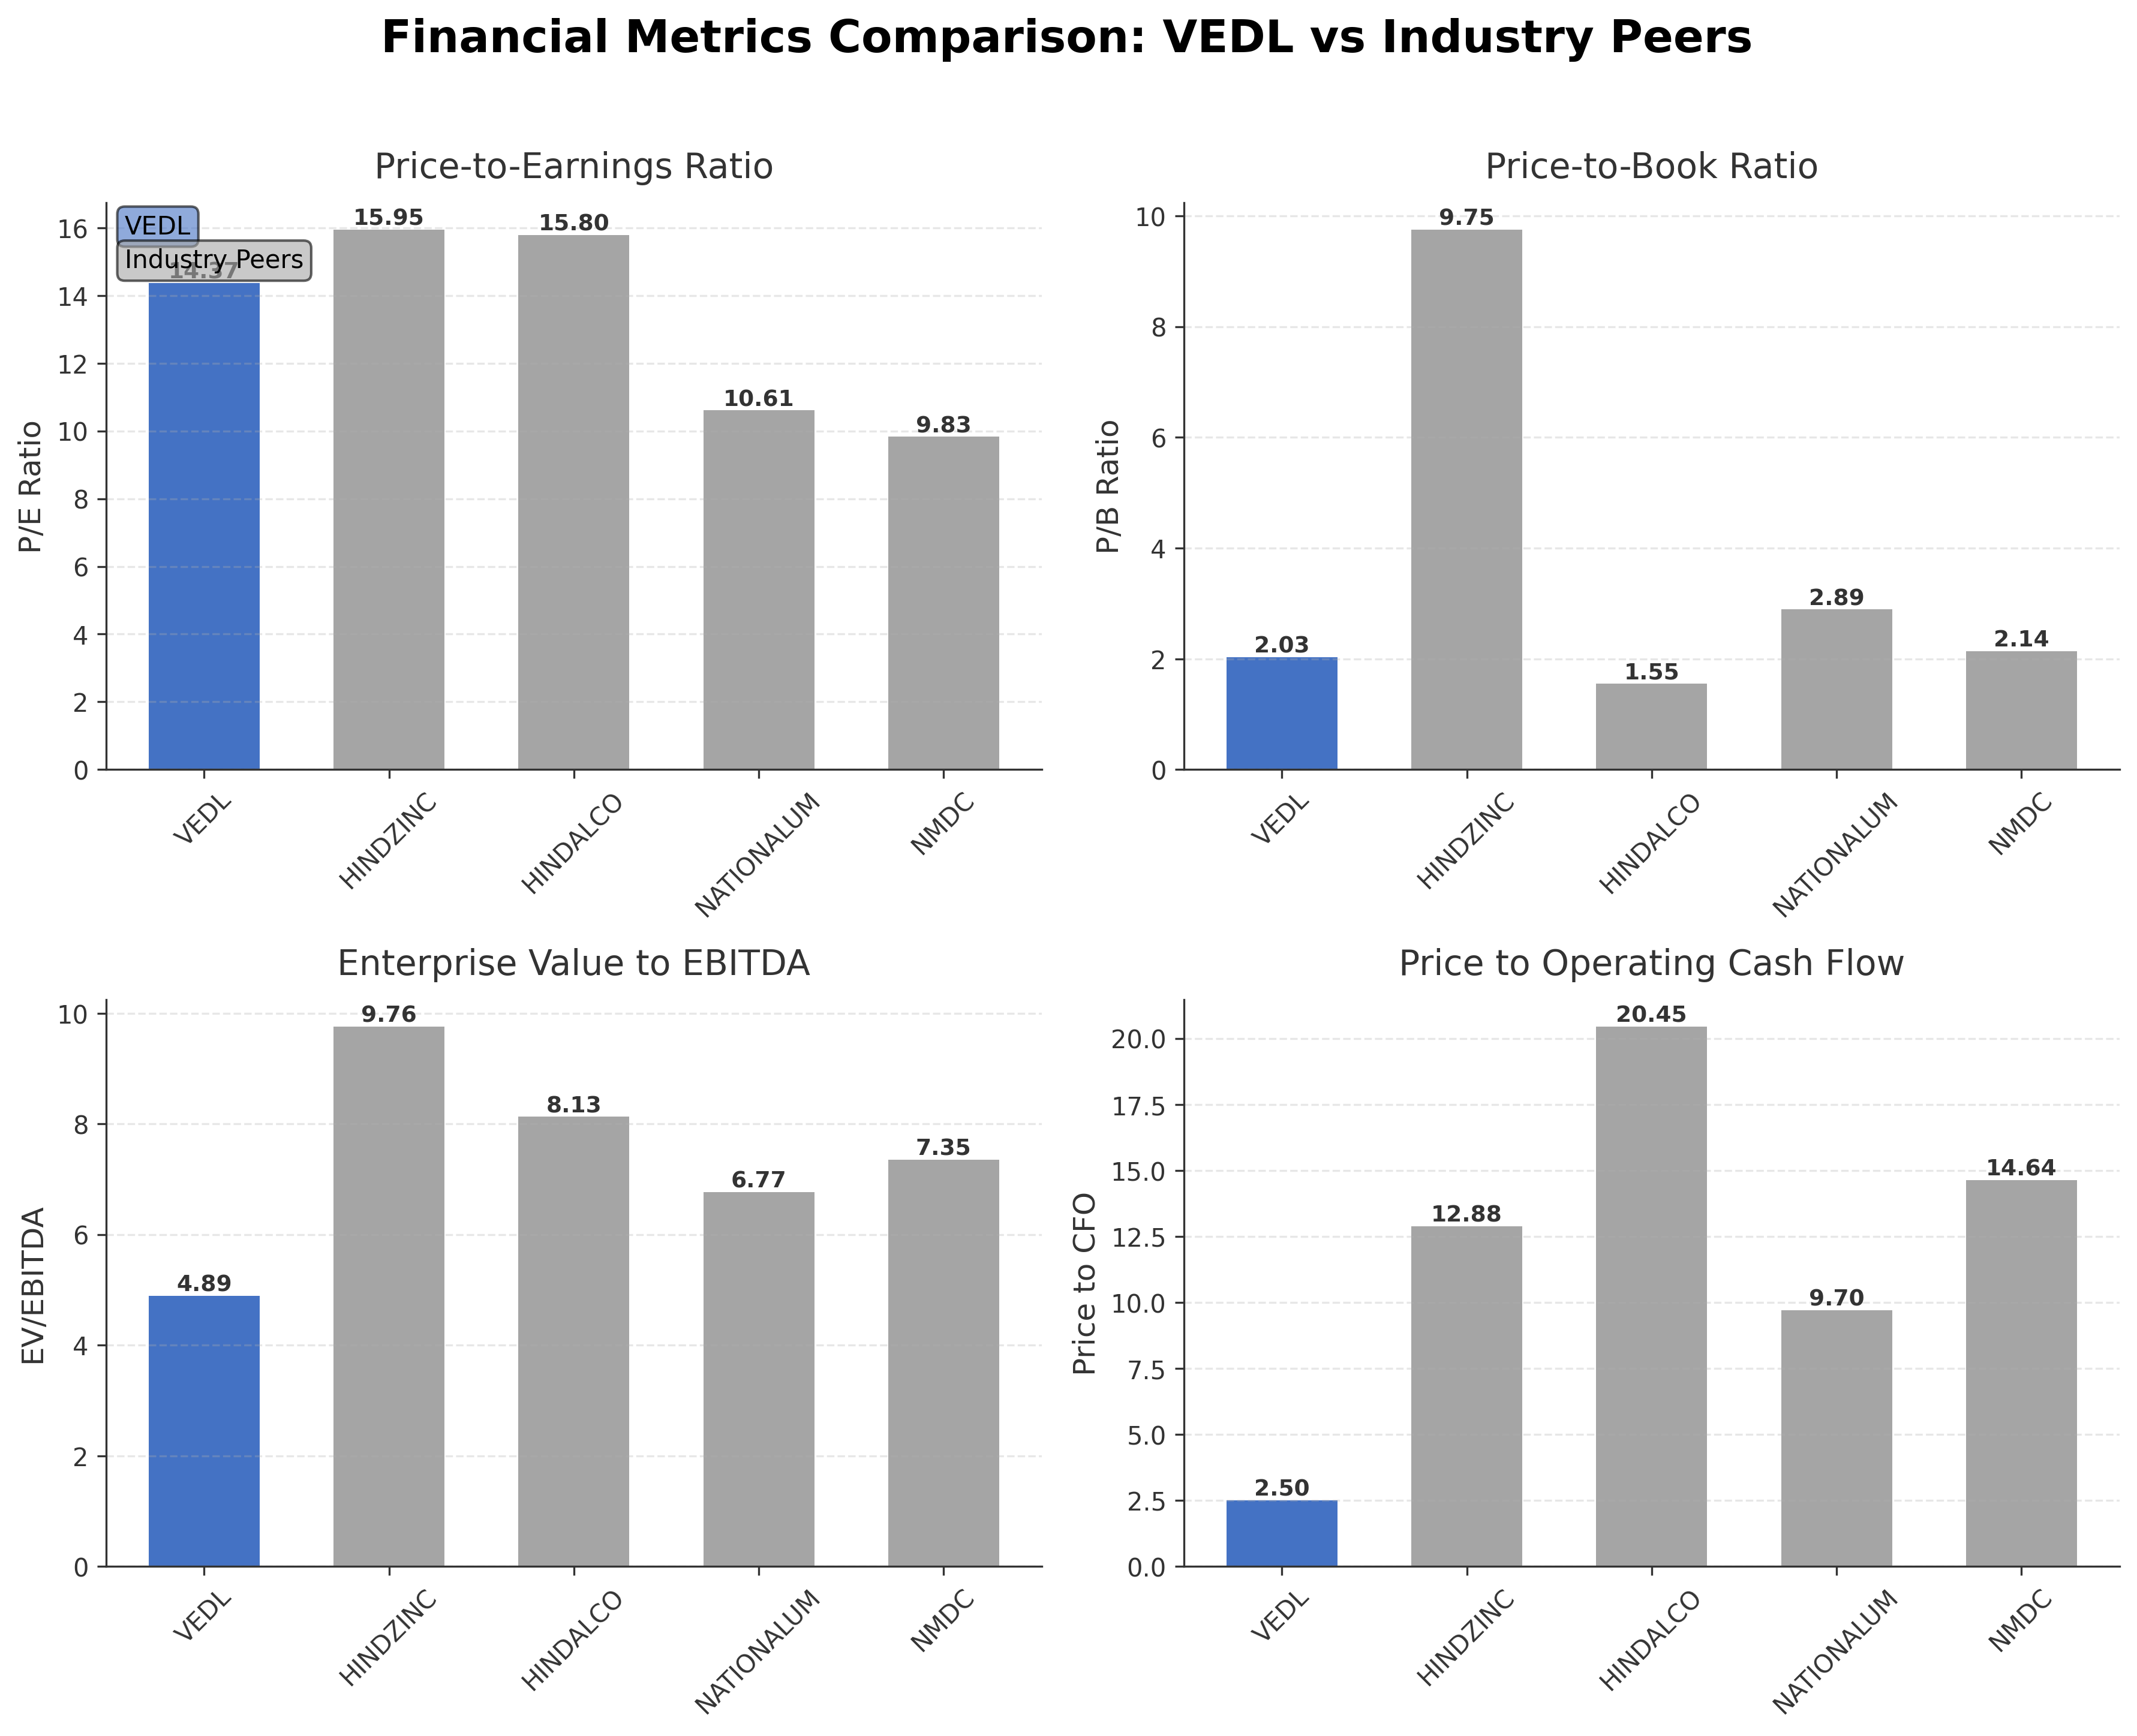
| Vedanta Ltd. | ₹988.11B | 14.37 | 2.03 | 4.89 | 2.50 |
| Hindustan Zinc Ltd. | ₹2.19T | 15.95 | 9.75 | 9.76 | 12.88 |
| Hindalco Industries Ltd. | ₹2.10T | 15.80 | 1.55 | 8.13 | 20.45 |
| National Aluminium Co Ltd. | ₹624.27B | 10.61 | 2.89 | 6.77 | 9.70 |
| Nmdc Limited | ₹731.66B | 9.83 | 2.14 | 7.35 | 14.64 |
Comparison Analysis: Vedanta Ltd. trades at a moderate P/E ratio of 14.37, below peers Hindustan Zinc and Hindalco but above National Aluminium and NMDC, indicating a balanced valuation. Its P/B ratio of 2.03 is lower than Hindustan Zinc’s premium valuation but higher than Hindalco’s, reflecting moderate asset valuation. The EV/EBITDA multiple of 4.89 is the lowest among peers, suggesting relatively attractive enterprise valuation. Vedanta’s return on equity of 20.4% is solid, outperforming Hindalco but trailing the highly profitable Hindustan Zinc. Price to CFO at 2.50 is significantly lower than peers, indicating potentially undervalued cash flow metrics. Overall, Vedanta presents a competitive valuation profile with room for operational and financial improvement relative to industry leaders.
Financial Metrics Comparison with Peers
Financial Statements
Comprehensive financial data including income, balance sheet, and cash flow metrics
Income Statement
| fiscal_date | 2026-03-31 | 2025-03-31 | 2024-03-31 | 2023-03-31 | 2022-03-31 |
|---|---|---|---|---|---|
| Sales | 766.72B | 1507.25B | 1417.93B | 1454.04B | 1311.92B |
| Cost Of Goods | 467.26B | 890.14B | 849.26B | 915.15B | 697.00B |
| Gross Profit | 299.46B | 617.11B | 568.67B | 538.89B | 614.92B |
| Operating Expense Selling General And Administrative | 10.32B | 22.72B | 25.66B | 31.48B | 32.13B |
| Operating Expense Other Operating Expenses | 105.84B | 270.54B | 283.60B | 254.74B | 212.05B |
| Operating Income | 184.97B | 313.59B | 248.28B | 242.85B | 360.10B |
| Non Operating Interest Income | 9.79B | 23.88B | 16.86B | 22.62B | 18.85B |
| Non Operating Interest Expense | 25.26B | 88.76B | 84.33B | 58.46B | 44.98B |
| Pretax Income | 171.26B | 268.77B | 203.63B | 202.76B | 329.64B |
| Income Tax | 46.46B | 63.42B | 128.26B | 57.70B | 92.55B |
| Net Income | 250.96B | 205.35B | 75.39B | 145.03B | 237.10B |
| Eps Basic | 44.58 | 38.97 | 11.42 | 28.50 | 50.73 |
| Eps Diluted | 44.21 | 38.65 | 11.33 | 28.32 | 50.38 |
| Basic Shares Outstanding | 3.90B | 3.85B | 3.72B | 3.71B | 3.71B |
| Diluted Shares Outstanding | 3.90B | 3.85B | 3.72B | 3.71B | 3.71B |
| Ebit | 196.52B | 357.53B | 287.96B | 261.22B | 374.62B |
| Ebitda | 291.76B | 448.33B | 366.73B | 369.45B | 470.32B |
| Net Income Continuous Operations | 354.26B | 268.77B | 203.63B | 202.76B | 329.64B |
| Minority Interests | -77.05B | -55.47B | -33.00B | -39.29B | -49.08B |
| Preferred Stock Dividends | 0.00 | 0.00 | 0.00 | 0.00 | 0.00 |
| Other Income Expense | N/A | N/A | N/A | N/A | -363.00M |
Data provided by Twelve Data
Balance Sheet
| fiscal_date | 2026-03-31 | 2025-03-31 | 2024-03-31 | 2023-03-31 | 2022-03-31 |
|---|---|---|---|---|---|
| Cash And Cash Equivalents | 13.70B | 39.93B | 28.12B | 69.26B | 86.71B |
| Accounts Receivable | 13.05B | 36.36B | 36.07B | 40.14B | 49.46B |
| Total Assets | 2332.36B | 2032.93B | 1908.07B | 1953.77B | 1983.82B |
| Total Liabilities | 1646.59B | 1495.40B | 1487.38B | 1459.50B | 1156.78B |
| Long Term Debt | 165.35B | 532.83B | 511.68B | 436.10B | 363.30B |
| Shareholders Equity | 685.77B | 537.53B | 420.69B | 494.27B | 827.04B |
Data provided by Twelve Data
Cash Flow Statement
| fiscal_date | 2026-03-31 | 2025-03-31 | 2024-03-31 | 2023-03-31 | 2022-03-31 |
|---|---|---|---|---|---|
| Operating Activities Net Income | 354.26B | 268.77B | 203.63B | 202.76B | 329.64B |
| Operating Activities Stock Based Compensation | 530.00M | 580.00M | 700.00M | 770.00M | 790.00M |
| Operating Activities Other Non Cash Items | 68.23B | 69.56B | 46.77B | 34.64B | 33.64B |
| Operating Activities Accounts Receivable | -38.67B | 55.53B | 1.80B | 16.62B | -81.99B |
| Operating Activities Other Assets Liabilities | -50.68B | -17.14B | 16.70B | -7.28B | -43.73B |
| Operating Activities Operating Cash Flow | 333.67B | 377.30B | 269.60B | 247.51B | 329.50B |
| Investing Activities Capital Expenditures | -207.52B | -167.14B | -165.57B | -136.54B | -103.05B |
| Investing Activities Purchase Of Investments | -1164.12B | -1144.14B | -542.60B | -1112.89B | -871.35B |
| Investing Activities Sale Of Investments | 1112.18B | 1120.61B | 558.59B | 1152.44B | 868.48B |
| Investing Activities Other Investing Activity | -23.96B | -25.48B | -7.97B | 49.06B | 48.47B |
| Investing Activities Investing Cash Flow | -283.42B | -216.15B | -156.71B | -47.93B | -57.45B |
| Financing Activities Long Term Debt Issuance | 286.23B | 277.54B | 254.78B | 186.24B | 209.16B |
| Financing Activities Long Term Debt Payments | -311.34B | -383.09B | -314.33B | -297.34B | -390.95B |
| Financing Activities Short Term Debt Issuance | -14.00B | -7.99B | -81.48B | 45.76B | 37.94B |
| Financing Activities Common Stock Issuance | -2.94B | 84.58B | N/A | N/A | N/A |
| Financing Activities Common Dividends | -132.79B | -167.72B | -185.72B | -299.59B | -166.81B |
| Financing Activities Other Financing Charges | 62.92B | 31.34B | N/A | -170.00M | -26.68B |
| Financing Activities Financing Cash Flow | -111.92B | -165.76B | -328.75B | -365.10B | -337.34B |
| End Cash Position | 58.09B | 39.93B | 28.12B | 69.26B | 86.71B |
| Free Cash Flow | 186.23B | 225.57B | 189.02B | 192.78B | 243.33B |
| Investing Activities Net Acquisitions | N/A | 0.00 | 840.00M | 0.00 | 0.00 |
| Financing Activities Common Stock Repurchase | N/A | -420.00M | -2.00B | 0.00 | N/A |
| Operating Activities Depreciation | N/A | N/A | N/A | N/A | 91.15B |
Data provided by Twelve Data
Technical Analysis
Key Insights
- Vedanta’s stock is currently in a short-term downtrend, exhibiting a series of lower highs and lower lows over recent sessions.
- Key support levels are identified near ₹250, close to the 52-week low, while resistance is observed around ₹305, near the 50-day moving average.
- The stock is trading below its 10-day, 50-day (₹305.27), and 200-day (₹536.54) moving averages, indicating bearish momentum across multiple timeframes.
- Momentum indicators show an RSI of 26.8, signaling oversold conditions; MACD is below the signal line, confirming negative momentum; Stochastic oscillator also indicates oversold status.
- Across daily, weekly, and monthly charts, the trend remains bearish with no immediate reversal signals, though oversold readings suggest potential for consolidation.
- Current technical setup suggests a cautious market scenario with potential for short-term price stabilization or further downside if support near ₹250 fails.
Trending News
Summary: CIA whistleblower James Erdman III testified that the Biden administration buried an analysis concluding a lab leak was the most likely origin of the COVID-19 pandemic in an explosive hearing. Senate Homeland Security and Governmental Affairs Committee Chairman Rand Paul said Erdman, a two-decade ...
Sentiment: neutral
2. Headline: Vedanta shares fall for fifth straight session; analysts expect more downside - BusinessToday
Summary: Shares of Vedanta Ltd are in a short-term downtrend, falling in the last five sessions. The metal and mining major's stock is down 8% during the period. With the ongoing correction, Vedanta shares have turned oversold with a RSI of 26.8.
Sentiment: negative
3. Headline: Vedanta shares fall 2.09% to Rs 252.50- Moneycontrol.com
Summary: Vedanta Ltd shares declined 2.09% to Rs 252.50 on Friday, July 17, 2026. The stock is currently part of the Nifty Next 50 index. The stock traded with a very bearish sentiment on the day.
Sentiment: negative
4. Headline: Vedanta, Vedanta Aluminium, Vedanta Oil and Gas get rating upgrade from Crisil; stocks in focus - BusinessToday
Summary: For every 1 share of Vedanta Ltd held on the May 1, 2026 record date, investors retained their existing share and received 1 additional share in each of the four new companies. Disclaimer: Business Today provides stock market news for informational purposes only and should not be construed ...
Sentiment: positive
Summary: Vedanta Power Share Price: Find the latest news on Vedanta Power Stock Price. Get all the information on Vedanta Power with historic price charts for NSE / BSE. Experts & Broker view also get the Vedanta Power Ltd. buy/sell tips detailed news, announcements, Forecasts, Analysts, Valuation, ...
Sentiment: neutral
Powered by Brave
Recent Updates
News Summary
As of 2026-07-17. Vedanta Ltd. is executing a significant expansion strategy, highlighted by a $5 billion investment plan in its oil and gas segment to increase production capacity fivefold over the next three to five years. The company also targets substantial capacity growth in zinc, lead, aluminum, and steel production to meet rising domestic demand and enhance its global footprint. The recent demerger into five pure-play entities, including Vedanta Aluminium and Vedanta Oil & Gas, has been completed successfully, with trading commencing in mid-June 2026 and Crisil upgrading the ratings of these entities. Financially, FY26 was a record year with revenue reaching ₹1.77 trillion, EBITDA at ₹559.76 billion, and PAT of ₹250.96 billion, supported by volume growth and operational efficiencies. The company declared a dividend of ₹34 per share for FY26, delivering a total shareholder return of nearly 49%. Safety improvements were noted despite a tragic incident at the Athena Power Plant. The outlook includes commissioning of the Gamsberg phase II zinc project and guidance for increased production volumes in aluminium and zinc for FY27.
News Sentiment
The overall sentiment from recent updates is predominantly positive, driven by strong financial performance, strategic capacity expansions, and successful corporate restructuring through the demerger. Positive investor sentiment is reinforced by rating upgrades and dividend declarations. However, caution is warranted due to short-term stock price weakness and operational risks such as the Athena Power Plant incident. The balance of news suggests confidence in long-term growth prospects tempered by near-term volatility and sectoral challenges.
Source List
Analytical Overview
Analysis Summary
Vedanta’s valuation metrics show a trailing P/E of 14.37 and forward P/E of 8.84, which are below or near the industry average P/E of 14.37, indicating relatively attractive valuation compared to peers. The company’s PEG ratio of 0.16 suggests undervaluation relative to growth prospects. Revenue growth has been negative recently (-41.3% quarterly), but year-over-year earnings growth remains strong at 92.3%, supported by robust operating cash flows of ₹395 billion. The debt-to-equity ratio is moderate at 48%, with a current ratio of 1.32, reflecting manageable financial leverage and liquidity. Sector-specific opportunities include Vedanta’s aggressive capacity expansion plans in metals and oil & gas, aligned with rising domestic demand and global commodity trends. India-specific factors such as regulatory approvals for demerger and infrastructure growth support the company’s strategic initiatives.
Overall Business and Market Assessment
Supporting Factors: No data
Risk Factors: No data
SWOT Analysis
Strengths
- Strong integrated operations across multiple metals and energy sectors.
- Robust cash flow generation with operating cash flow of ₹395 billion.
- Solid return on equity at 20.4%, indicating efficient capital use.
- Successful corporate restructuring through demerger enhancing focus.
Weaknesses
- Recent quarterly revenue decline of 41.3% indicating short-term headwinds.
- Negative free cash flow of ₹-487.7 billion suggesting high capital expenditure.
- Stock trading near 52-week lows reflecting market sentiment challenges.
- Moderate debt levels with total debt to equity ratio of 48%.
Opportunities
- Planned $5 billion investment to quintuple oil and gas production capacity.
- Capacity expansion targets in zinc, aluminum, and steel to meet rising demand.
- Potential benefits from technology integration and operational efficiencies.
- Growing domestic infrastructure and energy demand in India.
Threats
- Commodity price volatility impacting revenue and margins.
- Regulatory and environmental compliance risks in mining and energy sectors.
- Short-term stock price volatility and bearish technical indicators.
- Operational risks including safety incidents and project execution delays.
Company Description
Vedanta Ltd. is a diversified natural resources company that plays a significant role in the global mining and metals markets. Originating from India, the company engages in the exploration, extraction, and processing of a wide range of resources, including zinc, lead, silver, copper, iron ore, and aluminum. Additionally, Vedanta is active in the energy sector, producing oil and gas and exploring opportunities in the power generation industry. Vedanta Ltd.’s primary purpose is to provide essential raw materials needed for numerous industries such as construction, automotive, technology, and energy. With operations spanning multiple countries, the company has a substantial impact on local and global economies, contributing to industrial growth and development. The firm's presence in the market is bolstered by its integrated value chain, which begins with mining and culminates in the production of refined, market-ready metals. This positions Vedanta Ltd. as a key player in the commodities market, where its activities not only support industrialization in emerging markets but also resonate broadly across sectors that demand reliable and sustainable resource supplies.