
Vardhman Special Steels Ltd (VSSL)
Stock Analysis Report
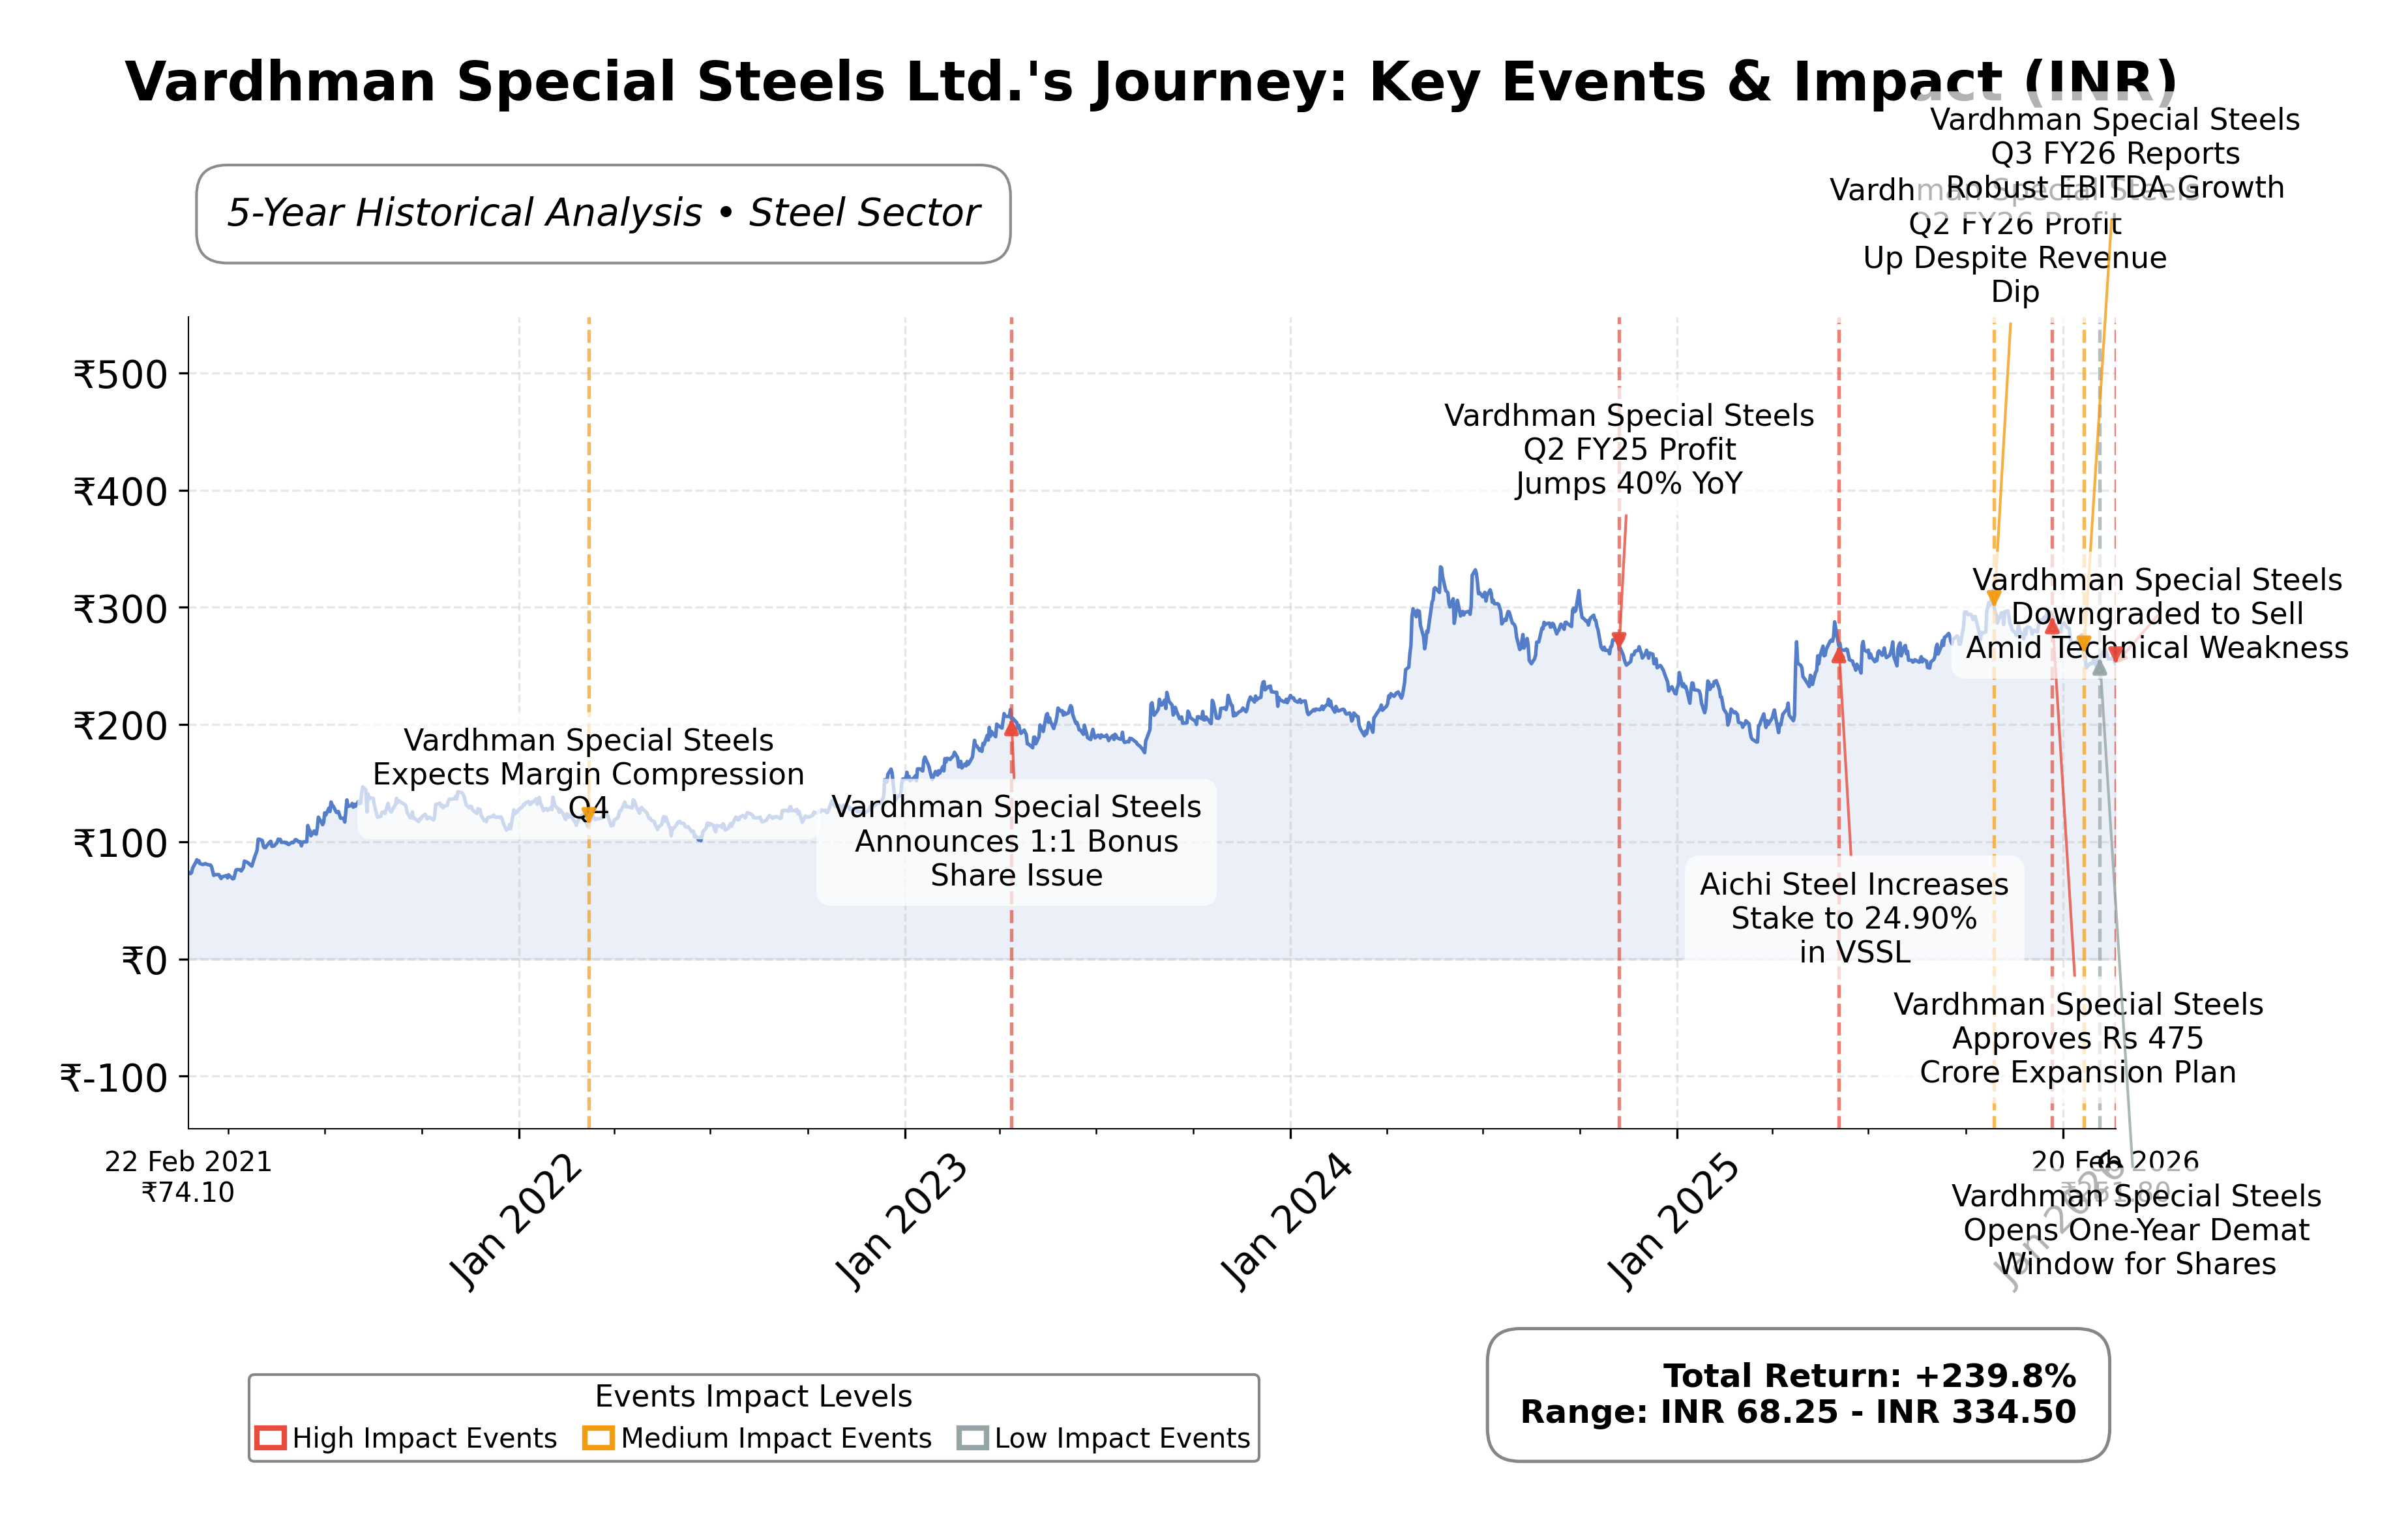
Stock Journey
Key Positives and Key Risks
Pros
- Forward P/E ratio of 11.29 indicates relatively attractive valuation compared to industry average of 20.91, suggesting potential value.
- EBITDA growth of 34% in recent quarters demonstrates strong operational performance and profitability improvement.
- Current ratio of 2.11 and low debt-to-equity ratio of 0.06 reflect robust liquidity and conservative financial leverage.
Cons
- Revenue growth is modest at 0.9% quarterly, indicating limited top-line expansion.
- Technical indicators show mixed to bearish momentum, with price below key moving averages, signaling potential near-term weakness.
- High promoter ownership at 77.96% limits institutional shareholding to 3.67%, potentially affecting market perception and governance dynamics.
Disclosure: This information is for general awareness and does not constitute investment advice
Report Summary
Vardhman Special Steels Ltd. (VSSL) operates in the steel manufacturing industry, specializing in high-grade steel products tailored primarily for the automotive sector. The company produces hot-rolled and bright bars of special and alloy steel, serving critical industrial applications including automotive, engineering, and defense. Positioned as a key supplier within its niche, VSSL emphasizes innovation and sustainability to meet stringent quality standards and adapt to evolving industry demands.
Financially, VSSL reports a market capitalization of approximately â¹24.32 billion with a trailing P/E ratio of 20.91 and a forward P/E of 11.29, indicating valuation metrics below the industry average P/E of 20.91. The company maintains a gross margin of 42.57% and a profit margin of 6.25%, supported by a return on equity of 11.67% and return on assets of 8.19%. Its enterprise value to EBITDA stands at 11.82, reflecting moderate operational efficiency. The balance sheet shows a strong current ratio of 2.11 and a low debt-to-equity ratio of 0.06, underscoring solid liquidity and conservative leverage.
Recent technical indicators reveal mixed momentum with a shift from mildly bullish to mildly bearish trends, accompanied by price fluctuations around key moving averages near â¹271.77 (50-day) and â¹270.90 (200-day). The company has undertaken strategic initiatives such as opening a one-year window for dematerialization of legacy physical shares, reflecting compliance and shareholder engagement efforts. Strengths include robust EBITDA growth and a diversified product portfolio, while risks involve valuation concerns and technical weakness noted in recent market analyses.
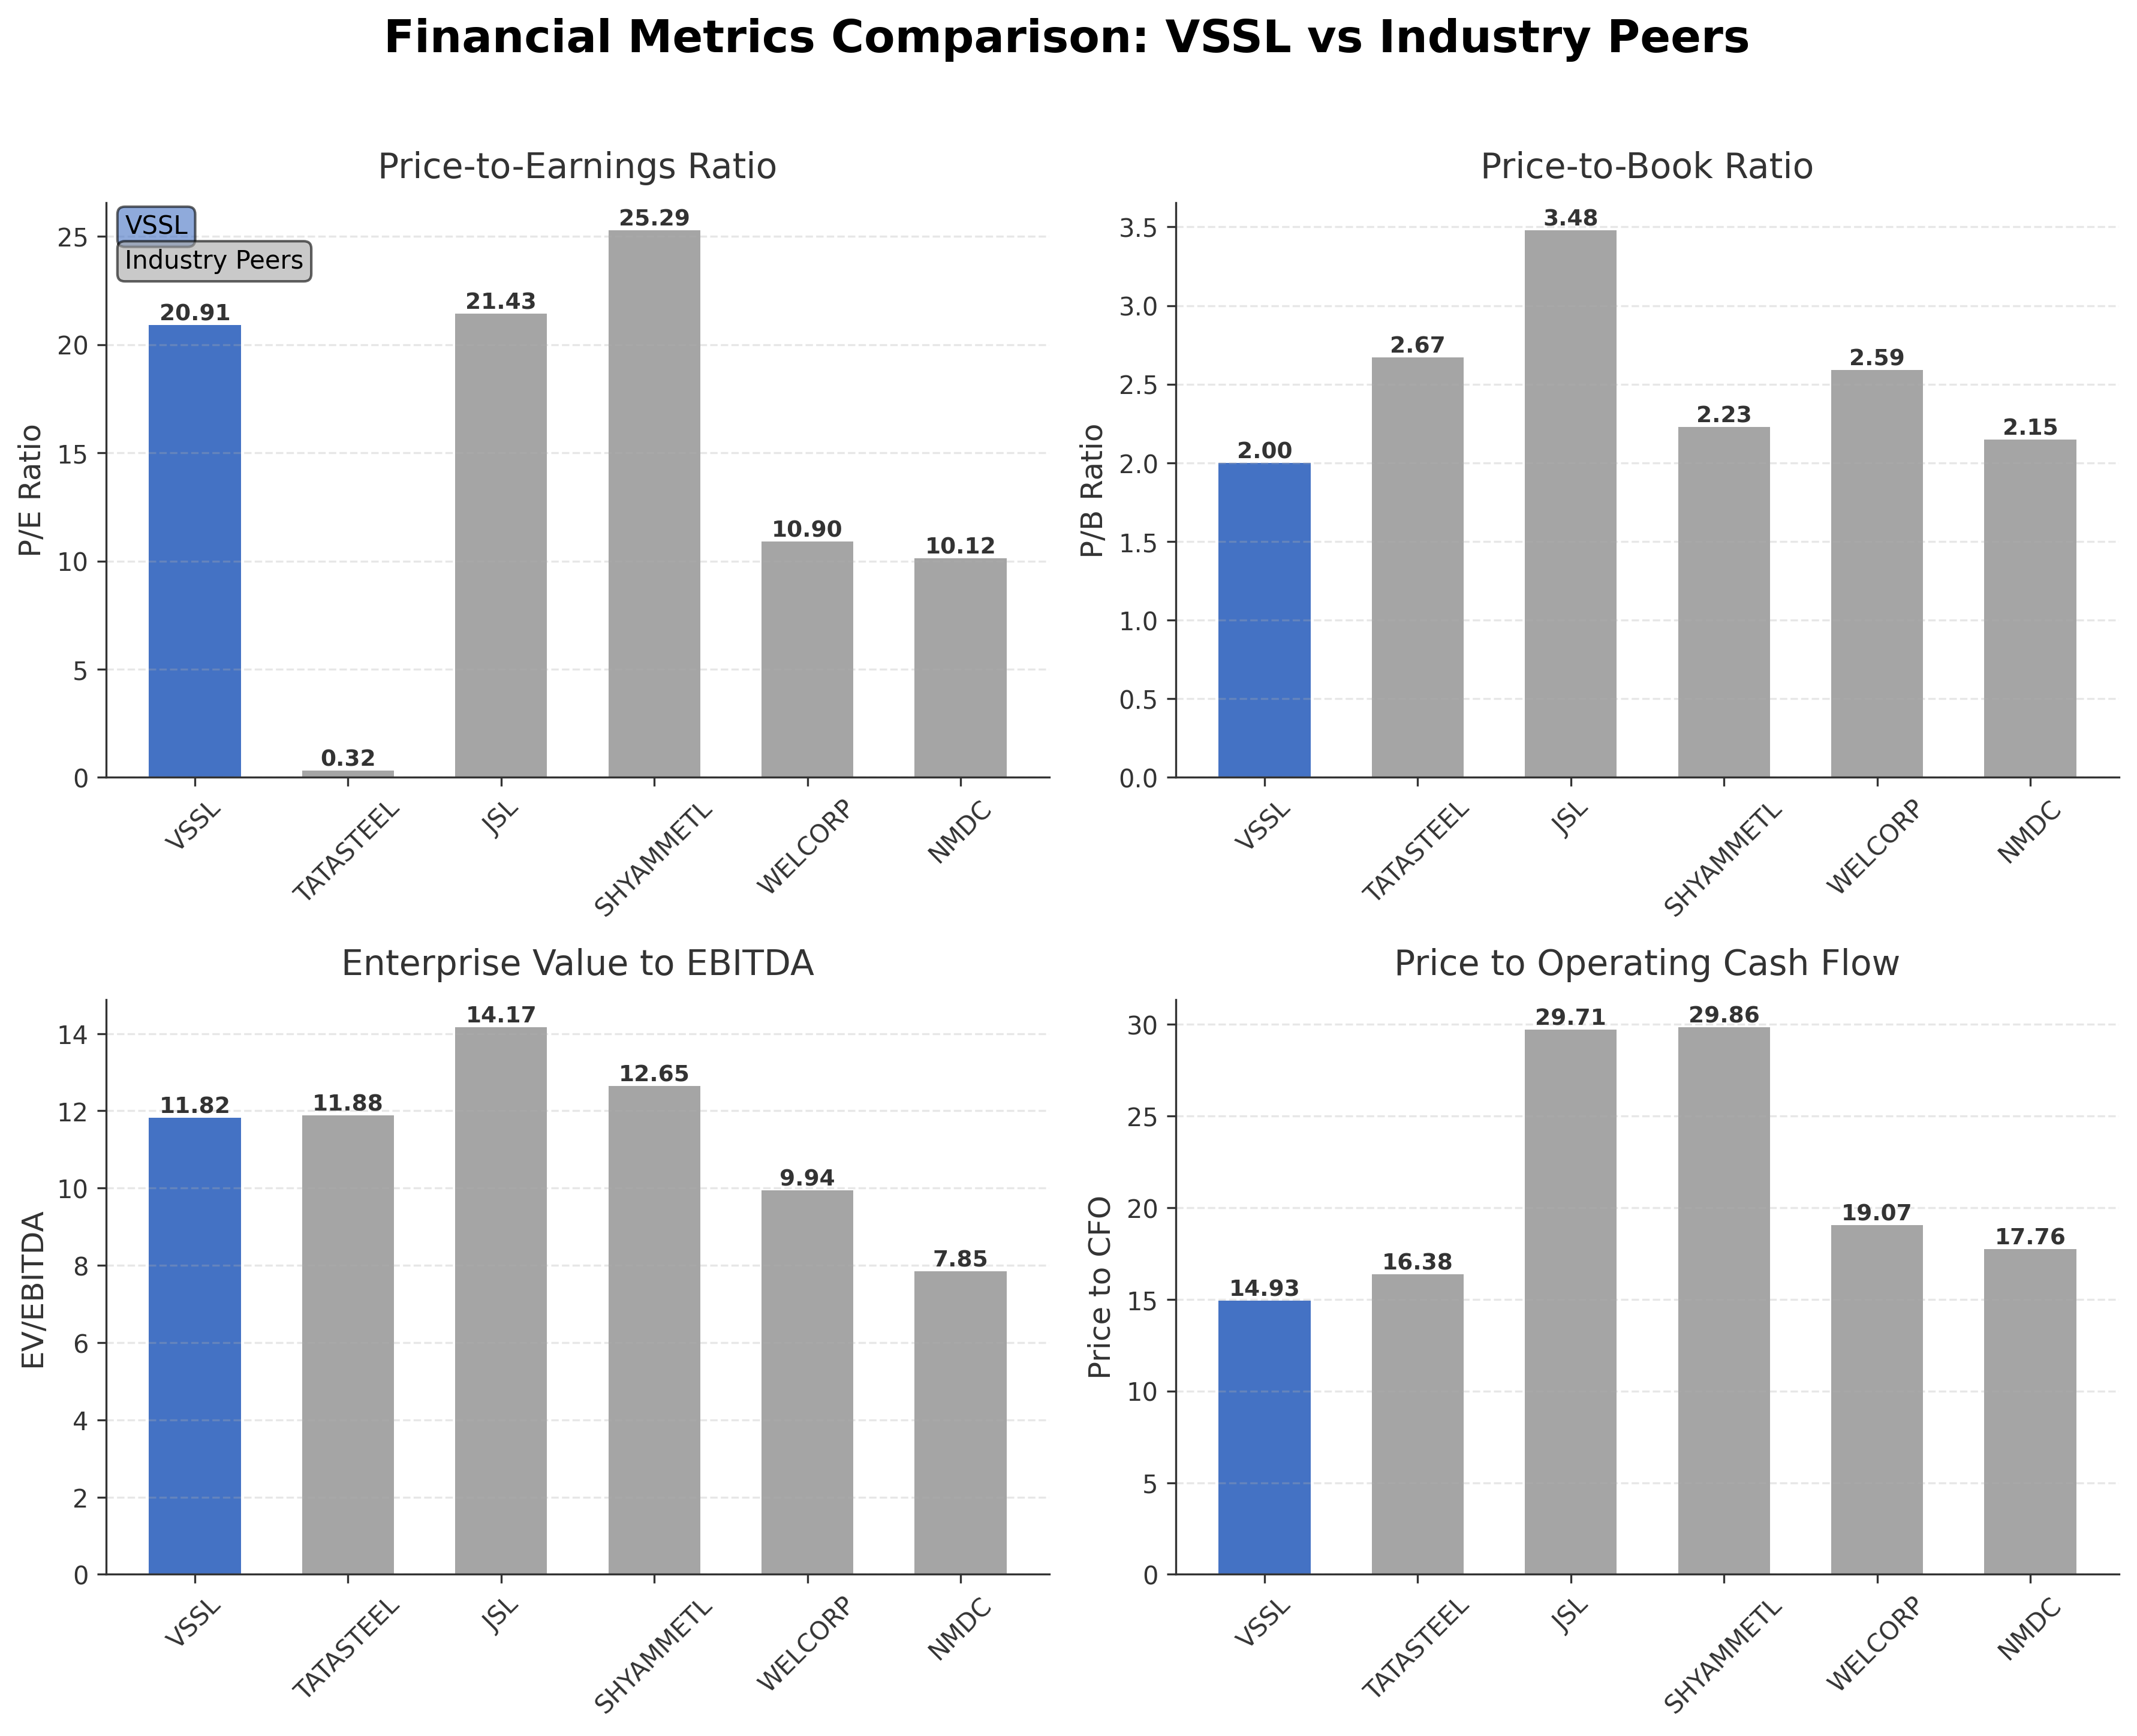
In peer comparison within the Indian steel sector, VSSL's market capitalization is modest relative to giants like Tata Steel Ltd. (â¹2.53 trillion) and Jindal Stainless Ltd. (â¹629.49 billion). Its P/E ratio of 20.91 is higher than Tata Steelâs 0.32 but comparable to Jindal Stainless at 21.43, while its EV/EBITDA of 11.82 aligns closely with industry peers. VSSLâs price-to-cash-flow ratio of 14.93 is lower than several peers, indicating relatively efficient cash flow valuation. These metrics position VSSL as a mid-sized player with competitive valuation and operational metrics among regional peers.
Vardhman Special Steels Ltd. navigates a complex industry landscape marked by cyclical demand and evolving technological standards. Recent achievements include solid EBITDA growth and shareholder structure enhancements, while challenges persist in maintaining momentum amid mixed technical signals and valuation scrutiny. The company stands at a pivotal juncture where strategic execution and market conditions will critically influence its trajectory. Given the current data, a balanced approach that monitors ongoing developments and market dynamics appears prudent for those assessing the stockâs potential.
Company and Industry Overview
Company Basics
Price Performance
Company Size
Shareholding Pattern
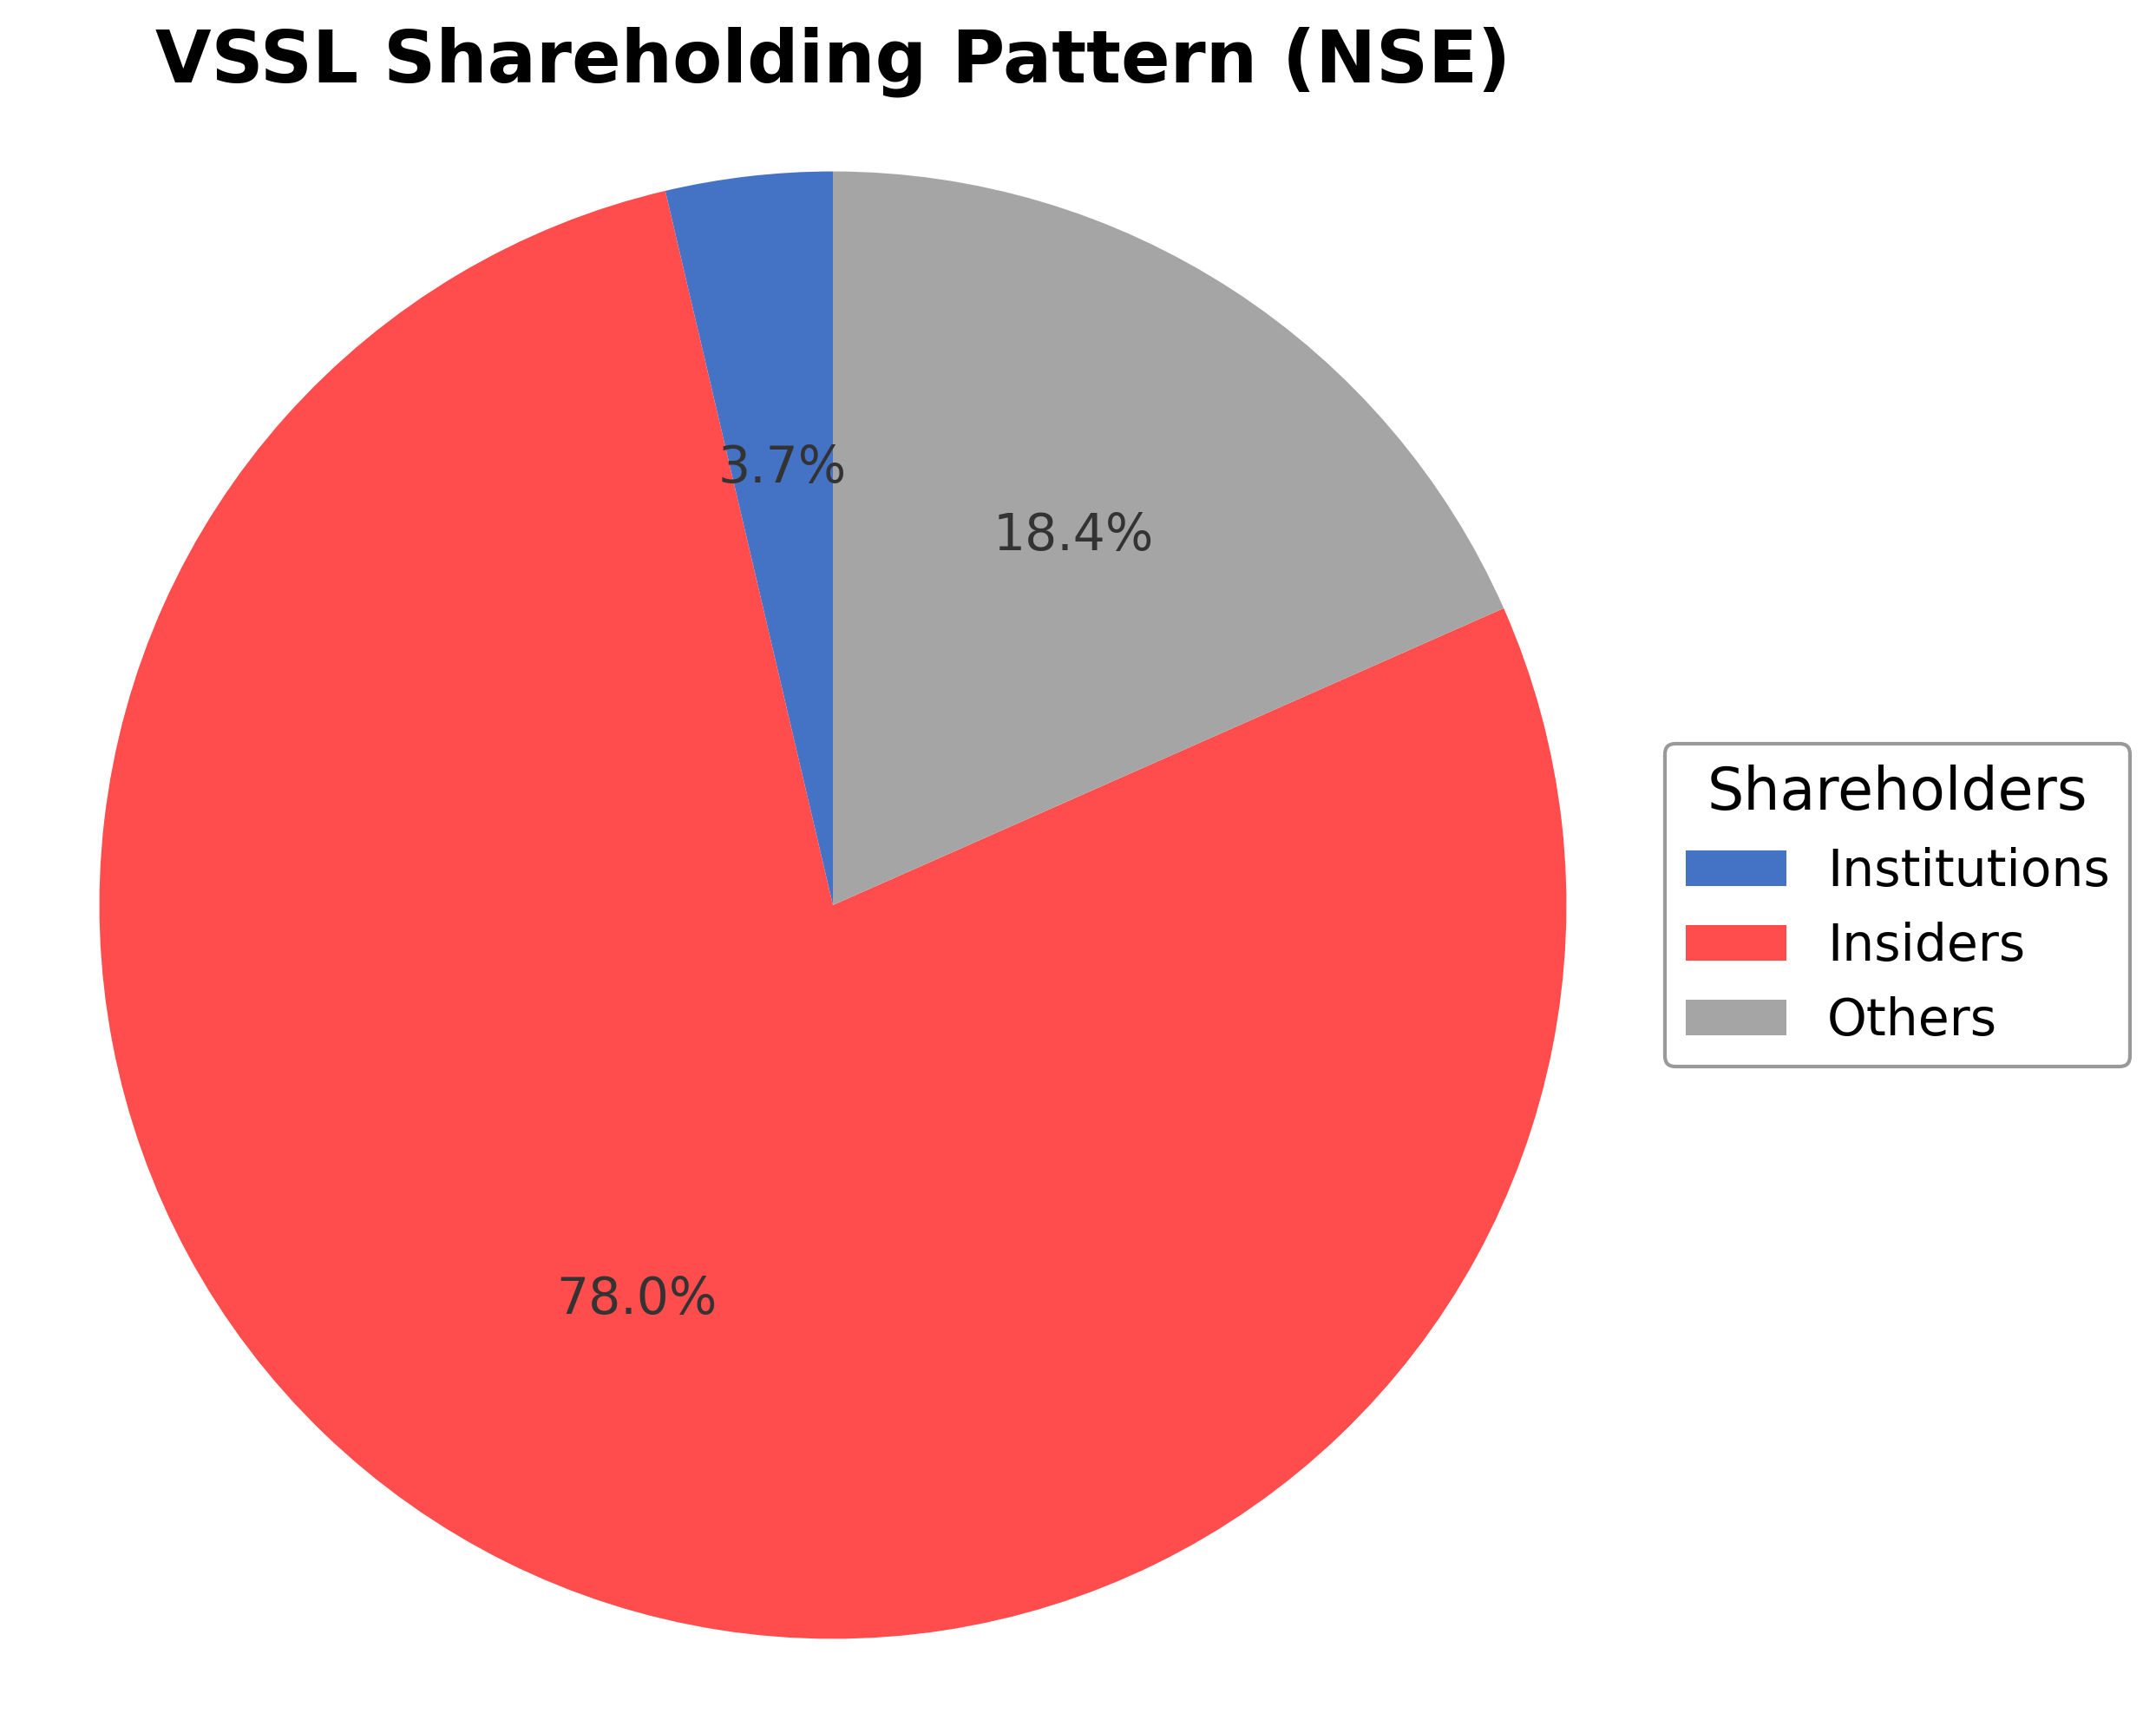
Vardhman Special Steels Ltd.'s shareholding structure is dominated by insiders, including executives and board members, holding approximately 77.96% of shares, reflecting strong promoter control. Institutional investors account for 3.67%, indicating limited but stable institutional participation, while public and other shareholders represent around 18.37%. Over the past 12-24 months, there have been no significant shifts in major ownership stakes, suggesting steady governance and strategic continuity. Institutional accumulation appears modest, with no major funds notably increasing or decreasing positions recently. This ownership pattern indicates concentrated control with limited external influence, which may affect governance dynamics and strategic decision-making. Market sentiment appears cautiously neutral, with ownership stability supporting consistent corporate direction without substantial external pressure.
Sector and Industry Analysis
Vardhman Special Steels Ltd. (VSSL) operates within the specialty steel sector, a critical subset of the broader steel industry characterized by the production of high-grade alloy and stainless steels tailored for specific industrial applications. The global specialty steel market is substantial, valued in the tens of billions USD, with growth driven by sectors such as automotive, aerospace, defense, and infrastructure. Emerging economies, particularly in Asia, are witnessing accelerated demand due to industrialization and infrastructure development, while mature markets focus on innovation and quality enhancement. Key global players include companies like Aperam, Outokumpu, and Sandvik, alongside prominent Indian producers such as Jindal Stainless and Vardhman Special Steels itself, which cater to both domestic and export markets.
Industry trends in specialty steels are increasingly shaped by technological advancements and shifting end-user requirements. There is a pronounced move towards higher-performance steels with enhanced corrosion resistance, strength-to-weight ratios, and environmental sustainability credentials. The integration of digital manufacturing techniques, such as Industry 4.0-enabled process automation and real-time quality monitoring, is improving operational efficiencies and product consistency. Additionally, consumer behavior in downstream industries is driving demand for customized steel grades that meet stringent regulatory and performance standards, particularly in automotive lightweighting and renewable energy sectors. Opportunities are emerging in specialty steel applications for electric vehicles, hydrogen infrastructure, and advanced machinery, positioning the industry for innovation-led growth.
The regulatory environment for specialty steel manufacturers is complex and multifaceted, encompassing environmental, safety, and trade-related regulations. Compliance with stringent emission norms, such as those targeting CO2 and particulate matter emissions, is increasingly critical, especially in jurisdictions with aggressive climate policies. Trade regulations, including anti-dumping duties and import-export controls, significantly influence market dynamics and pricing. In India, the Ministry of Steel and associated bodies regulate quality standards and promote domestic manufacturing through policy initiatives like the Steel Scrap Recycling Policy and Make in India. Adherence to international standards such as ISO and ASTM is essential for export competitiveness. Regulatory shifts towards sustainability reporting and circular economy practices are also shaping operational strategies.
Competitive dynamics in the specialty steel industry are characterized by moderate to high barriers to entry due to capital intensity, technological expertise requirements, and stringent quality standards. The market structure is oligopolistic with a few large integrated producers dominating, supplemented by niche players focusing on specialized products or regional markets. Vardhman Special Steels competes on parameters such as product quality, customization capability, and supply chain reliability. Strategic investments in R&D and capacity expansion are crucial for maintaining competitive positioning. Price volatility in raw materials like nickel and chromium, coupled with cyclical demand patterns, adds complexity to competitive strategies. Collaboration with end-users and diversification into value-added steel products are common approaches to enhance market share and mitigate risks.
Note: Analysis synthesized from industry research, market reports, and regulatory filings. Information is subject to change based on market conditions.
Illustrative Scenario Analysis
DCF Assumptions:
Method: Two-Stage EPS-Priority Model
Financials
Peer Analysis
| Company Name | Market Cap | P/E Ratio | P/B Ratio | EV/EBITDA | Price to CFO |
|---|---|---|---|---|---|
| Vardhman Special Steels Ltd. | ₹24.32B | 20.91 | 2.00 | 11.82 | 14.93 |
| Tata Steel Ltd. | ₹2.53T | 0.32 | 2.67 | 11.88 | 16.38 |
| Jindal Stainless Ltd. | ₹629.49B | 21.43 | 3.48 | 14.17 | 29.71 |
| Shyam Metalics and Energy Ltd. | ₹244.69B | 25.29 | 2.23 | 12.65 | 29.86 |
| Welspun Corp Ltd. | ₹211.66B | 10.90 | 2.59 | 9.94 | 19.07 |
| Nmdc Limited | ₹698.33B | 10.12 | 2.15 | 7.85 | 17.76 |
Comparison Analysis: Vardhman Special Steels Ltd. (VSSL) is a mid-sized player in the Indian steel industry with a market capitalization of ₹24.32 billion, significantly smaller than major peers like Tata Steel Ltd. and Jindal Stainless Ltd. Its P/E ratio of 20.91 is higher than large-cap peers Tata Steel (0.32) and lower than Shyam Metalics (25.29), indicating moderate valuation. The P/B ratio of 2.00 is competitive but below Jindal Stainless (3.48). VSSL's EV/EBITDA of 11.82 aligns closely with industry averages, reflecting operational efficiency. The price-to-cash-flow ratio of 14.93 is relatively lower than several peers, suggesting efficient cash flow management. Overall, VSSL demonstrates balanced valuation and operational metrics within its peer group, with room for growth relative to larger competitors.
Financial Metrics Comparison with Peers
Financial Statements
Comprehensive financial data including income, balance sheet, and cash flow metrics
Income Statement
| fiscal_date | 2025-03-31 | 2024-03-31 | 2023-03-31 | 2022-03-31 | 2021-03-31 |
|---|---|---|---|---|---|
| Sales | 17.54B | 16.50B | 17.21B | 13.55B | 9.29B |
| Cost Of Goods | 13.82B | 13.13B | 14.13B | 10.30B | 7.05B |
| Gross Profit | 3.72B | 3.37B | 3.07B | 3.25B | 2.24B |
| Operating Expense Selling General And Administrative | 384.89M | 324.62M | 365.25M | 308.77M | 224.64M |
| Operating Expense Other Operating Expenses | 911.74M | 750.06M | 522.66M | 463.60M | 386.68M |
| Operating Income | 1.40B | 1.37B | 1.45B | 1.74B | 840.54M |
| Non Operating Interest Income | 15.21M | 14.85M | 12.78M | 69.10M | 81.83M |
| Non Operating Interest Expense | 178.03M | 175.42M | 165.28M | 164.97M | 186.11M |
| Pretax Income | 1.25B | 1.23B | 1.34B | 1.58B | 663.77M |
| Income Tax | 319.73M | 312.30M | 338.58M | 575.85M | 221.82M |
| Net Income | 930.88M | 916.28M | 1.00B | 1.01B | 441.95M |
| Eps Basic | 11.40 | 11.26 | 12.35 | 12.44 | 5.47 |
| Eps Diluted | 11.37 | 11.19 | 12.31 | 12.36 | 5.46 |
| Basic Shares Outstanding | 81.64M | 81.38M | 81.30M | 81.03M | 80.83M |
| Diluted Shares Outstanding | 81.64M | 81.38M | 81.30M | 81.03M | 80.83M |
| Ebit | 1.43B | 1.40B | 1.51B | 1.75B | 849.88M |
| Ebitda | 1.75B | 1.70B | 1.79B | 2.07B | 1.20B |
| Net Income Continuous Operations | 1.25B | 1.23B | 1.34B | 1.58B | 663.77M |
| Preferred Stock Dividends | 0.00 | 0.00 | 0.00 | 0.00 | 0.00 |
Data provided by Twelve Data
Balance Sheet
| fiscal_date | 2025-03-31 | 2024-03-31 | 2023-03-31 | 2022-03-31 | 2021-03-31 |
|---|---|---|---|---|---|
| Cash And Cash Equivalents | 107.57M | 76.40M | 95.35M | 2.71M | 23.40M |
| Accounts Receivable | 2.61B | 2.62B | 2.62B | 2.22B | 2.24B |
| Total Assets | 11.36B | 10.40B | 10.31B | 9.21B | 8.03B |
| Total Liabilities | 3.38B | 3.20B | 3.88B | 3.66B | 3.43B |
| Long Term Debt | 36.51M | 146.74M | 447.91M | 798.05M | 1.11B |
| Shareholders Equity | 7.98B | 7.19B | 6.42B | 5.55B | 4.59B |
Data provided by Twelve Data
Cash Flow Statement
| fiscal_date | 2025-03-31 | 2024-03-31 | 2023-03-31 | 2022-03-31 | 2021-03-31 |
|---|---|---|---|---|---|
| Operating Activities Net Income | 1.25B | 1.23B | 1.34B | 1.58B | 663.77M |
| Operating Activities Stock Based Compensation | 10.68M | 8.49M | 8.04M | 4.16M | 2.48M |
| Operating Activities Other Non Cash Items | 168.67M | 166.51M | 163.53M | 101.94M | 114.54M |
| Operating Activities Accounts Receivable | 1.15M | -6.81M | -397.06M | 7.62M | -478.76M |
| Operating Activities Other Assets Liabilities | 198.20M | 140.72M | -654.28M | -1.33B | -612.89M |
| Operating Activities Operating Cash Flow | 1.63B | 1.54B | 463.28M | 363.53M | -310.87M |
| Investing Activities Capital Expenditures | -1.18B | -667.04M | -282.28M | -346.93M | -93.10M |
| Investing Activities Purchase Of Investments | -2.20B | -3.84B | -45.12M | N/A | N/A |
| Investing Activities Sale Of Investments | 2.04B | 4.06B | 156.80M | N/A | N/A |
| Investing Activities Other Investing Activity | 64.93M | -69.34M | N/A | -5.00K | 98.77M |
| Investing Activities Investing Cash Flow | -1.28B | -515.03M | -170.61M | -346.93M | 5.67M |
| Financing Activities Long Term Debt Payments | -230.09M | -276.00M | -452.05M | -199.58M | -929.49M |
| Financing Activities Short Term Debt Issuance | 597.69M | -324.64M | 271.32M | -86.92M | -688.09M |
| Financing Activities Common Stock Issuance | 9.85M | 7.38M | 4.77M | 3.20M | 6.64M |
| Financing Activities Common Dividends | -162.44M | -162.07M | -141.45M | -60.51M | N/A |
| Financing Activities Financing Cash Flow | 215.00M | -755.33M | -317.41M | -343.81M | -1.23B |
| End Cash Position | 107.57M | 76.40M | 95.35M | 2.71M | 23.40M |
| Free Cash Flow | 80.80M | 744.43M | 447.87M | 235.80M | 577.97M |
| Financing Activities Long Term Debt Issuance | N/A | N/A | N/A | 0.00 | 376.00M |
Data provided by Twelve Data
Technical Analysis
Key Insights
- The current trend direction shows mixed signals with recent price action fluctuating around the 50-day and 200-day moving averages near ₹271, indicating consolidation.
- Key support levels are identified near ₹178 (52-week low) and ₹250, while resistance is observed around ₹324 (52-week high) and ₹272.
- The stock price is currently slightly below the 50-day (₹271.77) and 200-day (₹270.90) moving averages, suggesting potential short-term weakness.
- Momentum indicators show RSI in a neutral range, MACD indicating bearish crossover, and stochastic oscillators reflecting mixed momentum across daily and weekly timeframes.
- Multi-timeframe analysis reveals short-term bearish momentum contrasting with longer-term sideways consolidation, highlighting uncertainty in trend direction.
- Potential market scenarios include a continuation of consolidation within the current range or a breakout above resistance levels if momentum improves, with downside risk to support levels if bearish signals persist.
Trending News
1. Headline: Vardhman Special Steels Downgraded to Sell Amid Technical Weakness and Flat Financials
Summary: Vardhman Special Steels Ltd. has been downgraded from Hold to Sell due to deteriorating technical indicators and flat recent financial performance, raising valuation concerns. This reflects caution in market sentiment amid challenges in sustaining momentum.
Sentiment: Negative
2. Headline: Vardhman Special Steels Ltd Faces Technical Momentum Shift Amid Mixed Indicators
Summary: The company has experienced a shift from mildly bullish to mildly bearish technical momentum, with mixed signals from MACD and Bollinger Bands on weekly charts. This indicates a transitional phase in market dynamics for VSSL.
Sentiment: Positive
3. Headline: Vardhman Special Steels Opens One-Year Window to Demat Legacy Physical Shares - TipRanks.com
Summary: Vardhman Special Steels Limited has announced a special one-year window for shareholders to dematerialize legacy physical shares, enhancing compliance and shareholder convenience in line with regulatory mandates.
Sentiment: Neutral
4. Headline: Expert View: Special Steel in India Market Growing at Exponential CAGR of 10.9% by 2035
Summary: Industry experts project the Indian special steel market, including players like Vardhman Special Steels Ltd., to grow at a compound annual growth rate of 10.9% through 2035, driven by demand in automotive and engineering sectors.
Sentiment: Positive
5. Headline: Vardhman Special Steels Ltd (BOM:534392) Q3 2026 Earnings Call Highlights: Record Profits and ...
Summary: Vardhman Special Steels Ltd. reported a 34% rise in EBITDA during Q3 2026 and announced major projects aimed at boosting future growth, signaling operational strength despite broader market challenges.
Sentiment: Positive
Powered by Brave
Recent Updates
News Summary
Recent news highlights for Vardhman Special Steels Ltd. focus on strategic shareholder initiatives, such as the opening of a one-year window for dematerializing legacy physical shares, reflecting regulatory compliance and shareholder engagement. Technical momentum has shifted from mildly bullish to mildly bearish, indicating evolving market sentiment. Earnings reports reveal strong EBITDA growth despite some revenue softness, underscoring operational resilience. Mixed sentiments prevail with some analysts downgrading the stock due to flat financials and technical weakness, while others note positive valuation improvements and growth prospects. Overall, these developments emphasize a transitional phase with both opportunities and challenges shaping the company's near-term outlook.
News Sentiment
Sentiment across recent news is mixed but leans slightly positive, with operational growth and strategic initiatives balanced against technical and valuation concerns. Positive earnings and market growth projections contribute to optimism, while downgrades and technical shifts inject caution. This blend suggests a nuanced market perception, reflecting both confidence in fundamentals and awareness of short-term risks.
Analytical Overview
Analysis Summary
Valuation Metrics: Vardhman Special Steels Ltd. exhibits a trailing P/E of 20.91 and a forward P/E of 11.29, which is below the industry average P/E of 20.91, suggesting relatively attractive valuation compared to peers. The PEG ratio of 0.65 indicates potential undervaluation relative to earnings growth.
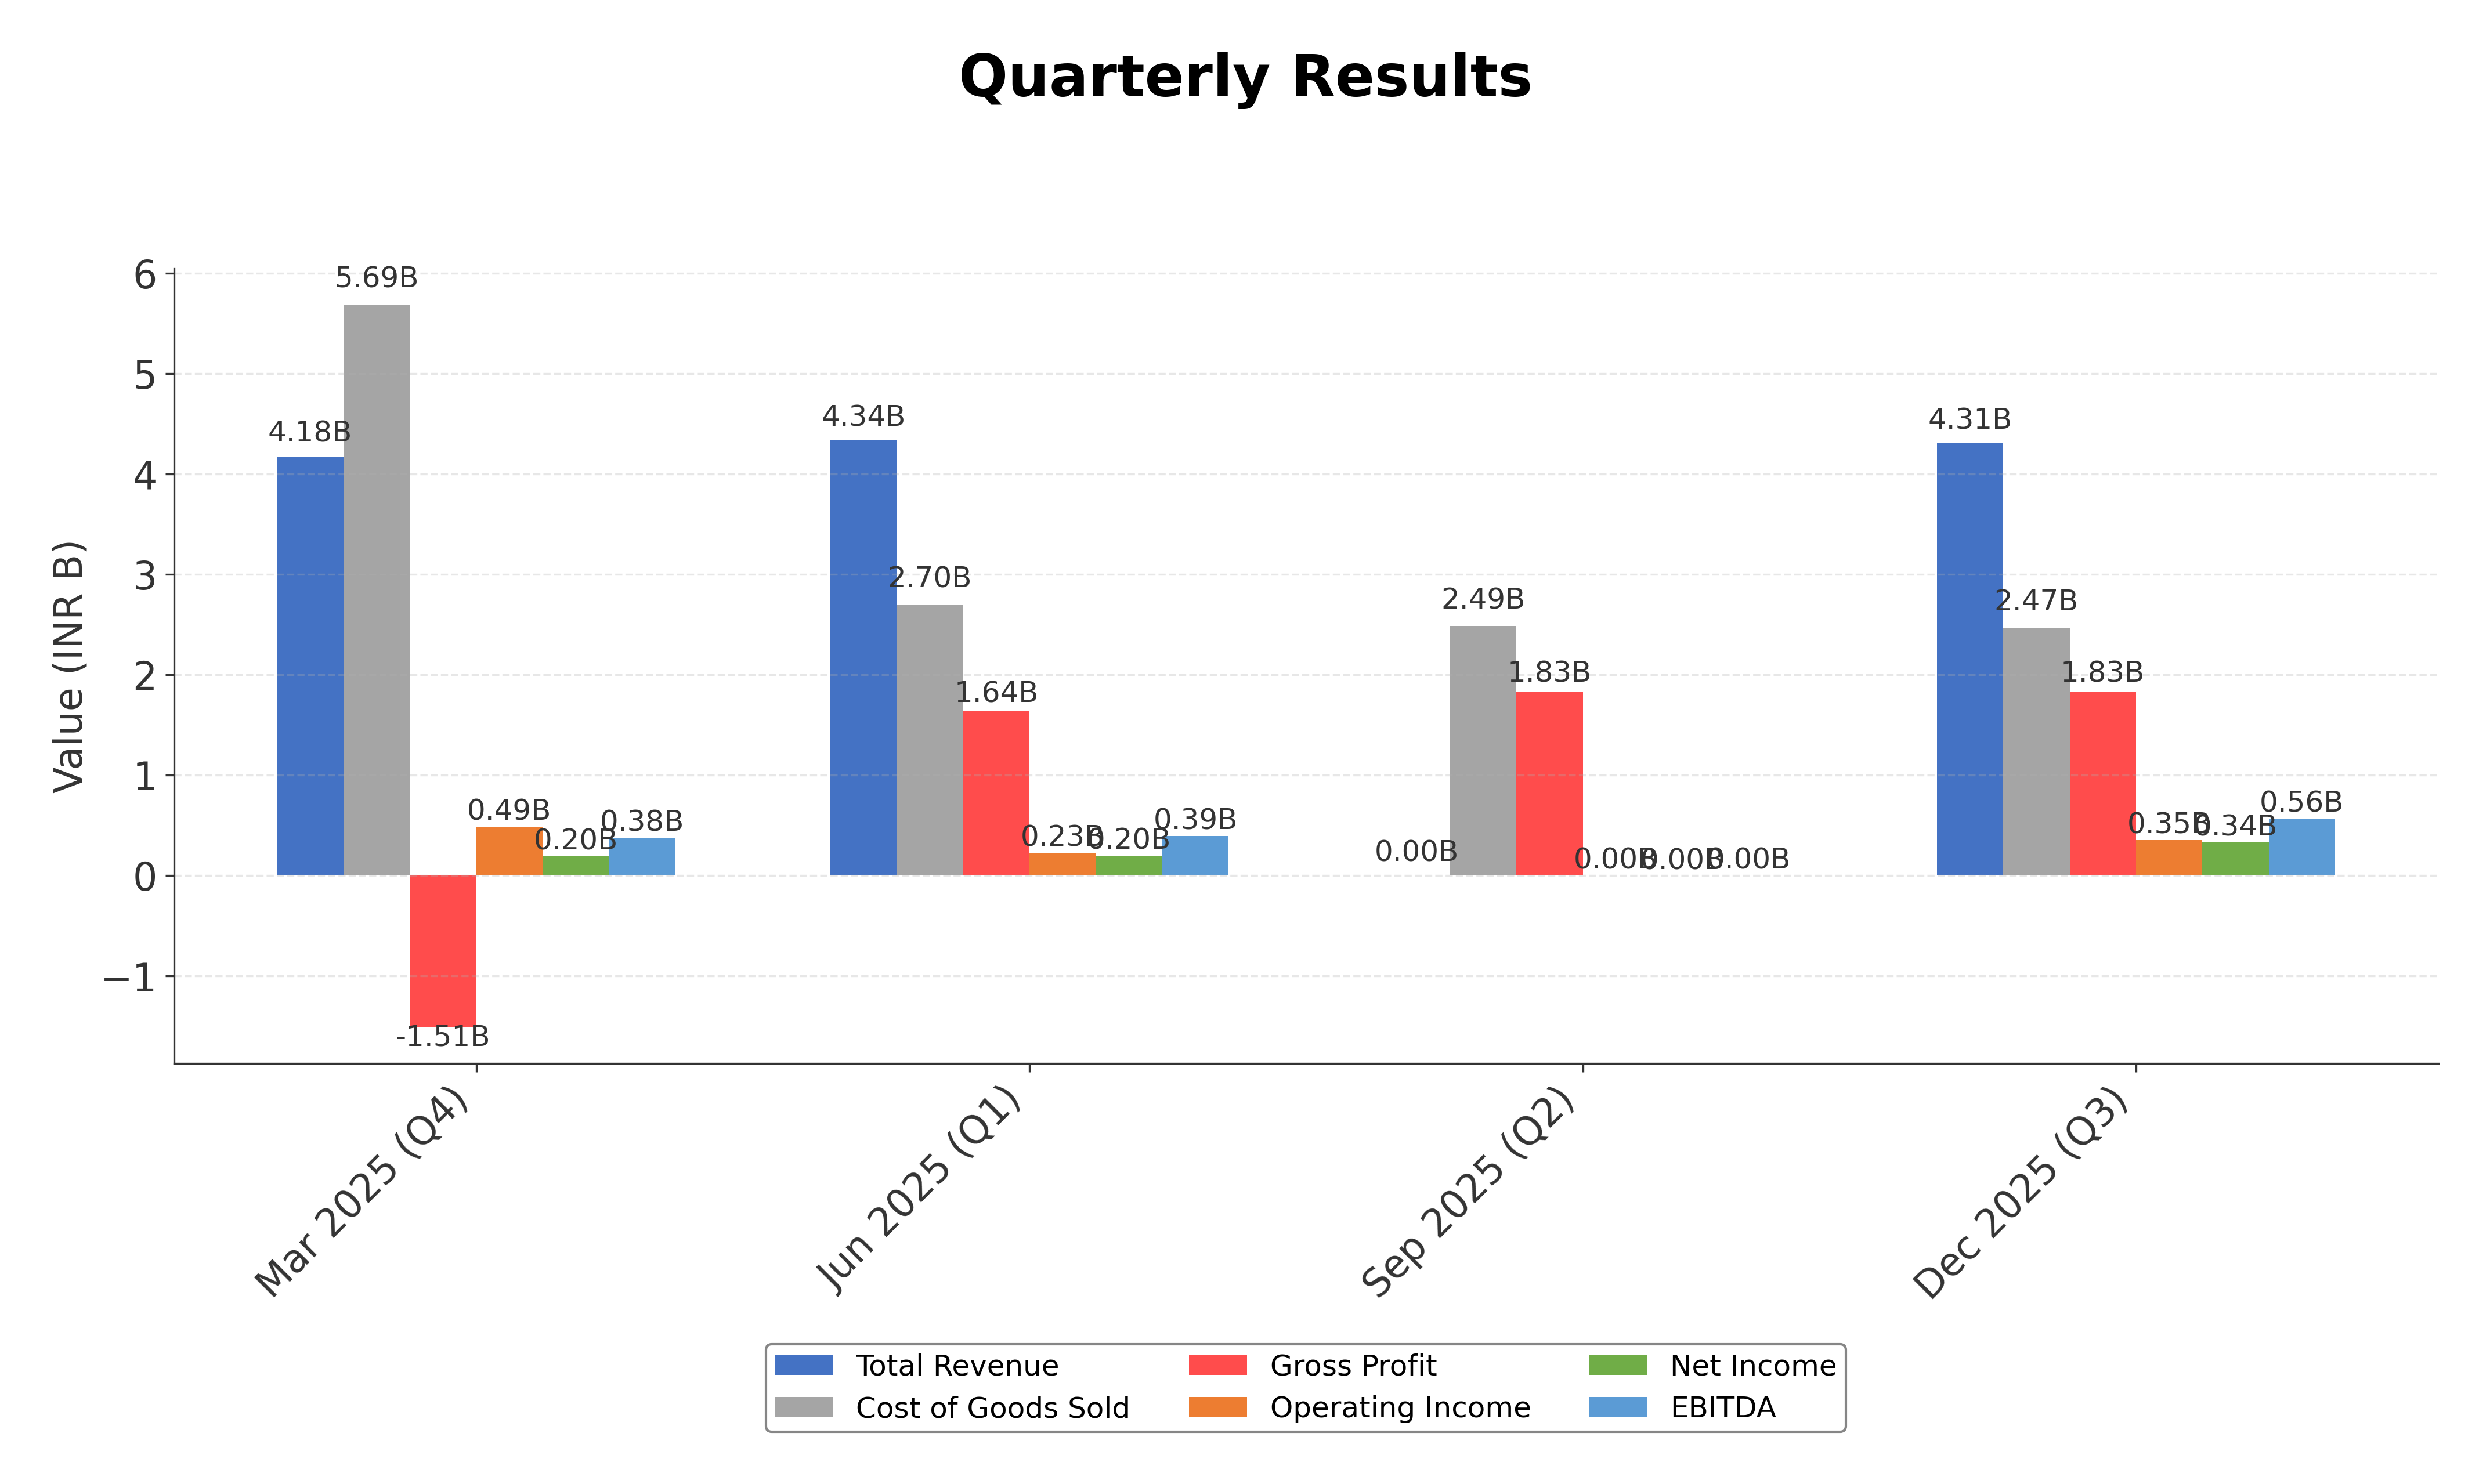
Growth Trajectory: Revenue growth is modest at 0.9% quarterly, while quarterly earnings growth year-over-year is robust at 56.5%, supported by a 34% rise in EBITDA in recent quarters, indicating improving profitability despite flat top-line expansion.
Financial Health: The company maintains a strong current ratio of 2.11 and a low debt-to-equity ratio of 0.06, reflecting solid liquidity and conservative leverage. Operating cash flow and free cash flow remain positive at ₹1.63 billion and ₹930 million respectively, supporting financial stability.
Sector Specific Factors: The Indian steel sector faces cyclical demand and regulatory challenges but benefits from growing automotive and infrastructure markets. VSSL's focus on special steel products aligns with sector growth trends, while regulatory compliance initiatives enhance market positioning.
India Specific Factors: India's regulatory environment emphasizes dematerialization and corporate governance, which VSSL addresses through recent shareholder initiatives. Consumer trends in automotive and engineering sectors support demand growth, while economic outlook remains cautiously optimistic.
Investment Conclusion
Supporting Factors: Attractive forward P/E ratio of 11.29 relative to industry average suggests valuation appeal.
Risk Factors: Modest revenue growth of 0.9% signals limited top-line expansion.
SWOT Analysis
Strengths
- Strong EBITDA growth and improving profitability margins.
- Robust liquidity position with a current ratio above 2.
- Low leverage with a debt-to-equity ratio near 0.06.
- Focused product portfolio catering to automotive and engineering sectors.
Weaknesses
- Modest revenue growth indicating limited top-line expansion.
- High promoter shareholding limiting institutional participation.
- Recent mixed technical momentum suggesting market uncertainty.
- Relatively small market capitalization compared to major peers.
Opportunities
- Growing Indian special steel market projected to expand at 10.9% CAGR through 2035.
- Regulatory initiatives promoting dematerialization and corporate governance.
- Potential to capitalize on automotive and infrastructure sector growth.
- Scope for operational efficiency improvements and margin expansion.
Threats
- Volatility in steel prices impacting profitability.
- Competitive pressures from larger steel manufacturers.
- Economic cycles affecting demand in core industrial sectors.
- Technical weaknesses potentially influencing market sentiment.
Company Description
Vardhman Special Steels Ltd. is a notable player in the manufacturing sector, focusing on the production of high-grade steel products. This company specializes in creating a diverse array of steel for specific industrial applications, catering primarily to the automotive sector. Its products include hot-rolled bars and bright bars of special and alloy steel, which are essential components in the production of automobiles and heavy machinery. The company plays a crucial role in the supply chain for these industries, providing materials that meet stringent quality and performance standards. Established with a commitment to innovation and sustainability, Vardhman Special Steels Ltd. not only contributes to the automotive sector but also affects other industries like engineering and defense with its critical metallurgical expertise. Its strategic importance in the market is underscored by its capacity to adapt to industry needs and its dedication to producing high-quality steel that supports a wide range of applications worldwide.