
V2 Retail Ltd (V2RETAIL)
Stock Analysis Report
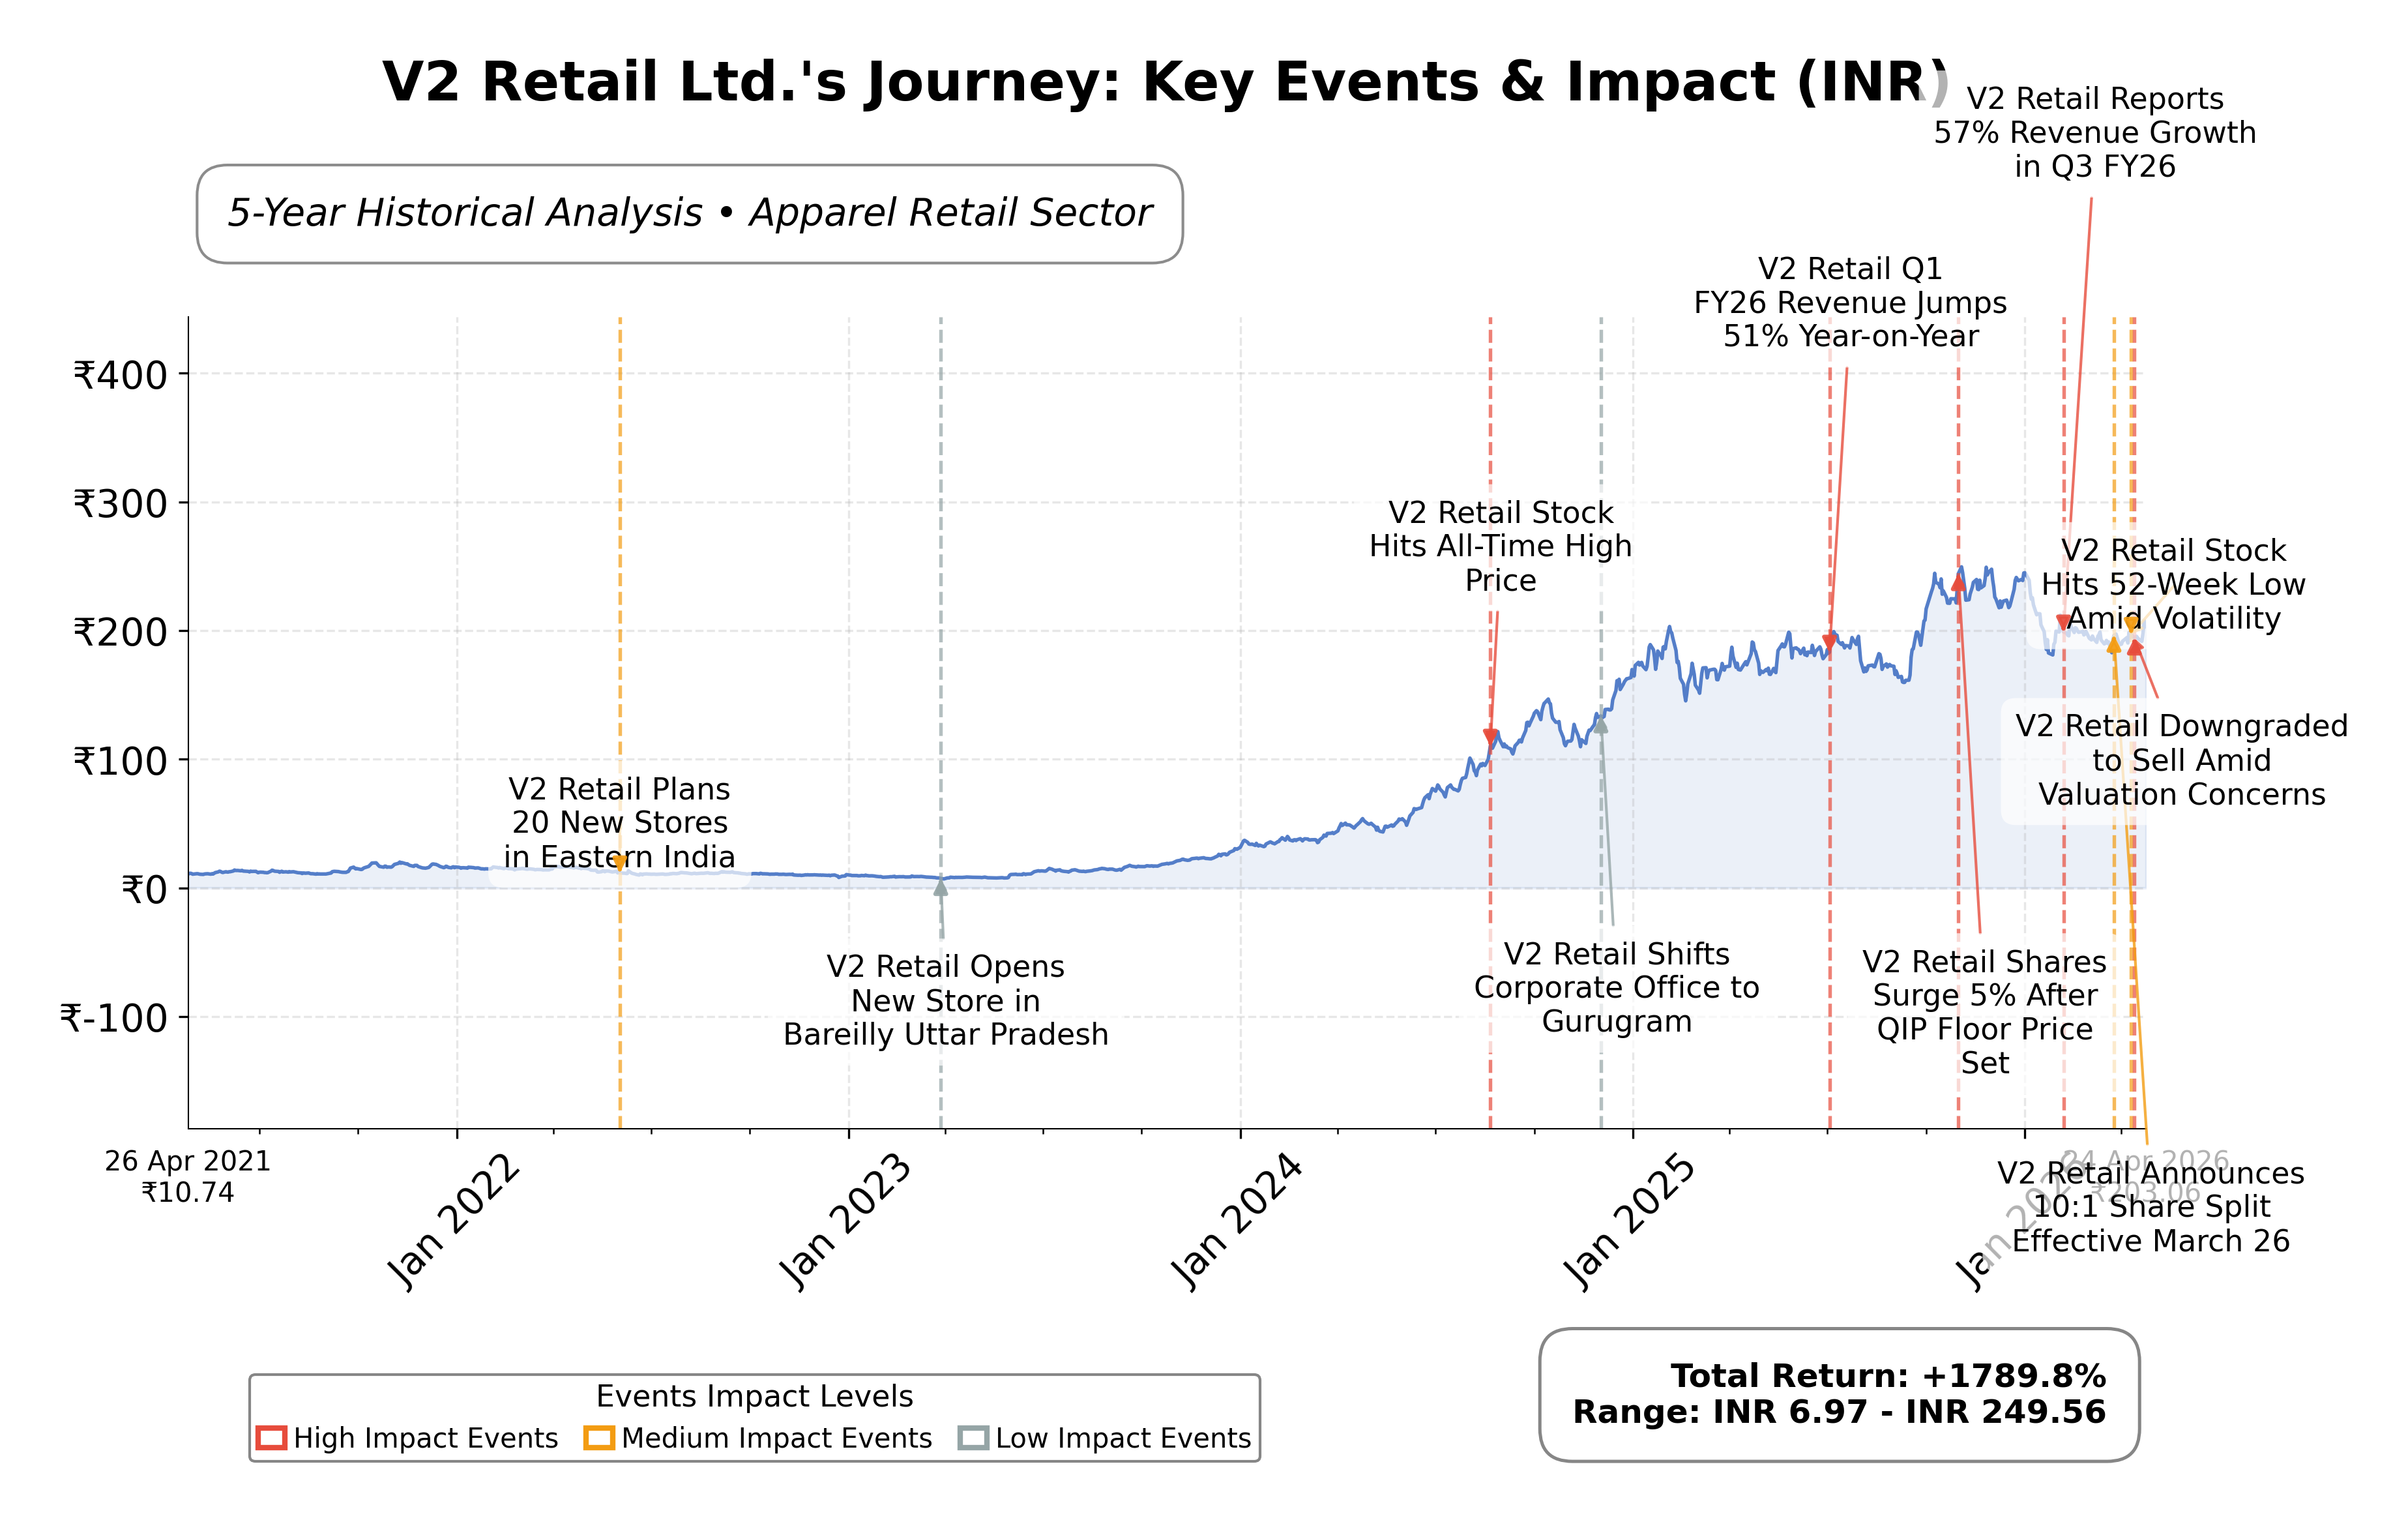
Stock Journey
Key Positives and Key Risks
Pros
- Revenue growth of 61% in FY26 demonstrates strong top-line expansion and business scalability.
- Return on equity of 20.8% indicates efficient use of shareholder capital and profitability.
- Aggressive network expansion with 136 net new stores added enhances market penetration.
Cons
- High debt-to-equity ratio of 339.24 reflects significant financial leverage and potential risk.
- Negative operating cash flow over the trailing twelve months suggests cash generation challenges.
- Premium valuation multiples with a trailing P/E of 45.84 and P/B of 17.74 may limit upside.
Disclosure: This information is for general awareness and does not constitute investment advice
Report Summary
V2 Retail Ltd. operates as a significant player in the Indian apparel retail industry, specializing in fashion and lifestyle products including apparel, footwear, home textiles, and accessories. Listed on the NSE under the symbol V2RETAIL, it belongs to the Consumer Cyclical sector and is recognized for its extensive retail network primarily targeting middle-income families across Tier 2 and Tier 3 cities in India. The company’s strategic focus on value-fashion and geographic expansion underpins its market positioning within the dynamic Indian retail landscape.
Financially, V2 Retail reported trailing twelve months (TTM) revenue of approximately ₹27.69 billion with a gross margin of 32.43%, operating margin of 13.77%, and a net profit margin of 5.43%. The company’s return on equity (ROE) stands at 20.8%, indicating efficient use of shareholder capital, while return on assets (ROA) is modest at 4.5%. The return on invested capital (ROIC) is reflected in an enterprise value to EBITDA ratio of 27.73, suggesting moderate capital efficiency relative to earnings.
Valuation metrics show a trailing P/E ratio of 45.84 and a price-to-book (P/B) ratio of 17.74, with an enterprise value to EBITDA (EV/EBITDA) multiple of 27.73. The stock is currently priced at ₹203.06, trading within a 52-week range of ₹157.63 to ₹256.41. The forward P/E ratio is significantly lower at 2.24, indicating anticipated earnings growth or market expectations of improved profitability. Market capitalization is approximately ₹70.8 billion, positioning the company as a mid-cap stock in the Indian market.
Key strengths include robust revenue growth of 57.2% quarter-over-quarter and aggressive store expansion, with 136 net new stores added in FY26, enhancing retail footprint to approximately 3.5 million square feet. The company maintains a current ratio of 1.09, reflecting adequate short-term liquidity, though it carries a high debt-to-equity ratio of 339.24, indicating substantial leverage. Risks involve valuation concerns given premium multiples, potential macroeconomic headwinds affecting consumer spending, and competitive pressures in the apparel retail sector. Recent strategic actions include focused expansion in Tier 2/3 cities and a data-driven assortment strategy to optimize sales and minimize markdowns.
Technically, the stock exhibits mixed momentum with recent price action near its 50-day moving average of ₹196.15 and 200-day moving average of ₹204.38. Momentum indicators reflect a complex outlook with shifts from bearish to mildly bearish trends. Recent news highlights both upgrades and downgrades in analyst sentiment, reflecting valuation and technical challenges alongside strong operational performance. Overall, the data suggests a nuanced environment where accumulation or realization of gains may be considered cautiously, with attention to evolving market signals and fundamentals.
Company and Industry Overview
Company Basics
Price Performance
Company Size
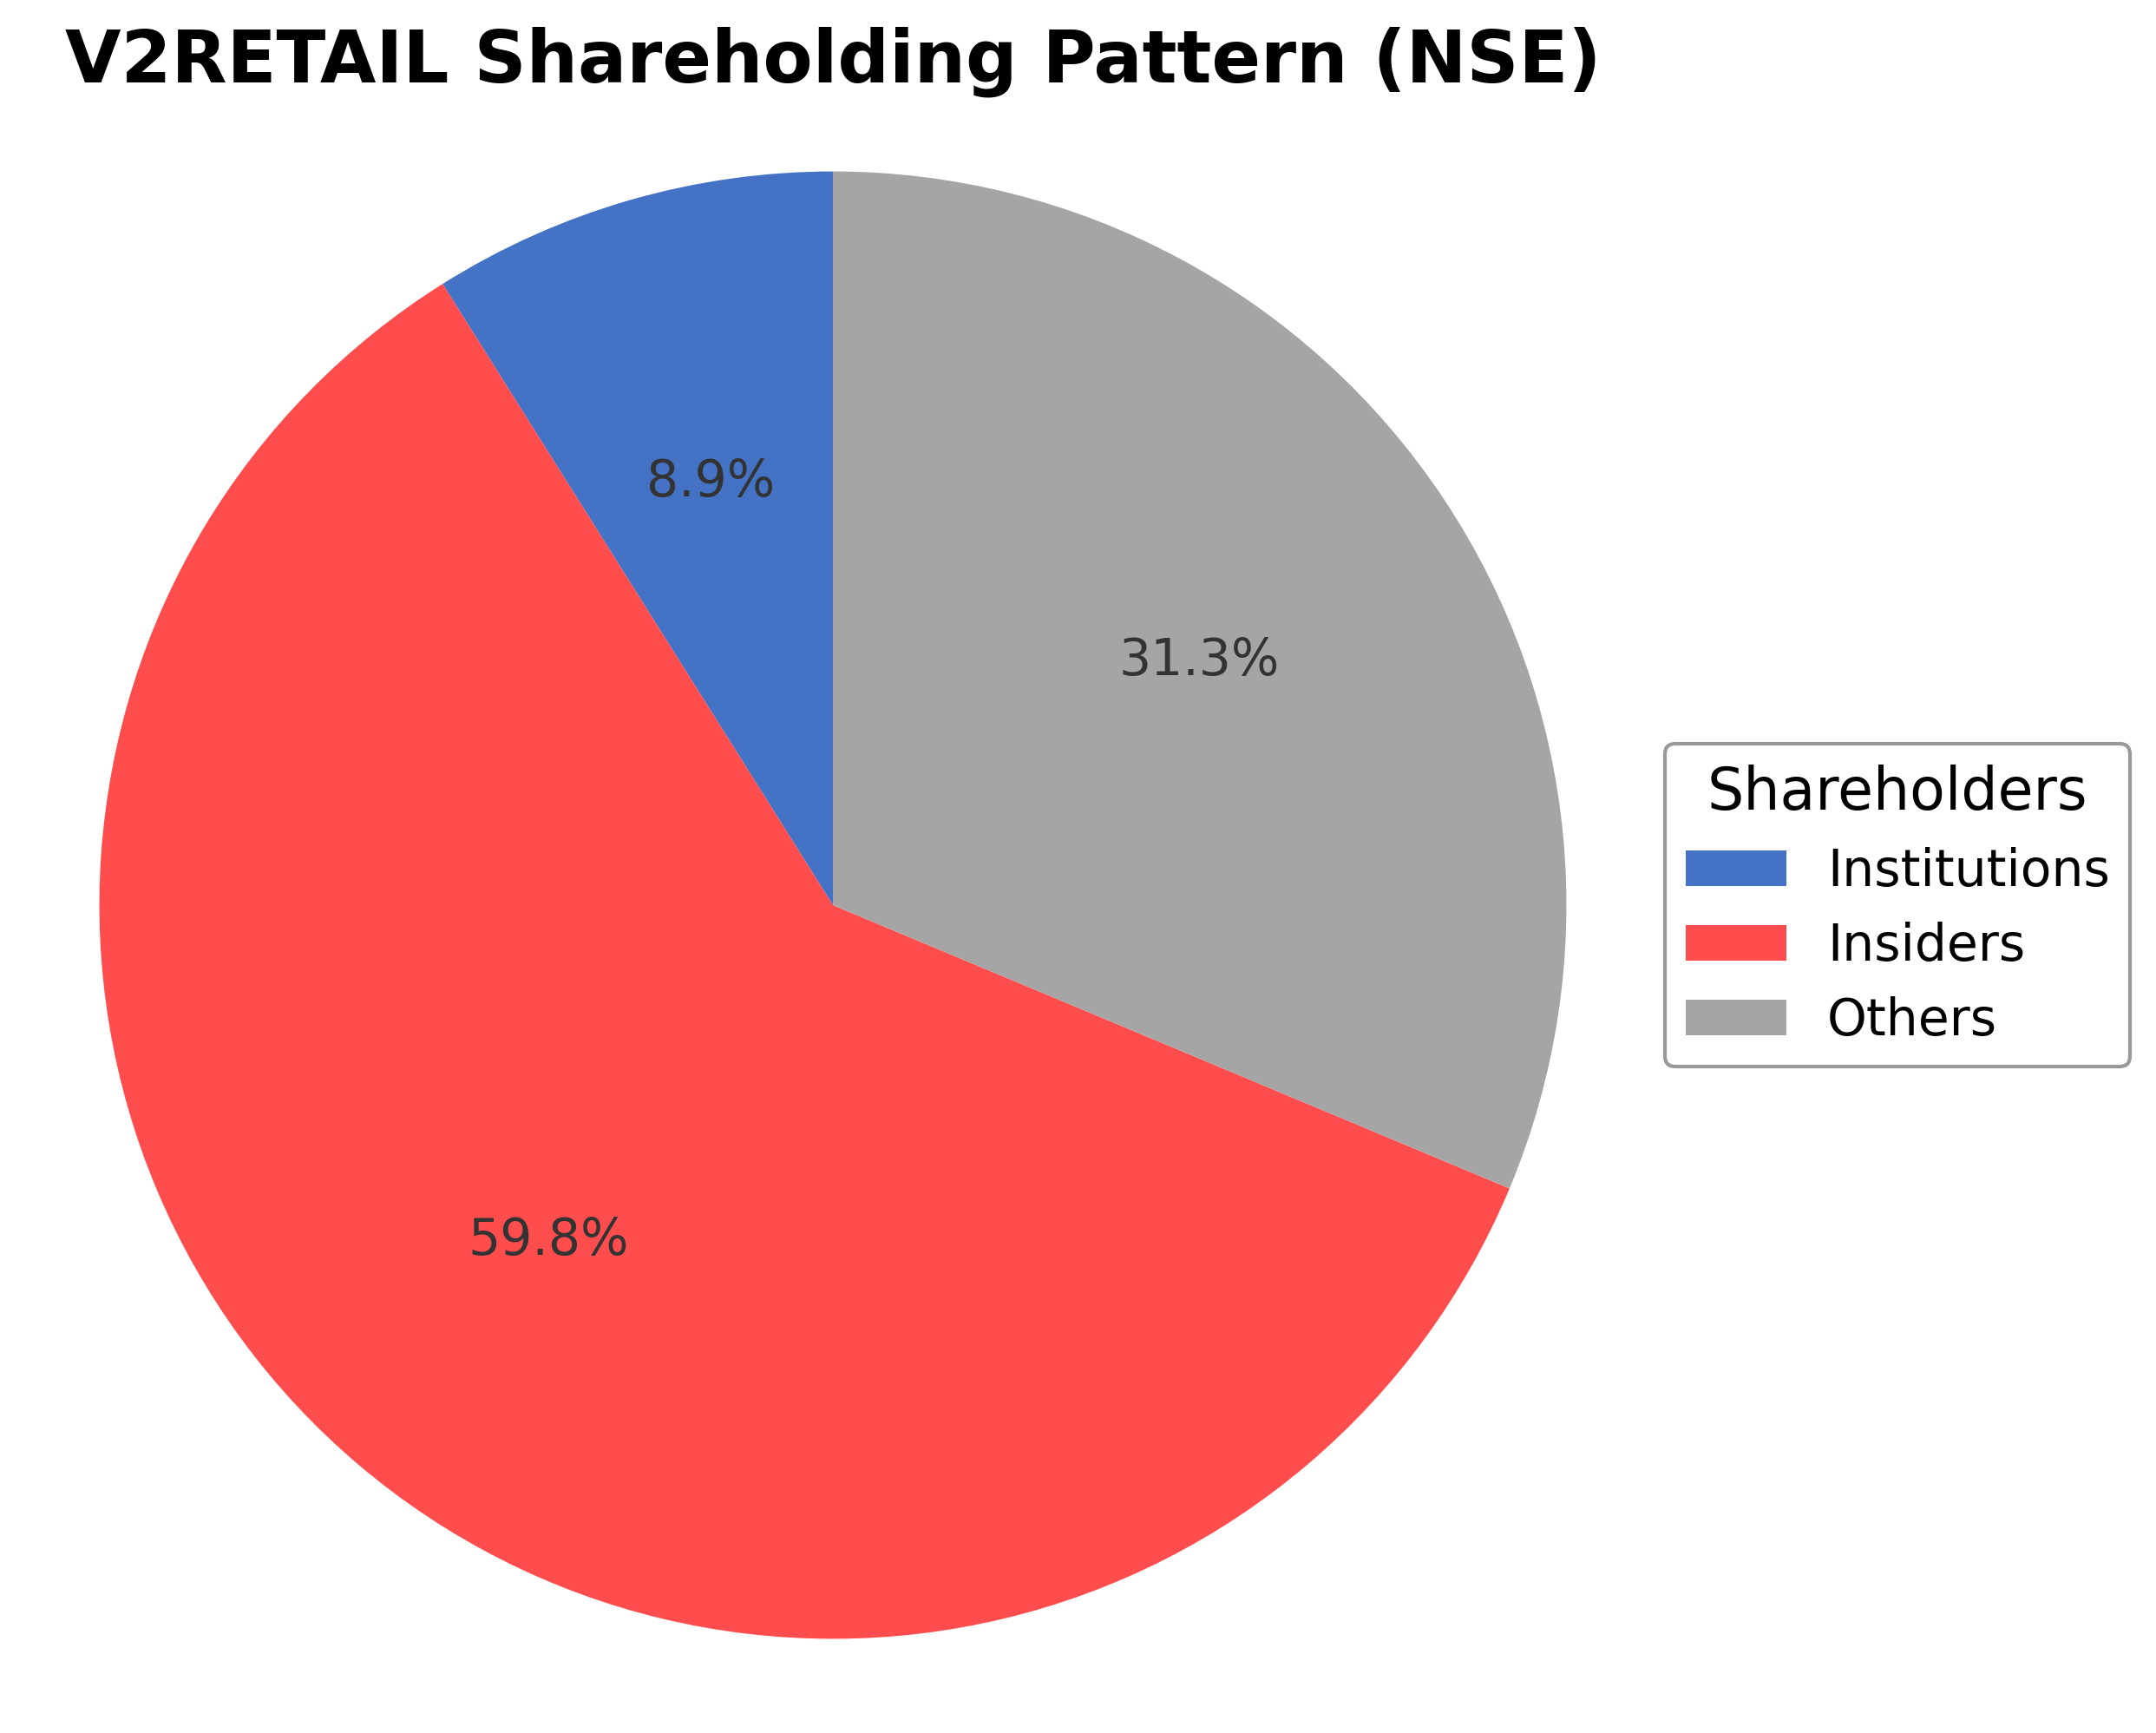
Shareholding Pattern
Sector and Industry Analysis
The retail sector in India, encompassing apparel and lifestyle products, is a significant contributor to the economy with a market size estimated in hundreds of billions of dollars and a steady growth trajectory driven by rising consumer income and urbanization. Key players include both domestic and international brands operating through extensive physical store networks and growing e-commerce platforms. The sector is characterized by a mix of organized retail chains and unorganized local retailers, with companies like V2 Retail Ltd expanding presence in tier-2 and tier-3 cities.
Industry trends highlight a shift towards omni-channel retailing, integrating brick-and-mortar stores with online sales to capture a broader customer base. Consumer preferences are evolving with increased demand for branded, lifestyle, and value-for-money products, intensifying competition among established brands and new entrants. Barriers to entry include high capital investment for store expansion, brand building, and supply chain management, while companies leverage strategic partnerships and digital platforms to enhance market positioning.
The regulatory environment for retail in India involves compliance with foreign direct investment (FDI) policies, taxation reforms such as GST, and consumer protection laws, which collectively influence operational frameworks. Recent regulations have aimed at streamlining tax structures and promoting transparency, benefiting organized retail players. Ongoing policy developments continue to shape market dynamics, with emphasis on ease of doing business and encouraging domestic manufacturing under initiatives like "Make in India."
Note: Analysis synthesized from industry research, market reports, and regulatory filings. Information is subject to change based on market conditions.
Financial Ratios Dashboard
Illustrative Scenario Analysis
DCF Assumptions:
Method: Two-Stage EPS-Priority Model
Financials
Peer Analysis
| Company Name | Market Cap | P/E Ratio | P/B Ratio | EV/EBITDA | Price to CFO |
|---|---|---|---|---|---|
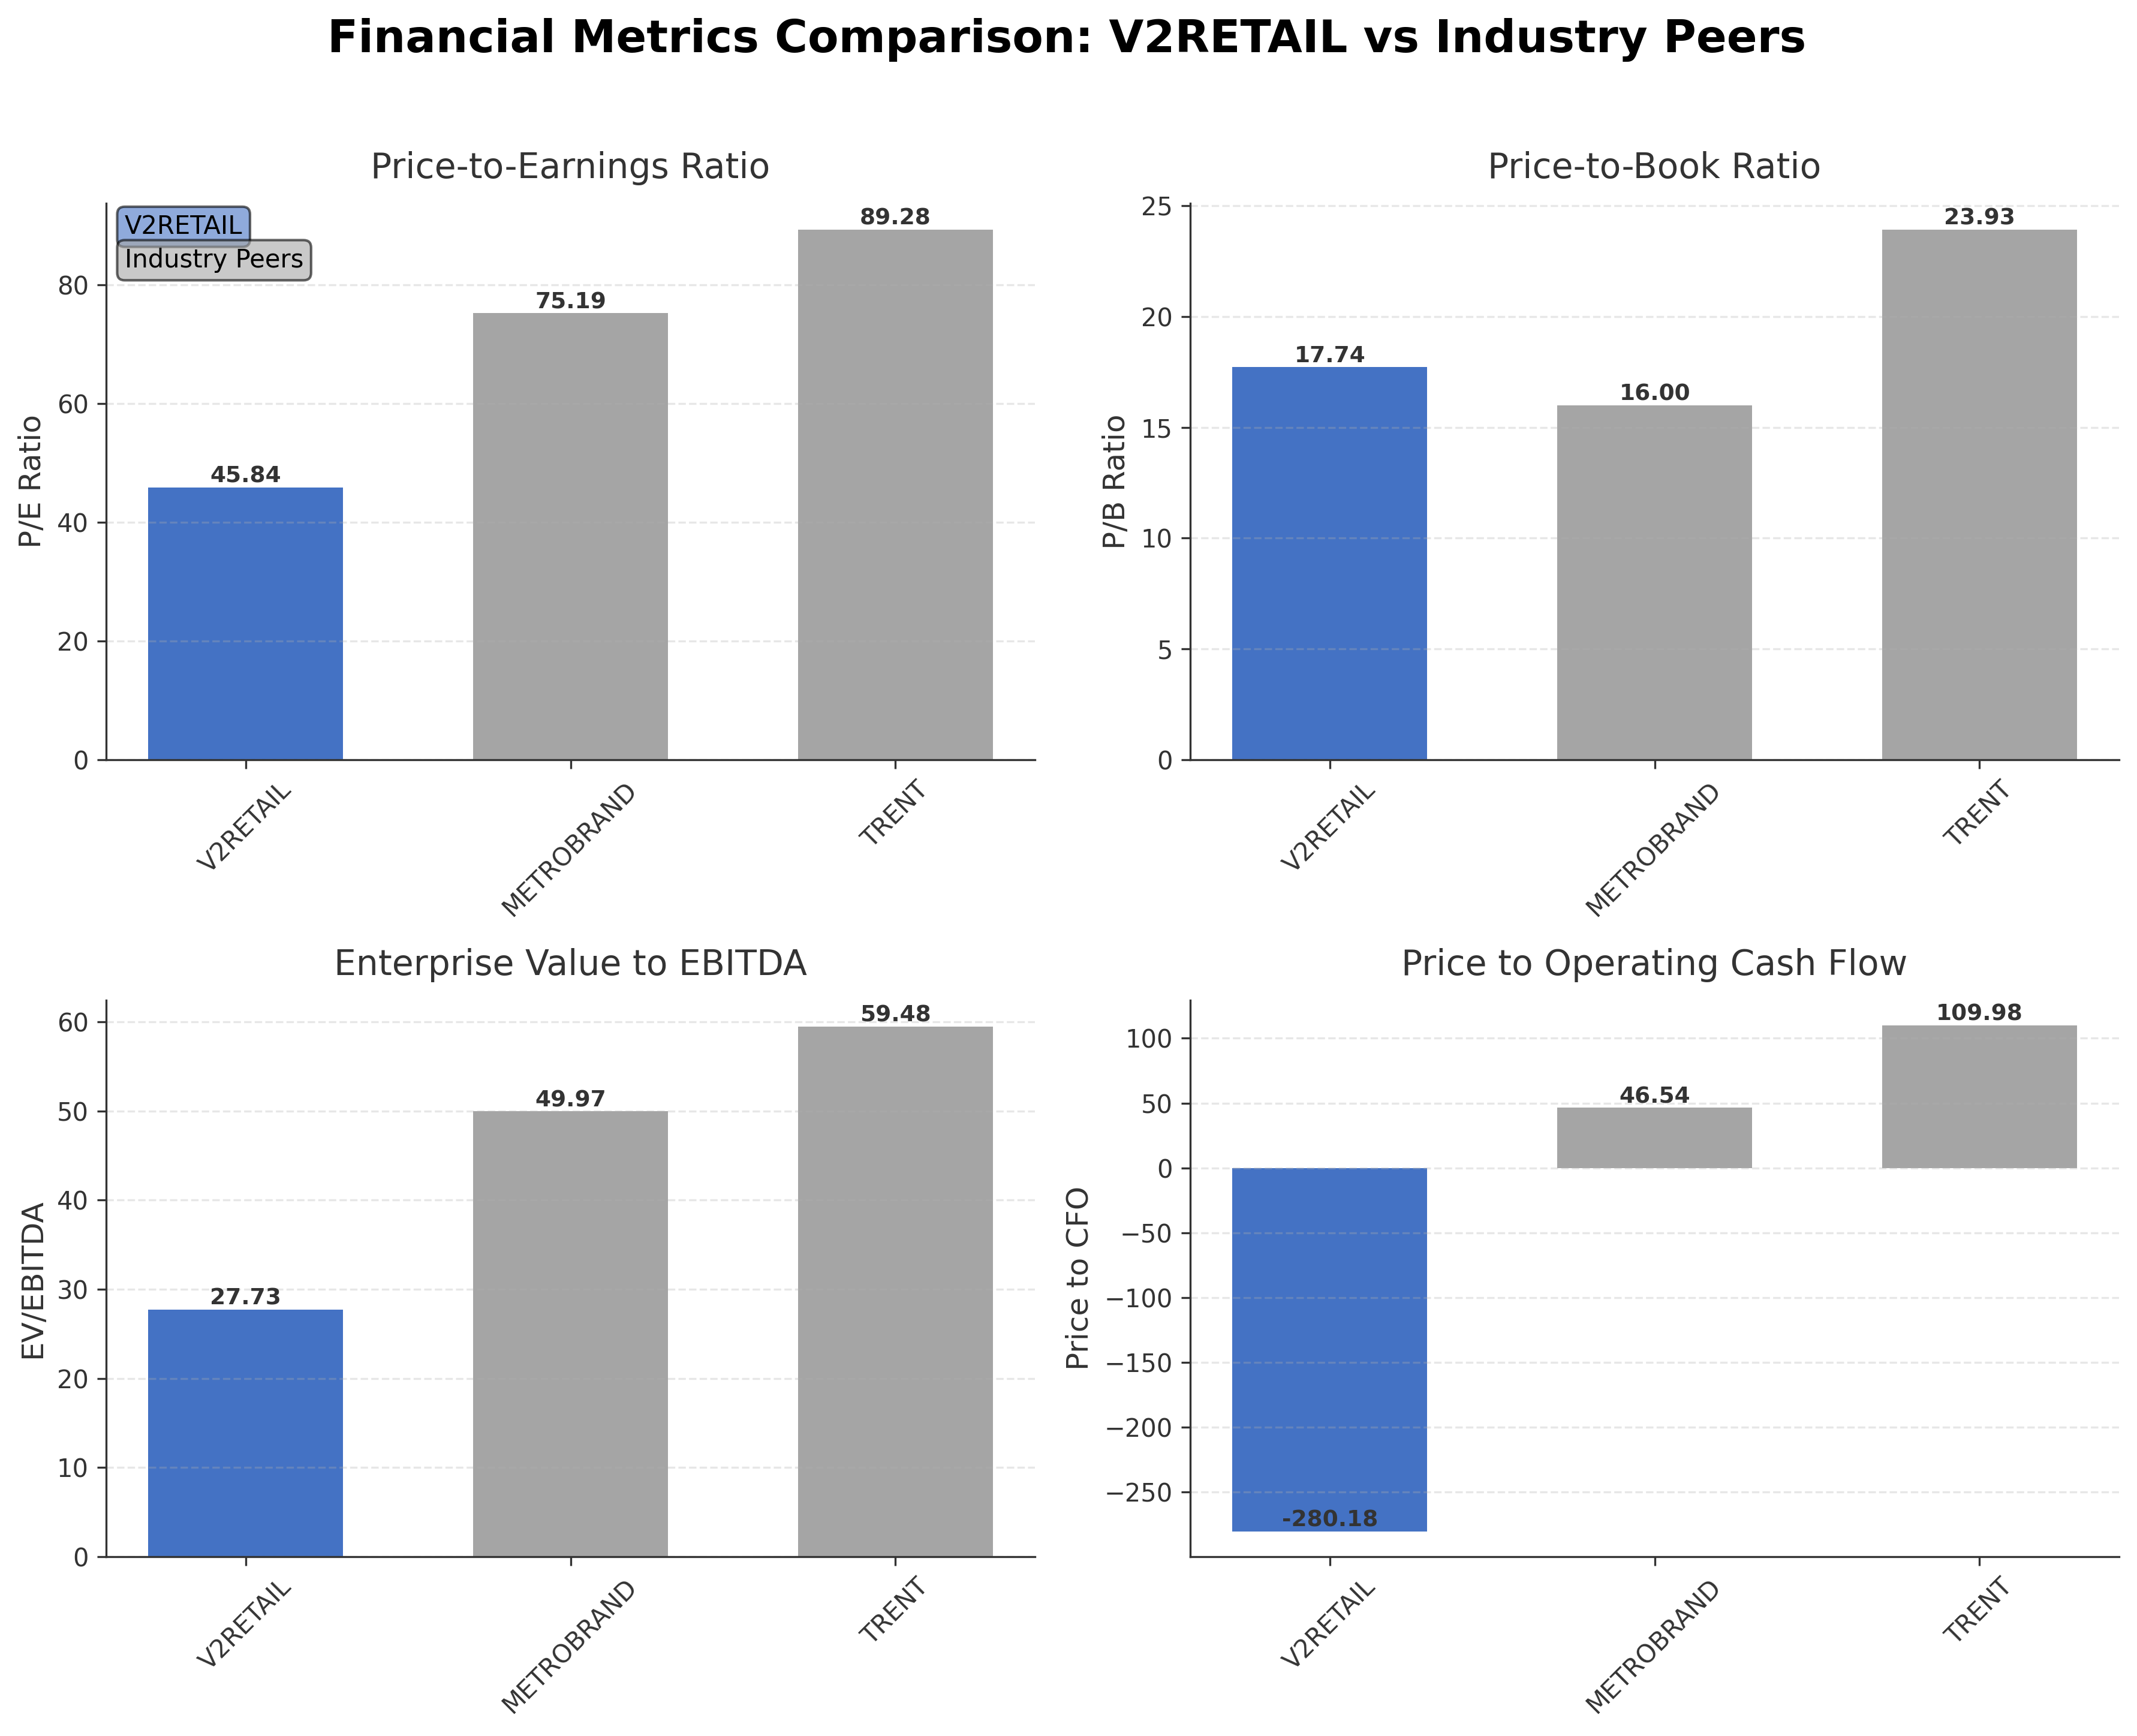
| V2 Retail Ltd. | ₹70.80B | 45.84 | 17.74 | 27.73 | -280.18 |
| Metro Brands Ltd. | ₹292.03B | 75.19 | 16.00 | 49.97 | 46.54 |
| Trent Ltd. | ₹1.46T | 89.28 | 23.93 | 59.48 | 109.98 |
Comparison Analysis: V2 Retail Ltd. trades at lower valuation multiples compared to its larger peers Metro Brands Ltd. and Trent Ltd., with a trailing P/E of 45.84 versus 75.19 and 89.28 respectively, and a P/B ratio of 17.74 below Trent's 23.93 but slightly above Metro Brands' 16.00. Its EV/EBITDA multiple of 27.73 is significantly lower than the peers' 49.97 and 59.48, indicating relatively more attractive earnings valuation. However, V2 Retail's price to CFO is negative, contrasting with positive ratios for peers, which may reflect recent cash flow challenges. Return on equity is comparable at 21%, slightly higher than Metro Brands but below Trent. Overall, V2 Retail presents a more moderate valuation profile with room for growth, albeit with some operational cash flow considerations.
Financial Metrics Comparison with Peers
Financial Statements
Comprehensive financial data including income, balance sheet, and cash flow metrics
Income Statement
| fiscal_date | 2025-03-31 | 2024-03-31 | 2023-03-31 | 2022-03-31 | 2021-03-31 |
|---|---|---|---|---|---|
| Sales | 18.80B | 11.61B | 8.36B | 6.28B | 5.37B |
| Cost Of Goods | 13.29B | 7.67B | 5.53B | 4.22B | 3.76B |
| Gross Profit | 5.51B | 3.94B | 2.83B | 2.06B | 1.61B |
| Operating Expense Selling General And Administrative | 478.88M | 290.81M | 276.16M | 206.65M | 191.45M |
| Operating Expense Other Operating Expenses | 840.61M | 1.10B | 810.71M | 501.45M | 398.60M |
| Operating Income | 1.64B | 760.36M | 183.99M | 142.37M | -55.91M |
| Non Operating Interest Income | 13.29M | 9.13M | 9.93M | 11.78M | 215.29M |
| Non Operating Interest Expense | 677.80M | 471.02M | 404.15M | 365.72M | 312.81M |
| Pretax Income | 982.19M | 313.73M | -169.52M | -148.59M | -152.91M |
| Income Tax | 261.87M | 35.62M | -41.35M | -31.81M | -24.48M |
| Net Income | 720.32M | 278.11M | -128.17M | -116.77M | -128.43M |
| Eps Basic | 2.08 | 8.04 | -3.73 | -3.40 | -3.77 |
| Eps Diluted | 2.08 | 8.04 | -3.73 | -3.40 | -3.77 |
| Basic Shares Outstanding | 345.89M | 34.57M | 34.39M | 34.32M | 34.11M |
| Diluted Shares Outstanding | 345.89M | 34.57M | 34.39M | 34.32M | 34.11M |
| Ebit | 1.66B | 784.75M | 234.64M | 217.13M | 159.90M |
| Ebitda | 2.63B | 1.55B | 863.75M | 752.81M | 714.68M |
| Net Income Continuous Operations | 982.19M | 313.73M | -169.52M | -148.59M | -152.91M |
| Minority Interests | 0.00 | N/A | N/A | N/A | N/A |
| Preferred Stock Dividends | 0.00 | 0.00 | 0.00 | 0.00 | 0.00 |
Data provided by Twelve Data
Balance Sheet
| fiscal_date | 2025-03-31 | 2024-03-31 | 2023-03-31 | 2022-03-31 | 2021-03-31 |
|---|---|---|---|---|---|
| Cash And Cash Equivalents | 90.14M | 94.48M | 49.20M | 65.39M | 219.28M |
| Accounts Receivable | 965.00K | 554.00K | 670.00K | 13.24M | 6.58M |
| Total Assets | 15.99B | 10.27B | 7.93B | 7.92B | 8.13B |
| Total Liabilities | 12.53B | 7.52B | 5.46B | 5.34B | 5.44B |
| Long Term Debt | 6.93B | 4.06B | 3.37B | 3.14B | 3.09B |
| Shareholders Equity | 3.46B | 2.75B | 2.47B | 2.58B | 2.69B |
Data provided by Twelve Data
Cash Flow Statement
| fiscal_date | 2025-03-31 | 2024-03-31 | 2023-03-31 | 2022-03-31 | 2021-03-31 |
|---|---|---|---|---|---|
| Operating Activities Net Income | 982.19M | 313.73M | -169.52M | -148.59M | -152.91M |
| Operating Activities Stock Based Compensation | 0.00 | 1.32M | 17.24M | 12.92M | 23.75M |
| Operating Activities Other Non Cash Items | 644.99M | 415.93M | 352.52M | 224.06M | 131.51M |
| Operating Activities Accounts Receivable | -411.00K | 116.00K | 8.74M | -6.66M | -6.51M |
| Operating Activities Other Assets Liabilities | -1.88B | -1.65B | 24.96M | -52.70M | -897.05M |
| Operating Activities Operating Cash Flow | -252.70M | -918.68M | 233.94M | 29.04M | -901.22M |
| Investing Activities Capital Expenditures | -1.29B | -372.40M | -117.73M | -148.70M | -270.62M |
| Investing Activities Net Intangibles | -636.00K | -2.62M | -11.05M | -6.80M | -5.23M |
| Investing Activities Investing Cash Flow | -1.29B | -372.40M | -117.73M | -148.70M | -143.23M |
| Financing Activities Long Term Debt Issuance | 198.68M | 245.94M | 33.42M | 66.60M | 0.00 |
| Financing Activities Long Term Debt Payments | -155.02M | -137.02M | -17.29M | -11.69M | -48.21M |
| Financing Activities Short Term Debt Issuance | 203.61M | 262.53M | -24.50M | -47.59M | 255.08M |
| Financing Activities Common Stock Issuance | 0.00 | 2.00M | 0.00 | 2.84M | 0.00 |
| Financing Activities Financing Cash Flow | 247.27M | 373.45M | -8.37M | 10.17M | 158.67M |
| End Cash Position | 90.14M | 94.48M | 49.20M | 65.39M | 219.28M |
| Free Cash Flow | 885.36M | 539.16M | 732.76M | 418.49M | -242.13M |
| Investing Activities Other Investing Activity | N/A | N/A | 1.00K | N/A | 63.70M |
| Investing Activities Sale Of Investments | N/A | N/A | N/A | N/A | 63.70M |
| Financing Activities Other Financing Charges | N/A | N/A | N/A | N/A | -48.21M |
Data provided by Twelve Data
Technical Analysis
Key Insights
- The current trend shows mixed momentum with recent price action fluctuating around the 50-day moving average of ₹196.15 and below the 200-day moving average of ₹204.38, indicating a neutral to mildly bearish short-term trend.
- Key support levels are identified near ₹157.63 (52-week low) and ₹190, while resistance is observed around ₹256.41 (52-week high) and the 200-day moving average at ₹204.38.
- The stock is trading slightly above the 10-day moving average but below the 50-day and 200-day moving averages, suggesting short-term strength but longer-term resistance remains.
- Momentum indicators such as RSI and MACD show mixed signals with RSI near neutral levels and MACD indicating a recent shift from bearish to mildly bullish momentum, while stochastic oscillators reflect volatility.
- Multi-timeframe analysis reveals that daily charts show consolidation, weekly charts indicate a sideways trend, and monthly charts suggest a longer-term uptrend with periodic corrections.
- Potential market scenarios include a continuation of consolidation near current levels with possible breakout above the 200-day moving average if momentum strengthens, or a retest of support levels if selling pressure increases.
Trending News
1. Headline: V2 Retail Ltd Upgraded to Hold as Technicals Improve and Financials Impress
Summary: However, over one year, V2 Retail ... the stock’s three-year return stands at 2,129.99%, dwarfing the Sensex’s 32.89%. Five- and ten-year returns of 1,794.64% and 3,755.75% respectively further highlight the company’s exceptional long-term growth and wealth creation capabilities. Considering V2 Retail Ltd...
Sentiment: positive
2. Headline: V2 Retail Ltd Technical Momentum Shifts Amid Mixed Market Signals
Summary: V2 Retail Ltd, a small-cap player in the Garments & Apparels sector, has experienced a notable shift in its technical momentum, moving from a bearish stance to a mildly bearish outlook. Despite a 3.78% gain in the latest trading session, the stock’s technical indicators present a complex ...
Sentiment: positive
3. Headline: V2 Retail Ltd Downgraded to Sell Amid Technical and Valuation Concerns
Summary: The company’s market capitalisation ... stock, which typically entails higher volatility and risk compared to larger peers. This classification, combined with the current technical and valuation challenges, has influenced the downgrade to a Sell rating. Considering V2 Retail Ltd...
Sentiment: negative
4. Headline: V2 Retail Ltd Gains 0.94%: 6 Key Factors Driving Mixed Technical Momentum
Summary: V2 Retail Ltd closed the week at ₹197.65, marking a modest gain of 0.94% from its opening price of ₹195.80 on 6 April 2026. This performance came amid a broader Sensex rally of 5.34%, indicating that while the benchmark surged, V2 Retail’s stock showed restrained gains.
Sentiment: positive
Summary: V-Mart Retail Share Price: Find the latest news on V-Mart Retail Stock Price. Get all the information on V-Mart Retail with historic price charts for NSE / BSE. Experts & Broker view also get the V-Mart Retail Ltd. buy/sell tips detailed news, announcements, Forecasts, Analysts, Valuation, ...
Sentiment: neutral
Powered by Brave
Recent Updates
News Summary
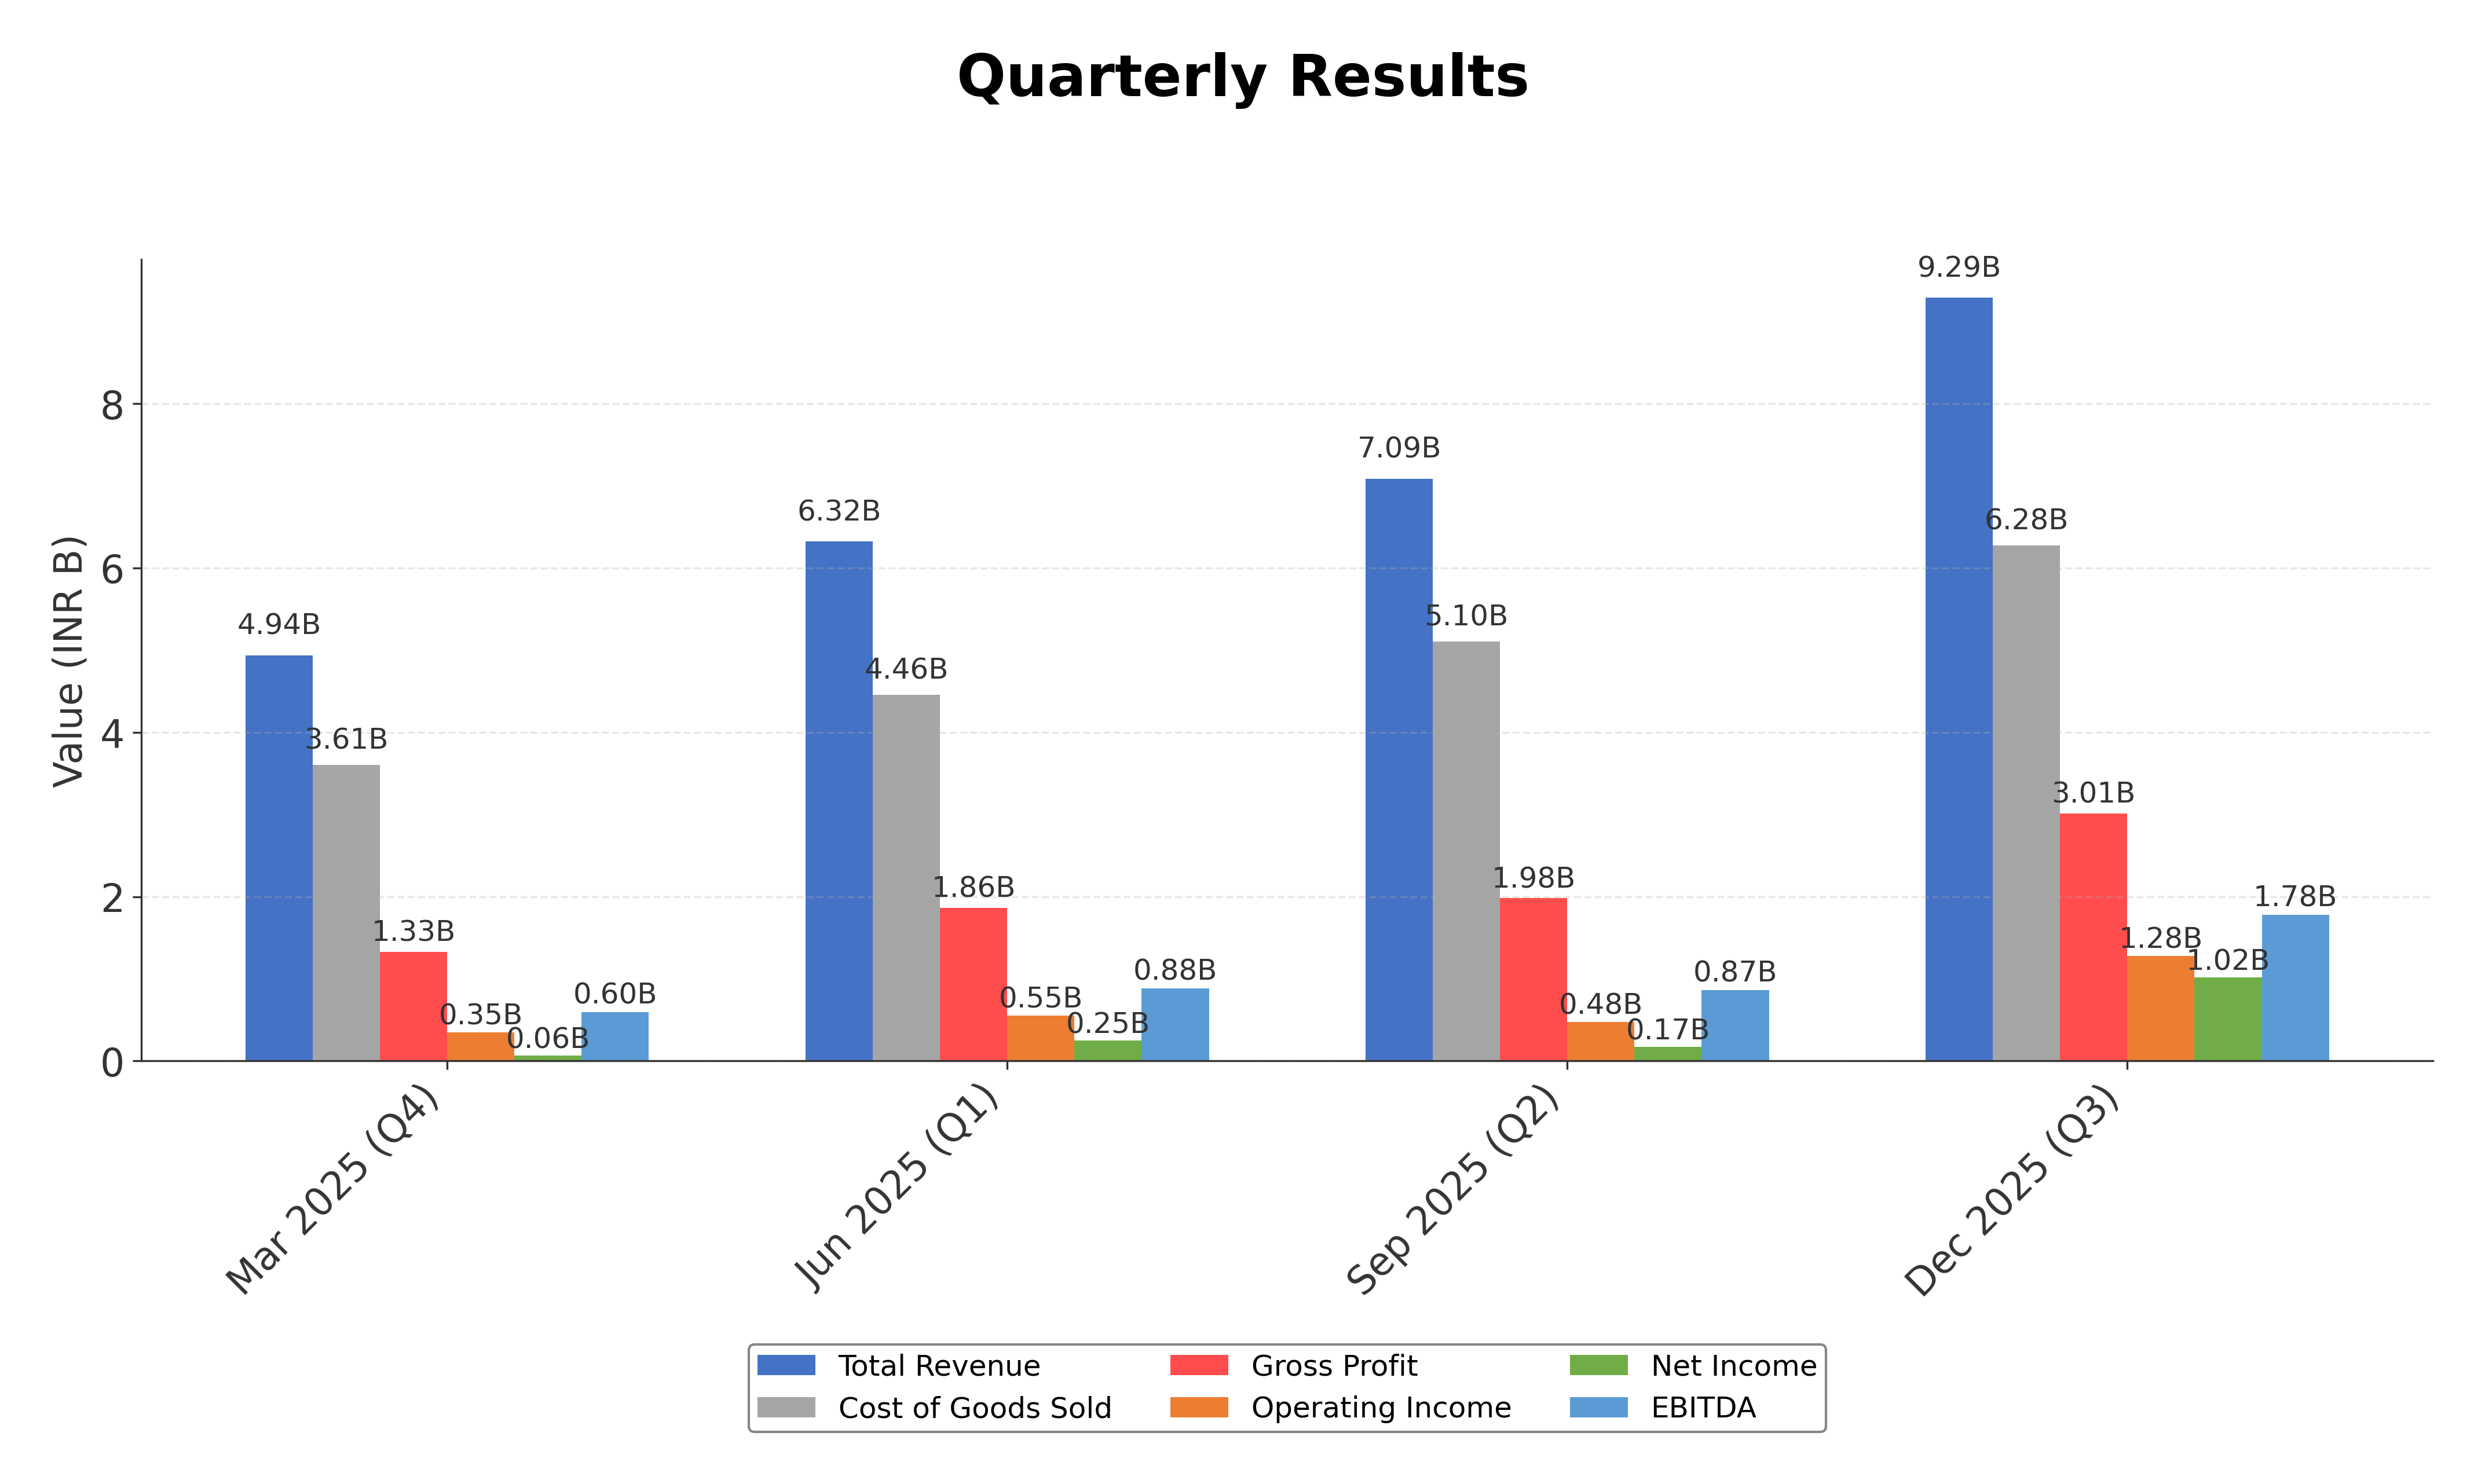
As of April 24, 2026. V2 Retail Ltd reported a strong financial performance for FY26, with standalone revenue increasing 61% year-over-year to ₹3,060 crore and Q4 revenue rising 59% to ₹798 crore. The company achieved same store sales growth of 7.74% in Q4 and 8.58% for the full year, supported by a data-driven assortment strategy and product focus. Network expansion was aggressive, with 136 net new stores added in FY26, increasing the retail footprint to approximately 3.5 million square feet, primarily in Tier 2 and Tier 3 cities. Quarterly results for December 2025 showed revenue growth of 35.43% quarter-over-quarter to ₹961.15 crore, EBITDA growth of 137.71% to ₹205.67 crore, and net profit growth of 492.4% to ₹102.07 crore. These results underscore operational scalability and improved profitability. The company maintains a high debt level but has shown improving cash flow metrics and liquidity.
News Sentiment
The overall sentiment from recent updates is predominantly positive, driven by strong revenue growth, robust same store sales increases, and significant network expansion. The substantial quarter-over-quarter and year-over-year improvements in profitability metrics reinforce confidence in the company’s business model and execution. However, the high debt-to-equity ratio and negative operating cash flow present cautionary aspects. Mixed technical signals and valuation concerns temper the outlook, balancing enthusiasm for growth with prudence regarding financial leverage and market volatility. The sentiment reflects a cautiously optimistic stance grounded in operational progress and financial discipline.
Source List
- https://scanx.trade/stock-market-news/companies/v2-retail-limited-reports-59-yoy-growth-in-q4-fy26-with-aggressive-network-expansion/36640776
- https://blinkx.in/insights/results/v2-retail-ltd-quarterly-result
- https://www.alphaspread.com/security/nse/v2retail/investor-relations/earnings-call/q3-2026
Analytical Overview
Analysis Summary
V2 Retail’s trailing P/E ratio of 45.84 is below some larger peers but remains elevated relative to the industry average of 45.84, while the forward P/E of 2.24 suggests anticipated earnings growth or market expectations of improved profitability. Revenue growth is strong at 57.2% quarter-over-quarter, supported by aggressive store expansion and same store sales growth, indicating a positive growth trajectory. Financial health shows mixed signals with a high debt-to-equity ratio of 339.24, negative operating cash flow, but positive levered free cash flow, reflecting improving cash generation despite leverage. Sector-specific challenges include competitive pressures in apparel retail and sensitivity to consumer spending patterns, while opportunities arise from expansion in Tier 2/3 cities and a value-fashion business model. Considering India-specific factors, the company benefits from growing consumer demand in emerging markets but must navigate regulatory and economic uncertainties.
Overall Business and Market Assessment
Supporting Factors: robust revenue and same store sales growth, successful network expansion, and improving profitability metrics
Risk Factors: No data
SWOT Analysis
Strengths
- Strong revenue growth of 61% in FY26 demonstrating business scalability.
- Robust same store sales growth of 7.74% in Q4 FY26 indicating operational efficiency.
- Extensive retail network expansion with 136 net new stores added in FY26.
- High return on equity at 20.8% reflecting effective capital utilization.
Weaknesses
- High debt-to-equity ratio of 339.24 indicating significant financial leverage.
- Negative operating cash flow over the trailing twelve months.
- Premium valuation multiples with P/B ratio of 17.74 and trailing P/E of 45.84.
- Low cash reserves relative to total debt, limiting financial flexibility.
Opportunities
- Expansion focus on Tier 2 and Tier 3 cities with growing consumer demand.
- Potential to improve cash flow through operational efficiencies and scale.
- Leveraging data-driven assortment strategies to enhance sales and reduce markdowns.
- Growing Indian retail market with increasing disposable incomes.
Threats
- Competitive pressures from established apparel retailers and new entrants.
- Macroeconomic risks affecting consumer discretionary spending.
- Valuation concerns may limit investor appetite and stock price appreciation.
- Regulatory changes impacting retail operations and supply chain costs.
Company Description
V2 Retail Ltd. is a prominent player in the Indian retail sector, known for its expansive range of fashion and lifestyle products. The company operates a robust chain of retail stores across India, offering a wide variety of apparel, footwear, home textiles, and accessories, catering primarily to middle-income families. Noted for its affordability and quality, V2 Retail aims to deliver fashionable products while maintaining a strong value proposition for its customers. The company is also strategic in its geographic distribution, focusing on high-growth regions to optimize market penetration. Through its extensive retail network, V2 Retail Ltd. plays a significant role in the dynamic Indian retail landscape, driving trends and fulfilling the diverse needs of its broad customer base. As part of the evolving retail industry, V2 Retail is engaged in enhancing its supply chain efficiency and store outreach, maintaining its relevance and competitiveness in a rapidly changing market environment.