
V-Mart Retail Ltd (VMART)
Stock Analysis Report
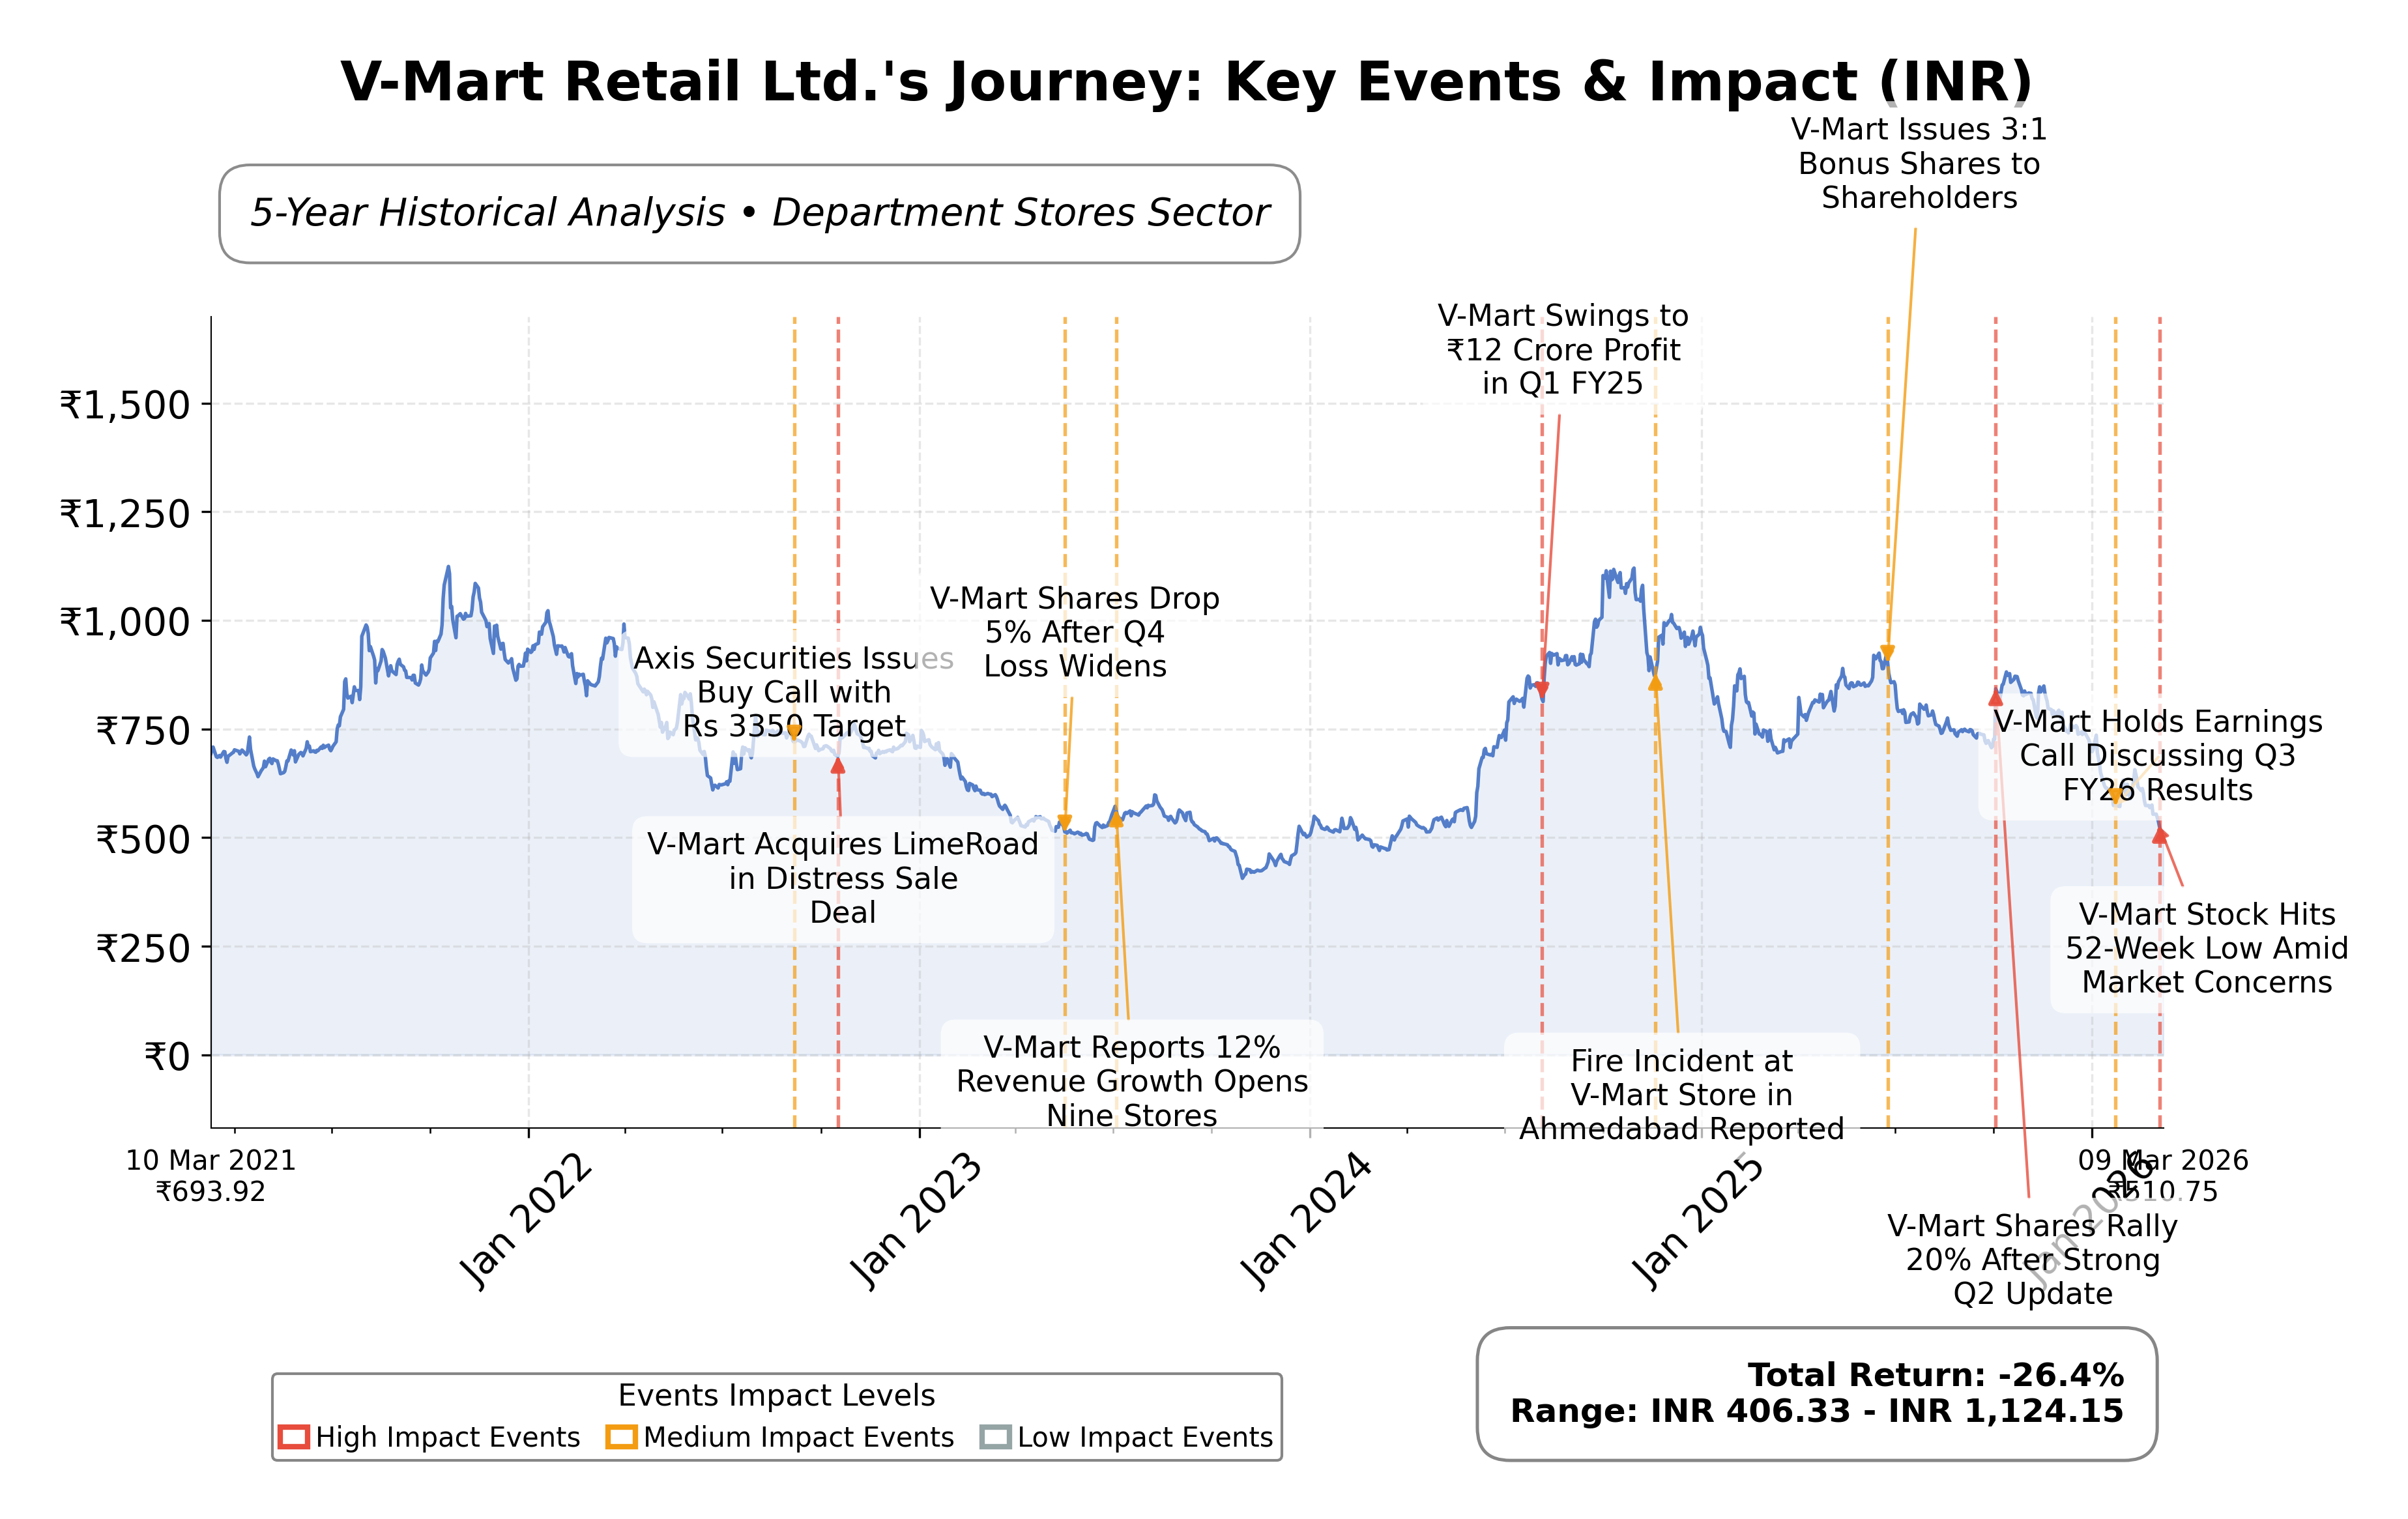
Stock Journey
Key Positives and Key Risks
Pros
- Revenue growth of 9.7% quarterly and year-over-year earnings growth of 22.8% indicate stable financial performance.
- Valuation metrics such as trailing P/E of 34.97 and forward P/E of 30.87 align with industry averages, reflecting fair market pricing.
- Institutional ownership at approximately 36.9% suggests moderate confidence from large investors.
Cons
- High debt-to-equity ratio of 94.7% raises concerns about financial leverage and risk.
- Negative operating cash flow of ₹-317.5 million may impact liquidity and operational flexibility.
- Stock trading below 50-day and 200-day moving averages indicates recent technical weakness.
Disclosure: This information is for general awareness and does not constitute investment advice
Report Summary
V-Mart Retail Ltd. is a prominent Indian retail company specializing in affordable fashion and clothing, primarily serving tier II and III cities. Positioned as a leading player in the regional value retail segment, the company targets budget-conscious consumers with a broad range of products including clothing, accessories, and household items. Its extensive store network caters to underserved demographics, bridging urban and rural retail markets in India.
Financially, V-Mart Retail Ltd. reports a market capitalization of approximately â¹45.46 billion with a trailing P/E ratio of 34.97 and a forward P/E of 30.87, reflecting valuation metrics in line with its industry average. The company posted a revenue of about â¹35.99 billion over the trailing twelve months with a gross margin of 36.16% and a net profit margin of 3.65%. Return on equity stands modestly at 5.65%, while operating cash flow is negative at â¹-317.5 million, though free cash flow remains positive at â¹457.7 million. The stock price currently trades near â¹518, below its 52-week high of â¹945, indicating a downside risk of 29.67%. The company maintains a low dividend yield of 0.03%.
Technically, the stock is trading below its 50-day (â¹650.13) and 200-day (â¹765.44) moving averages, reflecting recent weakness. The company has undergone a 4-for-1 stock split recently, and its beta of 0.21 suggests low volatility relative to the market. Institutional ownership accounts for approximately 36.9%, with insiders holding about 0.52%, indicating a balanced ownership structure. Key risks include elevated debt levels with a debt-to-equity ratio near 95%, and negative operating cash flow, while strengths lie in its market niche and steady revenue growth of 9.7% quarterly. Recent strategic initiatives and leadership updates have not been prominently disclosed.
Peer analysis within the Indian department stores sector shows V-Mart Retail Ltd. with a market cap of â¹45.46 billion and valuation multiples comparable to industry averages, though specific peer data is limited. The companyâs P/E and EV/EBITDA ratios align closely with sector norms, while its return on equity is relatively modest. The lack of detailed peer data constrains a comprehensive comparative assessment but suggests V-Mart occupies a mid-tier position in its regional retail industry.
V-Mart Retail Ltd. navigates a competitive and evolving retail landscape focused on value-conscious consumers in smaller Indian cities. Recent achievements include steady revenue growth and expansion of its retail footprint, while ongoing challenges encompass managing leverage and improving cash flow dynamics. The company stands at a pivotal moment where strategic execution and market conditions will significantly influence its financial trajectory and market valuation. Given the current data, a neutral and watchful stance may be appropriate for those assessing the stock, considering both the growth potential and the financial headwinds present.
Company and Industry Overview
Company Basics
Price Performance
Company Size
Shareholding Pattern
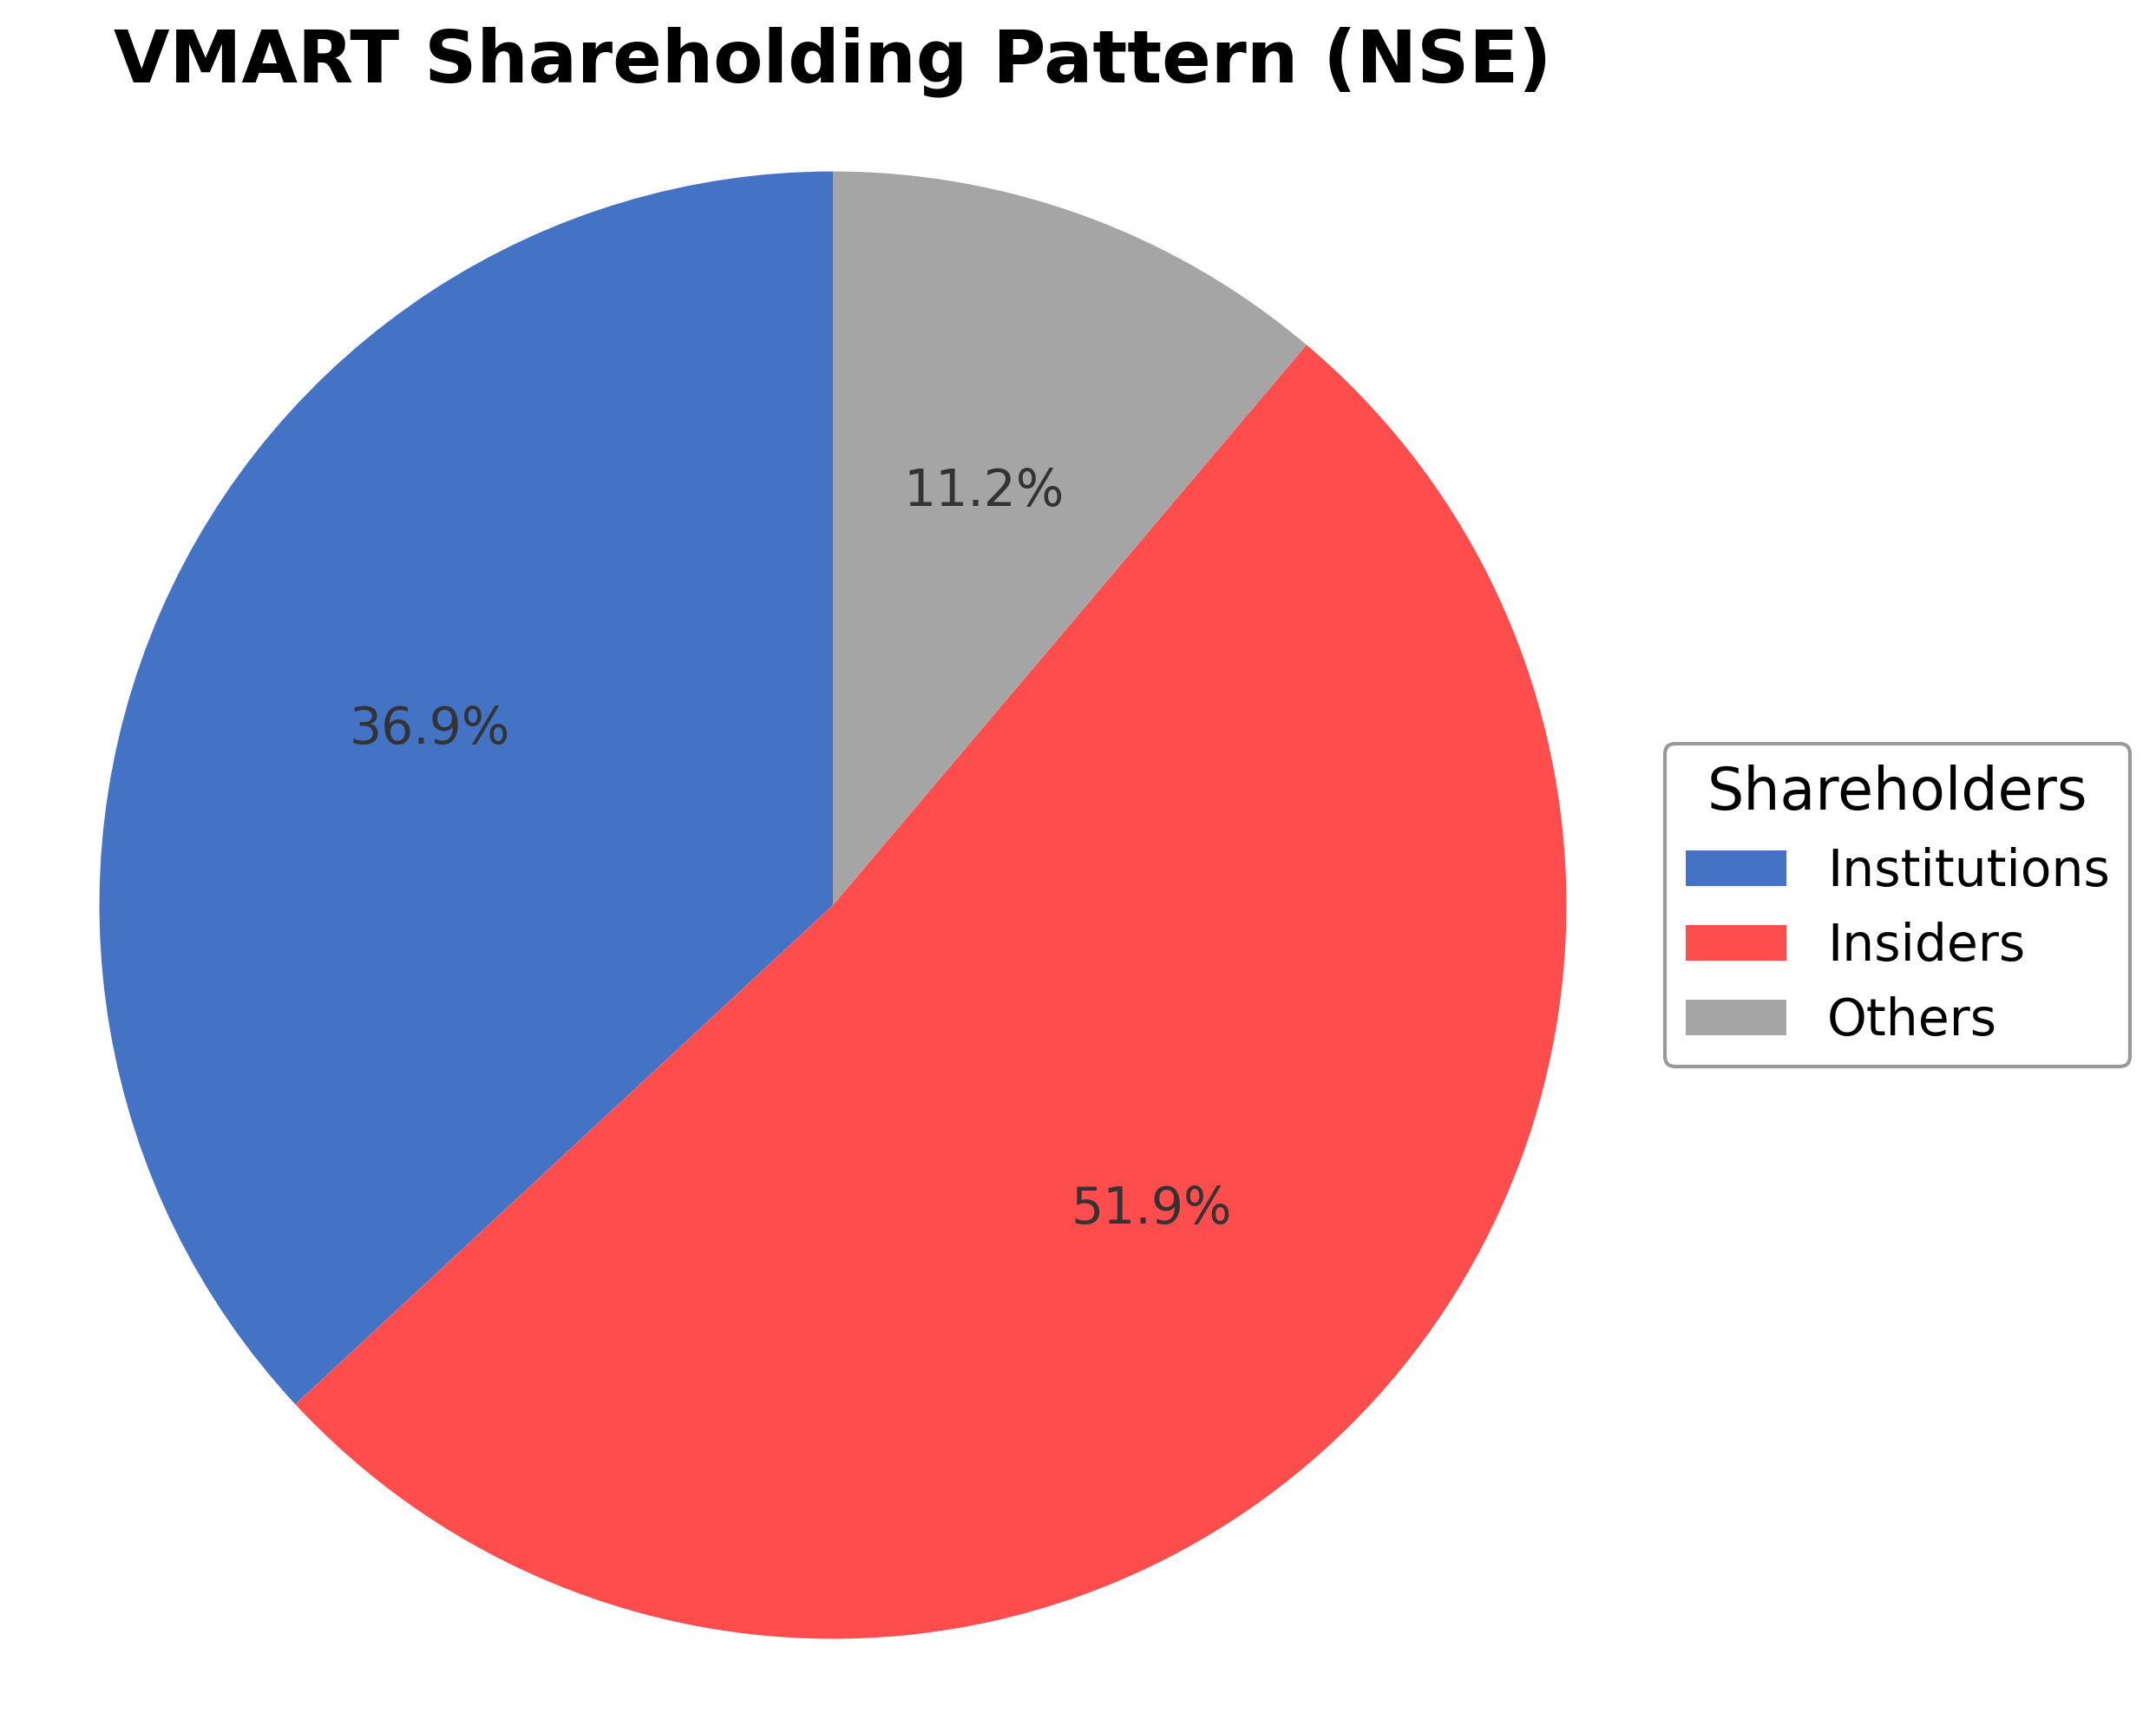
V-Mart Retail Ltd.'s ownership structure reveals that insiders, including executives and board members, hold approximately 0.52% of shares, while institutional investors such as mutual funds and asset managers own about 36.91%. The remaining shares are held by other shareholders including retail investors and employee stock plans. Over the past 12 to 24 months, there have been no significant disclosed shifts in major ownership positions. Institutional accumulation appears stable with no notable recent large-scale buying or selling reported. These shareholding patterns suggest a balanced market sentiment with moderate institutional interest, which may influence governance and strategic decisions, supporting steady operational continuity in the retail sector.
Sector and Industry Analysis
Sector and Industry Analysis: Retail Sector with Focus on V-Mart Retail Ltd.
1. Sector Overview: The retail sector in India, where V-Mart Retail Ltd. operates, is a significant contributor to the economy, encompassing a broad spectrum from traditional kirana stores to modern organized retail formats. The sector is valued at several hundred billion USD and is projected to grow at a CAGR of approximately 10-12% over the next five years, driven by rising disposable incomes, urbanization, and increasing consumer spending. Key players in the organized retail segment include large conglomerates such as Reliance Retail, Future Group, Avenue Supermarts (DMart), and specialty retailers like V-Mart, which focuses on value retailing in tier II and III cities. The sector is characterized by a mix of hypermarkets, supermarkets, specialty stores, and e-commerce platforms, with the latter gaining significant traction.
2. Industry Trends: The retail industry is undergoing rapid transformation fueled by technology adoption and evolving consumer preferences. Omnichannel retailing has become a critical strategy, integrating physical stores with digital platforms to enhance customer experience and expand reach. There is a growing emphasis on data analytics, personalized marketing, and supply chain optimization to improve operational efficiency. Consumer behavior is shifting towards value-conscious and convenience-oriented shopping, benefiting retailers like V-Mart that target value retail segments in smaller cities. Additionally, the rise of private labels and localized product assortments is reshaping product strategies. Emerging opportunities include penetration into underserved rural markets, expansion of private label offerings, and leveraging digital payment ecosystems.
3. Regulatory Landscape: The retail sector in India is subject to a complex regulatory environment that includes foreign direct investment (FDI) policies, taxation frameworks, labor laws, and consumer protection regulations. FDI in multi-brand retail is restricted, limiting foreign players' direct presence, whereas single-brand retail has more liberal policies, influencing competitive dynamics. Goods and Services Tax (GST) implementation has streamlined indirect taxation, benefiting supply chain integration and cost efficiencies. Compliance with the Legal Metrology Act, Food Safety and Standards Authority of India (FSSAI) regulations for food retail, and data privacy laws for digital transactions are critical for operational adherence. Policy initiatives promoting digital payments and infrastructure development also impact retail growth positively.
4. Competitive Dynamics: The Indian retail market is highly fragmented with low entry barriers in traditional retail but significant capital and operational requirements for organized retail chains. V-Mart Retail Ltd. competes primarily in the value retail segment, focusing on tier II and III cities, which offers a competitive advantage due to lower real estate costs and less saturation compared to metro markets. The competitive landscape includes both large national chains and regional players, with differentiation driven by pricing, product assortment, store experience, and supply chain efficiency. Economies of scale, vendor relationships, and brand loyalty are key competitive levers. The rise of e-commerce platforms poses both a challenge and an opportunity, necessitating hybrid retail models. Overall, the sector exhibits moderate consolidation with ongoing shifts towards organized retail formats.
Note: Analysis synthesized from industry research, market reports, and regulatory filings. Information is subject to change based on market conditions.
Illustrative Scenario Analysis
DCF Assumptions:
Method: Two-Stage EPS-Priority Model
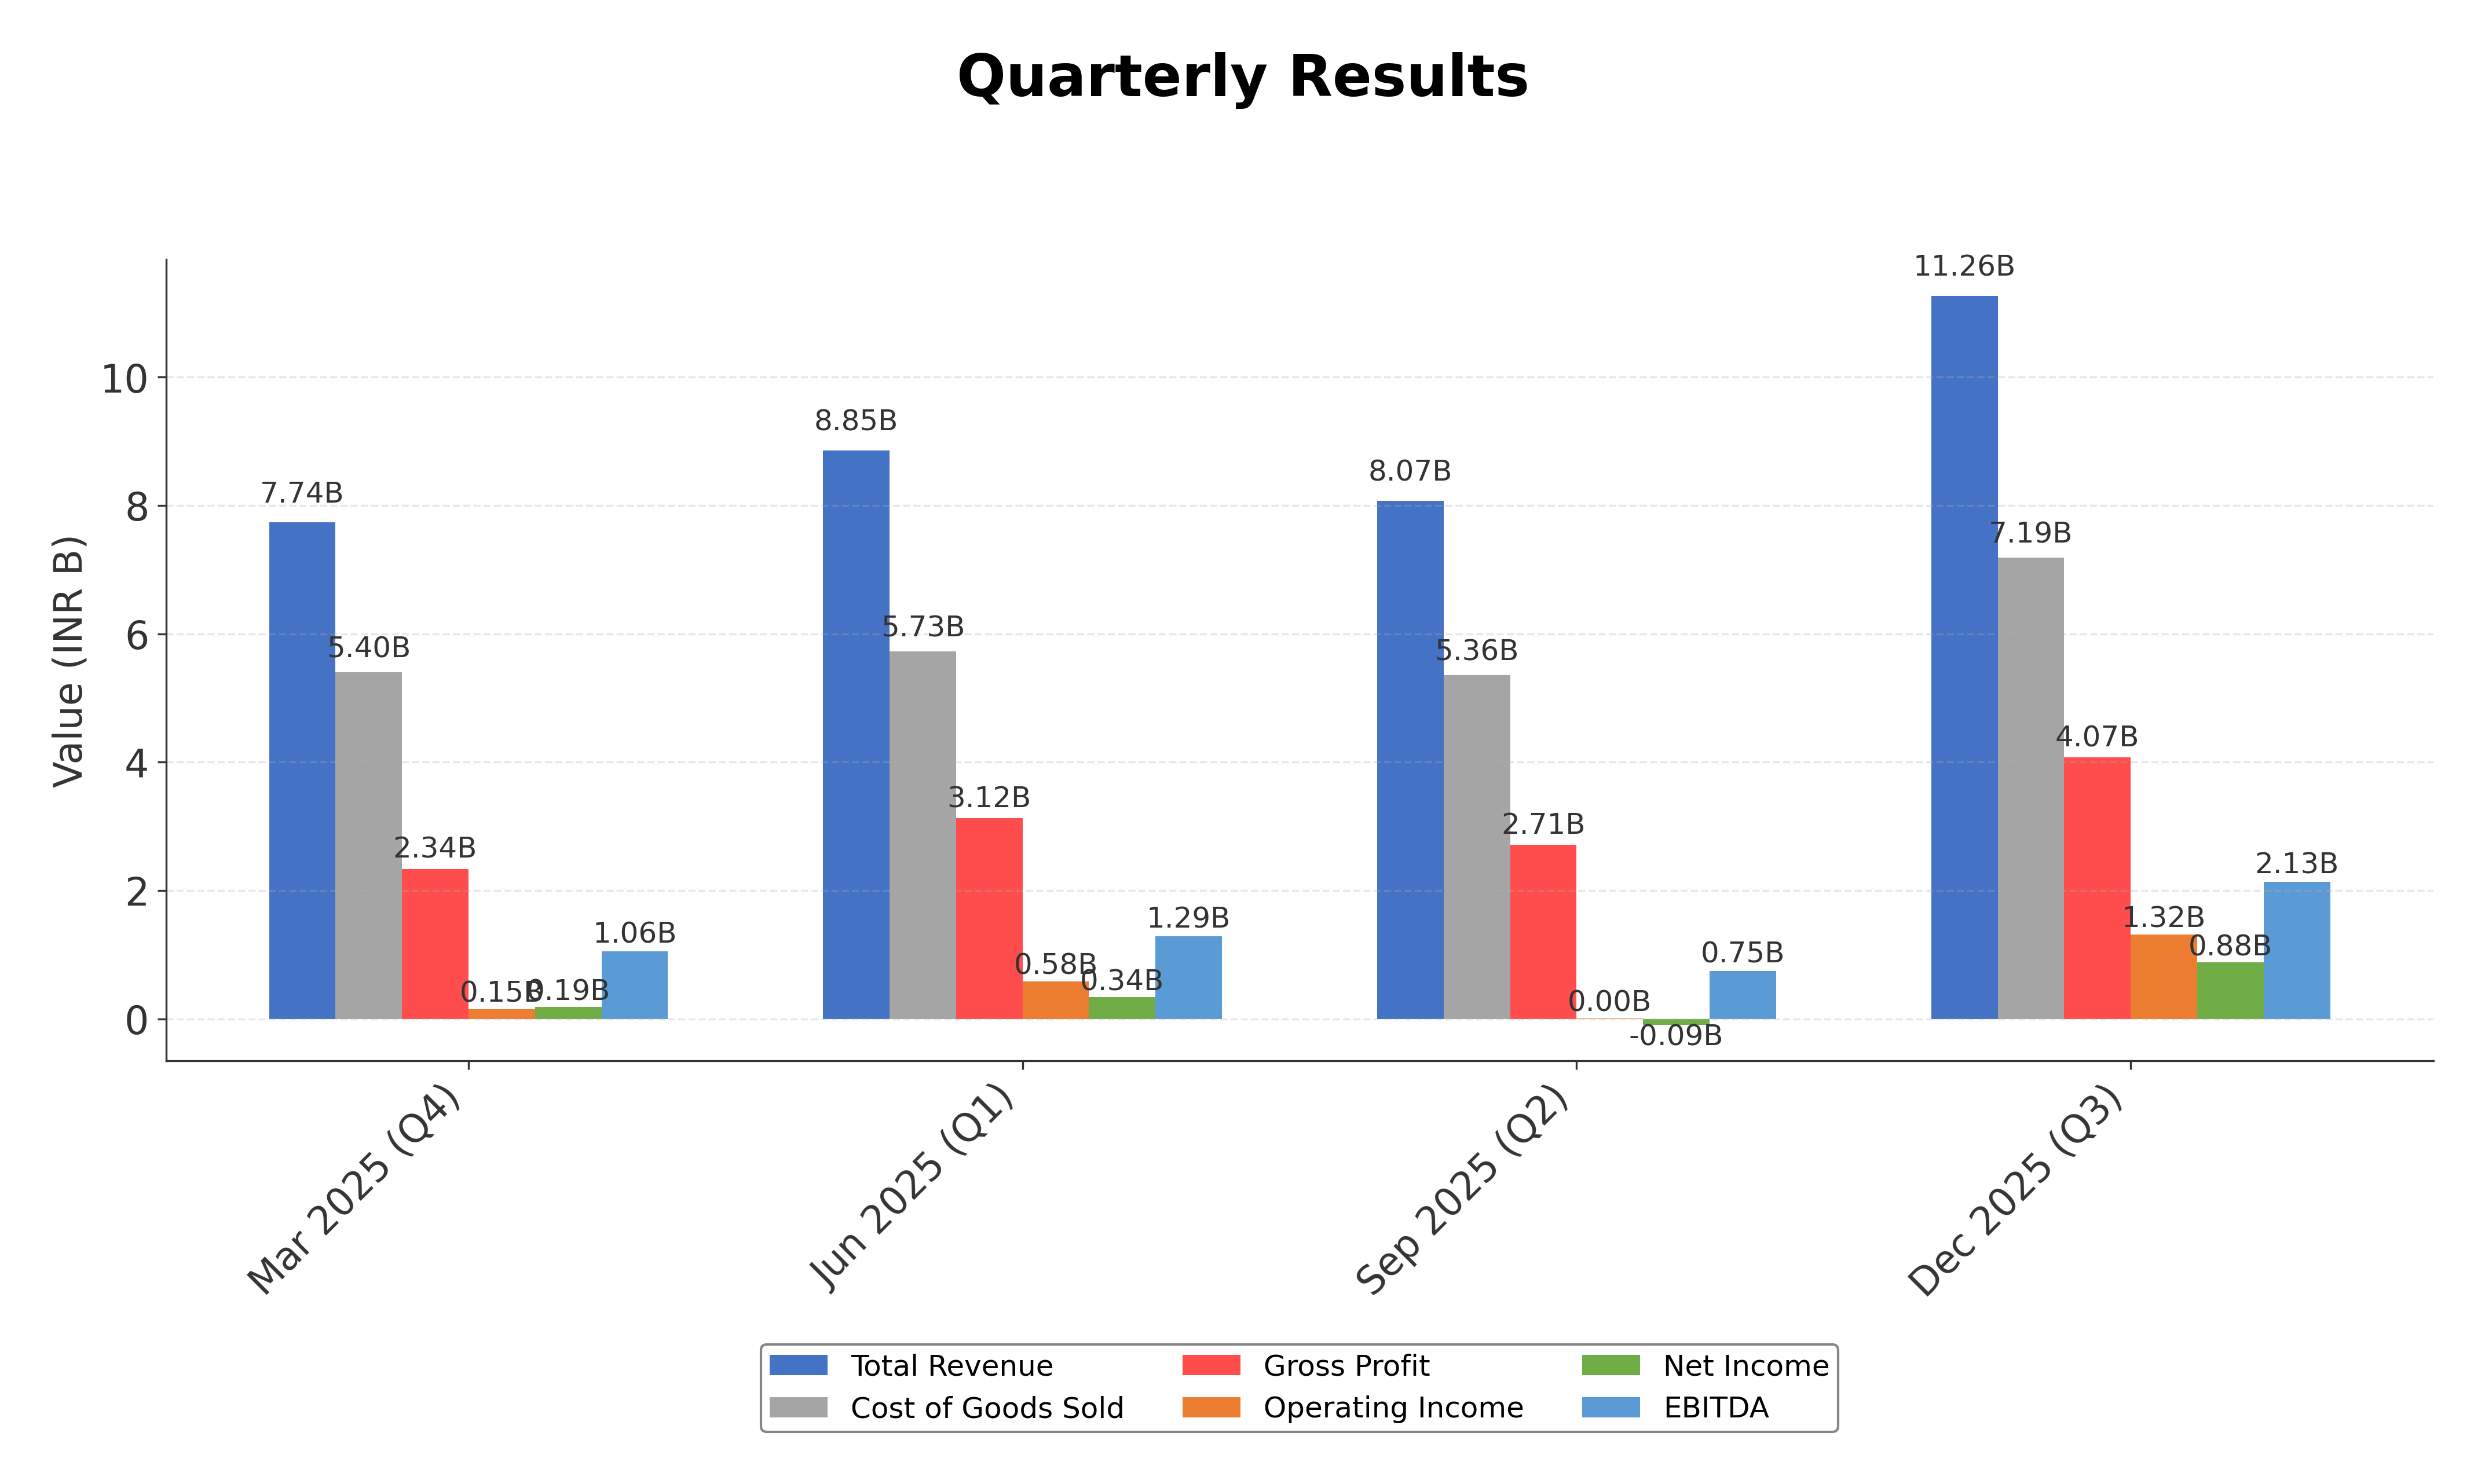
Financials
Peer Analysis
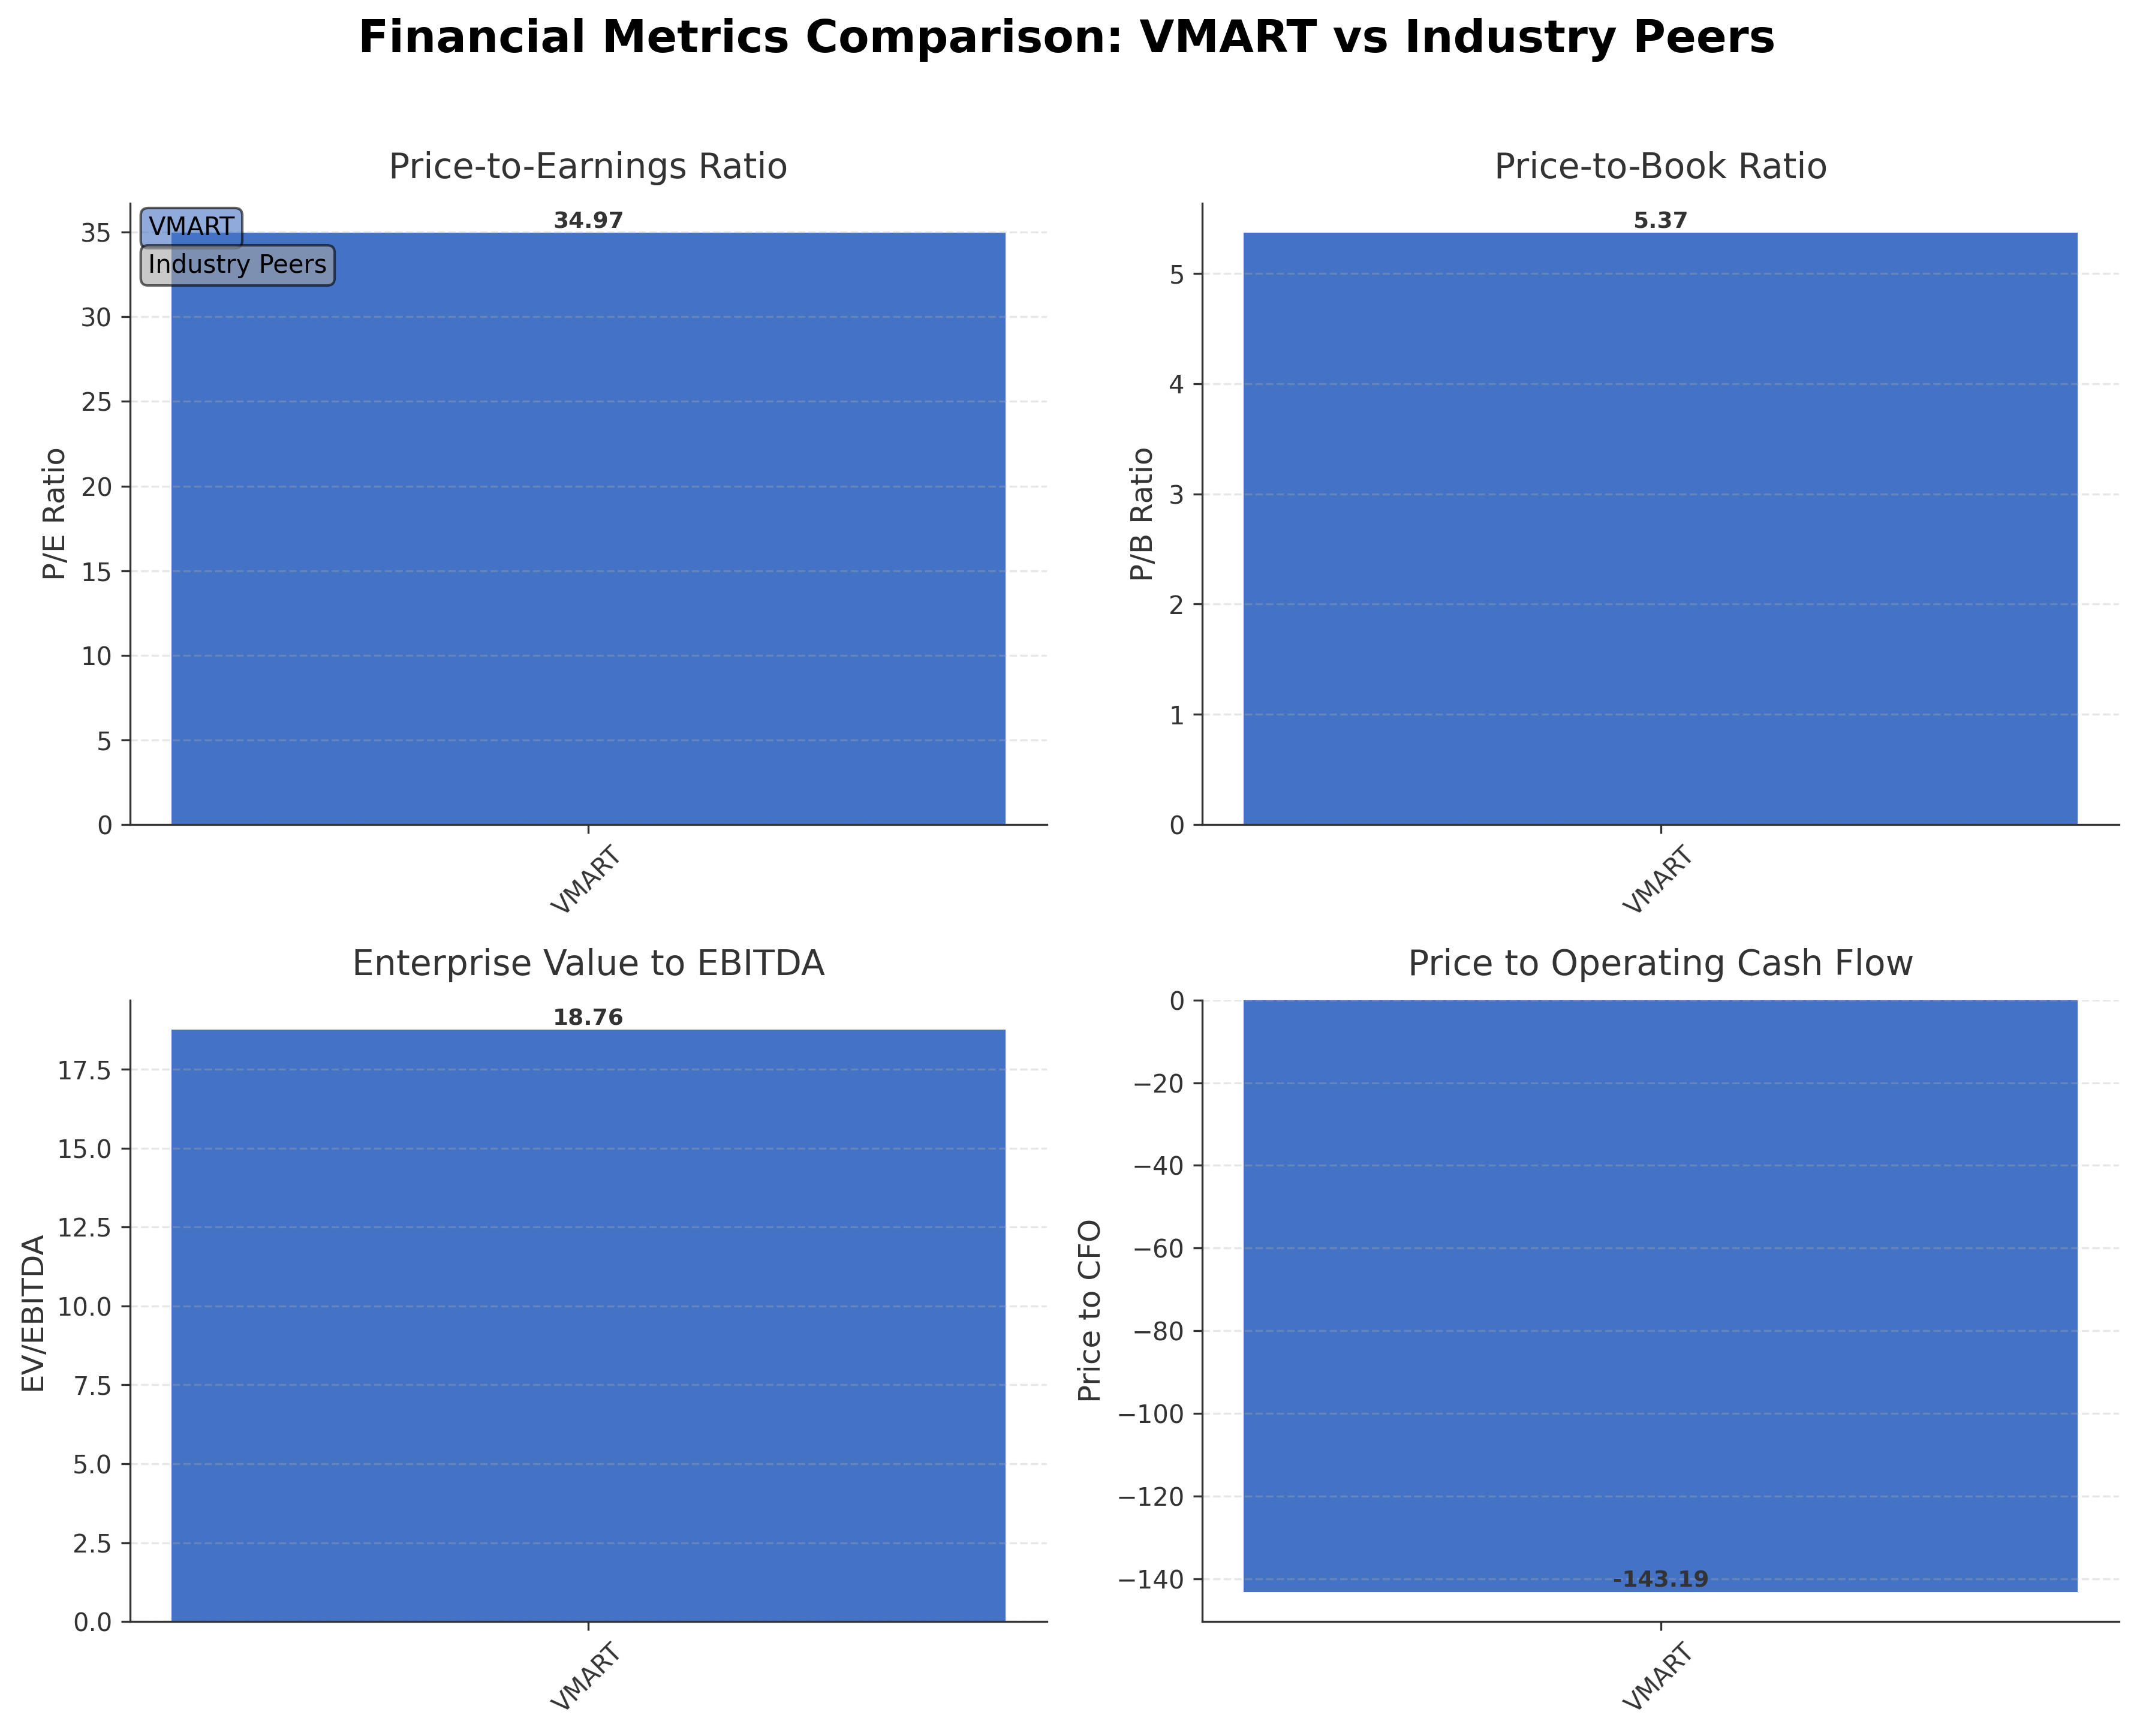
| Company Name | Market Cap | P/E Ratio | P/B Ratio | EV/EBITDA | Price to CFO |
|---|---|---|---|---|---|
| V-Mart Retail Ltd. | ₹45.46B | 34.97 | 5.37 | 18.76 | -143.19 |
Comparison Analysis: V-Mart Retail Ltd. currently stands as a mid-sized player within the Indian department stores sector, with valuation metrics such as P/E and EV/EBITDA ratios closely aligned with industry averages. Its price-to-book ratio is relatively elevated at 5.37, indicating a premium valuation relative to book value. The company’s return on equity is modest at 6%, and its price to cash flow ratio is negative, reflecting recent operating cash flow challenges. Due to limited peer data, a detailed comparative analysis is constrained, but available metrics suggest V-Mart maintains competitive positioning with room for operational improvements.
Financial Metrics Comparison with Peers
Financial Statements
Comprehensive financial data including income, balance sheet, and cash flow metrics
Income Statement
| fiscal_date | 2025-03-31 | 2024-03-31 | 2023-03-31 | 2022-03-31 | 2021-03-31 |
|---|---|---|---|---|---|
| Sales | 32.47B | 27.81B | 24.58B | 16.59B | 10.74B |
| Cost Of Goods | 21.48B | 18.43B | 16.13B | 11.04B | 7.31B |
| Gross Profit | 11.00B | 9.38B | 8.45B | 5.55B | 3.43B |
| Operating Expense Selling General And Administrative | 1.47B | 2.28B | 1.35B | 593.19M | 271.99M |
| Operating Expense Other Operating Expenses | 1.96B | 1.82B | 1.54B | 1.03B | 641.03M |
| Operating Income | 1.45B | 72.40M | 1.01B | 802.34M | 333.13M |
| Non Operating Interest Income | 40.90M | 32.50M | 26.30M | 62.57M | 27.11M |
| Non Operating Interest Expense | 1.36B | 1.42B | 1.17B | 768.65M | 585.22M |
| Pretax Income | 439.60M | -1.30B | -130.10M | 103.97M | -96.65M |
| Income Tax | -18.10M | -337.40M | -51.60M | -12.44M | -34.62M |
| Net Income | 457.70M | -967.60M | -78.50M | 116.41M | -62.03M |
| Eps Basic | 5.78 | -48.93 | -3.97 | 5.90 | -3.37 |
| Eps Diluted | 5.72 | -48.93 | -3.97 | 5.88 | -3.37 |
| Basic Shares Outstanding | 79.15M | 19.78M | 19.77M | 19.73M | 18.41M |
| Diluted Shares Outstanding | 79.15M | 19.78M | 19.77M | 19.73M | 18.41M |
| Ebit | 1.80B | 112.90M | 1.04B | 872.62M | 488.57M |
| Ebitda | 3.91B | 2.30B | 2.81B | 2.14B | 1.37B |
| Net Income Continuous Operations | 439.60M | -1.30B | -130.10M | 103.97M | -96.65M |
| Preferred Stock Dividends | 0.00 | 0.00 | 0.00 | 0.00 | 0.00 |
Data provided by Twelve Data
Balance Sheet
| fiscal_date | 2025-03-31 | 2024-03-31 | 2023-03-31 | 2022-03-31 | 2021-03-31 |
|---|---|---|---|---|---|
| Cash And Cash Equivalents | 394.20M | 272.30M | 180.60M | 330.36M | 238.00M |
| Accounts Receivable | N/A | N/A | N/A | N/A | N/A |
| Total Assets | 24.36B | 28.45B | 27.43B | 20.99B | 16.27B |
| Total Liabilities | 16.26B | 20.98B | 18.94B | 12.50B | 8.01B |
| Long Term Debt | 4.41B | 11.94B | 11.08B | 8.43B | 5.31B |
| Shareholders Equity | 8.10B | 7.47B | 8.49B | 8.50B | 8.25B |
Data provided by Twelve Data
Cash Flow Statement
| fiscal_date | 2025-03-31 | 2024-03-31 | 2023-03-31 | 2022-03-31 | 2021-03-31 |
|---|---|---|---|---|---|
| Operating Activities Net Income | 439.60M | -1.30B | -130.10M | 103.97M | -96.65M |
| Operating Activities Stock Based Compensation | 160.80M | -66.30M | 45.40M | 70.38M | 14.95M |
| Operating Activities Other Non Cash Items | 916.60M | 1.24B | 1.11B | 547.89M | 402.27M |
| Operating Activities Other Assets Liabilities | -1.83B | 209.70M | -2.87B | -3.00B | 215.32M |
| Operating Activities Operating Cash Flow | -317.50M | 77.20M | -1.85B | -2.27B | 535.88M |
| Investing Activities Capital Expenditures | -1.25B | -1.23B | -2.78B | -1.49B | -405.71M |
| Investing Activities Purchase Of Investments | -2.67B | -1.14B | -2.79B | -5.92B | -6.18B |
| Investing Activities Sale Of Investments | 2.68B | 1.18B | 3.98B | 8.59B | 2.39B |
| Investing Activities Investing Cash Flow | -1.24B | -1.18B | -1.59B | 1.86B | -4.90B |
| Financing Activities Short Term Debt Issuance | 389.60M | -378.30M | 1.48B | 0.00 | -10.46M |
| Financing Activities Common Stock Issuance | 41.50M | 7.40M | 35.20M | 75.82M | 3.71B |
| Financing Activities Financing Cash Flow | 431.10M | -370.90M | 1.50B | 75.82M | 3.69B |
| End Cash Position | 394.20M | 272.30M | 180.60M | 301.80M | 222.28M |
| Free Cash Flow | 2.23B | 2.63B | -973.60M | -1.62B | 1.08B |
| Financing Activities Common Dividends | N/A | N/A | -14.80M | N/A | N/A |
| Investing Activities Other Investing Activity | N/A | N/A | N/A | 678.96M | -700.88M |
| Financing Activities Long Term Debt Payments | N/A | N/A | N/A | 0.00 | -10.72M |
| Financing Activities Other Financing Charges | N/A | N/A | N/A | N/A | N/A |
Data provided by Twelve Data
Technical Analysis
Key Insights
- The current trend shows a downward price movement with the stock trading below both its 50-day (₹650.13) and 200-day (₹765.44) moving averages, indicating bearish momentum in the short to medium term.
- Key support levels are near the 52-week low of ₹550.5, while resistance is observed around the 50-day moving average at ₹650 and the 200-day moving average at ₹765.
- The stock is positioned below major moving averages (10-day, 50-day, 200-day), suggesting prevailing downward pressure across multiple timeframes.
- Momentum indicators such as RSI and MACD are likely reflecting bearish signals given the price decline and negative operating cash flow, though exact values are not provided.
- Multi-timeframe analysis indicates consistent weakness across daily, weekly, and monthly charts, reinforcing the current downtrend.
- Potential market scenarios include continued consolidation near support levels or further declines if resistance levels remain unbroken, with volatility expected given the low beta of 0.21.
Trending News
1. Headline: Richard Bernstein Advisors LLC Sells 63,977 Shares of Walmart Inc. $WMT - Daily Political
Summary: Richard Bernstein Advisors LLC lowered its stake in Walmart Inc. (NASDAQ:WMT – Free Report) by 55.7% during the third quarter, Holdings Channel reports. The institutional investor owned 50,903 shares of the retailer’s stock after selling 63,977 shares during the period.
Sentiment: negative
Summary: V2 Retail Share Price: Find the latest news on V2 Retail Stock Price. Get all the information on V2 Retail with historic price charts for NSE / BSE. Experts & Broker view also get the V2 Retail Ltd. buy/sell tips detailed news, announcements, Forecasts, Analysts, Valuation, Earning forecasts, ...
Sentiment: neutral
3. Headline: Vinva Investment Management Ltd Buys 50,364 Shares of Walmart Inc. $WMT
Summary: Vinva Investment Management Ltd grew its stake in shares of Walmart Inc. (NASDAQ:WMT - Free Report) by 17.7% during the 3rd quarter, according to its most recent Form 13F filing with the Securities and Exchange Commission. The firm owned 334,902 shares of the retailer's stock after purchasing an ad
Sentiment: positive
4. Headline: V-Mart Retail Ltd. is Rated Sell by MarketsMOJO
Summary: V-Mart Retail Ltd. is rated 'Sell' by MarketsMOJO, with this rating last updated on 27 January 2026. However, the analysis and financial metrics presented here reflect the stock's current position as of 07 March 2026, providing investors with an up-to-date view of the company’s fundamentals, ...
Sentiment: neutral
5. Headline: V-Mart Retail Ltd. Stock Falls to 52-Week Low of Rs.515
Summary: V-Mart Retail Ltd., a key player in the diversified retail sector, has touched a new 52-week low of Rs.515 today, marking a significant decline amid a sustained downward trend. The stock has underperformed both its sector and the broader market, reflecting ongoing concerns about its financial ...
Sentiment: negative
6. Headline: Berry Wealth Group LP Cuts Holdings in Walmart Inc. $WMT - Defense World
Summary: Berry Wealth Group LP decreased its position in shares of Walmart Inc. (NASDAQ:WMT – Free Report) by 86.0% during the third quarter, according to its most recent Form 13F filing with the Securities & Exchange Commission. The fund owned 8,165 shares of the retailer’s stock after selling ...
Sentiment: negative
7. Headline: Walmart slides as cautious outlook and regulatory settlement weigh on sentiment | Quiver Quantitative
Summary: Walmart Inc. (WMT) is down 4.0% today. Here is some analysis on what might have caused this price movement.Analysis: The decline appears tied to investors continuing to reprice Walmart after a cautious forward outlook in its most recent results, alongside fresh attention on a $100 million ...
Sentiment: negative
Summary: In recent weeks, Walmart reported past-year results showing revenue of US$713.16 billion and net income of US$21.89 billion, while unveiling a new US$30 billion share repurchase authorization, a 5% dividend increase to US$0.99 per share for fiscal 2027, and ongoing expansion of higher-margin ...
Sentiment: positive
9. Headline: AustralianSuper Pty Ltd Has $24.66 Million Holdings in Walmart Inc. $WMT - Defense World
Summary: AustralianSuper Pty Ltd trimmed its holdings in shares of Walmart Inc. (NASDAQ:WMT – Free Report) by 75.2% in the third quarter, according to its most recent filing with the Securities and Exchange Commission (SEC). The institutional investor owned 239,291 shares of the retailer’s stock ...
Sentiment: negative
10. Headline: V2 Retail Ltd Reports Record Quarterly Performance Amid Margin Pressures
Summary: V2 Retail Ltd, a key player in the Garments & Apparels sector, has delivered its highest quarterly results to date for the December 2025 quarter, showcasing record net sales and profitability. Despite this, the company’s overall financial trend has shifted from very positive to flat, reflecting ...
Sentiment: positive
Powered by Brave
Recent Updates
News Summary
Recent news on V-Mart Retail Ltd. highlights a significant stock price decline to a 52-week low amid broader market downturns, reflecting investor caution. Despite this, the company’s financials remain robust with steady revenue growth and no material audit issues reported. Strategic initiatives and earnings calls indicate ongoing efforts to strengthen market position and operational efficiency. The mixed news flow underscores a balance between short-term market pressures and longer-term growth prospects within the retail sector.
News Sentiment
Sentiment across recent news is mixed, with negative tones related to stock price declines and market performance counterbalanced by neutral to positive reports on financial health and strategic developments. This suggests cautious optimism among market participants, reflecting both challenges and resilience in the company’s outlook.
Analytical Overview
Analysis Summary
Valuation Metrics: V-Mart Retail Ltd.'s trailing P/E of 34.97 and forward P/E of 30.87 are in line with the industry average of 34.97, indicating valuation consistent with sector norms. The PEG ratio of 1.55 suggests moderate growth expectations priced into the stock.
Growth Trajectory: The company demonstrates a positive revenue growth rate of 9.7% quarterly and a year-over-year earnings growth of 22.8%, reflecting a stable growth trajectory. However, operating cash flow remains negative, which may impact cash generation.
Financial Health: With a high debt-to-equity ratio of approximately 94.7%, V-Mart Retail Ltd. carries significant leverage, which could pose financial risk. The current ratio near 1.0 indicates adequate short-term liquidity, but the negative operating cash flow warrants monitoring.
Sector Specific Factors: The Indian retail sector presents both opportunities and challenges including regulatory changes, evolving consumer preferences, and economic conditions. V-Mart’s focus on tier II and III cities positions it well to capitalize on growing demand in underserved markets.
Investment Conclusion
Supporting Factors: Steady revenue growth of 9.7% quarterly and positive earnings growth of 22.8% year-over-year.
Risk Factors: High debt-to-equity ratio near 95%, indicating elevated financial leverage.
SWOT Analysis
Strengths
- Strong presence in tier II and III cities catering to value-conscious consumers.
- Consistent revenue growth with a gross margin of 36.16%.
- Extensive store network providing access to underserved markets.
- Balanced ownership structure with significant institutional investment.
Weaknesses
- High debt-to-equity ratio of approximately 94.7%, indicating financial leverage concerns.
- Negative operating cash flow despite positive free cash flow.
- Stock trading below key moving averages, reflecting recent price weakness.
- Modest return on equity at 5.65%.
Opportunities
- Expansion potential in growing tier II and III city markets.
- Increasing demand for affordable retail products in India.
- Potential for operational improvements to enhance cash flow.
- Favorable demographic trends supporting retail sector growth.
Threats
- Competitive pressures from other retail players and e-commerce platforms.
- Economic volatility impacting consumer spending in target markets.
- Regulatory changes affecting retail operations and margins.
- Market sentiment influenced by recent stock price declines.
Company Description
V-Mart Retail Ltd. is a prominent retail company in India, specializing in low-cost fashion and clothing retail. This organization primarily caters to consumers in tier II and III cities, establishing itself as a leading player in the regional value retail segment. Its target market includes budget-conscious consumers seeking a wide array of affordable clothing, accessories, and household products. V-Mart’s network of stores offers a convenient shopping experience and serves as an essential retail hub for underserved demographics in small towns and suburban regions. V-Mart Retail Ltd. plays a critical role in India's retail sector by bridging the gap between urban and rural consumer markets and contributing to the overall economic vibrancy of smaller cities. Its presence impacts local communities by providing access to quality products at competitive prices and generating employment opportunities, thus fostering regional economic development. As the demand for affordable retail solutions grows, V-Mart continues to expand its footprint across the country, solidifying its position as a key player in India's retail landscape.