


V-Guard Industries Ltd (VGUARD)
Stock Analysis Report
Stock Journey
Key Positives and Key Risks
Pros
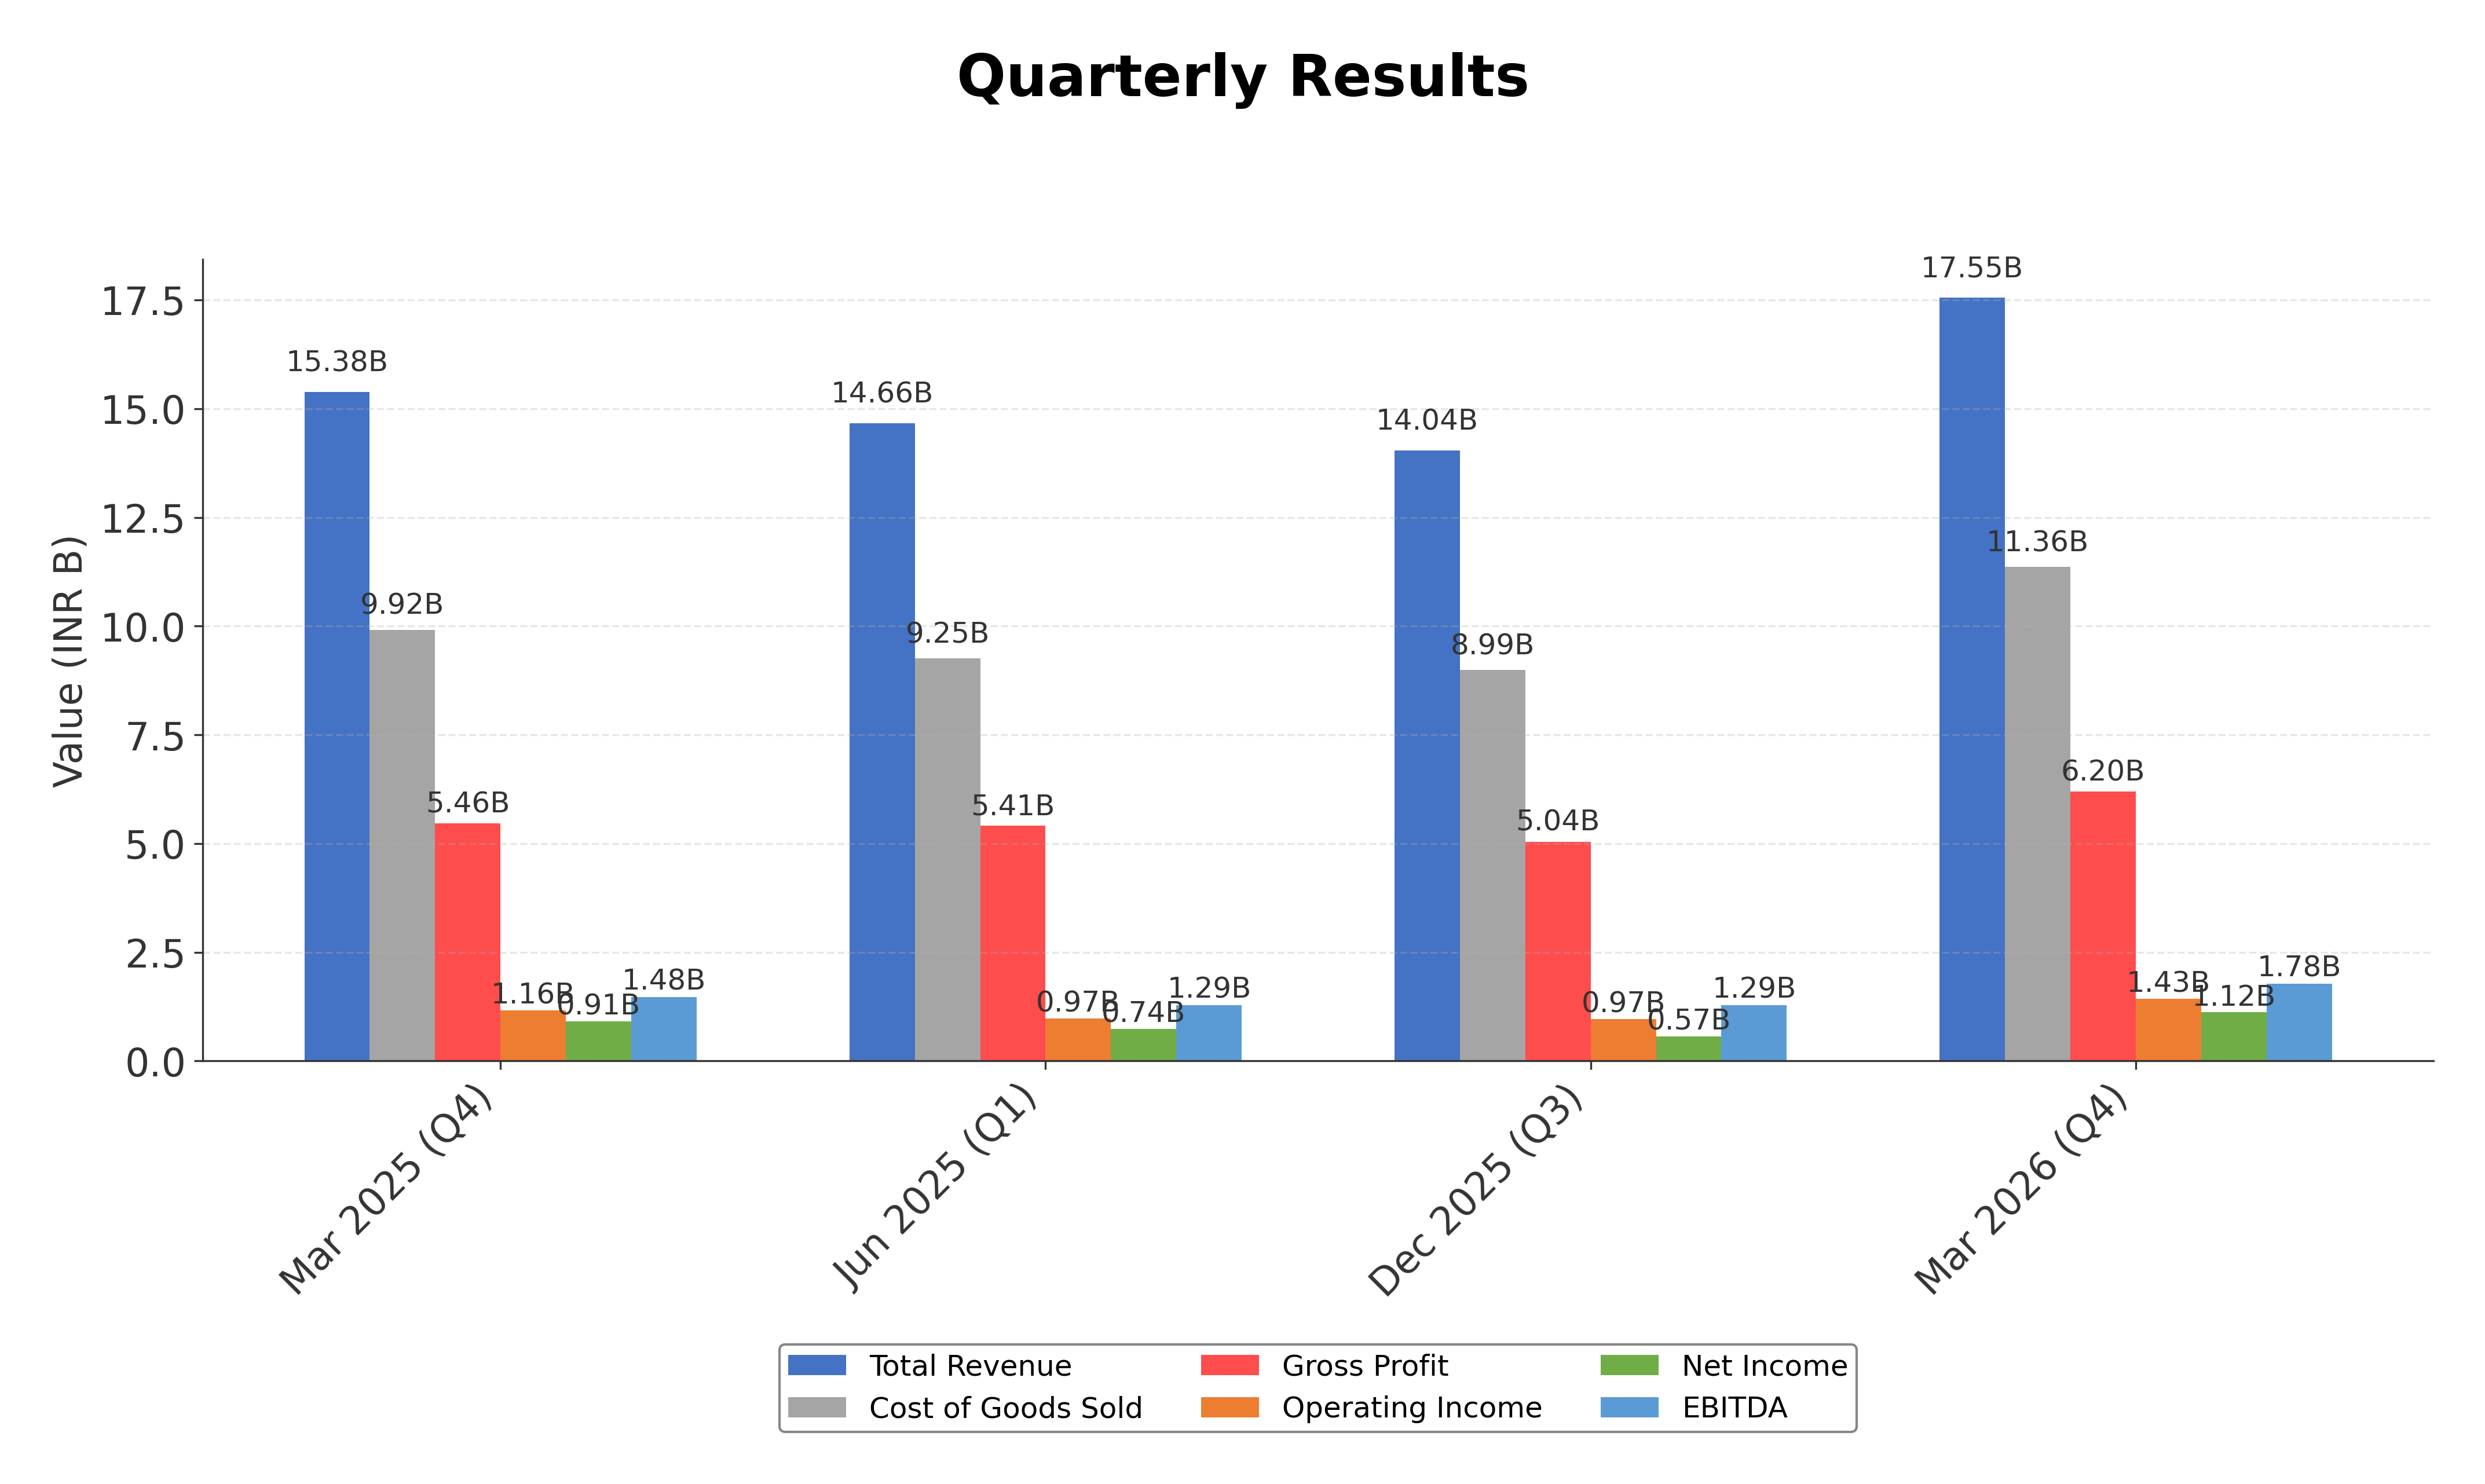
- Revenue growth of 14.1% in Q4 FY26 demonstrates strong top-line momentum.
- Low debt-to-equity ratio of 0.07 indicates a robust financial position with limited leverage risk.
- Operating cash flow of ₹4.59 billion supports liquidity and operational flexibility.
Cons
- Trailing P/E of 42.74 and price-to-book ratio of 5.99 reflect a premium valuation relative to some peers.
- Net profit margin of 5.17% is moderate, suggesting room for margin improvement.
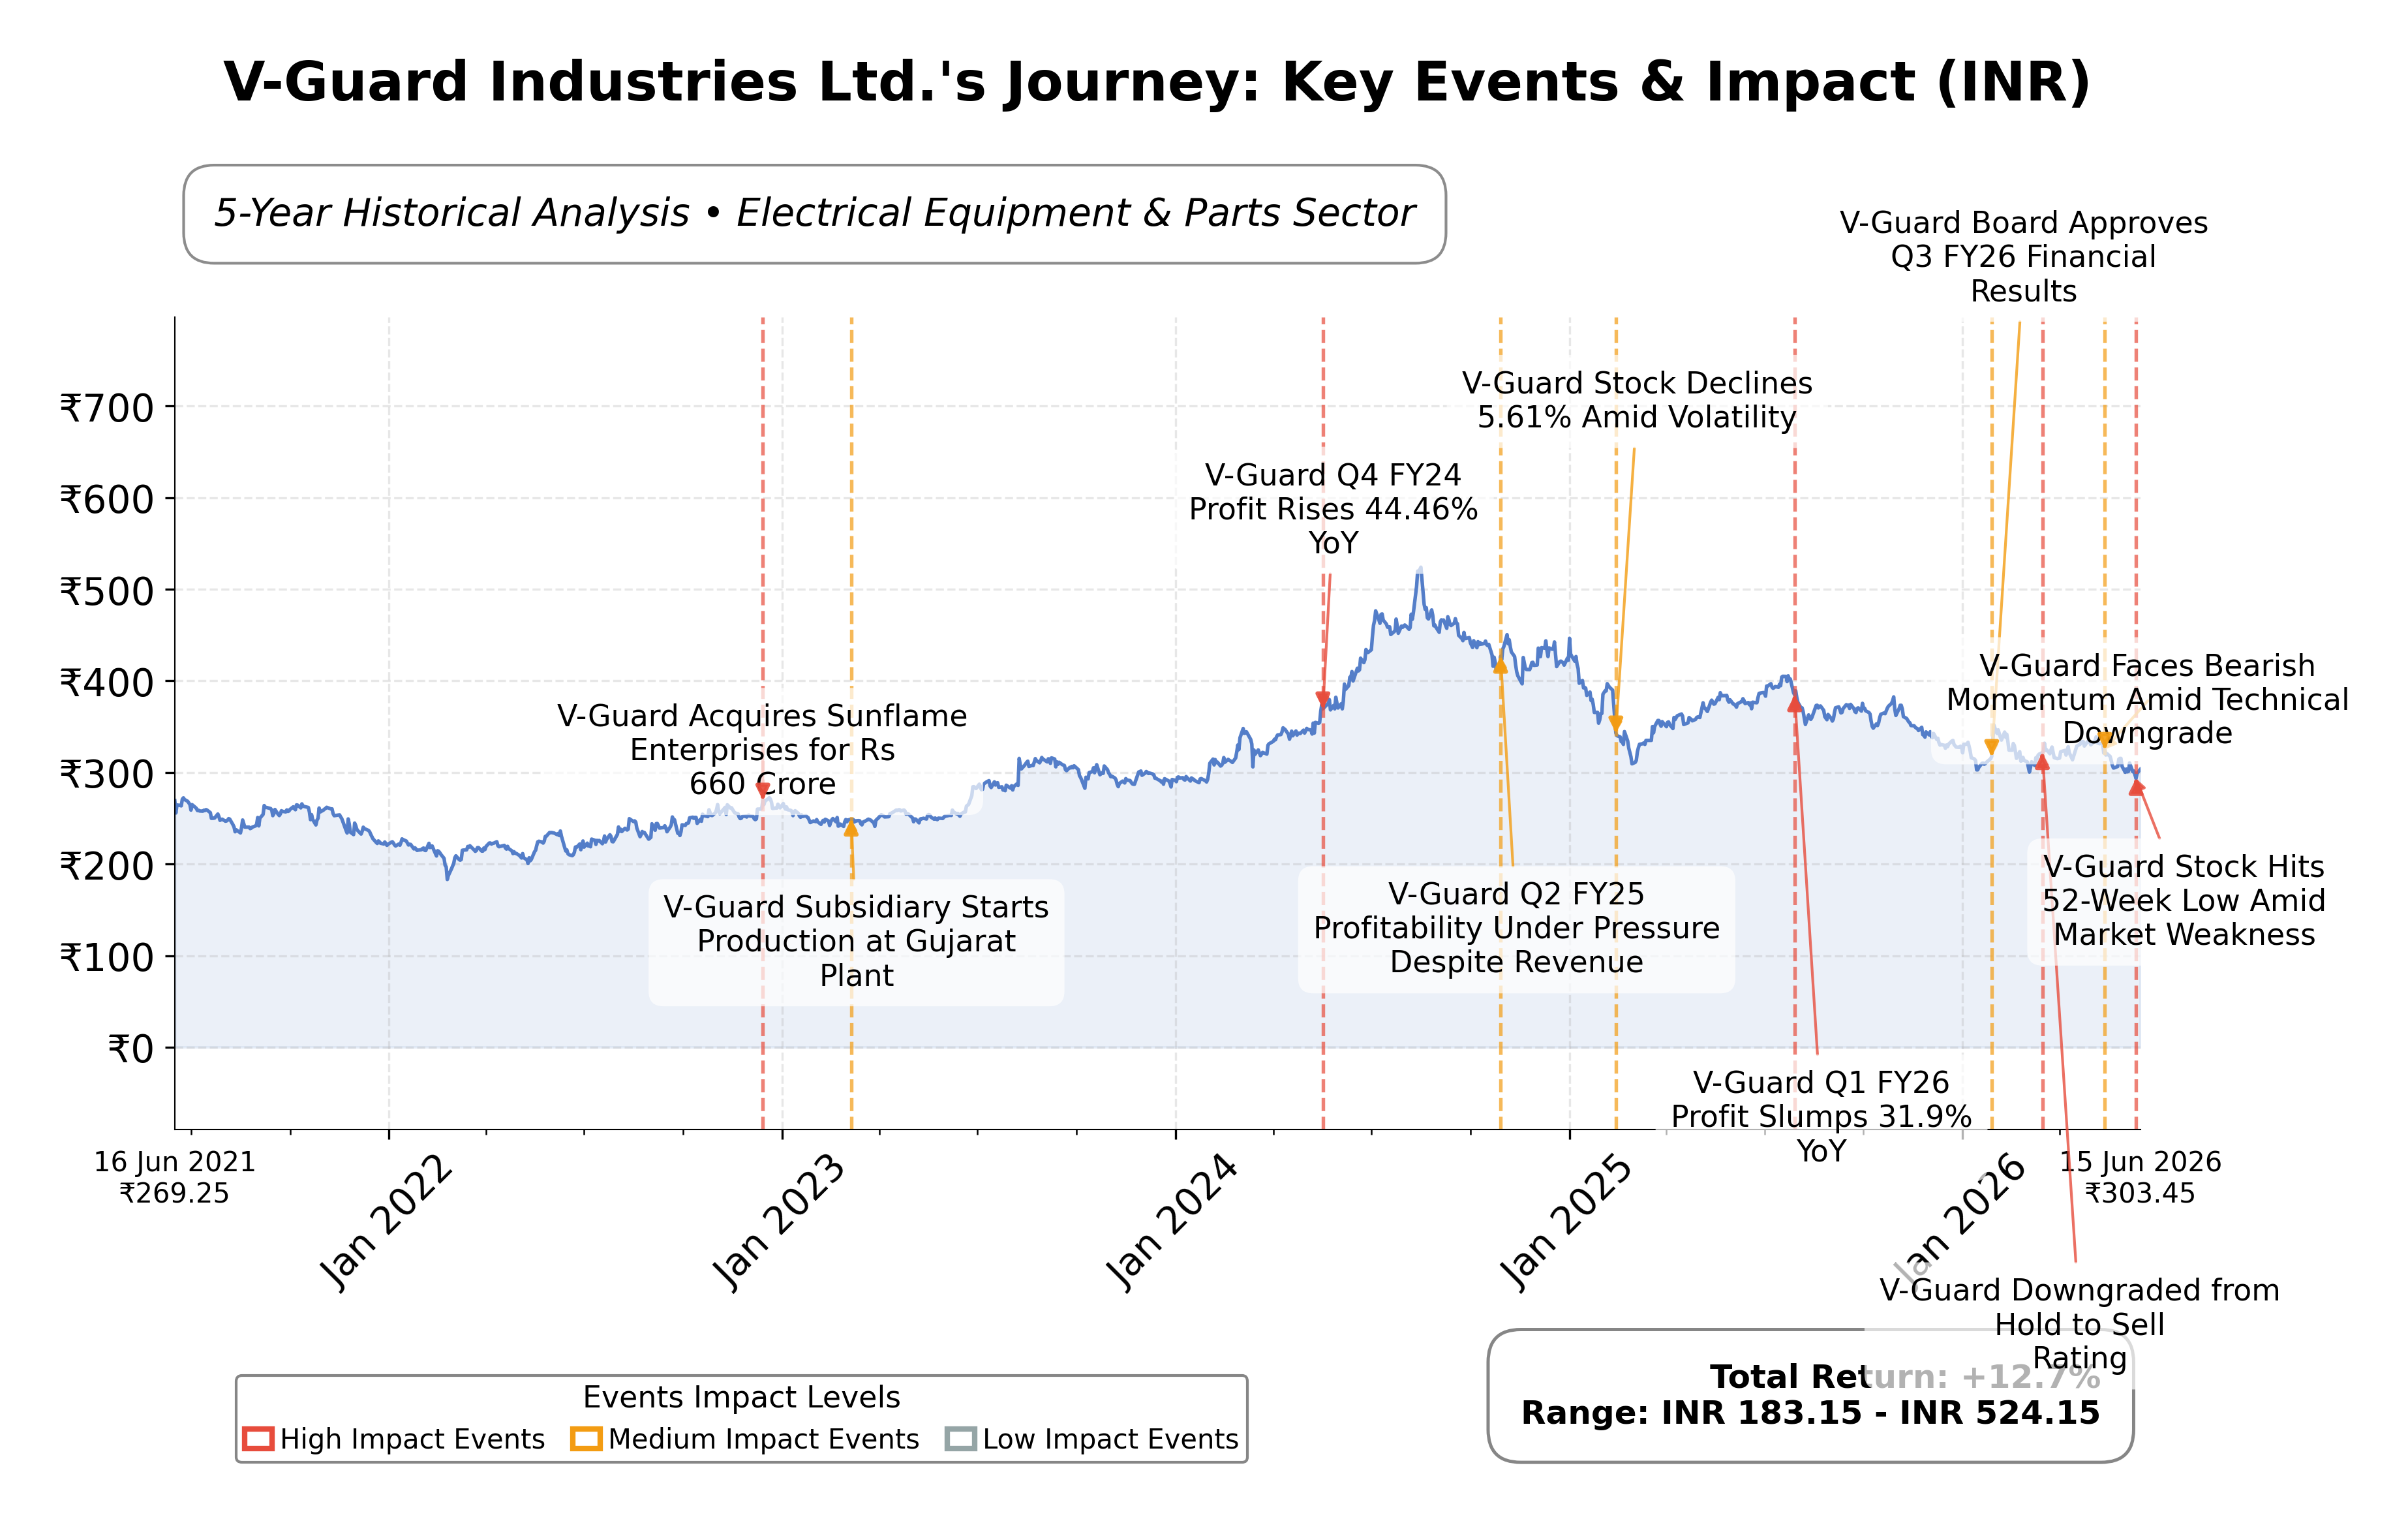
- Recent stock price decline to 52-week low near ₹290 signals market concerns and downward momentum.
Disclosure: This information is for general awareness and does not constitute investment advice
Report Summary
V-Guard Industries Ltd. is a leading Indian company specializing in electrical and electronics products, operating primarily in the Industrials sector on the NSE exchange. The company manufactures and distributes a broad portfolio including voltage stabilizers, inverters, pumps, water heaters, wiring cables, and fans. Its market positioning is strong in household and industrial electrical solutions, supported by an extensive distribution network and a focus on innovation. V-Guard serves a diverse customer base ranging from individual consumers to businesses, reinforcing its role in India’s infrastructure and energy efficiency sectors.
Financially, V-Guard reported trailing twelve months (TTM) revenue of approximately ₹59.66 billion with a gross margin of 35.3%, operating margin of 8.1%, and a net profit margin of 5.17%. The company’s return on equity (ROE) stands at 13.79%, return on assets (ROA) at 7.43%, and return on invested capital (ROIC) at 16.1% for FY26, indicating solid profitability and efficient capital utilization. Quarterly revenue growth was 14.1%, and net income growth year-over-year was 23%, reflecting robust operational performance despite a slight full-year PAT decline of 1.7% due to exceptional charges.
Valuation metrics show a trailing P/E ratio of 42.74 and a forward P/E of 27.46, with a price-to-book ratio near 6.0 and an EV/EBITDA multiple of 24.73. The market capitalization is approximately ₹130.67 billion, with the stock trading at ₹305.75, closer to its 52-week low of ₹290 than the high of ₹409.75. The PEG ratio of 0.50 suggests growth expectations relative to earnings. These valuation figures position the stock at a premium relative to some peers, reflecting investor confidence balanced against growth prospects.
Key strengths include strong cash flow generation with operating cash flow of ₹4.59 billion and free cash flow of ₹2.30 billion, a low debt-to-equity ratio of 0.07, and a diversified product portfolio with ongoing integration of Sunflame Enterprises. Risks involve regulatory challenges such as new labor codes impacting profitability, competitive pressures in the electrical equipment industry, and macroeconomic uncertainties including commodity inflation and geopolitical tensions in West Asia. Recent strategic actions include the approved merger with Sunflame Enterprises and a recommended final dividend of ₹1.50 per share for FY26.
Technically, the stock is trading below its 50-day and 200-day moving averages, with a 52-week low recently recorded, indicating downward momentum. Momentum indicators suggest cautious price action, while multi-timeframe analysis reveals consolidation phases. The current environment suggests a watchful stance as market participants assess demand recovery and inflation trends. Overall, the data reflects a company with solid fundamentals navigating near-term challenges and poised for potential growth, warranting close monitoring of operational and market developments.
Company and Industry Overview
Company Basics
Price Performance
Company Size
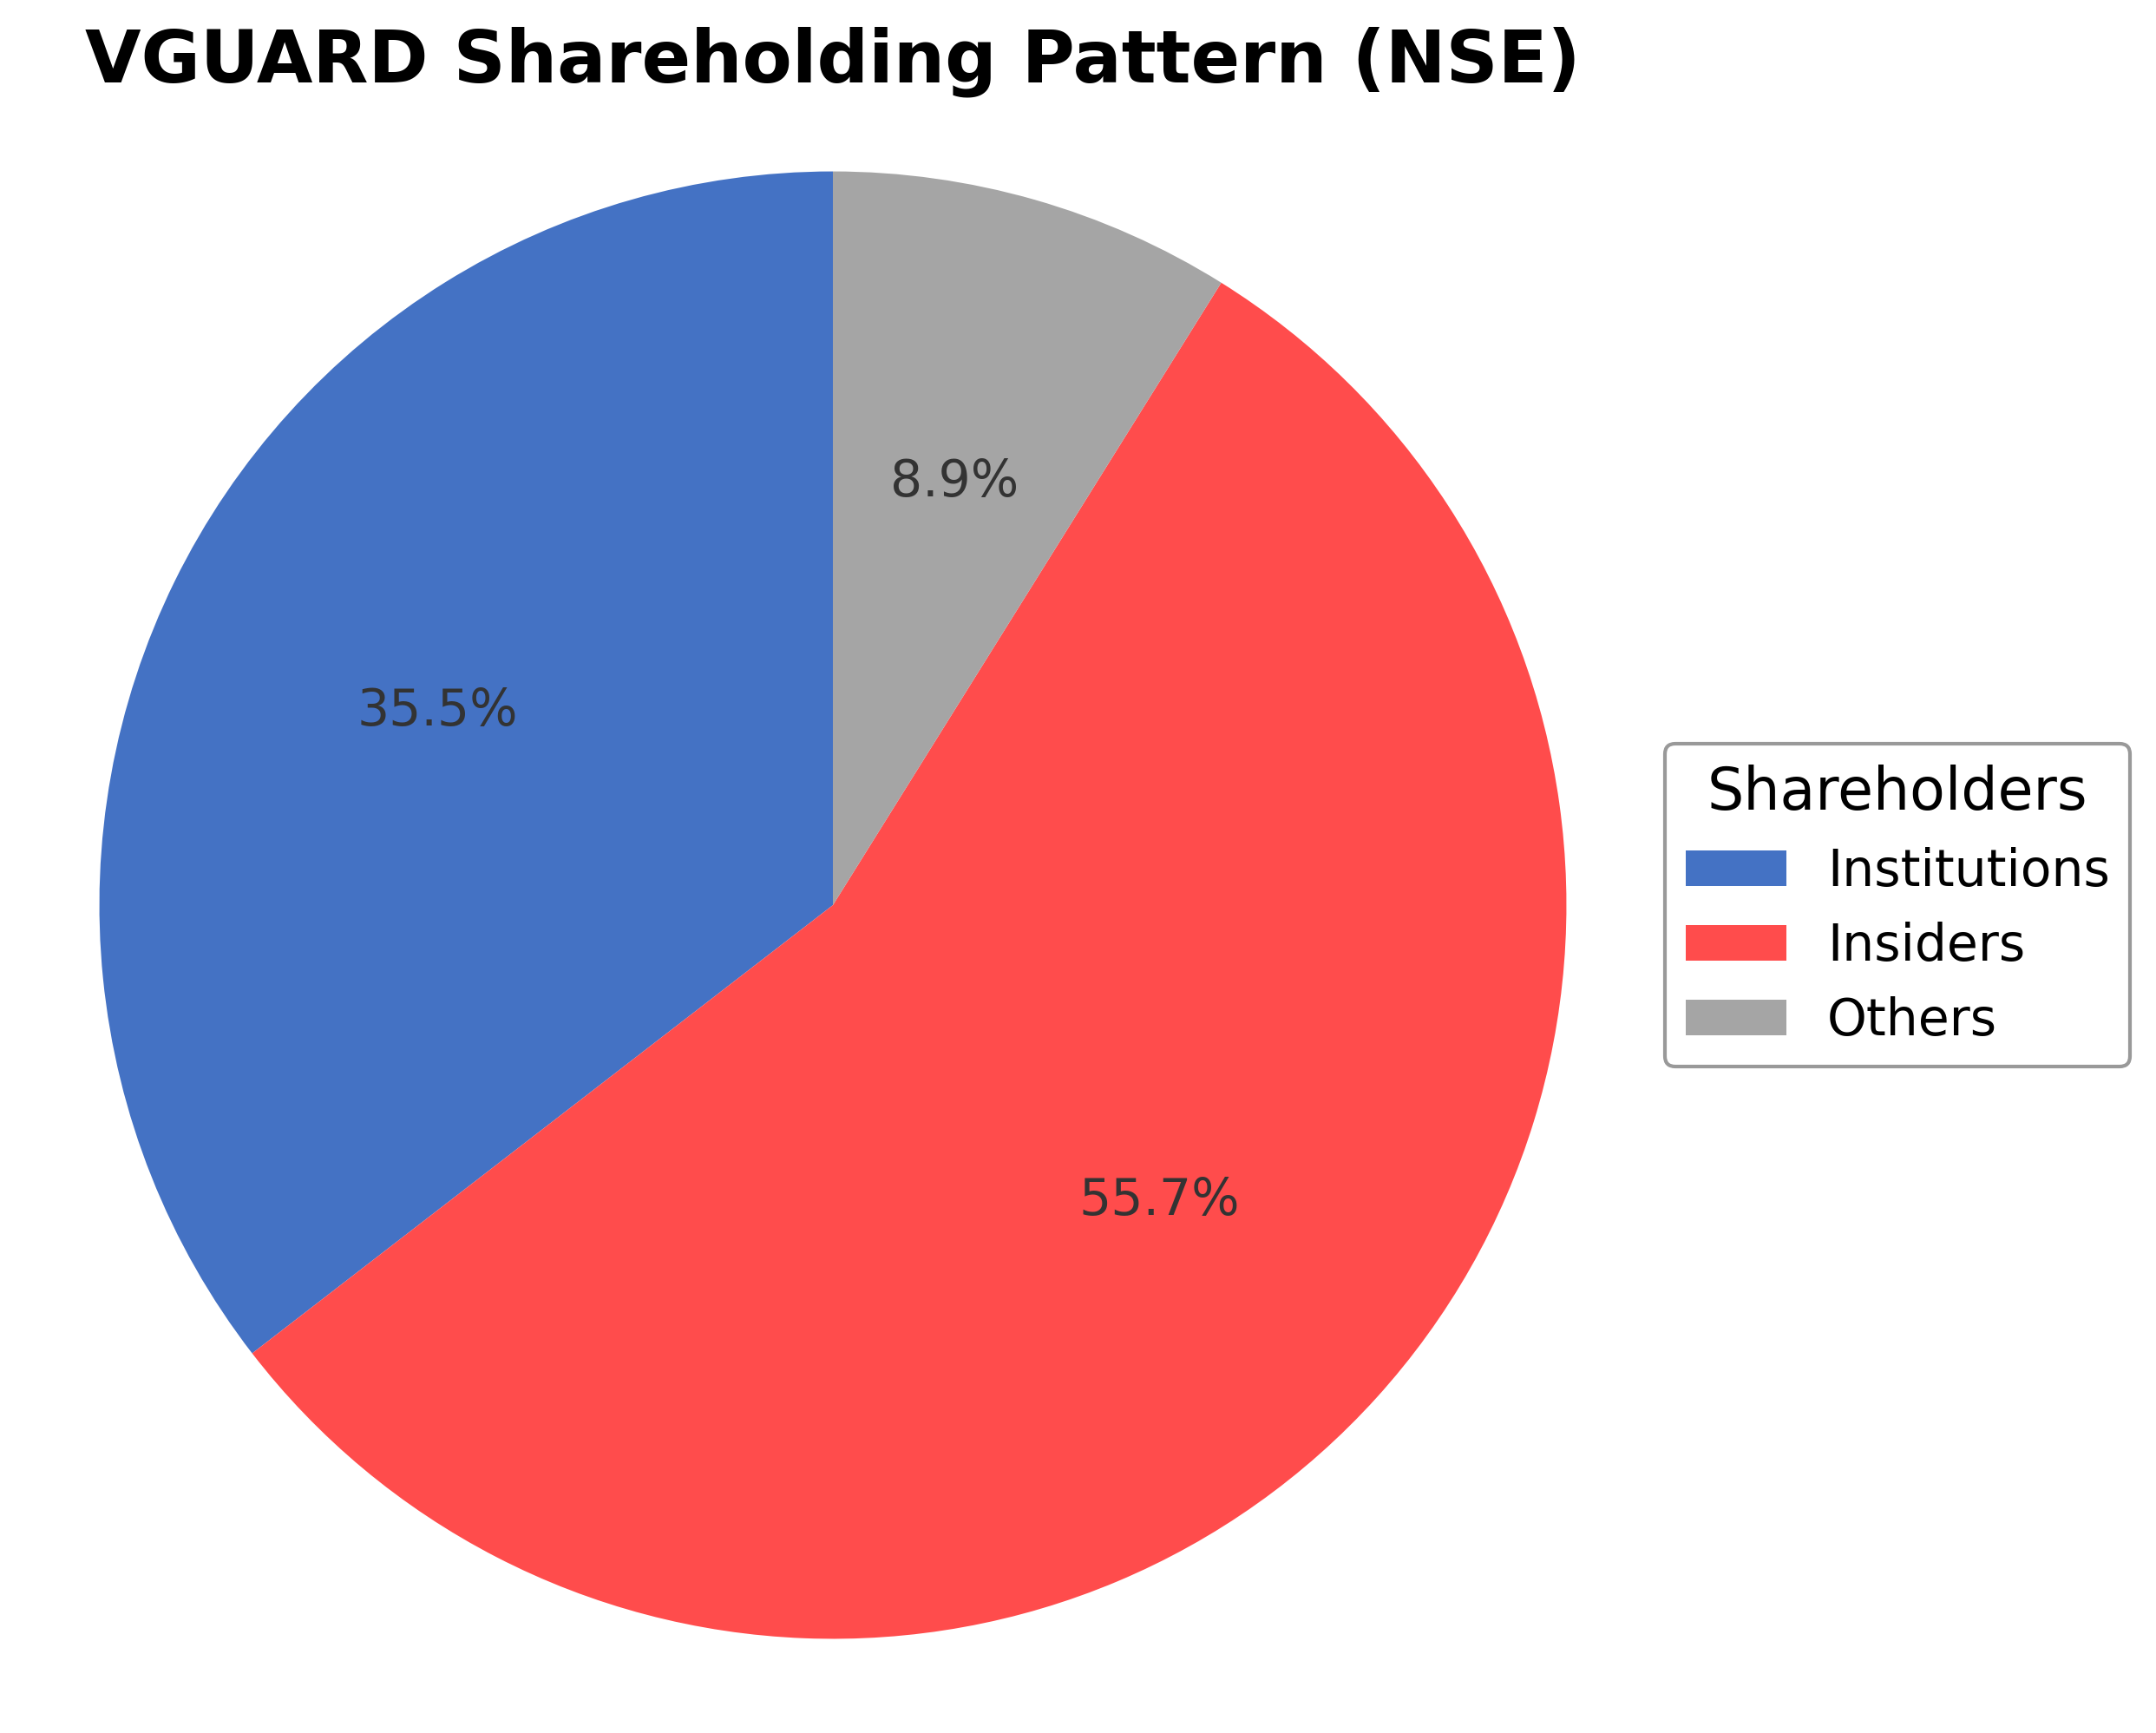
Shareholding Pattern
Sector and Industry Analysis
The household electrical products sector in India encompasses a broad range of items including voltage stabilizers, fans, water heaters, pumps, wires, and switchgear. This sector has witnessed robust growth, with companies like V-Guard Industries Ltd reporting a revenue CAGR of 13% over the past decade. The market is sizable, driven by rising urbanization, increasing electrification, and growing consumer demand for reliable electrical solutions. Key players include V-Guard, along with other established manufacturers that cater to both retail and project channels.
Industry trends highlight a focus on power-related products that address practical issues such as voltage fluctuations and water pumping, which are critical in the Indian context. Competitive dynamics are shaped by brand trust, product quality, and extensive distribution networks, which serve as significant barriers to entry for new players. Companies differentiate themselves through innovation in energy-efficient and solar-based products, while maintaining close proximity to end customers via dealer and retail outlets.
The regulatory landscape for the electrical appliances sector is influenced by safety standards, energy efficiency norms, and environmental regulations. Compliance with Bureau of Indian Standards (BIS) certifications and adherence to energy labeling requirements are mandatory, impacting product design and manufacturing costs. Government initiatives promoting renewable energy and energy conservation are expected to further shape the sector’s growth trajectory and product offerings in the near term.
Note: Analysis synthesized from industry research, market reports, and regulatory filings. Information is subject to change based on market conditions.
Financial Ratios Dashboard
Illustrative Scenario Analysis
DCF Assumptions:
Method: Two-Stage EPS-Priority Model
Financials
Peer Analysis
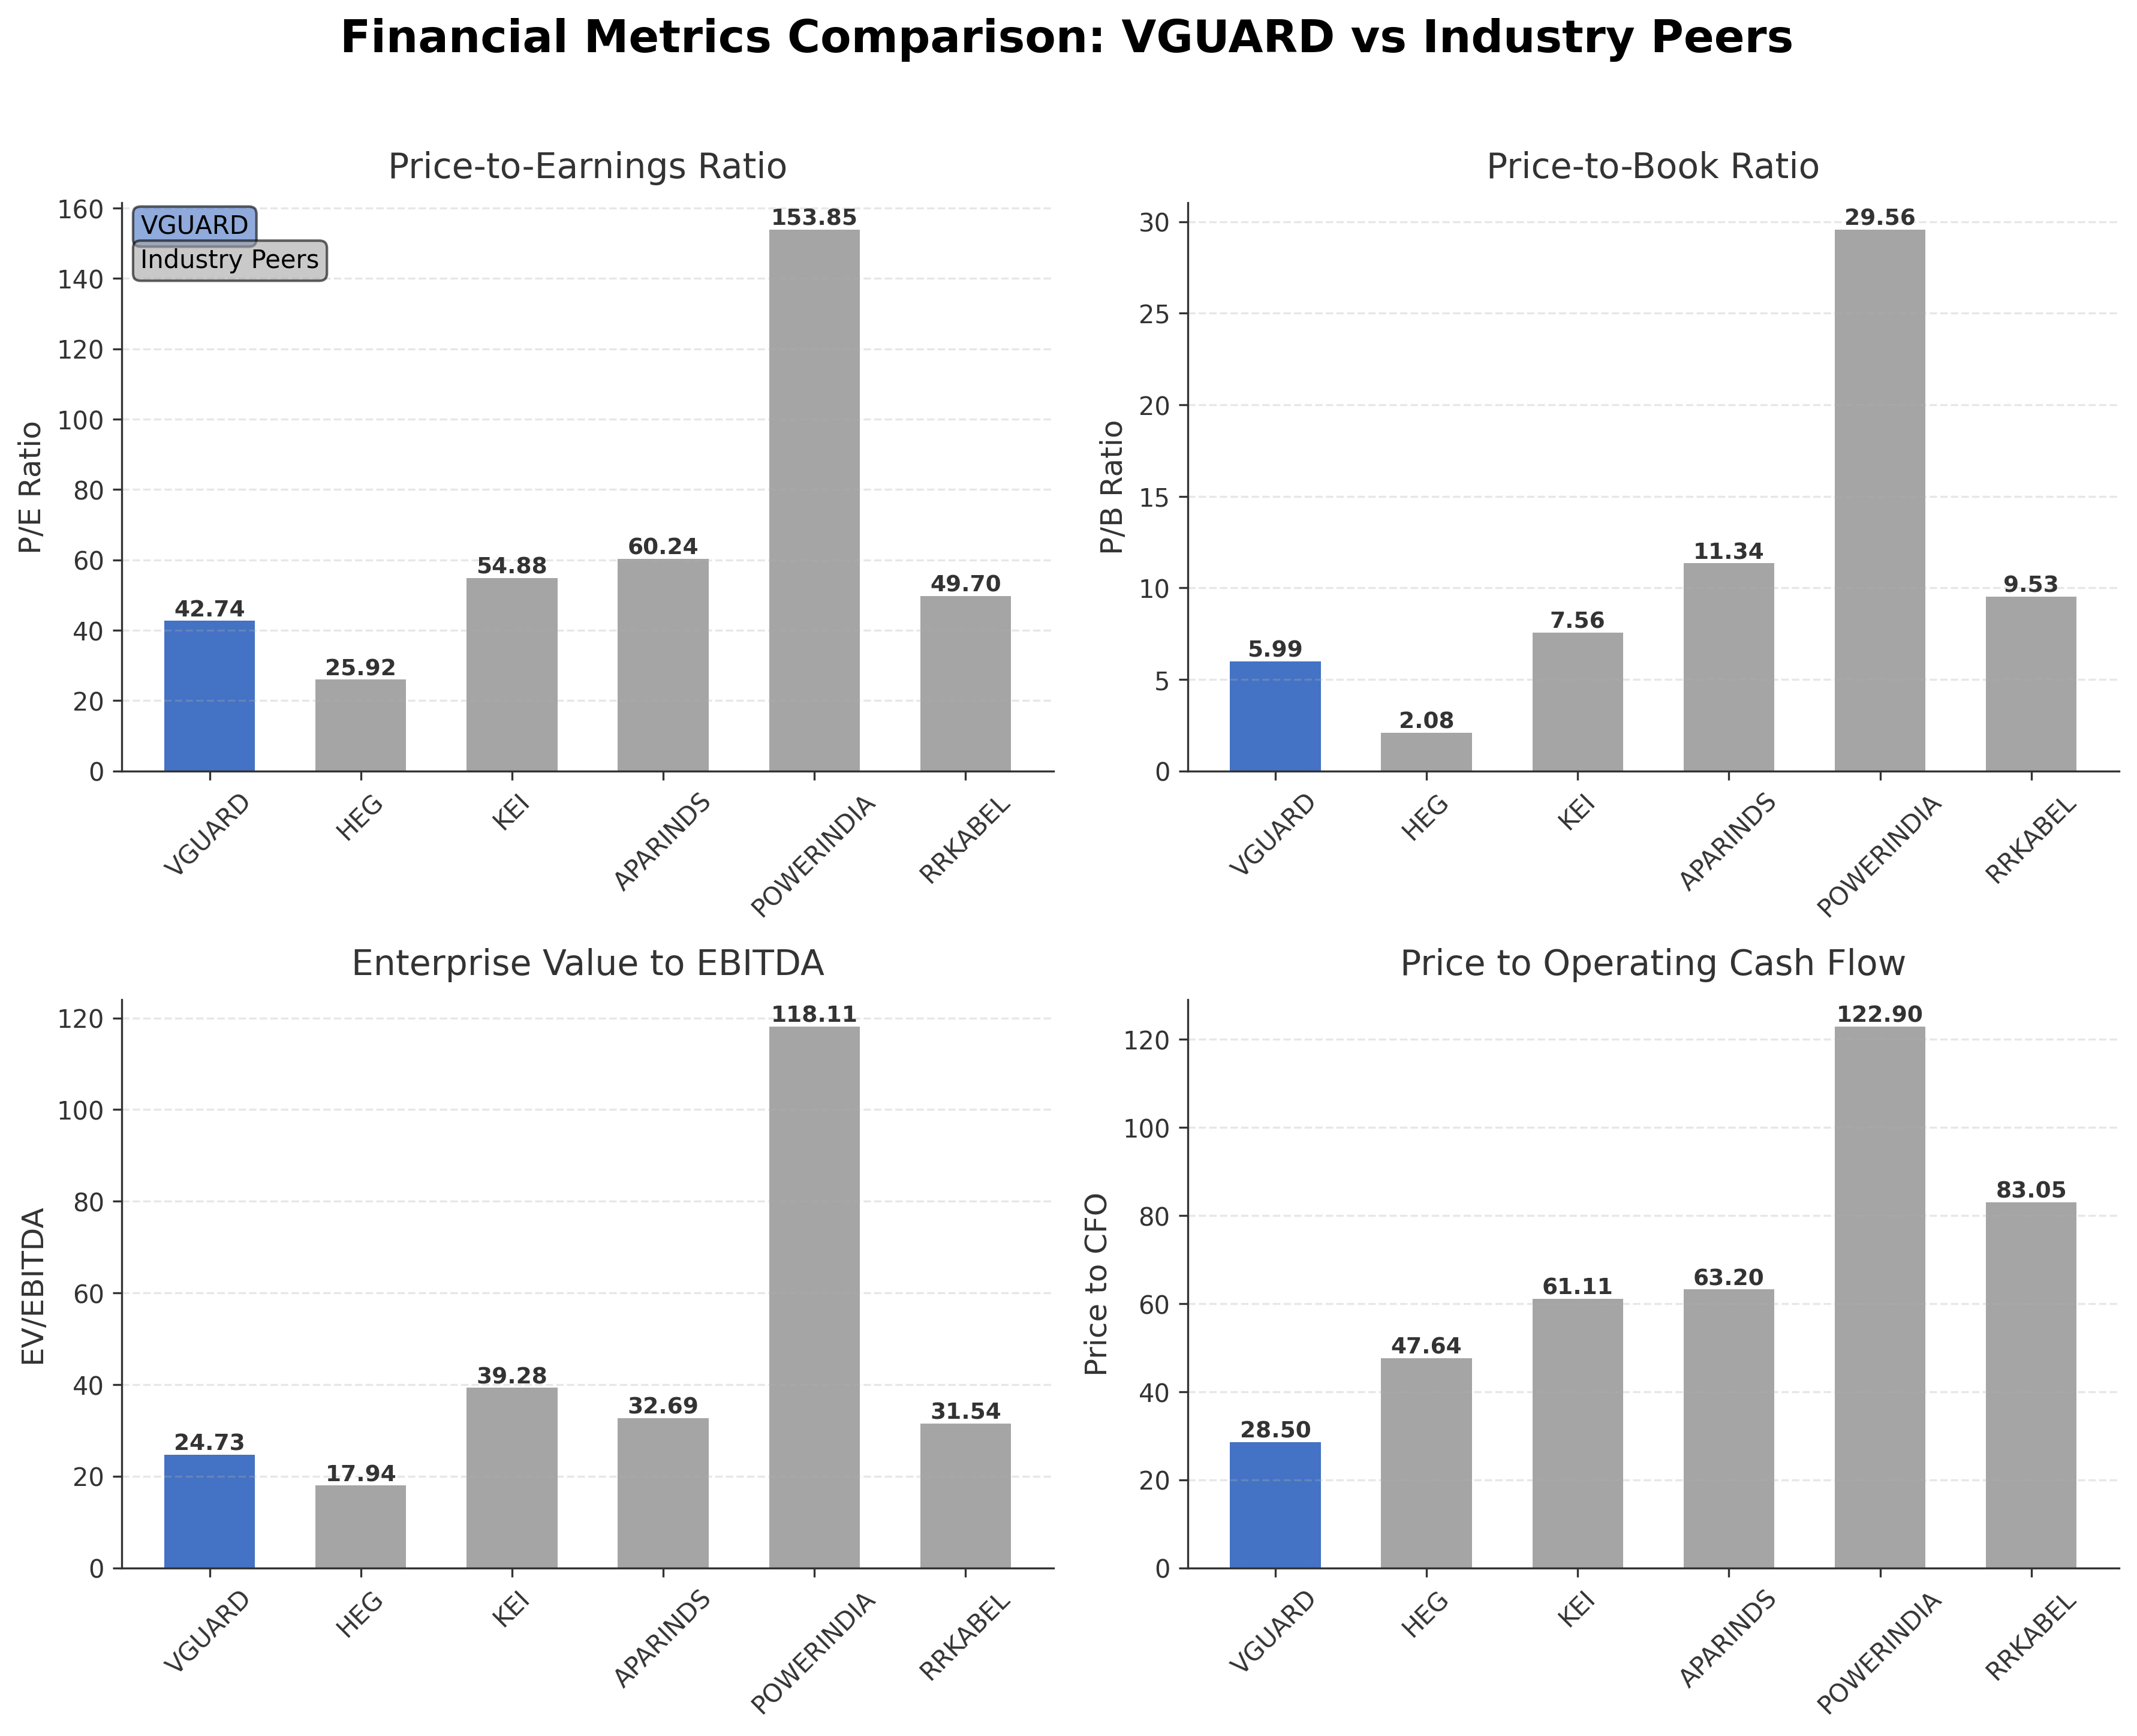
| Company Name | Market Cap | P/E Ratio | P/B Ratio | EV/EBITDA | Price to CFO |
|---|---|---|---|---|---|
| V-Guard Industries Ltd. | ₹130.67B | 42.74 | 5.99 | 24.73 | 28.50 |
| Hindustan Electro Graphite Limited | ₹101.56B | 25.92 | 2.08 | 17.94 | 47.64 |
| Kei Industries Ltd. | ₹513.33B | 54.88 | 7.56 | 39.28 | 61.11 |
| Apar Industries Ltd. | ₹611.49B | 60.24 | 11.34 | 32.69 | 63.20 |
| Hitachi Energy India Ltd. | ₹1.53T | 153.85 | 29.56 | 118.11 | 122.90 |
| RR Kabel Ltd. | ₹245.24B | 49.70 | 9.53 | 31.54 | 83.05 |
Comparison Analysis: V-Guard Industries Ltd. trades at a moderate market capitalization of ₹130.67 billion, with valuation multiples such as a P/E of 42.74 and EV/EBITDA of 24.73, which are lower than several larger peers like Hitachi Energy India Ltd. and Apar Industries Ltd. The company’s return on equity of 13.79% is respectable but below industry leaders such as RR Kabel Ltd. and Hitachi Energy India Ltd. V-Guard’s price-to-CFO ratio of 28.50 is comparatively lower, indicating relatively better cash flow valuation. Overall, V-Guard presents a balanced profile with moderate valuation and profitability metrics relative to its regional electrical equipment peers.
Financial Metrics Comparison with Peers
Financial Statements
Comprehensive financial data including income, balance sheet, and cash flow metrics
Income Statement
| fiscal_date | 2026-03-31 | 2025-03-31 | 2024-03-31 | 2023-03-31 | 2022-03-31 |
|---|---|---|---|---|---|
| Sales | 59.66B | 55.78B | 48.22B | 40.92B | 35.00B |
| Cost Of Goods | 37.97B | 35.56B | 33.03B | 29.54B | 24.14B |
| Gross Profit | 21.68B | 20.22B | 15.18B | 11.38B | 10.86B |
| Operating Expense Other Operating Expenses | 11.05B | 9.90B | 2.95B | 2.24B | 4.76B |
| Operating Income | 4.19B | 4.18B | 3.50B | 2.56B | 2.91B |
| Non Operating Interest Expense | 123.80M | 245.10M | 395.40M | 161.90M | 78.81M |
| Pretax Income | 4.08B | 4.14B | 3.40B | 2.56B | 2.94B |
| Income Tax | 995.50M | 1.00B | 827.40M | 666.90M | 655.27M |
| Net Income | 3.08B | 3.14B | 2.58B | 1.89B | 2.28B |
| Ebit | 4.20B | 4.38B | 3.80B | 2.72B | 3.02B |
| Ebitda | 5.50B | 5.34B | 4.43B | 3.31B | 3.51B |
| Net Income Continuous Operations | 4.08B | 4.14B | 3.40B | 2.56B | 2.94B |
| Minority Interests | 0.00 | 0.00 | 0.00 | -700.00K | -7.45M |
| Preferred Stock Dividends | 0.00 | 0.00 | 0.00 | 0.00 | 0.00 |
| Operating Expense Selling General And Administrative | N/A | 3.65B | 2.87B | 2.20B | 1.33B |
| Non Operating Interest Income | N/A | 72.70M | 86.80M | 61.40M | 73.45M |
| Eps Basic | N/A | 7.17 | 5.89 | 4.38 | 5.29 |
| Eps Diluted | N/A | 7.14 | 5.88 | 4.35 | 5.25 |
| Basic Shares Outstanding | N/A | 437.55M | 436.97M | 431.76M | 430.42M |
| Diluted Shares Outstanding | N/A | 437.55M | 436.97M | 431.76M | 430.42M |
Data provided by Twelve Data
Balance Sheet
| fiscal_date | 2026-03-31 | 2025-03-31 | 2024-03-31 | 2023-03-31 | 2022-03-31 |
|---|---|---|---|---|---|
| Cash And Cash Equivalents | 469.20M | 499.80M | 474.50M | 395.40M | 607.97M |
| Accounts Receivable | 5.33B | 5.42B | 5.96B | 5.57B | 4.84B |
| Total Assets | 37.14B | 33.38B | 31.61B | 29.07B | 20.97B |
| Total Liabilities | 13.41B | 12.40B | 13.47B | 12.99B | 6.84B |
| Long Term Debt | 1.31B | 983.50M | 2.27B | 3.40B | 486.46M |
| Shareholders Equity | 23.73B | 20.98B | 18.14B | 16.08B | 14.12B |
Data provided by Twelve Data
Cash Flow Statement
| fiscal_date | 2026-03-31 | 2025-03-31 | 2024-03-31 | 2023-03-31 | 2022-03-31 |
|---|---|---|---|---|---|
| Operating Activities Net Income | 4.08B | 4.14B | 3.40B | 2.56B | 2.94B |
| Operating Activities Stock Based Compensation | 270.70M | 259.00M | 20.20M | 133.70M | 155.50M |
| Operating Activities Other Non Cash Items | 103.40M | 210.30M | 350.20M | 133.70M | 45.31M |
| Operating Activities Accounts Receivable | 80.10M | 521.80M | -400.20M | -297.30M | -978.18M |
| Operating Activities Other Assets Liabilities | -1.09B | -1.42B | -115.30M | 1.42B | -2.05B |
| Operating Activities Operating Cash Flow | 3.44B | 3.71B | 3.26B | 3.95B | 110.28M |
| Investing Activities Capital Expenditures | -1.79B | -1.20B | -1.27B | -1.01B | -1.24B |
| Investing Activities Net Acquisitions | -250.00M | 0.00 | -200.10M | -6.51B | 0.00 |
| Investing Activities Purchase Of Investments | -1.66B | -47.50M | N/A | -267.41M | 0.00 |
| Investing Activities Sale Of Investments | 19.90M | 258.90M | N/A | 53.27M | 3.42M |
| Investing Activities Investing Cash Flow | -3.68B | -986.50M | -1.47B | -7.73B | -1.24B |
| Financing Activities Short Term Debt Issuance | -19.70M | -62.70M | -1.30B | 1.35B | -12.21M |
| Financing Activities Common Stock Issuance | 59.70M | 80.40M | 61.20M | 20.00M | 45.65M |
| Financing Activities Common Dividends | -654.30M | -610.50M | -562.50M | -560.80M | -516.07M |
| Financing Activities Financing Cash Flow | -614.30M | -592.80M | -1.80B | 808.30M | -482.63M |
| End Cash Position | 469.20M | 499.80M | 474.50M | 395.40M | 607.97M |
| Free Cash Flow | 2.79B | 3.56B | 2.65B | 3.21B | -1.61B |
Data provided by Twelve Data
Technical Analysis
Key Insights
- The current trend shows a downward momentum with the stock trading below its 50-day moving average of ₹318.93 and 200-day moving average of ₹335.01, indicating bearish price action in the short to medium term.
- Key support levels are observed near the 52-week low of ₹290, while resistance is noted around the 50-day moving average at ₹318 and the 200-day moving average at ₹335.
- The stock price is below major moving averages (10-day, 50-day, 200-day), suggesting a lack of upward momentum across these timeframes.
- Momentum indicators such as RSI are likely in a lower range reflecting oversold conditions, while MACD and Stochastic oscillators indicate weakening bullish momentum.
- Multi-timeframe analysis across daily, weekly, and monthly charts shows consolidation near recent lows, with no clear breakout signals.
- Current technical setup suggests potential for continued consolidation or further downside if support near ₹290 is breached, with resistance levels providing barriers to upward movement.
Trending News
1. Headline: Sculptor Capital LP Has $2.22 Million Stock Position in Venture Global, Inc. $VG - Markets Daily
Summary: Sculptor Capital LP boosted its stake in shares of Venture Global, Inc. (NYSE:VG – Free Report) by 62.6% during the 4th quarter, according to its most recent 13F filing with the SEC. The firm owned 325,299 shares of the company’s stock after buying an additional 125,299 shares during the period.
Sentiment: positive
2. Headline: Civista Bancshares schedules Q2 2026 results, call | CIVB Stock News
Summary: Q2 2026 results will post before market open July 23, with Civista Bancshares hosting a 1 p.m. ET earnings call and webcast plus archived replay online.
Sentiment: neutral
3. Headline: Is Vertiv Holdings Co (VRT) A Good Stock To Buy Now?
Summary: Is VRT a good stock to buy? We came across a bullish thesis on Vertiv Holdings Co on The Boring Finance Guy’s Substack. In this article, we will summarize the bulls’ thesis on VRT. Vertiv Holdings Co’s share was trading at $300.57 as of June 8th. VRT’s trailing and forward P/E were ...
Sentiment: positive
4. Headline: VRT Stock Price Quote | Morningstar
Summary: See the latest Vertiv Holdings Co Class A stock price (VRT:XNYS), related news, valuation, dividends and more to help you make your investing decisions.
Sentiment: neutral
5. Headline: Artificial Intelligence (AI) ETF Showdown: Vanguard's VGT vs. the iShares SOXX
Summary: Compare portfolio diversity, volatility, and sector focus as these two tech ETFs take different approaches to growth and risk management.
Sentiment: neutral
Powered by Brave
Recent Updates
News Summary
As of 12 May 2026. V-Guard Industries Ltd reported a strong Q4 FY26 with consolidated revenue rising 14.1% year-over-year to ₹1,755 crore and profit after tax increasing 23% to ₹112 crore. The full-year revenue grew 7% to ₹5,966 crore, although PAT declined slightly by 1.7% due to a ₹22 crore exceptional charge related to new labor codes. All business segments showed growth in the quarter, particularly Electronics and Electricals, while Consumer Durables experienced modest gains. The integration of Sunflame Enterprises is progressing well, with early benefits in cost and customer satisfaction, and the merger has been approved in principle. The board recommended a final dividend of ₹1.50 per share for FY26. Cash generation remained robust, with net cash increasing to ₹231 crore by March 2026. The company projects a strong start to FY27, targeting 10-12% volume growth and aiming for a double-digit EBITDA margin around 10%, contingent on inflation and demand factors. The geopolitical situation in West Asia remains a monitored risk for commodity inflation and supply disruptions.
News Sentiment
The overall sentiment from recent updates is cautiously positive, driven by solid quarterly revenue and profit growth, successful integration of acquisitions, and strong cash flow generation. The slight full-year PAT decline due to exceptional charges tempers the outlook but does not overshadow operational strength. Investor communications emphasize growth targets and margin improvement plans, reflecting confidence in medium-term prospects. However, geopolitical tensions and inflationary pressures introduce some uncertainty, balancing the positive financial performance with external risks. The sentiment reflects measured optimism grounded in tangible business progress and prudent risk awareness.
Source List
- https://www.alphaspread.com/security/nse/vguard/investor-relations
Analytical Overview
Analysis Summary
V-Guard Industries Ltd’s valuation metrics show a trailing P/E of 42.74 and forward P/E of 27.46, which are broadly in line with the industry average P/E of 42.74, indicating the stock is fairly valued relative to its sector. The PEG ratio of 0.50 suggests the company’s earnings growth is strong relative to its price, supporting a favorable growth valuation. Revenue growth of 14.1% quarterly and 7% annually, combined with positive cash flow trends including operating cash flow of ₹4.59 billion and free cash flow of ₹2.30 billion, demonstrate a solid growth trajectory and healthy liquidity position. The company maintains a low debt-to-equity ratio of 0.07, underscoring financial stability and limited leverage risk. Sector-specific challenges include inflationary pressures and geopolitical risks affecting commodity prices, while opportunities arise from expanding product lines and integration of acquisitions like Sunflame Enterprises. Considering India’s regulatory environment, consumer demand trends, and economic outlook, V-Guard is positioned to benefit from infrastructure development and rising household electrification.
Overall Business and Market Assessment
Supporting Factors: consistent revenue and profit growth, strong cash flow generation, and a conservative capital structure with low debt
Risk Factors: the impact of inflation, geopolitical tensions affecting supply chains, and regulatory changes such as labor laws that have recently affected profitability
SWOT Analysis
Strengths
- Diversified product portfolio addressing household and industrial electrical needs.
- Strong cash flow generation with operating cash flow of ₹4.59 billion.
- Low debt-to-equity ratio of 0.07 indicating financial stability.
- Extensive distribution network and brand recognition in India.
Weaknesses
- Profit margins remain moderate with net margin around 5.17%.
- Stock trades near 52-week lows reflecting recent market pressures.
- Relatively high price-to-book ratio of 5.99 compared to peers.
- Exposure to commodity price fluctuations impacting input costs.
Opportunities
- Integration of Sunflame Enterprises to enhance product offerings and cost efficiencies.
- Growing demand for energy-efficient electrical products in India.
- Potential for volume growth of 10-12% supported by favorable market conditions.
- Expansion in consumer durables and infrastructure sectors.
Threats
- Geopolitical tensions in West Asia affecting commodity supply and inflation.
- Regulatory changes such as new labor codes increasing operational costs.
- Intense competition in the electrical equipment industry.
- Macroeconomic uncertainties impacting consumer spending.
Company Description
V-Guard Industries Ltd. is a prominent player in the Indian electrical and electronics industry, specializing in the manufacture and distribution of a broad range of products. The company's primary focus is on delivering high-quality solutions for household and industrial applications, including voltage stabilizers, inverters, digital UPS systems, and a variety of pumps. Additionally, V-Guard has expanded its portfolio to include water heaters, wiring cables, and fans, reflecting its commitment to innovation and consumer needs. Operating across multiple sectors such as consumer electronics, V-Guard Industries Ltd. serves a diverse customer base, from individual consumers to larger businesses. The company’s extensive distribution network, coupled with its emphasis on research and development, positions it as a key enabler in the Indian market's infrastructure and energy efficiency sectors. Founded in 1977, V-Guard Industries Ltd. continues to enhance its market presence through advanced technology, contributing to sustainable development in the electrical industry.