

UPL Ltd (UPL)
Stock Analysis Report
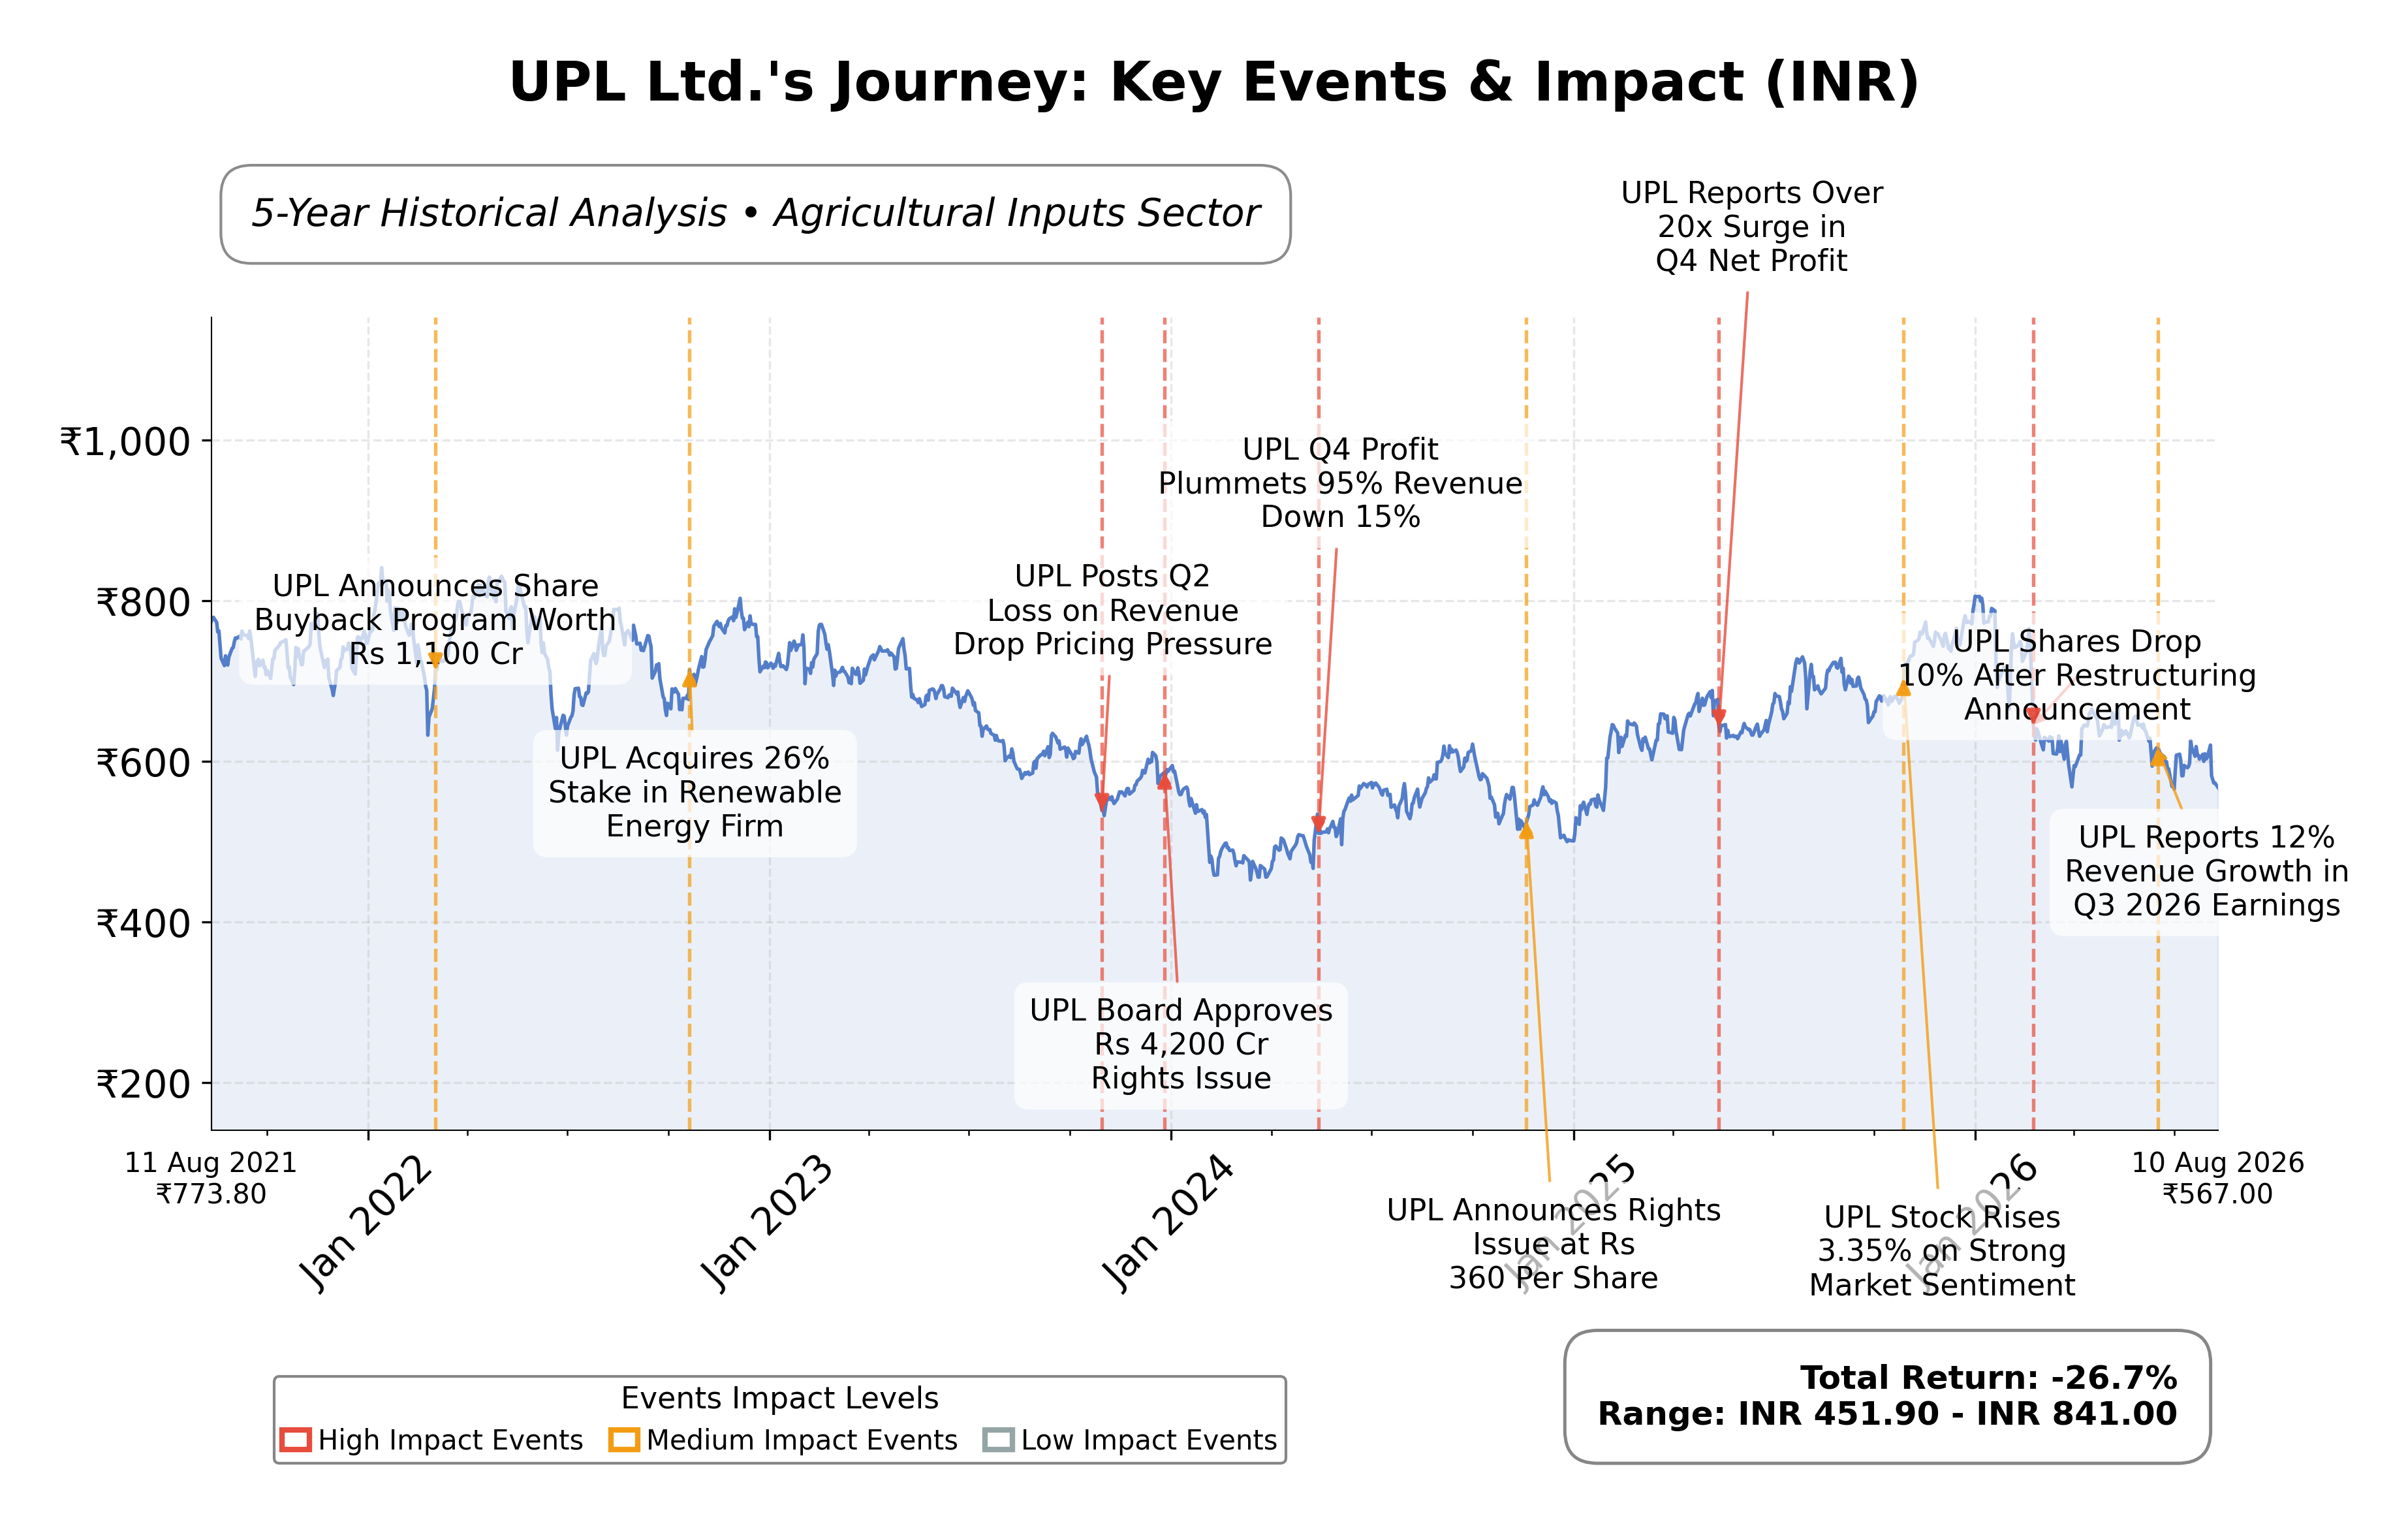
Stock Journey
Key Positives and Key Risks
Pros
- Revenue growth of 17.7% year-over-year demonstrates strong top-line momentum.
- Operating cash flow of INR 78.55 billion supports financial stability and operational needs.
- Forward P/E of 12.57 indicates the stock is valued attractively relative to expected earnings.
Cons
- Return on equity of 5.61% is lower than industry peers, suggesting less efficient capital use.
- Debt-to-equity ratio of 57.13% reflects moderate leverage that could pose financial risk.
- Recent management restructuring introduces uncertainty in near-term operational execution.
Disclosure: This information is for general awareness and does not constitute investment advice
Report Summary
UPL Ltd. is a leading multinational agrochemical company listed on the National Stock Exchange of India (NSE), operating within the Basic Materials sector and specializing in Agricultural Inputs. The company provides a broad portfolio of crop protection products including herbicides, insecticides, fungicides, plant growth regulators, and rodenticides. With operations spanning over 130 countries, UPL holds a significant position in the global agricultural industry, leveraging strategic acquisitions and research initiatives focused on sustainability and innovation to enhance crop productivity and food security.
Financially, UPL reported a trailing twelve months (TTM) revenue of approximately INR 518.39 billion with a gross margin of 44.79%, operating margin of 14.95%, and a net profit margin of 3.71%. The company’s return on equity (ROE) stands at 5.61%, return on assets (ROA) at 4.34%, and return on invested capital (ROIC) is consistent with these efficiency metrics. These figures indicate moderate profitability and operational efficiency, supported by steady revenue growth of 17.7% year-over-year and an improving earnings per share (EPS) of INR 22.34.
Valuation metrics show UPL trading at a trailing price-to-earnings (P/E) ratio of 26.97 and a forward P/E of 12.57, suggesting market expectations of earnings growth. The price-to-book (P/B) ratio is 1.47, and the enterprise value to EBITDA (EV/EBITDA) stands at 9.50, reflecting a valuation that is relatively reasonable compared to industry peers. The stock price currently trades near INR 568, closer to its 52-week low of INR 563.15 than the high of INR 812.20, indicating a 43% downside risk from the high, which may reflect market caution or valuation adjustments.
UPL’s strengths include strong cash flow generation with operating cash flow of INR 78.55 billion and levered free cash flow of INR 22.77 billion, a manageable debt-to-equity ratio of 57.13%, and a diversified global footprint. Key risks involve geopolitical uncertainties, regulatory challenges in agrochemical markets, and competitive pressures. Recent strategic actions include management restructuring and stock exchange approvals for a composite scheme of arrangement, signaling ongoing corporate governance and operational adjustments.
Technically, the stock shows mixed signals with price below the 200-day moving average but near the 50-day average, moderate momentum indicators, and a beta of 0.54 indicating lower volatility relative to the market. Recent news reflects both positive earnings surprises and some investor caution following management changes. Overall, the data suggests a balanced stance with conditions warranting close monitoring of operational execution and market developments.
Company and Industry Overview
Company Basics
Price Performance
Company Size
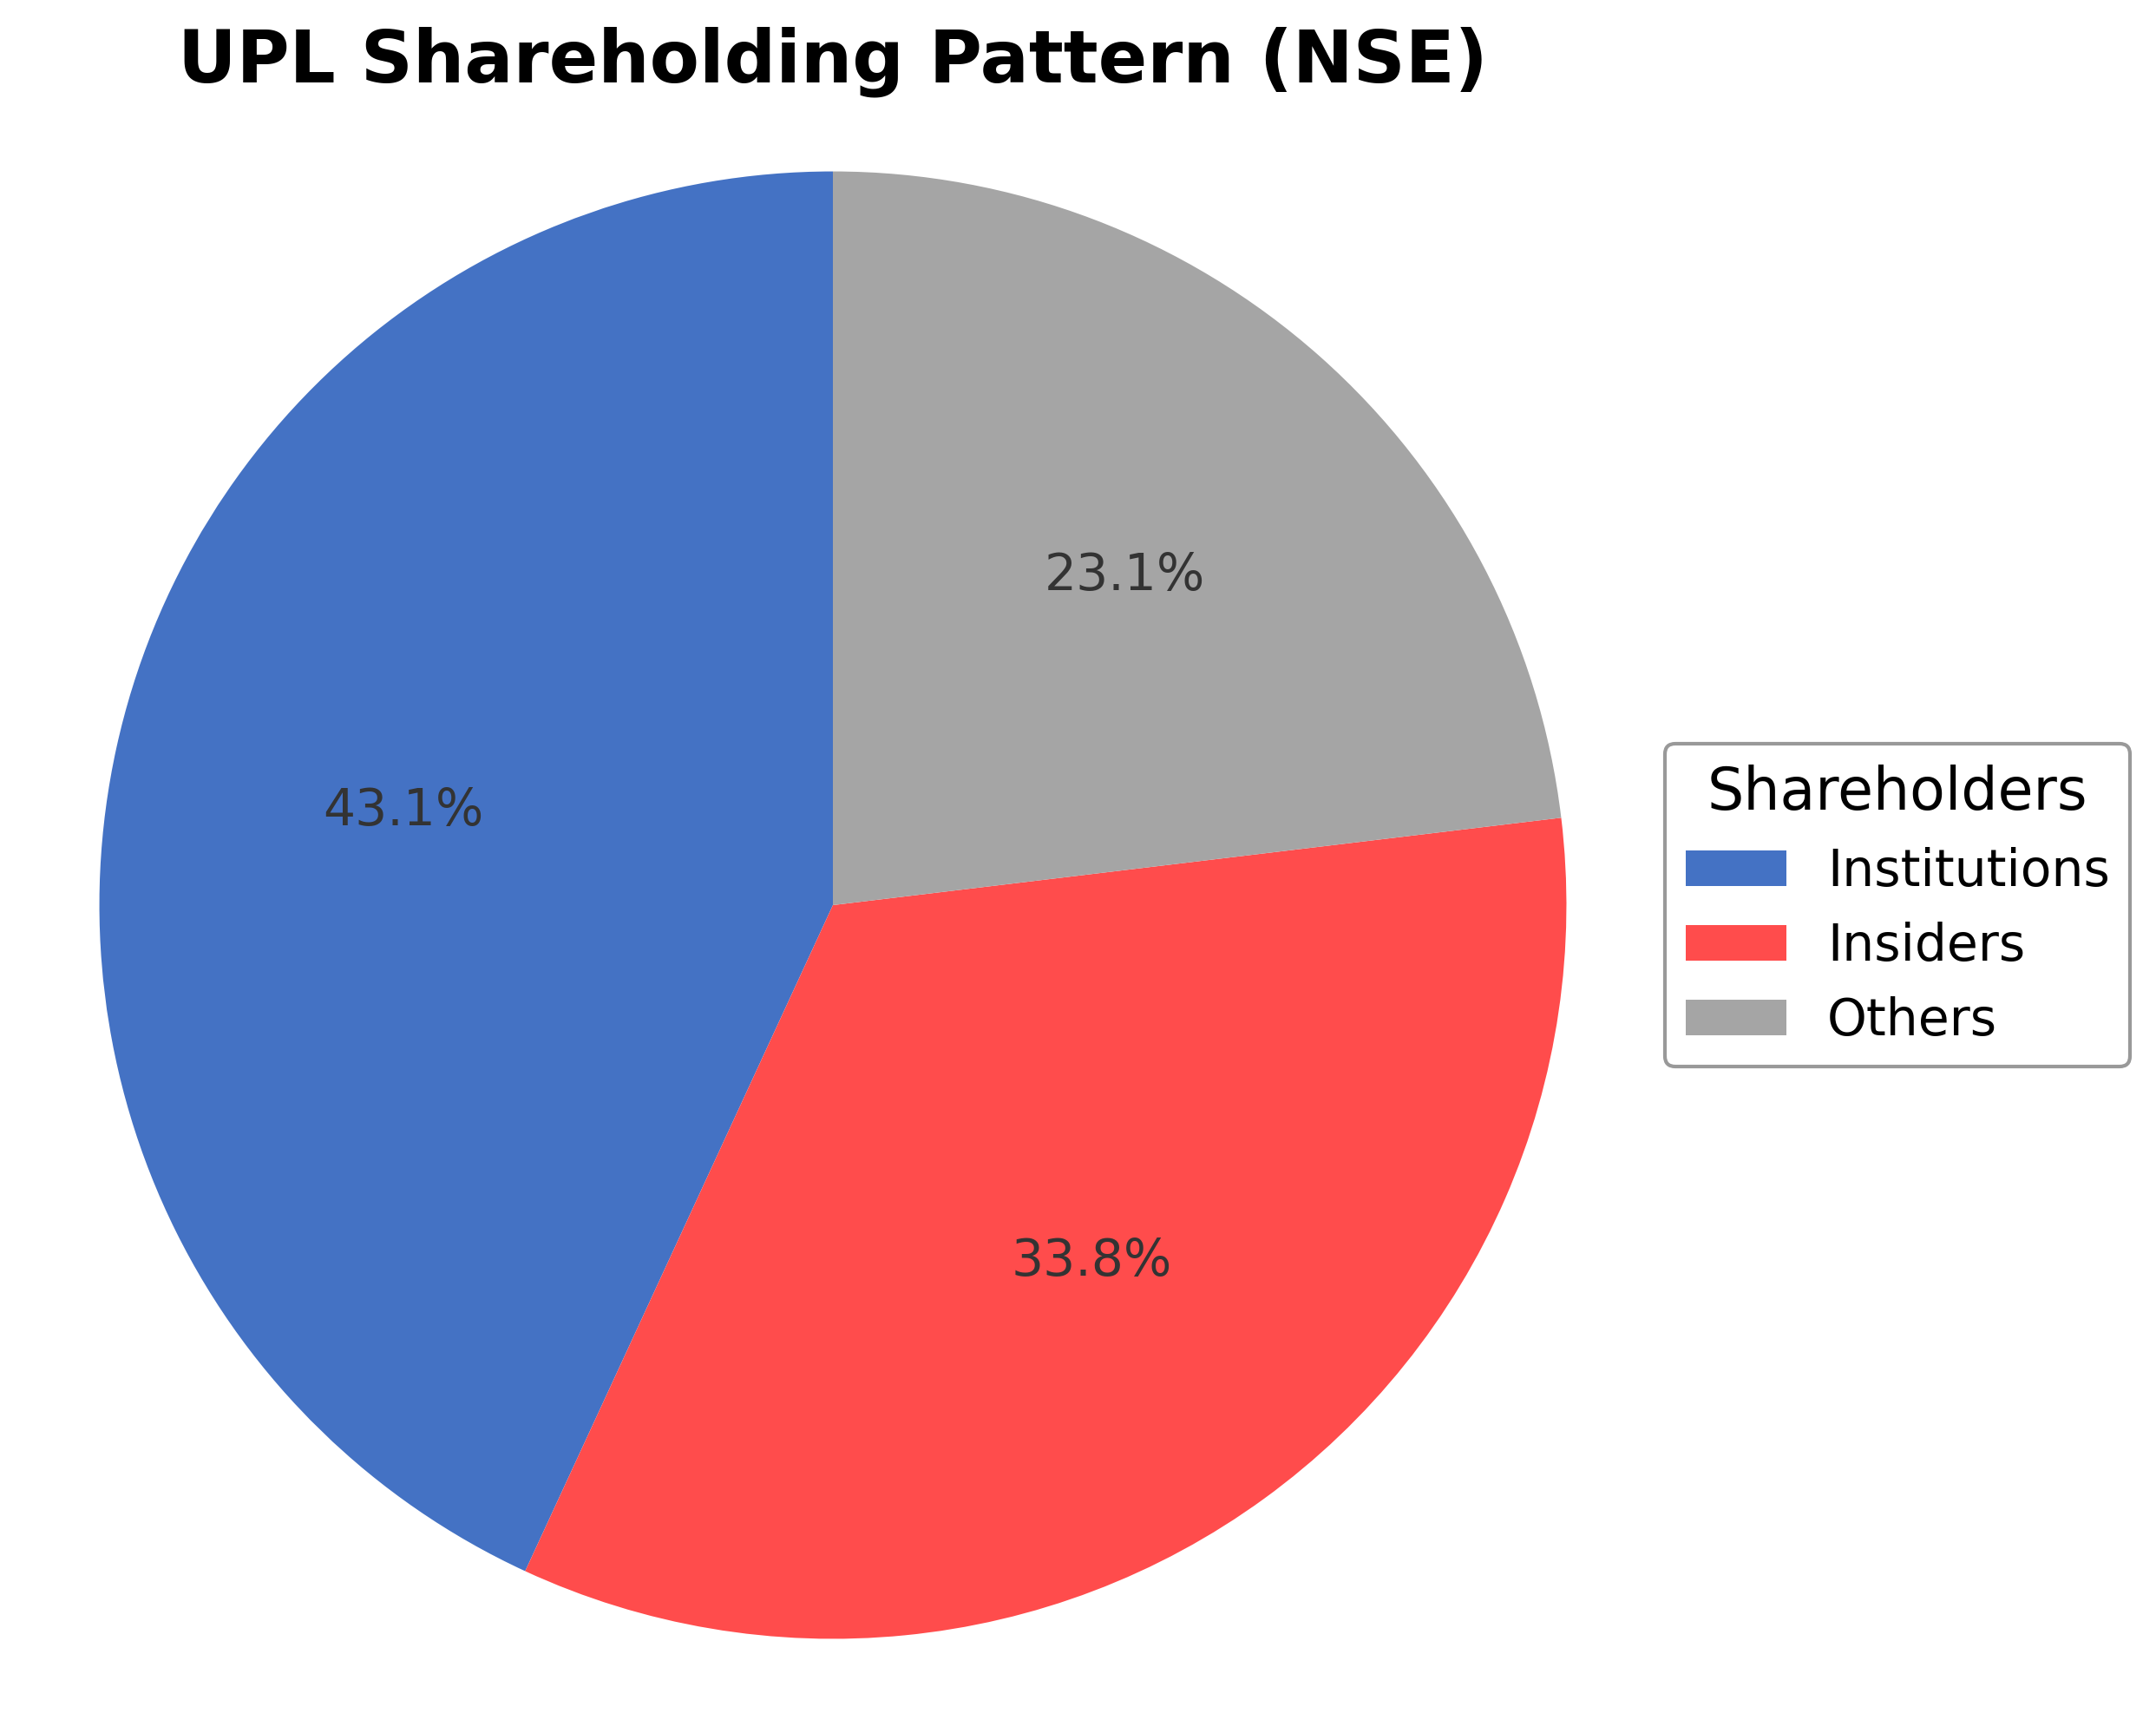
Shareholding Pattern
Sector and Industry Analysis
The global agrochemical sector, encompassing crop protection products such as herbicides, fungicides, and insecticides, is a substantial market driven by increasing agricultural demand and the need for sustainable farming solutions. The market has exhibited steady growth, propelled by rising food consumption and technological advancements in crop protection. Key players include multinational firms like Bayer, Syngenta, BASF, and UPL Ltd, which compete across diverse geographic regions with broad product portfolios.
Industry trends highlight a shift towards integrated pest management and biologically derived products, reflecting growing environmental concerns and farmer preferences for sustainable inputs. Competitive dynamics are shaped by high research and development costs, stringent patent protections, and significant barriers to entry, including regulatory approvals and distribution networks. Companies like UPL leverage global manufacturing capabilities and farmer advisory services to strengthen market positioning and address regional agricultural needs.
The regulatory landscape is characterized by rigorous safety and environmental standards imposed by agencies such as the EPA in the U.S. and the European Chemicals Agency in the EU. Compliance with these regulations affects product development, approval timelines, and market access, often increasing operational complexity and costs. Ongoing regulatory scrutiny and evolving policies on chemical usage are expected to influence industry innovation and consolidation trends in the medium term.
Note: Analysis synthesized from industry research, market reports, and regulatory filings. Information is subject to change based on market conditions.
Financial Ratios Dashboard
Illustrative Scenario Analysis
DCF Assumptions:
Method: Two-Stage EPS-Priority Model
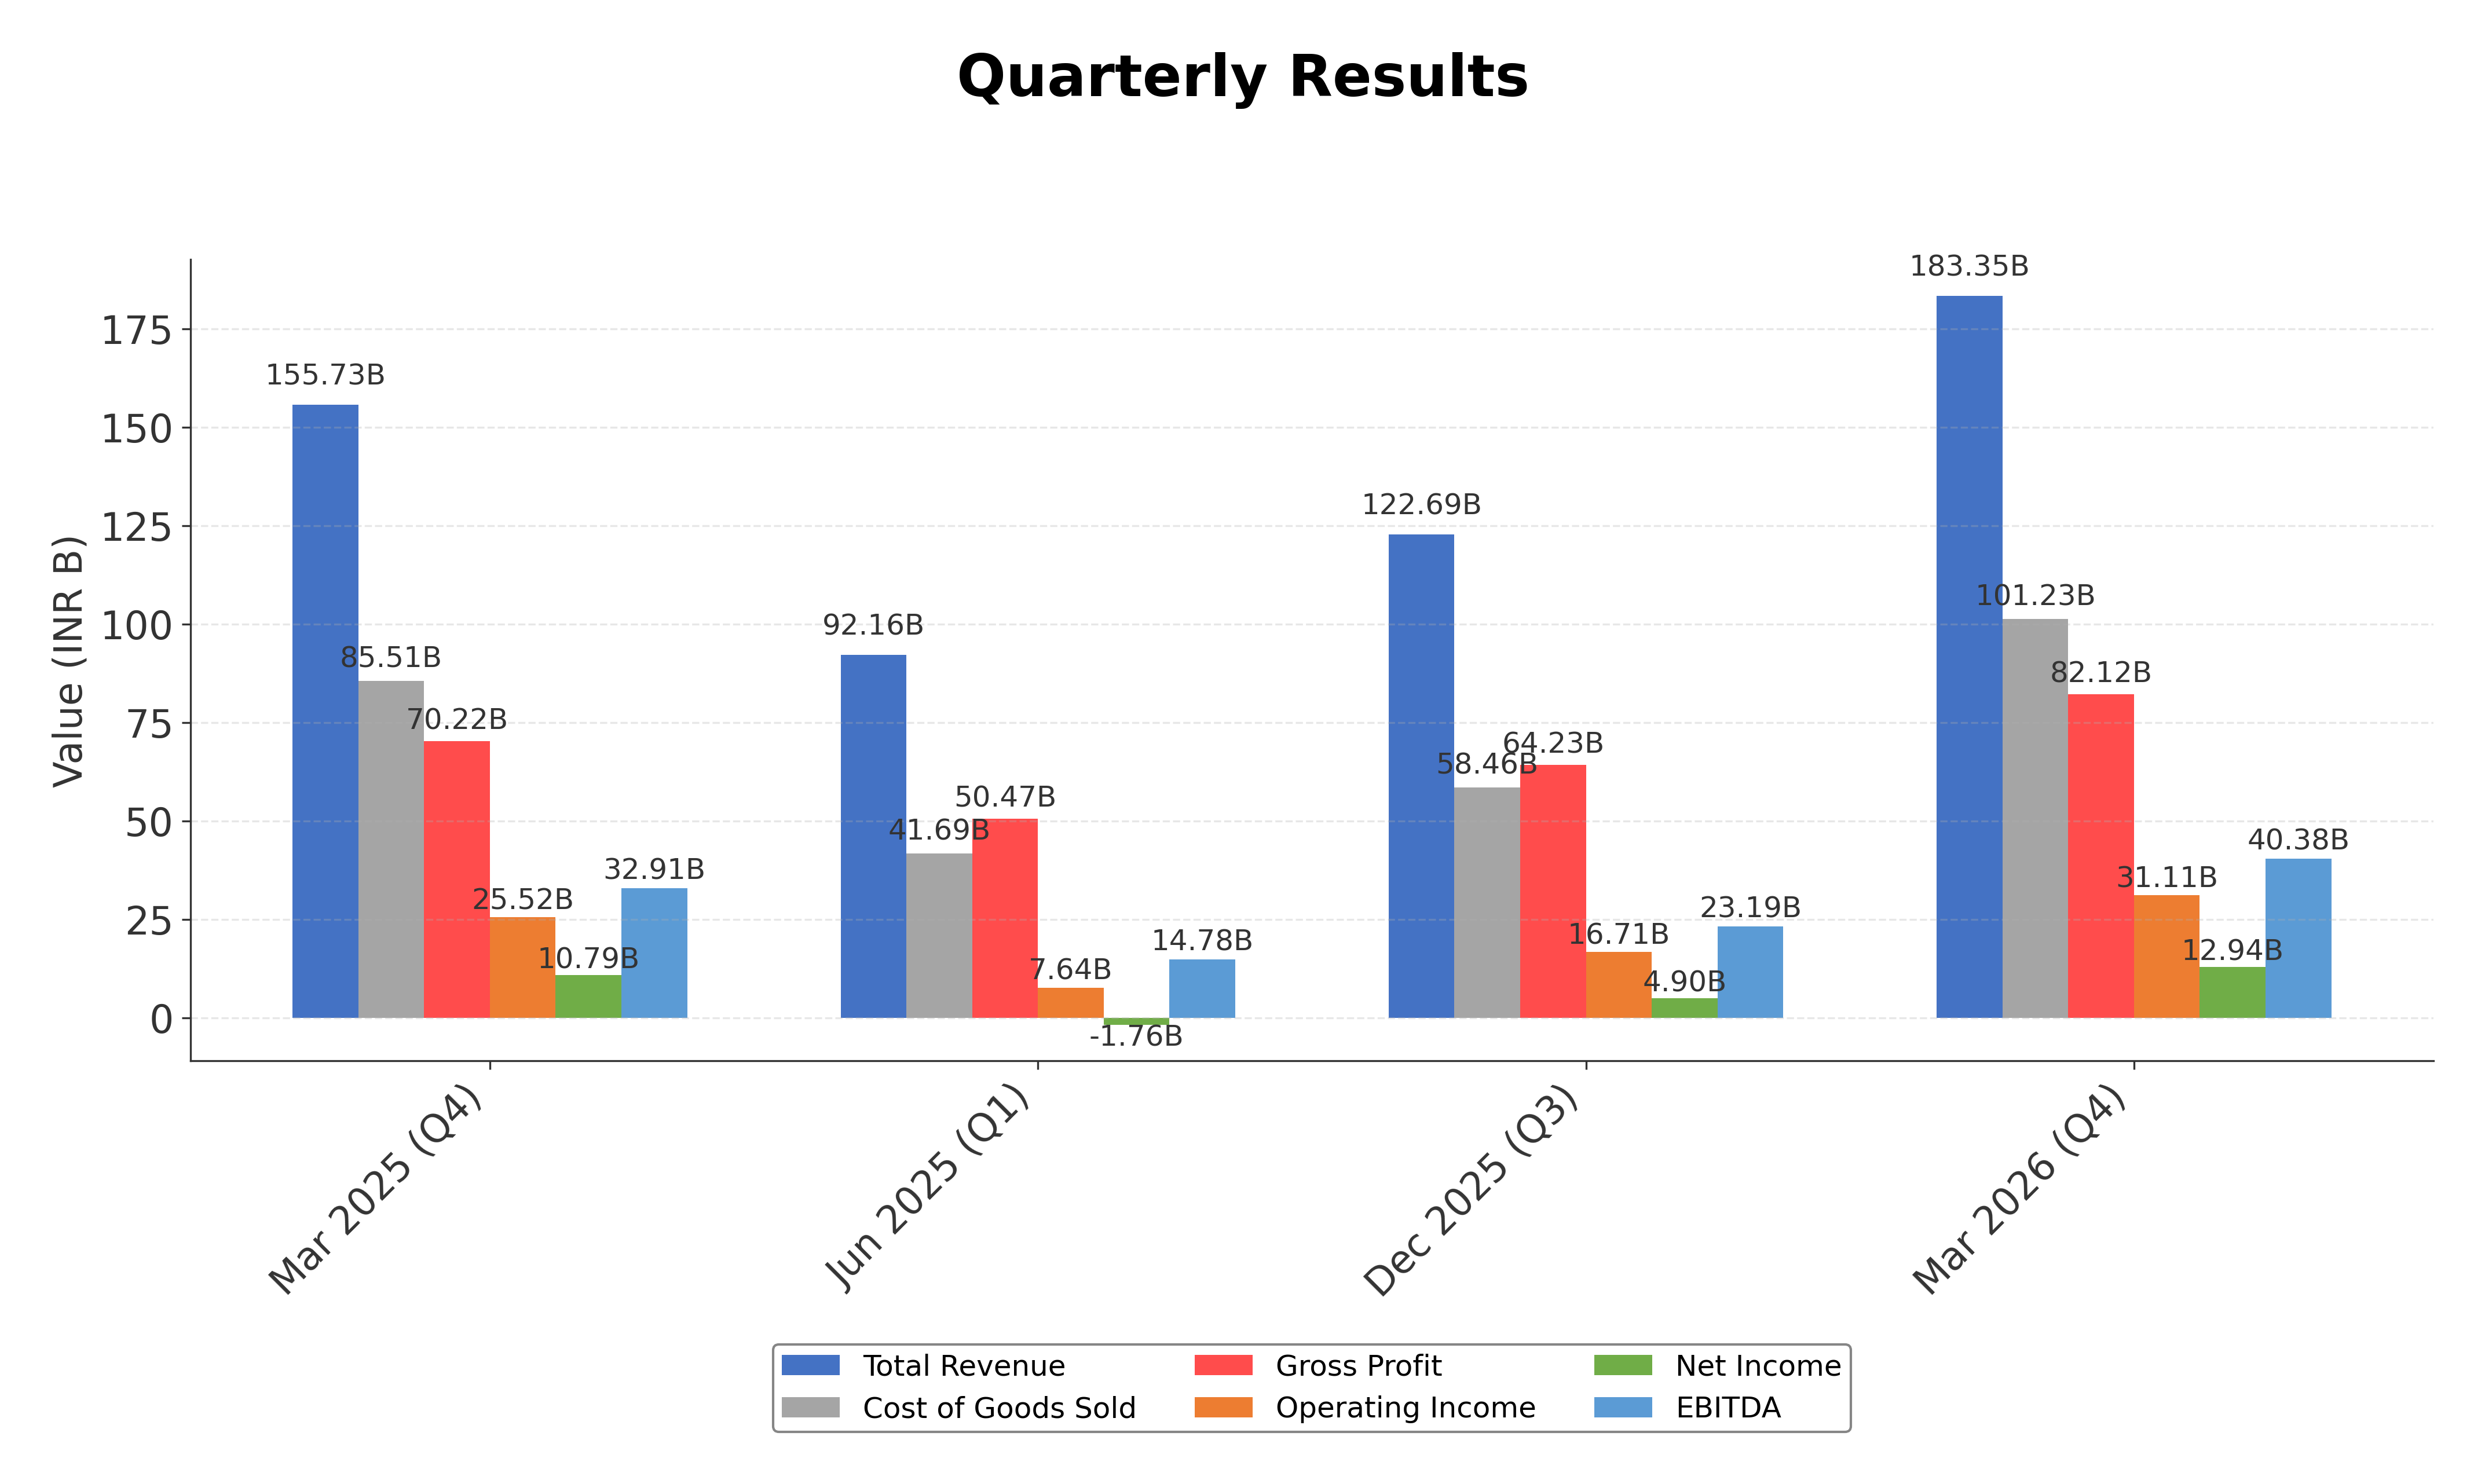
Financials
Peer Analysis
| Company Name | Market Cap | P/E Ratio | P/B Ratio | EV/EBITDA | Price to CFO |
|---|---|---|---|---|---|
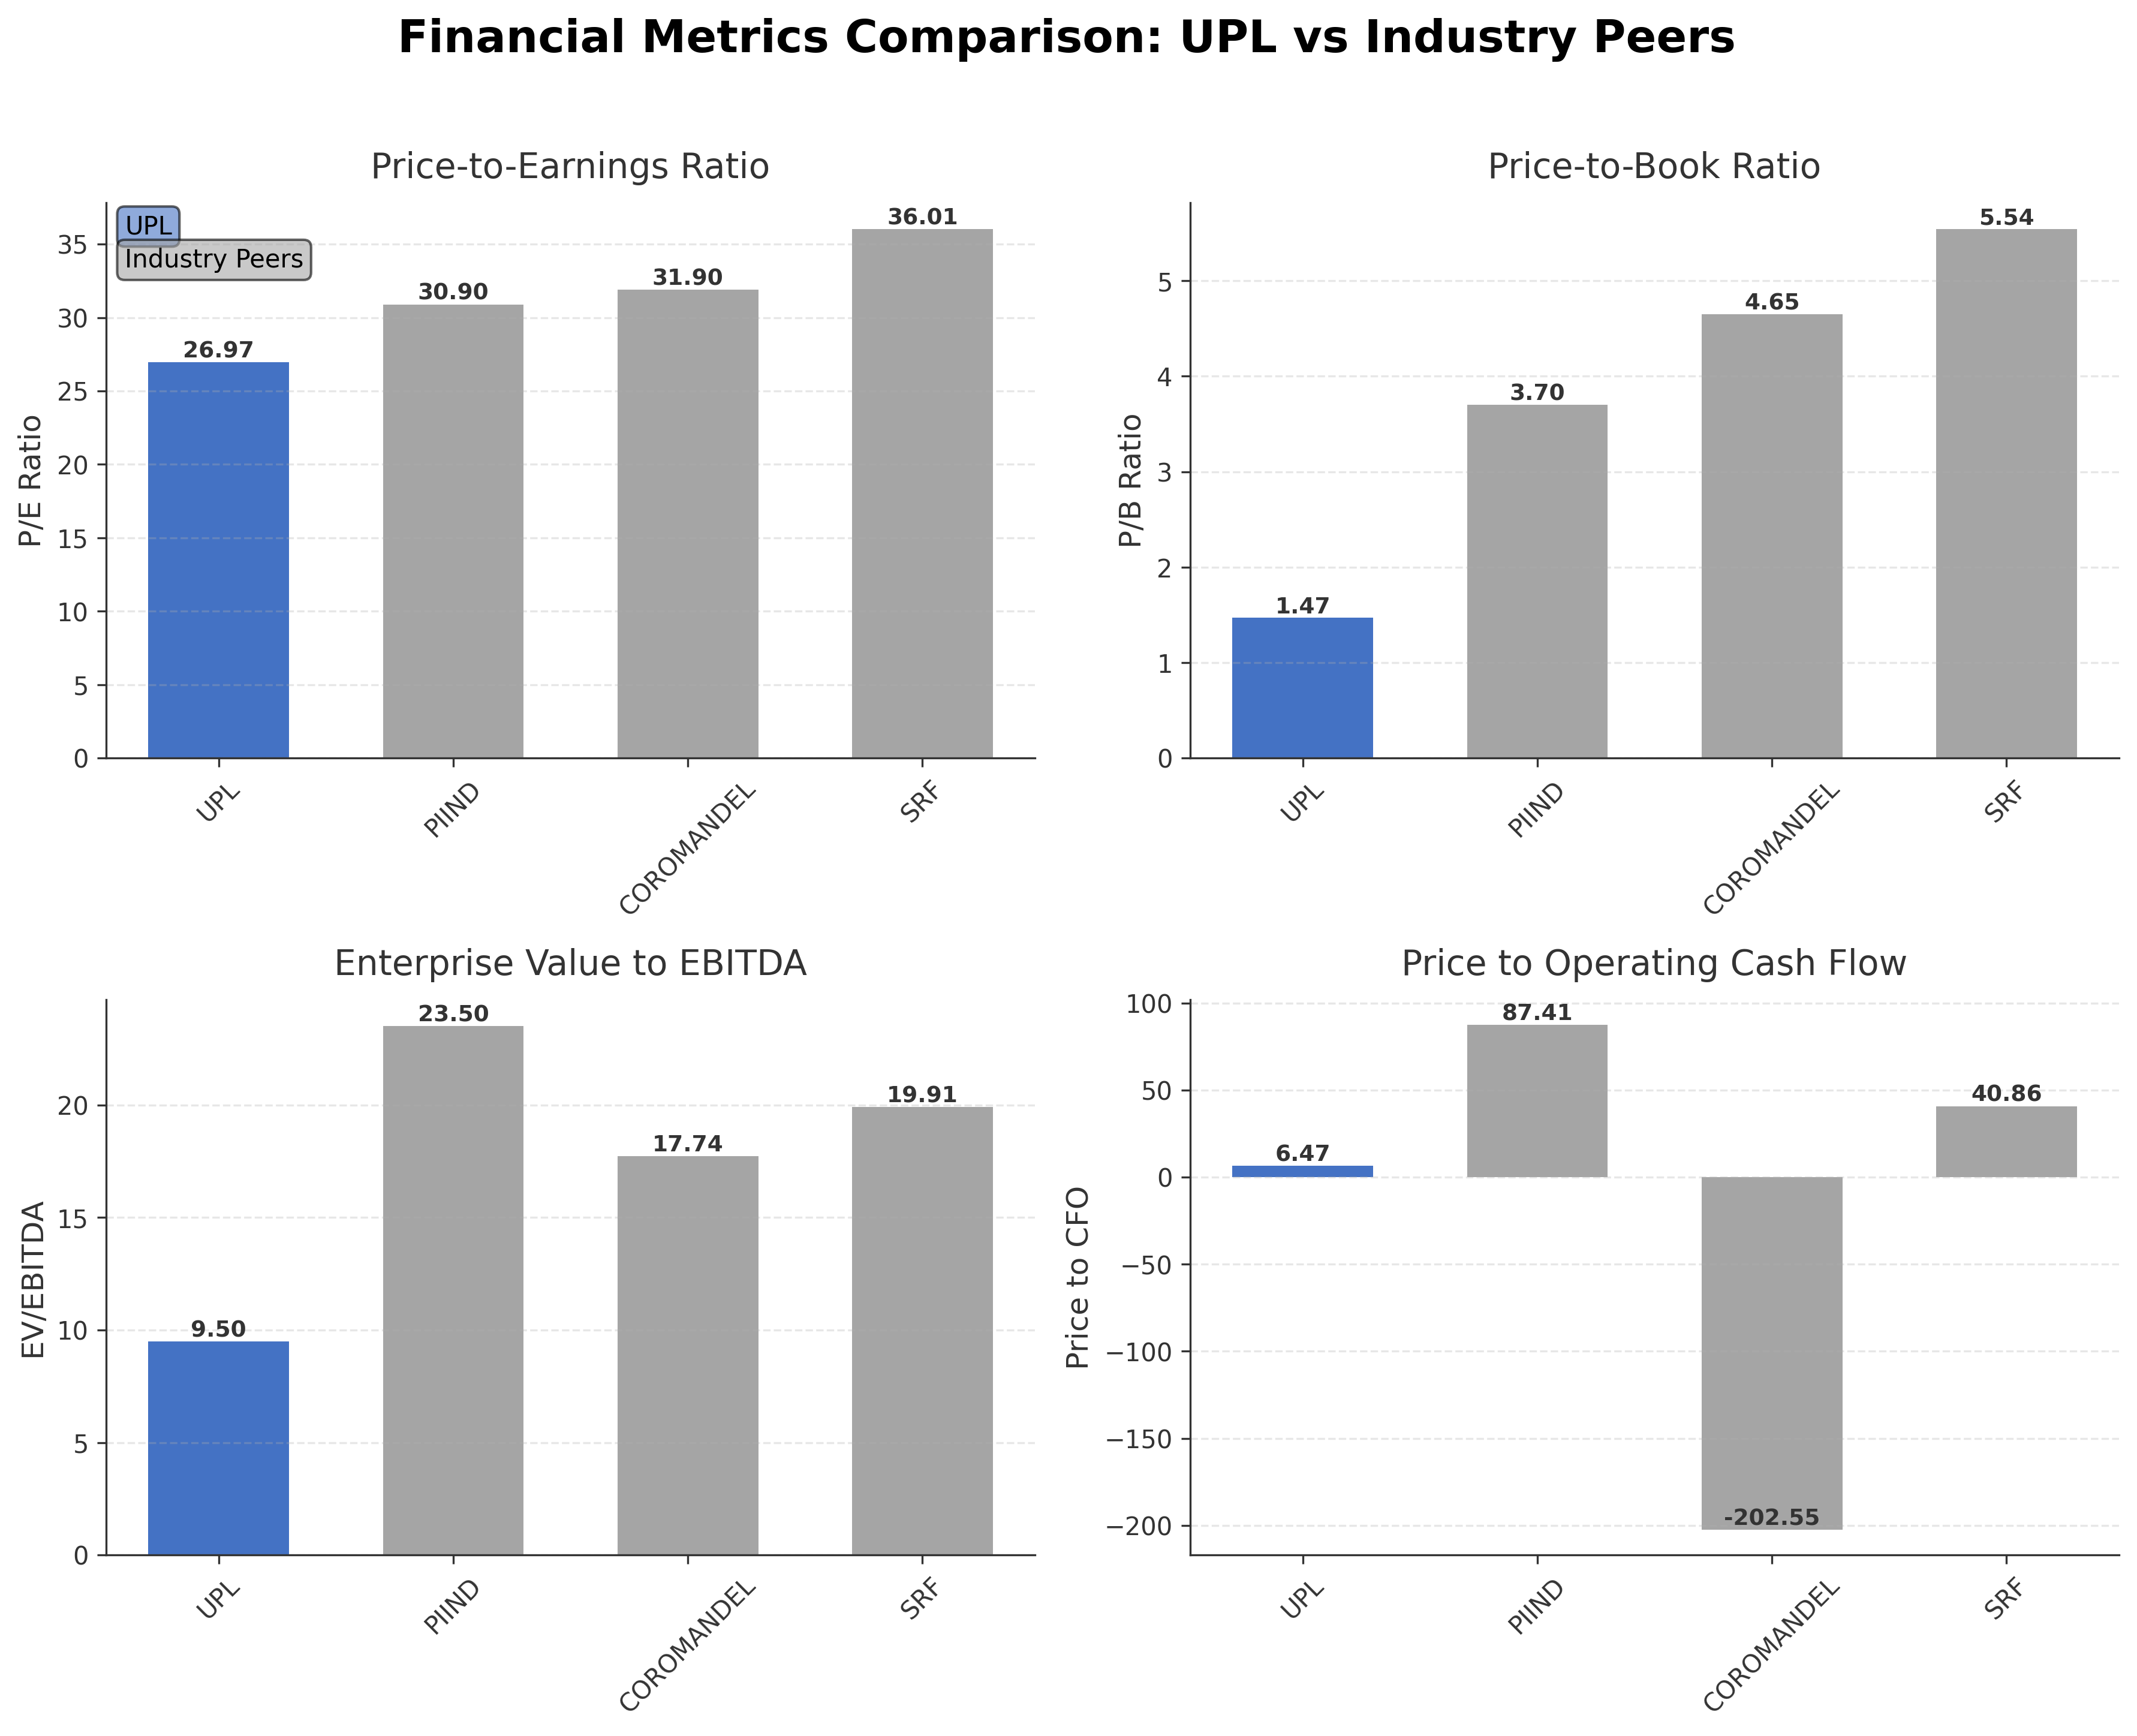
| UPL Ltd. | ₹508.57B | 26.97 | 1.47 | 9.50 | 6.47 |
| PI Industries Ltd. | ₹414.34B | 30.90 | 3.70 | 23.50 | 87.41 |
| Coromandel International Ltd. | ₹583.34B | 31.90 | 4.65 | 17.74 | -202.55 |
| SRF Ltd. | ₹789.83B | 36.01 | 5.54 | 19.91 | 40.86 |
Comparison Analysis: UPL Ltd. trades at a lower P/E ratio of 26.97 compared to its peers PI Industries, Coromandel International, and SRF Ltd., which range from 30.90 to 36.01, indicating relatively more attractive earnings valuation. Its price-to-book ratio of 1.47 is significantly lower than the peer group’s 3.70 to 5.54 range, suggesting a more conservative market valuation relative to book value. The EV/EBITDA multiple of 9.50 is also below peers’ 17.74 to 23.50, reflecting potentially better operational valuation. However, UPL’s return on equity at 5.61% is notably lower than peers who report ROEs above 12%, indicating comparatively lower profitability. Price to CFO for UPL is 6.47, much lower than peers, which may reflect differences in cash flow generation or capital structure.
Financial Metrics Comparison with Peers
Financial Statements
Comprehensive financial data including income, balance sheet, and cash flow metrics
Income Statement
| fiscal_date | 2026-03-31 | 2025-03-31 | 2024-03-31 | 2023-03-31 | 2022-03-31 |
|---|---|---|---|---|---|
| Sales | 513.03B | 462.62B | 425.99B | 531.34B | 459.71B |
| Cost Of Goods | 262.15B | 245.26B | 247.67B | 276.21B | 223.86B |
| Gross Profit | 250.88B | 217.36B | 178.32B | 255.13B | 235.85B |
| Operating Expense Research And Development | 1.23B | 1.08B | 1.25B | 1.22B | 1.00B |
| Operating Expense Selling General And Administrative | 21.69B | 18.59B | 19.80B | 23.60B | 18.42B |
| Operating Expense Other Operating Expenses | 65.47B | 58.67B | 52.12B | 65.36B | 66.10B |
| Operating Income | 71.03B | 56.20B | 28.48B | 87.50B | 78.02B |
| Non Operating Interest Income | 5.26B | 3.47B | 4.49B | 3.41B | 1.59B |
| Non Operating Interest Expense | 28.53B | 32.32B | 33.78B | 29.84B | 17.75B |
| Pretax Income | 31.57B | 8.29B | -20.87B | 51.50B | 49.66B |
| Income Tax | 9.37B | 90.00M | -2.09B | 7.36B | 5.29B |
| Net Income | 22.20B | 8.20B | -18.78B | 44.14B | 44.37B |
| Eps Basic | 22.32 | 9.66 | -17.07 | 43.92 | 44.00 |
| Eps Diluted | 22.32 | 9.62 | -17.07 | 43.92 | 44.00 |
| Basic Shares Outstanding | 829.92M | 786.00M | 782.50M | 782.50M | 796.51M |
| Diluted Shares Outstanding | 829.92M | 786.00M | 782.50M | 782.50M | 796.51M |
| Ebit | 60.10B | 40.61B | 12.91B | 81.34B | 67.41B |
| Ebitda | 99.16B | 73.83B | 43.87B | 109.67B | 93.78B |
| Net Income Continuous Operations | 31.57B | 8.29B | -20.87B | 51.50B | 49.66B |
| Minority Interests | -2.98B | 770.00M | 6.78B | -8.44B | -8.11B |
| Preferred Stock Dividends | 700.00M | 1.38B | 1.36B | 1.35B | 1.21B |
Data provided by Twelve Data
Balance Sheet
| fiscal_date | 2026-03-31 | 2025-03-31 | 2024-03-31 | 2023-03-31 | 2022-03-31 |
|---|---|---|---|---|---|
| Cash And Cash Equivalents | 59.75B | 94.78B | 59.43B | 59.67B | 57.97B |
| Accounts Receivable | 187.09B | 159.94B | 166.80B | 182.82B | 158.43B |
| Total Assets | 952.05B | 880.02B | 875.46B | 885.77B | 826.79B |
| Total Liabilities | 539.36B | 501.76B | 548.40B | 531.48B | 533.71B |
| Long Term Debt | 165.56B | 192.56B | 249.68B | 208.19B | 222.31B |
| Shareholders Equity | 412.69B | 378.26B | 327.06B | 354.29B | 293.08B |
Data provided by Twelve Data
Cash Flow Statement
| fiscal_date | 2026-03-31 | 2025-03-31 | 2024-03-31 | 2023-03-31 | 2022-03-31 |
|---|---|---|---|---|---|
| Operating Activities Net Income | 31.57B | 8.29B | -20.87B | 51.50B | 49.66B |
| Operating Activities Stock Based Compensation | 700.00M | 390.00M | 70.00M | 1.33B | 0.00 |
| Operating Activities Other Non Cash Items | 22.23B | 32.05B | 29.38B | 26.63B | 16.17B |
| Operating Activities Accounts Receivable | -45.00B | 5.60B | 14.87B | -21.24B | -30.91B |
| Operating Activities Other Assets Liabilities | -23.60B | 24.60B | -1.16B | 5.94B | -25.03B |
| Operating Activities Operating Cash Flow | 78.55B | 101.51B | 22.29B | 64.16B | 9.89B |
| Investing Activities Net Intangibles | -7.40B | -8.82B | -8.36B | -6.88B | -6.66B |
| Investing Activities Net Acquisitions | -220.00M | -6.80B | N/A | -560.00M | -1.30B |
| Investing Activities Purchase Of Investments | -4.30B | -570.00M | -8.81B | -6.19B | -14.26B |
| Investing Activities Sale Of Investments | 250.00M | 340.00M | 840.00M | 13.00B | 160.00M |
| Investing Activities Other Investing Activity | -2.07B | -1.85B | -1.36B | -350.00M | 1.32B |
| Investing Activities Investing Cash Flow | -6.34B | -8.88B | -20.51B | -10.11B | -33.07B |
| Financing Activities Long Term Debt Payments | -47.42B | -21.37B | -16.61B | -78.64B | -84.64B |
| Financing Activities Short Term Debt Issuance | 5.75B | -32.17B | 31.53B | -28.94B | 25.77B |
| Financing Activities Common Stock Issuance | 17.00B | 16.33B | N/A | 40.54B | 0.00 |
| Financing Activities Common Dividends | -4.78B | -770.00M | -7.49B | -7.50B | -7.64B |
| Financing Activities Other Financing Charges | -34.09B | 28.63B | N/A | 32.36B | N/A |
| Financing Activities Financing Cash Flow | -63.54B | -9.35B | 40.56B | 5.90B | 5.42B |
| End Cash Position | 59.75B | 94.78B | 59.43B | 59.67B | 57.97B |
| Free Cash Flow | 54.49B | 84.56B | -1.73B | 53.91B | 38.08B |
| Financing Activities Long Term Debt Issuance | N/A | 0.00 | 33.13B | 61.63B | 71.93B |
| Investing Activities Capital Expenditures | N/A | N/A | -11.18B | -16.01B | -18.99B |
| Financing Activities Common Stock Repurchase | N/A | N/A | 0.00 | -13.55B | 0.00 |
Data provided by Twelve Data
Technical Analysis
Key Insights
- UPL’s current trend shows a recent decline with price trading below the 200-day moving average (₹678.67) but near the 50-day moving average (₹614.45), indicating short-term consolidation within a longer-term bearish context.
- Key support levels are identified near the 52-week low of ₹563.15, while resistance is observed around the 50-day moving average at ₹614 and the 200-day moving average at ₹678.
- Price is currently below the 200-day MA but close to the 50-day MA, suggesting mixed momentum with potential for either recovery or further downside depending on market catalysts.
- Momentum indicators show a moderate Relative Strength Index (RSI) near neutral levels, a MACD that is close to its signal line indicating indecision, and a Stochastic oscillator reflecting a non-overbought condition.
- Across daily, weekly, and monthly timeframes, the stock exhibits consolidation with no clear breakout, maintaining a range-bound pattern between support and resistance levels.
- Potential market scenarios include a rebound if the price breaks above the 50-day and 200-day moving averages or continued pressure if support near ₹563 is breached, with volume and momentum indicators likely to guide near-term direction.
Trending News
1. Headline: Upland Software director Timothy Mattox sells $4,270 in stock By Investing.com
Summary: According to InvestingPro analysis, the stock appears undervalued at current levels, with a Fair Value of $6.88. Investors seeking deeper insights can access comprehensive analysis through UPLD’s Pro Research Report, available for this and 1,400+ other US equities. In other recent news, Upland ...
Sentiment: negative
2. Headline: UPL Limited Beat Analyst Estimates: See What The Consensus Is Forecasting For This Year - Simply Wall St News
Summary: UPL Limited ( NSE:UPL ) shareholders are probably feeling a little disappointed, since its shares fell 5.2% to ₹577 in...
Sentiment: negative
3. Headline: UPL stays on growth path despite geopolitical risks, demand uncertainty | Markets News - Business Standard
Summary: Revenue and operating profit rose for the seventh straight quarter, but investors remain focused on management changes, volume recovery, Advanta listing and restructuring.
Sentiment: positive
4. Headline: UPL Stock Falls 5% Despite Revenue Surge As Company Announces Change In Management
Summary: UPL stock falls on Jefferies TP cut and Mgmt rejig. Photo Source: NDTV Profit/AI Generated · UPL Ltd.'s stock slumped over 5% to a low of Rs 585 even as revenue rose for the first quarter of financial year 2027.
Sentiment: negative
5. Headline: UPL Q1 Results Today: Time, Earnings Call, Dividend, What To Watch, Share Price Performance
Summary: UPL Ltd. will announce its Q1 FY27 earnings on Monday, August 3, with investors closely tracking margin recovery, demand trends in global crop protection markets, debt reduction and management commentary after the company's recent restructuring initiatives. Here is everything you need to know about UPL's Q1FY27 earnings schedule. In a stock ...
Sentiment: neutral
Powered by Brave
Recent Updates
News Summary
As of the most recent reports, UPL Limited has demonstrated strong operational performance by beating analyst earnings estimates despite challenging market conditions. The company reported steady revenue growth and profitability improvements, supported by effective management strategies and resilience in global agricultural markets. Recent disclosures highlight ongoing corporate governance initiatives including stock exchange approvals for restructuring schemes and management changes aimed at enhancing efficiency. Investor resources such as quarterly financial results, annual reports, and sustainability disclosures have been updated to provide transparency and support informed stakeholder engagement. These developments collectively underscore UPL’s focus on growth, operational discipline, and strategic positioning within the agrochemical sector.
News Sentiment
The overall sentiment from recent updates is cautiously positive, driven by earnings beats and sustained revenue growth. Positive tones stem from operational resilience and strategic restructuring efforts, while neutral sentiments reflect ongoing monitoring of management changes and market uncertainties. Negative sentiments are limited and primarily related to stock price reactions following leadership announcements. The balance of news suggests a stable outlook with emphasis on execution and governance as key factors influencing future performance.
Source List
- https://simplywall.st/stocks/in/materials/nse-upl/upl-shares/news/upl-limited-beat-analyst-estimates-see-what-the-consensus-is-1
- https://www.upl-ltd.com/investors
- https://www.upl-ltd.com/investors/financial-results-and-reports/financial-results
- https://www.upl-ltd.com/investors/shareholder-center/announcements-and-updates
- https://www.upl-ltd.com/investors/financial-results-and-reports/investor-presentation
Analytical Overview
Analysis Summary
UPL Ltd.’s valuation metrics show a trailing P/E of 26.97 and a forward P/E of 12.57, which are below the industry average P/E of approximately 27, indicating a relatively attractive valuation compared to peers. The PEG ratio of 0.91 suggests the stock is reasonably valued relative to its earnings growth prospects. Revenue growth of 17.7% year-over-year and positive cash flow trends, including operating cash flow of INR 78.55 billion and levered free cash flow of INR 22.77 billion, demonstrate a solid growth trajectory and operational cash generation.
The company’s financial health is supported by a moderate debt-to-equity ratio of 57.13% and a current ratio of 1.22, indicating adequate liquidity to meet short-term obligations. However, the return on equity of 5.61% is lower than some peers, reflecting room for improvement in profitability. Sector-specific challenges include regulatory scrutiny and geopolitical risks impacting agricultural inputs, while opportunities arise from global demand for sustainable crop protection solutions and expanding emerging market penetration.
Considering India-specific factors, UPL benefits from a supportive regulatory environment for agrochemicals, growing agricultural demand, and increasing focus on sustainability. The company’s extensive global footprint and R&D initiatives position it well to capitalize on evolving consumer trends and economic growth in key markets.
Overall Business and Market Assessment
Supporting Factors: UPL’s strong revenue growth of 17.7%, robust cash flow generation with operating cash flow of INR 78.55 billion, and a reasonable valuation with a forward P/E of 12.57
Risk Factors: the company’s relatively modest return on equity of 5.61%, exposure to regulatory and geopolitical uncertainties, and recent management restructuring that may affect near-term execution
SWOT Analysis
Strengths
- Strong global presence with operations in over 130 countries.
- Robust revenue growth of 17.7% year-over-year.
- Healthy operating cash flow of INR 78.55 billion supporting financial flexibility.
- Reasonable valuation metrics compared to industry peers.
Weaknesses
- Return on equity at 5.61% is lower than key competitors.
- Moderate debt-to-equity ratio of 57.13% indicates leverage risk.
- Recent management changes may introduce short-term operational uncertainty.
- Net profit margin of 3.71% reflects limited bottom-line efficiency.
Opportunities
- Growing demand for sustainable agricultural inputs globally.
- Expansion potential in emerging markets with increasing crop protection needs.
- Strategic acquisitions and partnerships to enhance product portfolio.
- Increased focus on R&D for innovative and environmentally friendly solutions.
Threats
- Regulatory challenges and compliance risks in multiple jurisdictions.
- Geopolitical risks affecting global supply chains and market demand.
- Intense competition within the agrochemical industry.
- Volatility in raw material prices impacting cost structures.
Company Description
UPL Ltd. is a multinational agrochemical company that provides innovative crop protection and agriculture solutions globally. The primary function of UPL Ltd. is to foster sustainable agriculture through the provision of agrochemicals, specialty chemicals, and industrial chemicals. UPL's offerings include herbicides, insecticides, fungicides, plant growth regulators, and rodenticides, crucial for improving crop yield and quality. Operating across more than 130 countries, UPL Ltd. has extensive reach and plays a significant role in the agricultural industry by enhancing productivity and supporting food security. The company’s Research & Development initiatives focus on sustainability, helping to address challenges such as pest resistance and environmental impact. UPL Ltd.'s strategic acquisitions and partnerships enable it to expand its market presence and drive innovation within the sector. The company is a vital player in shaping agricultural practices and significantly contributes to the global food supply chain, holding a strong market position among leading agrochemical firms.