
TVS Supply Chain Solutions Limited (TVSSCS)
Stock Analysis Report
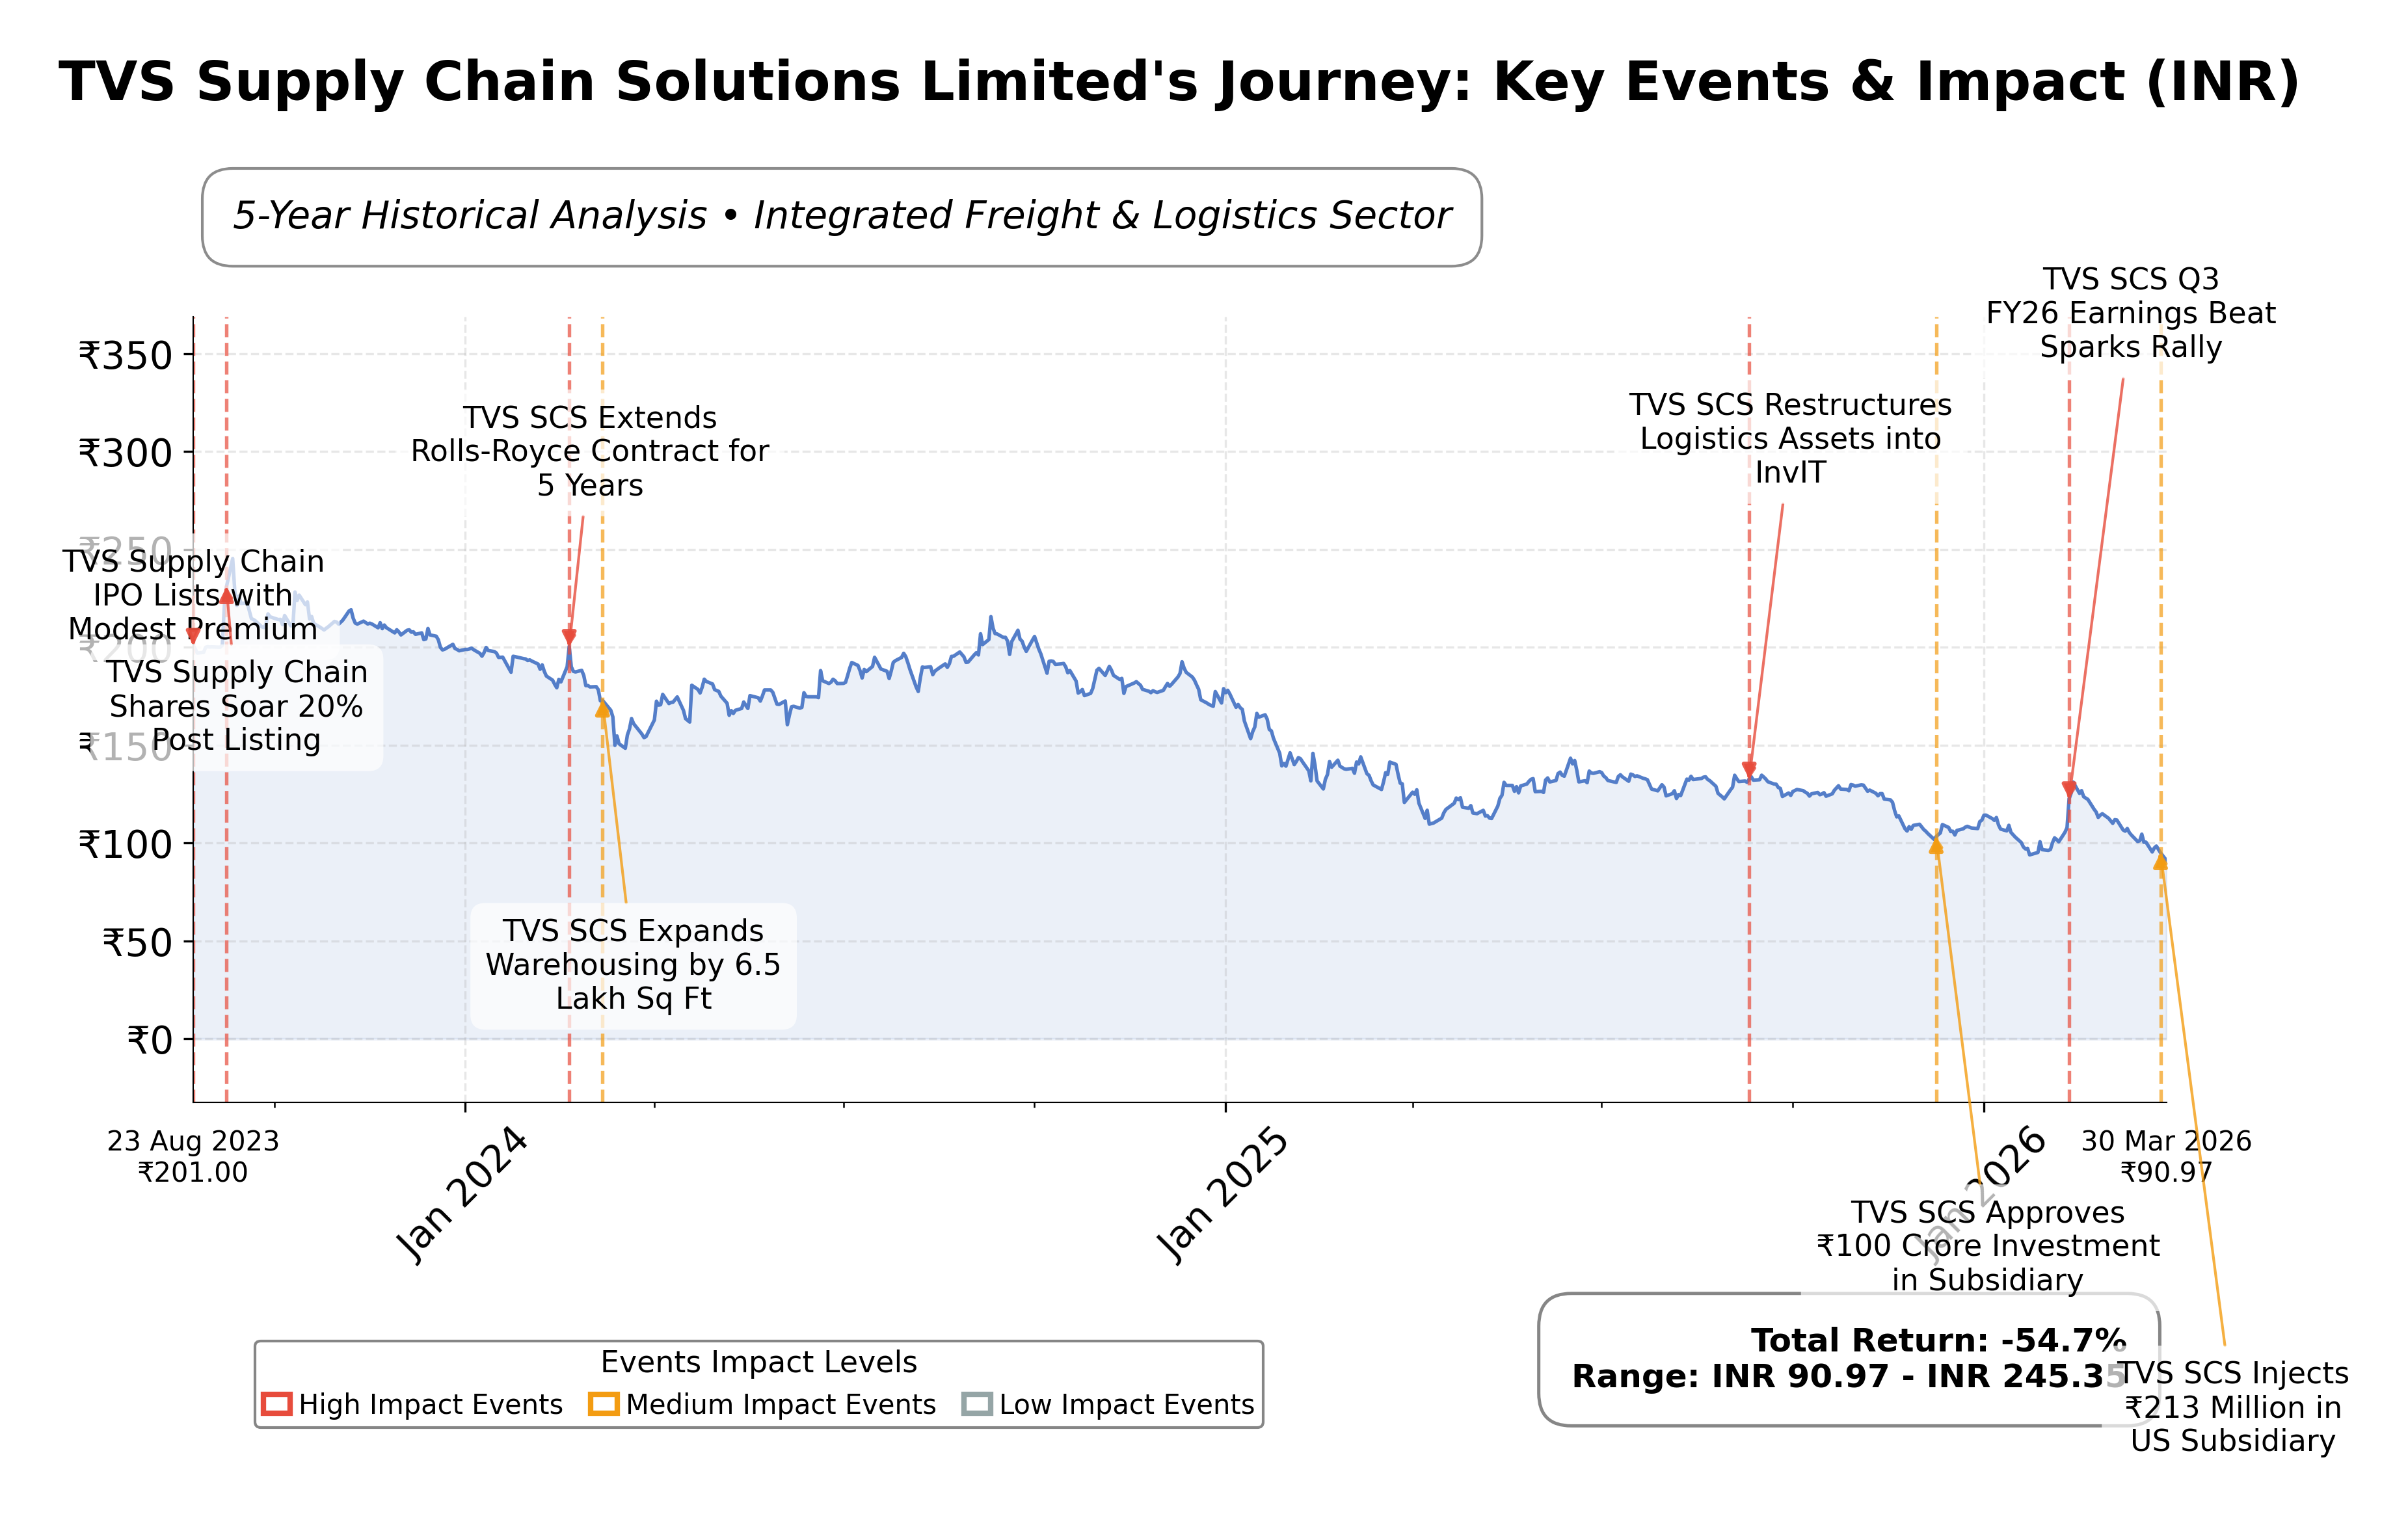
Stock Journey
Key Positives and Key Risks
Pros
- Revenue growth of 11.1% year-over-year indicates stable top-line expansion.
- Positive operating cash flow of INR 1.91 billion supports operational liquidity.
- Strategic expansion into aerospace and defence supply chain markets enhances growth potential.
Cons
- High debt-to-equity ratio of 112.34 signals elevated financial leverage risk.
- Negative return on equity (-0.74%) reflects challenges in profitability.
- Recent share price decline with downside risk of 38.82% from 52-week high indicates market volatility.
Disclosure: This information is for general awareness and does not constitute investment advice
Report Summary
TVS Supply Chain Solutions Limited operates as a key player in the integrated freight and logistics sector in India, providing comprehensive supply chain management services including warehousing, transportation, inventory management, and distribution. The company serves diverse industries such as automotive, consumer goods, industrial products, and technology, leveraging advanced technology and automation to optimize logistics operations. Positioned within the TVS Group, it benefits from a strong legacy and extensive infrastructure supporting global trade facilitation.
Financially, TVS Supply Chain Solutions reported a trailing twelve months (TTM) revenue of approximately INR 104.7 billion with a modest profit margin of 0.88%. The stock trades at a trailing P/E of 45.69 and a forward P/E of 25.69, with a price-to-book ratio of 2.12 and an enterprise value to EBITDA multiple of 17.23. The companyâs return on equity and assets remain slightly negative, reflecting challenges in profitability despite revenue growth of 11.1% year-over-year. Cash flow metrics indicate positive operating cash flow but a slightly negative free cash flow position.
From a technical and strategic perspective, TVS Supply Chain Solutions has recently infused capital into its US subsidiary to support working capital needs and continues to strengthen global supply chains for major clients like Caterpillar. Leadership comments suggest limited direct impact from geopolitical tensions, though recent market activity shows selling pressure and technical weakness. Key risks include high debt-to-equity ratio (112.34) and modest profitability, while strengths lie in technology integration and diversified service offerings.
Peer comparison within the Indian integrated logistics sector reveals that TVS Supply Chain Solutions operates at a smaller market capitalization relative to peers like Delhivery Ltd. and Blue Dart Express Ltd. It maintains valuation multiples generally lower than Delhivery but comparable to Blue Dart, with a notably lower return on equity. This positioning highlights a competitive landscape with varying growth and profitability profiles among regional players.
TVS Supply Chain Solutions stands at a pivotal juncture, balancing ongoing expansion efforts and operational challenges amid a complex industry environment. Recent capital infusions and strategic partnerships underscore growth ambitions, while financial metrics and market sentiment reflect caution. The companyâs trajectory will significantly influence its ability to capitalize on emerging opportunities in Indiaâs growing logistics sector. Given the current data, a neutral and observant stance may be appropriate for those monitoring the stockâs evolving fundamentals and market dynamics.
Company and Industry Overview
Company Basics
Price Performance
Company Size
Shareholding Pattern
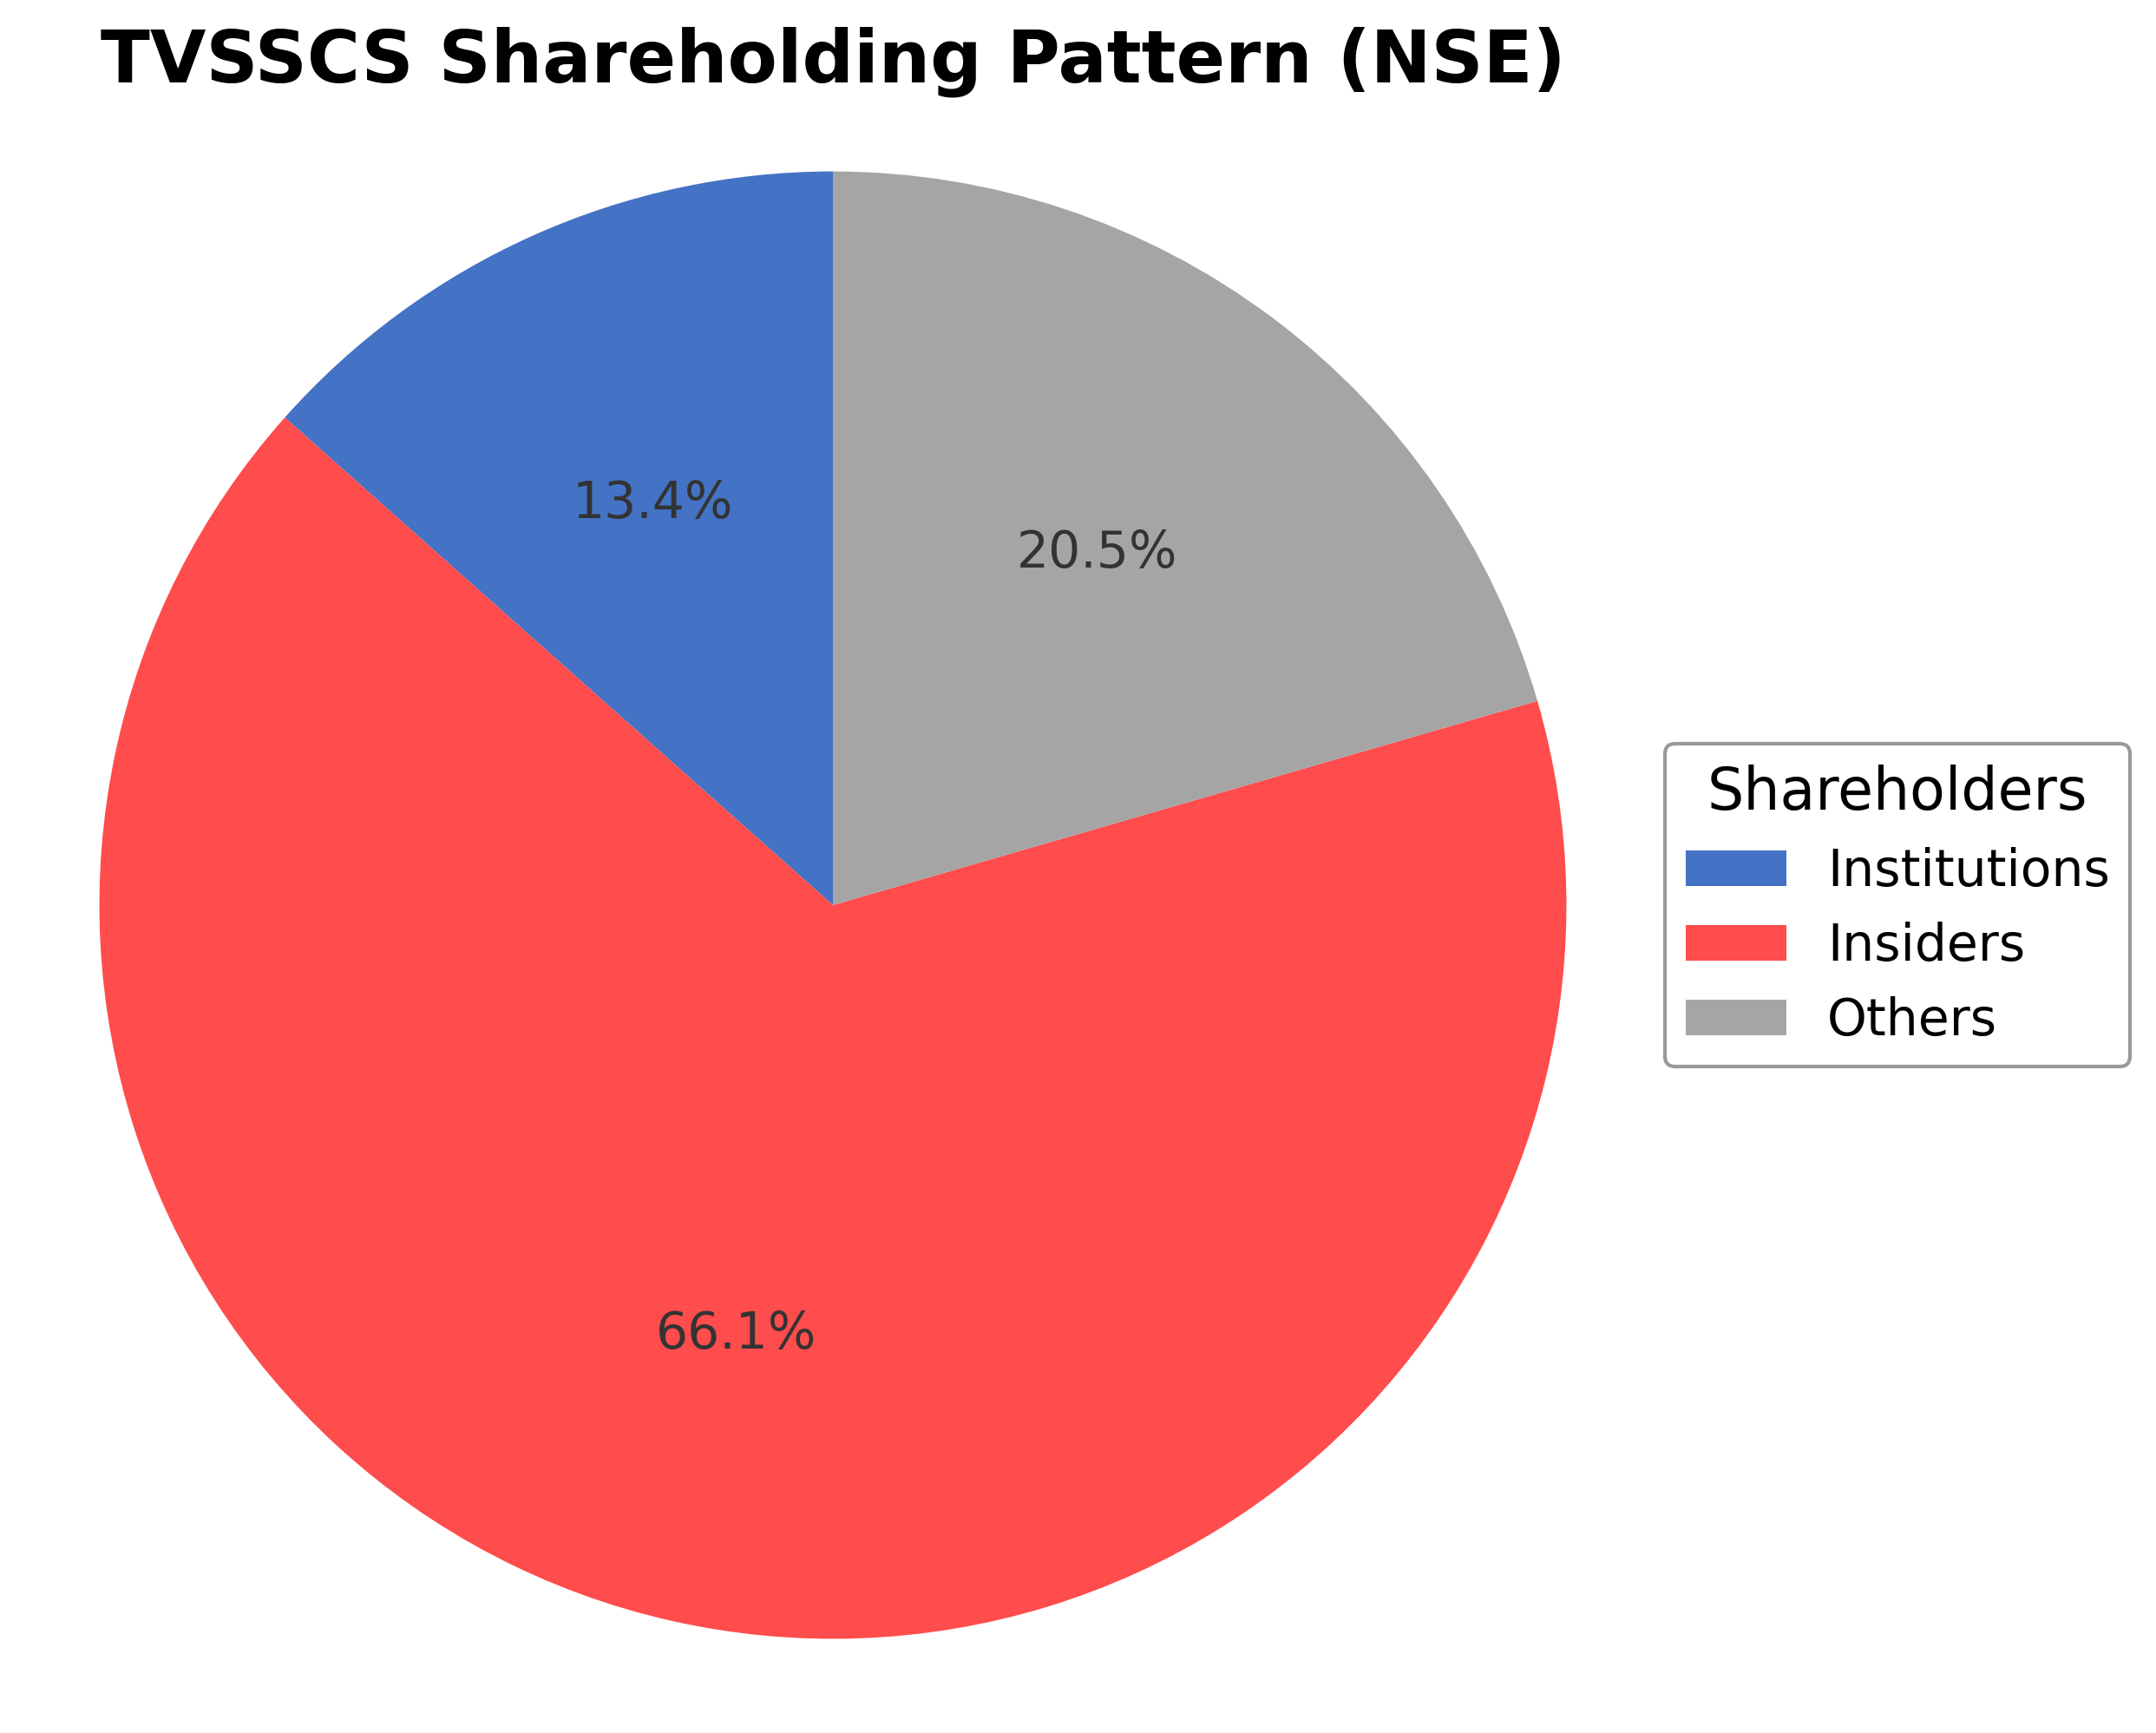
The shareholding structure of TVS Supply Chain Solutions Limited is predominantly held by insiders, including executives and board members, accounting for 66.06% ownership. Institutional investors such as mutual funds and asset managers hold approximately 13.43%, while the remaining 20.51% is held by public shareholders including retail investors and employee stock plans. Over the past 12 to 24 months, there have been no significant shifts in promoter holdings, indicating stable insider confidence. Institutional ownership shows moderate accumulation with some major funds increasing positions, reflecting measured interest in the company. These patterns suggest a governance framework influenced strongly by promoters, with institutional participation providing additional oversight. The ownership mix may impact strategic decisions and corporate actions, balancing legacy control with external investor expectations in a competitive logistics industry.
Sector and Industry Analysis
TVS Supply Chain Solutions Limited (TVSSCS) operates within the logistics and supply chain management sector, a critical component of the broader transportation and industrial services industry. Globally, the supply chain sector is sizable and expanding, driven by increasing globalization, e-commerce proliferation, and the rising complexity of manufacturing and distribution networks. The market size is estimated in the trillions of dollars worldwide, with compound annual growth rates (CAGR) typically ranging from 7% to 10%, reflecting robust demand for integrated logistics solutions. Key global players include DHL Supply Chain, Kuehne + Nagel, DB Schenker, and C.H. Robinson, alongside regional leaders such as TVS Supply Chain Solutions in India, which leverage local expertise and technology to capture market share.
Industry trends are heavily influenced by technological advancements and shifting consumer expectations. Digital transformation through automation, Internet of Things (IoT), artificial intelligence (AI), and blockchain is reshaping supply chain visibility, efficiency, and resilience. The rise of e-commerce has accelerated demand for last-mile delivery, real-time tracking, and flexible warehousing solutions. Sustainability is becoming a strategic priority, with companies adopting green logistics practices to reduce carbon footprints. Additionally, supply chain disruptions caused by geopolitical tensions and the COVID-19 pandemic have underscored the importance of agility and risk management, prompting investments in diversified sourcing and inventory optimization technologies.
The regulatory environment for supply chain companies is multifaceted, encompassing customs and trade compliance, environmental regulations, labor laws, and safety standards. In India, where TVS Supply Chain Solutions is headquartered, regulations such as the Goods and Services Tax (GST) have streamlined interstate logistics but also imposed compliance complexities. Internationally, evolving trade policies, tariffs, and sanctions impact cross-border logistics operations. Compliance with environmental regulations, including emissions standards and waste management, is increasingly stringent, compelling logistics providers to innovate in fleet management and packaging. Data privacy laws also affect the handling of customer and operational data, especially with the integration of digital technologies.
Competitive dynamics in the supply chain sector are characterized by moderate to high barriers to entry due to capital intensity, technology requirements, and the necessity of an extensive logistics network. Established players benefit from scale economies, long-term client relationships, and integrated service offerings spanning transportation, warehousing, and value-added services. Differentiation often hinges on technological capabilities, service reliability, and geographic reach. The sector sees ongoing consolidation through mergers and acquisitions as companies seek to enhance capabilities and market presence. For TVS Supply Chain Solutions, competitive positioning is strengthened by its parentage within the TVS Group, extensive domestic network, and focus on technology-enabled solutions, enabling it to compete effectively against both multinational and local logistics providers.
Note: Analysis synthesized from industry research, market reports, and regulatory filings. Information is subject to change based on market conditions.
Illustrative Scenario Analysis
DCF Assumptions:
Method: Two-Stage EPS-Priority Model
Financials
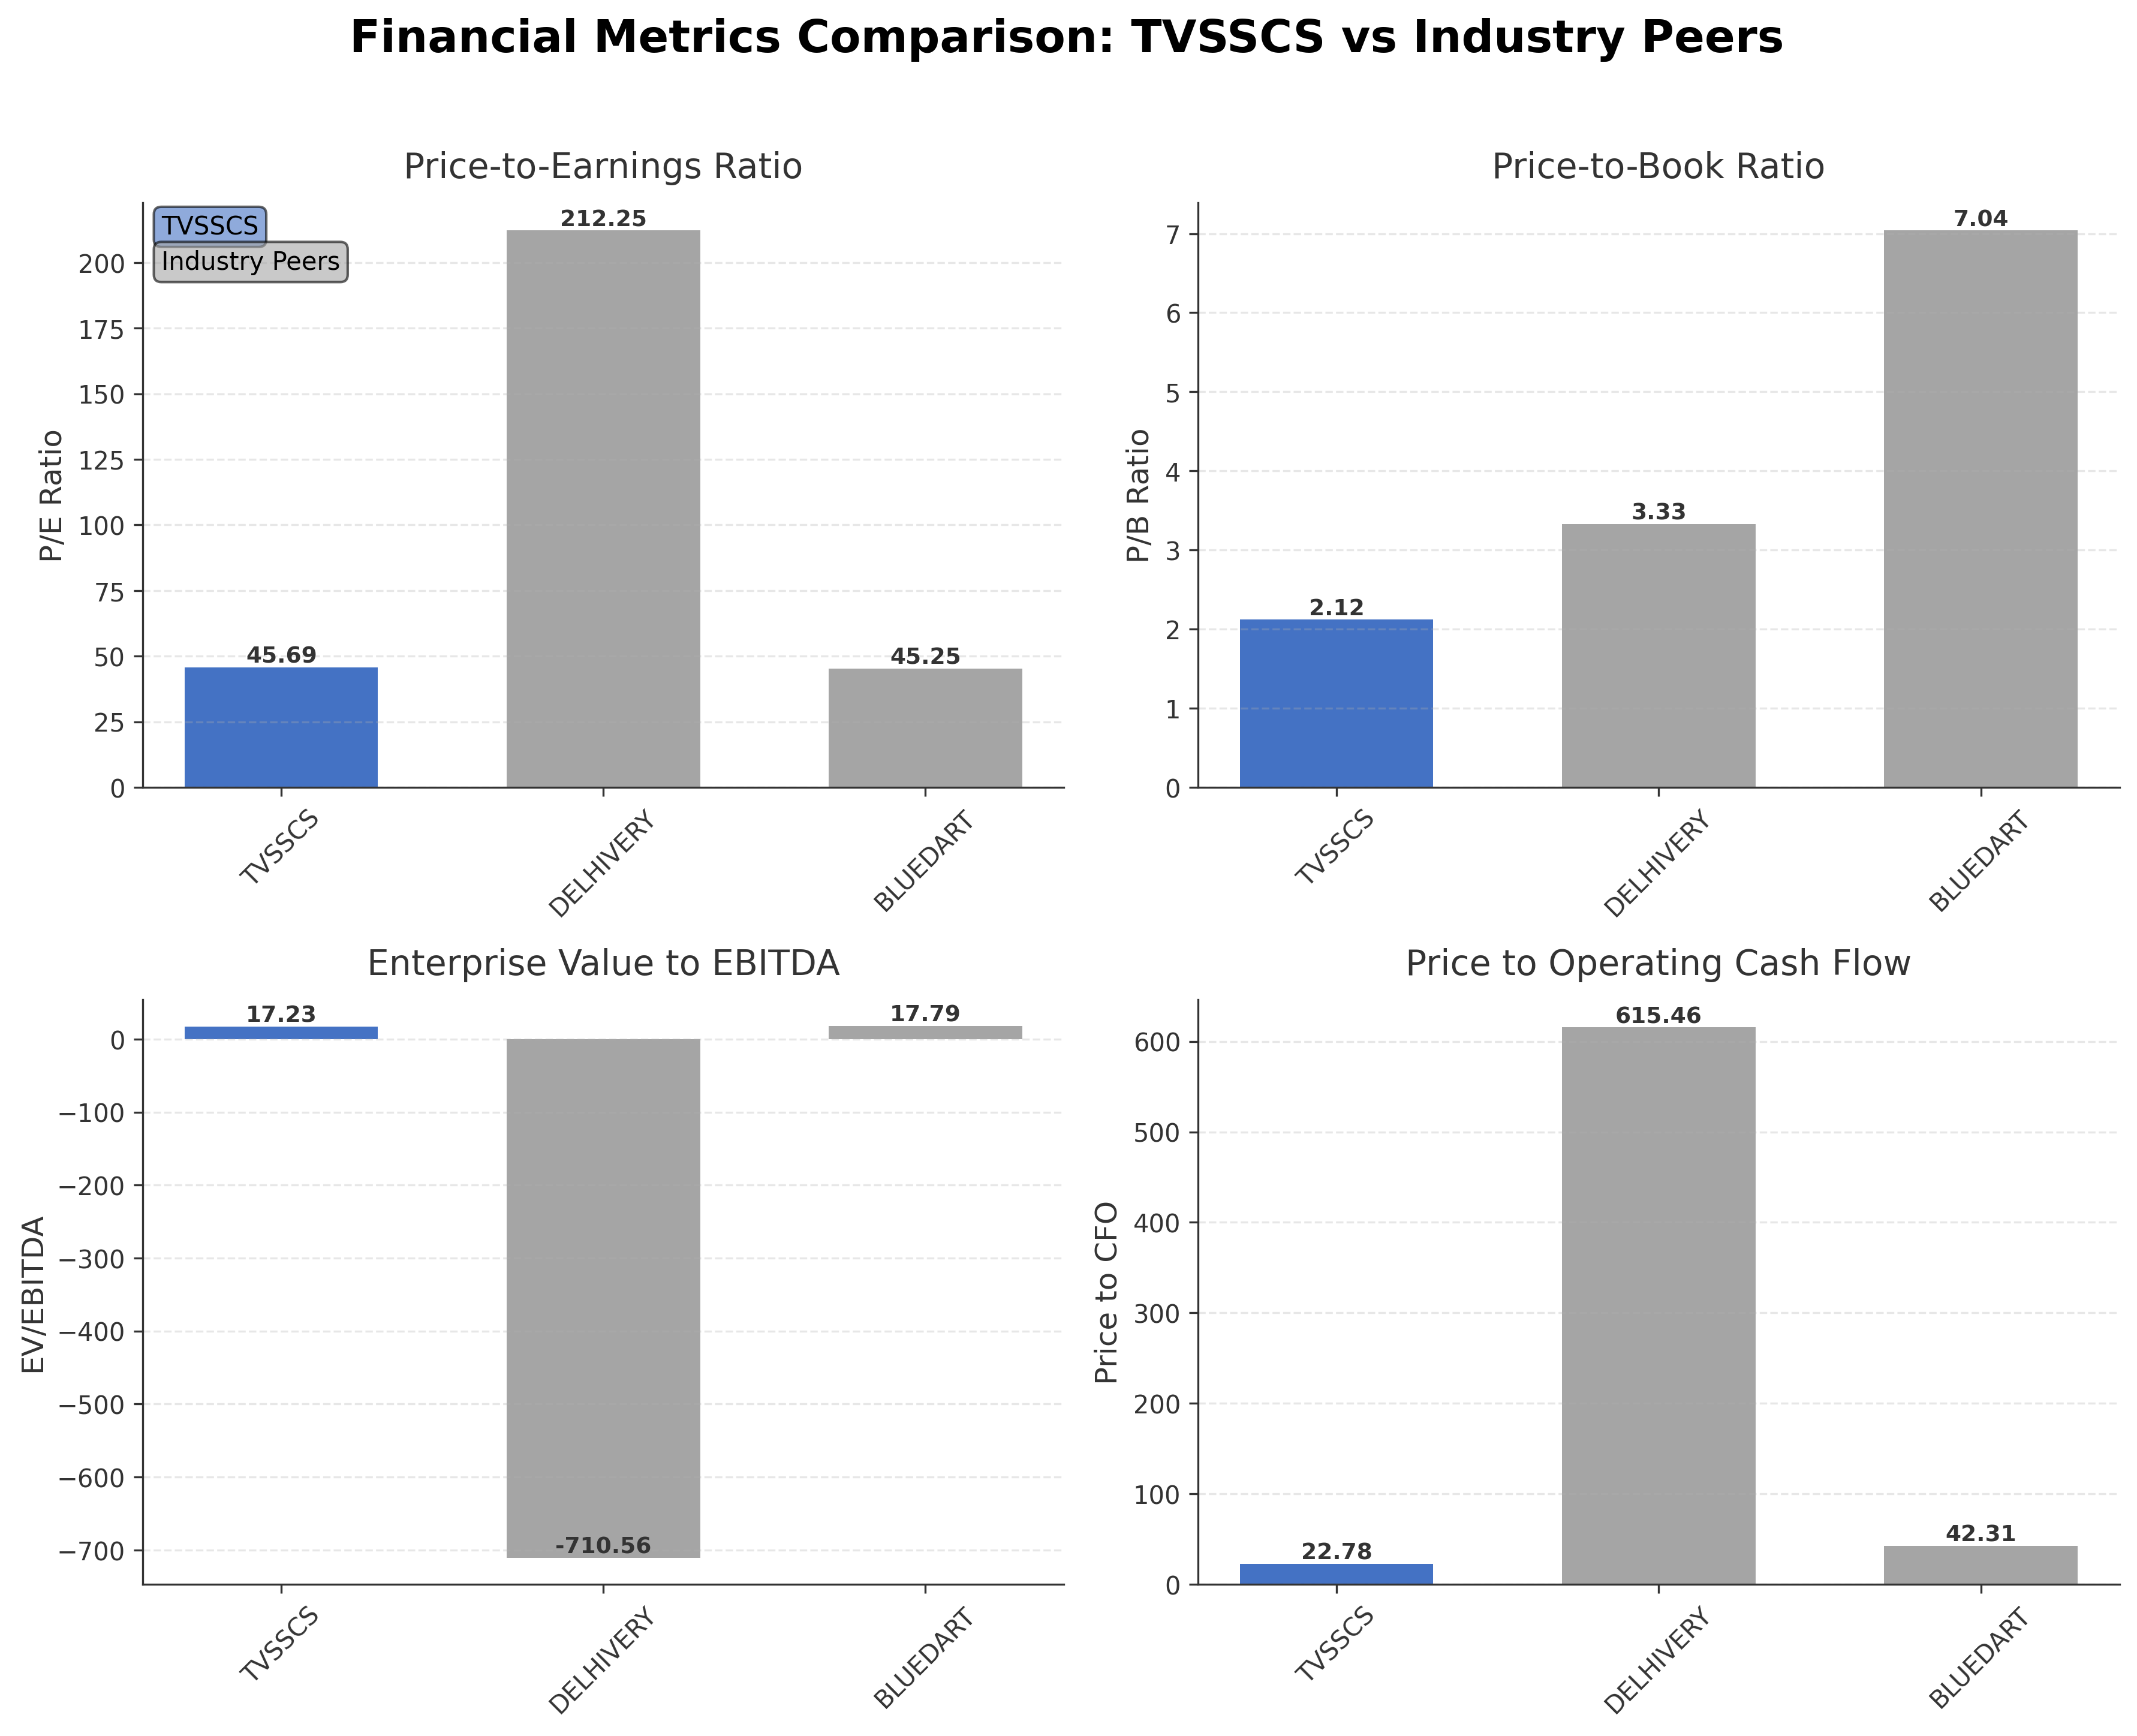
Peer Analysis
| Company Name | Market Cap | P/E Ratio | P/B Ratio | EV/EBITDA | Price to CFO |
|---|---|---|---|---|---|
| TVS Supply Chain Solutions Limited | ₹43.45B | 45.69 | 2.12 | 17.23 | 22.78 |
| Delhivery Ltd. | ₹323.20B | 212.25 | 3.33 | -710.56 | 615.46 |
| Blue Dart Express Ltd. | ₹119.98B | 45.25 | 7.04 | 17.79 | 42.31 |
Comparison Analysis: TVS Supply Chain Solutions Limited exhibits valuation metrics broadly aligned with Blue Dart Express Ltd., particularly in P/E and EV/EBITDA multiples, while maintaining a lower price-to-book ratio. Compared to Delhivery Ltd., TVS operates at a significantly smaller market capitalization and lower valuation multiples, reflecting differing growth profiles and profitability. Return on equity for TVS is slightly negative, contrasting with modest positive returns for peers, indicating relative challenges in generating shareholder returns. Price to cash flow ratios for TVS are substantially lower than Delhivery, suggesting more conservative cash flow valuation. Overall, TVS presents a more moderate valuation and financial profile within the Indian integrated logistics sector.
Financial Metrics Comparison with Peers
Financial Statements
Comprehensive financial data including income, balance sheet, and cash flow metrics
Income Statement
| fiscal_date | 2025-03-31 | 2024-03-31 | 2023-03-31 | 2022-03-31 | 2021-03-31 |
|---|---|---|---|---|---|
| Sales | 99.92B | 91.99B | 99.73B | 92.48B | 69.29B |
| Cost Of Goods | 90.97B | 84.35B | 91.97B | 39.38B | 34.87B |
| Gross Profit | 8.95B | 7.64B | 7.76B | 53.10B | 34.42B |
| Operating Expense Selling General And Administrative | 1.92B | 1.56B | 1.52B | 1.50B | 1.71B |
| Operating Expense Other Operating Expenses | 2.77B | 2.02B | 1.82B | 46.96B | 30.26B |
| Operating Income | 1.78B | 1.86B | 2.40B | 2.48B | 532.48M |
| Non Operating Interest Income | 194.40M | 317.50M | 130.50M | 120.85M | 82.46M |
| Non Operating Interest Expense | 1.47B | 1.79B | 1.70B | 1.37B | 1.52B |
| Pretax Income | 293.60M | -360.70M | 459.50M | 135.47M | -1.16B |
| Income Tax | 390.00M | 216.50M | -17.00M | 584.26M | -425.24M |
| Net Income | -96.40M | -904.90M | 417.60M | -458.00M | -763.44M |
| Eps Basic | -0.31 | -2.40 | 0.91 | -1.12 | -1.70 |
| Eps Diluted | -0.31 | -2.40 | 0.91 | -1.12 | -1.70 |
| Basic Shares Outstanding | 440.63M | 421.88M | 437.41M | 437.41M | 437.41M |
| Diluted Shares Outstanding | 440.63M | 421.88M | 437.41M | 437.41M | 437.41M |
| Ebit | 1.77B | 1.43B | 2.16B | 1.50B | 357.11M |
| Ebitda | 7.39B | 7.14B | 7.69B | 6.85B | 4.56B |
| Net Income Continuous Operations | 293.60M | -360.70M | 459.50M | 126.26M | -1.19B |
| Minority Interests | -39.50M | -107.20M | -19.50M | -33.02M | 20.03M |
| Preferred Stock Dividends | 0.00 | 0.00 | 0.00 | 0.00 | 0.00 |
Data provided by Twelve Data
Balance Sheet
| fiscal_date | 2025-03-31 | 2024-03-31 | 2023-03-31 | 2022-03-31 | 2021-03-31 |
|---|---|---|---|---|---|
| Cash And Cash Equivalents | 5.45B | 5.09B | 10.86B | 9.94B | 5.37B |
| Accounts Receivable | 14.40B | 14.03B | 12.28B | 13.07B | 11.60B |
| Total Assets | 57.58B | 58.29B | 62.11B | 57.90B | 49.90B |
| Total Liabilities | 39.22B | 39.85B | 54.51B | 50.36B | 44.59B |
| Long Term Debt | 8.66B | 9.84B | 14.23B | 15.82B | 18.25B |
| Shareholders Equity | 18.36B | 18.45B | 7.60B | 7.54B | 5.31B |
Data provided by Twelve Data
Cash Flow Statement
| fiscal_date | 2025-03-31 | 2024-03-31 | 2023-03-31 | 2022-03-31 | 2021-03-31 |
|---|---|---|---|---|---|
| Operating Activities Net Income | 293.60M | -360.70M | 459.50M | 126.26M | -1.19B |
| Operating Activities Stock Based Compensation | 12.70M | 33.50M | 219.60M | 279.52M | 233.39M |
| Operating Activities Other Non Cash Items | 1.36B | 1.90B | 1.78B | 1.56B | 1.10B |
| Operating Activities Accounts Receivable | -263.90M | -1.99B | 781.50M | -1.99B | 1.74B |
| Operating Activities Other Assets Liabilities | 504.80M | -1.64B | 988.90M | -1.78B | -479.10M |
| Operating Activities Operating Cash Flow | 1.91B | -2.06B | 4.23B | -1.80B | 1.41B |
| Investing Activities Capital Expenditures | -1.61B | -1.12B | -1.44B | -1.01B | -1.11B |
| Investing Activities Net Acquisitions | 0.00 | 186.20M | -71.90M | -3.10B | -147.59M |
| Investing Activities Investing Cash Flow | -1.61B | -1.40B | -2.40B | -3.91B | 551.88M |
| Financing Activities Long Term Debt Issuance | 25.60M | 29.40M | 500.00M | 257.82M | 4.33M |
| Financing Activities Long Term Debt Payments | -28.10M | -8.19B | -2.45B | -505.62M | -610.11M |
| Financing Activities Short Term Debt Issuance | 355.60M | -1.06B | 781.50M | 2.41B | -6.44B |
| Financing Activities Common Stock Issuance | 91.30M | 9.57B | 2.93B | 4.57B | 0.00 |
| Financing Activities Financing Cash Flow | 444.40M | 253.80M | 1.71B | 6.73B | -7.04B |
| End Cash Position | 5.45B | 5.09B | 10.86B | 9.94B | 5.38B |
| Free Cash Flow | 4.97B | 40.30M | 5.88B | 5.05B | 5.96B |
| Investing Activities Purchase Of Investments | N/A | -20.20M | -831.80M | 0.00 | -2.00M |
| Investing Activities Sale Of Investments | N/A | 67.90M | 0.00 | 279.68M | 2.31B |
| Investing Activities Other Investing Activity | N/A | -520.40M | -60.70M | -81.64M | -500.94M |
| Financing Activities Other Financing Charges | N/A | -91.60M | -52.70M | N/A | N/A |
Data provided by Twelve Data
Technical Analysis
Key Insights
- The current trend shows a downward price movement with the stock trading below its 50-day (₹107.74) and 200-day (₹120.74) moving averages, indicating bearish momentum.
- Key support levels are near the 52-week low at approximately ₹92.16, while resistance is observed around the 50-day moving average near ₹107.74 and the 200-day moving average near ₹120.74.
- The stock price is below the major moving averages (10-day, 50-day, 200-day), suggesting weakness in short to long-term trends.
- Momentum indicators such as RSI and MACD currently reflect oversold conditions, indicating potential for a technical rebound but confirming prevailing bearish sentiment.
- Across daily, weekly, and monthly timeframes, the stock exhibits consistent downward pressure with no clear reversal signals at this time.
- Current technical setup suggests a cautious market scenario with potential for continued volatility and testing of support levels before any sustained recovery.
Trending News
1. Headline: TVS Supply Chain Solutions Disclosure Regarding Order Passed Against the Company | InvestyWise
Summary: The notification was issued on ... of India Limited. The action was taken by the Assistant Commissioner of State Tax, Madhya Pradesh. The order was passed for the financial year FY 2019-20. The fundamental ground for the order is the alleged short payment of outward liability. The details indicate that the order levies a demand totaling Rs.57,88,108. Concerning the potential effect on the company, TVS Supply Chain Solutions has assessed ...
Sentiment: neutral
2. Headline: TVCMALL Review 2026: Features, Benefits & What You Need to Know
Summary: Whether you want to launch your own product line or just learn about the supply chain behind online sales, TVCMALL is a reliable platform worth exploring.
Sentiment: neutral
3. Headline: TVS Supply Chain Infuses ₹213.44 Million Into US Subsidiary With FY25 Turnover Of 10,298.94 Million By March 2026
Summary: TVS Supply Chain Solutions Limited has infused Rupees 213.44 million into its wholly owned subsidiary, TVS Logistics Investments Inc. USA, through equity allotment, with completion expected by March 31, 2026, to support working capital requirements.
Sentiment: neutral
4. Headline: TVS Supply Chain Solutions Infuses ₹213.44 Million in US Subsidiary for Working Capital Requirements
Summary: TVS Supply Chain Solutions Limited has completed an equity share allotment worth ₹213.44 million to its wholly owned US subsidiary TVS Logistics Investment Inc. USA for working capital requirements. The US subsidiary, operating in storage, warehousing and freight transportation services, ...
Sentiment: neutral
5. Headline: TVS Supply Chain Solutions invests Rs 213.44 million in US subsidiary | Business Upturn
Summary: TVS Supply Chain Solutions Limited invests ₹213.44 million in its US subsidiary, TVS Logistics Investments Inc., to support working capital needs.
Sentiment: neutral
6. Headline: War has limited direct impact on our biz: TVS SCS MD Ravi Viswanathan | People - Business Standard
Summary: TVS Supply Chain Solutions sees limited direct impact from the West Asia crisis, with stable volumes and a strong growth outlook ahead.
Sentiment: positive
7. Headline: TVS Supply Chain Solutions Ltd Locks at Lower Circuit With 4.75% Loss — Sellers Queue, No Buyers in Sight
Summary: The absence of any significant ... with limited liquidity. Is this intraday collapse a sign of exhaustion or the start of a prolonged downtrend? Fast mover alert! This Large Cap from Automobiles - Passeenger just qualified for our Momentum list with stellar technical indicators. Strike while the iron is hot! ... TVS Supply Chain Solutions Ltd is trading ...
Sentiment: negative
8. Headline: TVS Supply Chain Solutions Ltd is Rated Sell
Summary: As of 18 March 2026, TVS Supply Chain Solutions Ltd exhibits below-average quality metrics. The company’s long-term fundamental strength is weak, with an average Return on Capital Employed (ROCE) of just 4.13%. This figure is modest compared to industry standards and indicates limited efficiency ...
Sentiment: negative
9. Headline: TVS Supply Chain Solutions Ltd Hits Lower Circuit Amid Heavy Selling Pressure
Summary: Shares of TVS Supply Chain Solutions Ltd plunged to their lower circuit limit on 16 Mar 2026, reflecting intense selling pressure and panic among investors. The stock closed at ₹99.82, down 4.09%, marking its maximum daily loss and underperforming the broader Transport Services sector and ...
Sentiment: negative
10. Headline: TVS Supply Chain Solutions strengthens Caterpillar’s global supply chains from India - India Shipping News
Summary: CHENNAI: TVS Supply Chain Solutions Limited, a global supply chain solutions provider and one of India’s largest and fastest-growing integrated supply chain solutions companies, announced that it is strengthening Caterpillar’s global supply chains from India by setting up a 40,000 sq. ft. ...
Sentiment: positive
Powered by Brave
Recent Updates
News Summary
Recent news around TVS Supply Chain Solutions Limited highlights a mix of operational and market developments. The company was downgraded to a strong sell rating by Markets Mojo due to technical and fundamental weaknesses, reflecting concerns about its financial health and stock performance. A tax order from Madhya Pradesh authorities involving ₹57.88 lakh was reported, with the company assessing its implications. Despite a 27% share price gain recently, the stock has also experienced an all-time low amid stock-specific selling pressure. Additionally, TVS Supply Chain Solutions has entered India's aerospace and defence supply chain market through a Memorandum of Understanding, signaling strategic expansion efforts. These developments collectively underscore a complex environment of regulatory scrutiny, market volatility, and growth initiatives.
News Sentiment
Sentiment across recent updates is mixed, with a predominance of neutral and negative tones reflecting market caution and fundamental challenges. Positive signals emerge from strategic expansions and capital infusions, while downgrades and tax orders contribute to a cautious outlook. The overall sentiment suggests a market balancing growth prospects against operational and financial risks.
Analytical Overview
Analysis Summary
TVS Supply Chain Solutions trades at a trailing P/E of 45.69, closely aligned with the industry average of 45.69, but its forward P/E of 25.69 suggests a potential valuation adjustment. The price-to-book ratio of 2.12 is moderate compared to peers, indicating a balanced valuation perspective relative to its assets.
Revenue growth of 11.1% year-over-year and positive operating cash flow indicate a stable growth trajectory, although net income margins remain thin and return on equity is slightly negative, reflecting challenges in profitability conversion.
The company’s financial health shows a high debt-to-equity ratio of 112.34, signaling leverage risk, while cash reserves of approximately INR 8.2 billion provide liquidity support. Operating cash flow is positive, but free cash flow is slightly negative, suggesting capital expenditure or working capital demands.
Sector-specific challenges include competitive pressures in the Indian logistics market and margin constraints, while opportunities arise from expanding into aerospace and defence supply chains and leveraging technology for operational efficiencies.
Considering India-specific factors, regulatory scrutiny such as tax orders and evolving economic conditions influence operational risks, while growing consumer demand and infrastructure development offer potential growth avenues.
Investment Conclusion
Supporting Factors: Primary supporting factors include steady revenue growth, positive operating cash flow, and strategic expansion into new market segments such as aerospace and defence.
Risk Factors: Main risk factors to monitor are the high leverage indicated by the debt-to-equity ratio, modest profitability metrics including negative return on equity, and recent market volatility reflected in share price declines and downgrades.
SWOT Analysis
Strengths
- Strong legacy and backing as part of the TVS Group.
- Comprehensive integrated supply chain services across multiple sectors.
- Advanced technology integration enhancing operational efficiency.
- Stable revenue growth with positive operating cash flow.
Weaknesses
- Negative return on equity and assets indicating profitability challenges.
- High debt-to-equity ratio increasing financial leverage risk.
- Modest profit margins limiting earnings strength.
- Slightly negative free cash flow reflecting capital demands.
Opportunities
- Expansion into aerospace and defence supply chain markets.
- Growing demand for logistics services in India’s evolving economy.
- Potential benefits from regulatory reforms and infrastructure development.
- Increased institutional investor interest could support governance.
Threats
- Regulatory scrutiny including tax orders impacting financials.
- Intense competition within the Indian logistics sector.
- Market volatility leading to share price pressure.
- Geopolitical tensions potentially affecting global supply chains.
Company Description
TVS Supply Chain Solutions Limited is a prominent logistics and supply chain management company operating worldwide. The primary function of the company is to offer comprehensive supply chain solutions across various sectors, including automotive, consumer goods, industrial products, and technology. TVS Supply Chain Solutions focuses on providing end-to-end logistics services, which encompass warehousing, transportation, inventory management, and distribution. Notable features of TVS Supply Chain Solutions include its advanced technology integration and customized logistics solutions designed to enhance operational efficiency for its clients. The company leverages cutting-edge technology such as automation and data analytics to optimize the supply chain processes, thereby reducing costs and improving service levels. In the financial market, TVS Supply Chain Solutions Limited plays a crucial role in facilitating smooth logistics operations for businesses, ensuring timely delivery and management of goods and materials. With its extensive network and robust infrastructure, the company significantly influences various industries by supporting their logistics requirements and enabling seamless global trade. As part of the TVS Group, a well-established conglomerate, it benefits from a strong legacy and expertise in engineering and manufacturing.