
TVS Motor Company Limited (TVSMOTOR)
Stock Analysis Report
Stock Journey
Key Positives and Key Risks
Pros
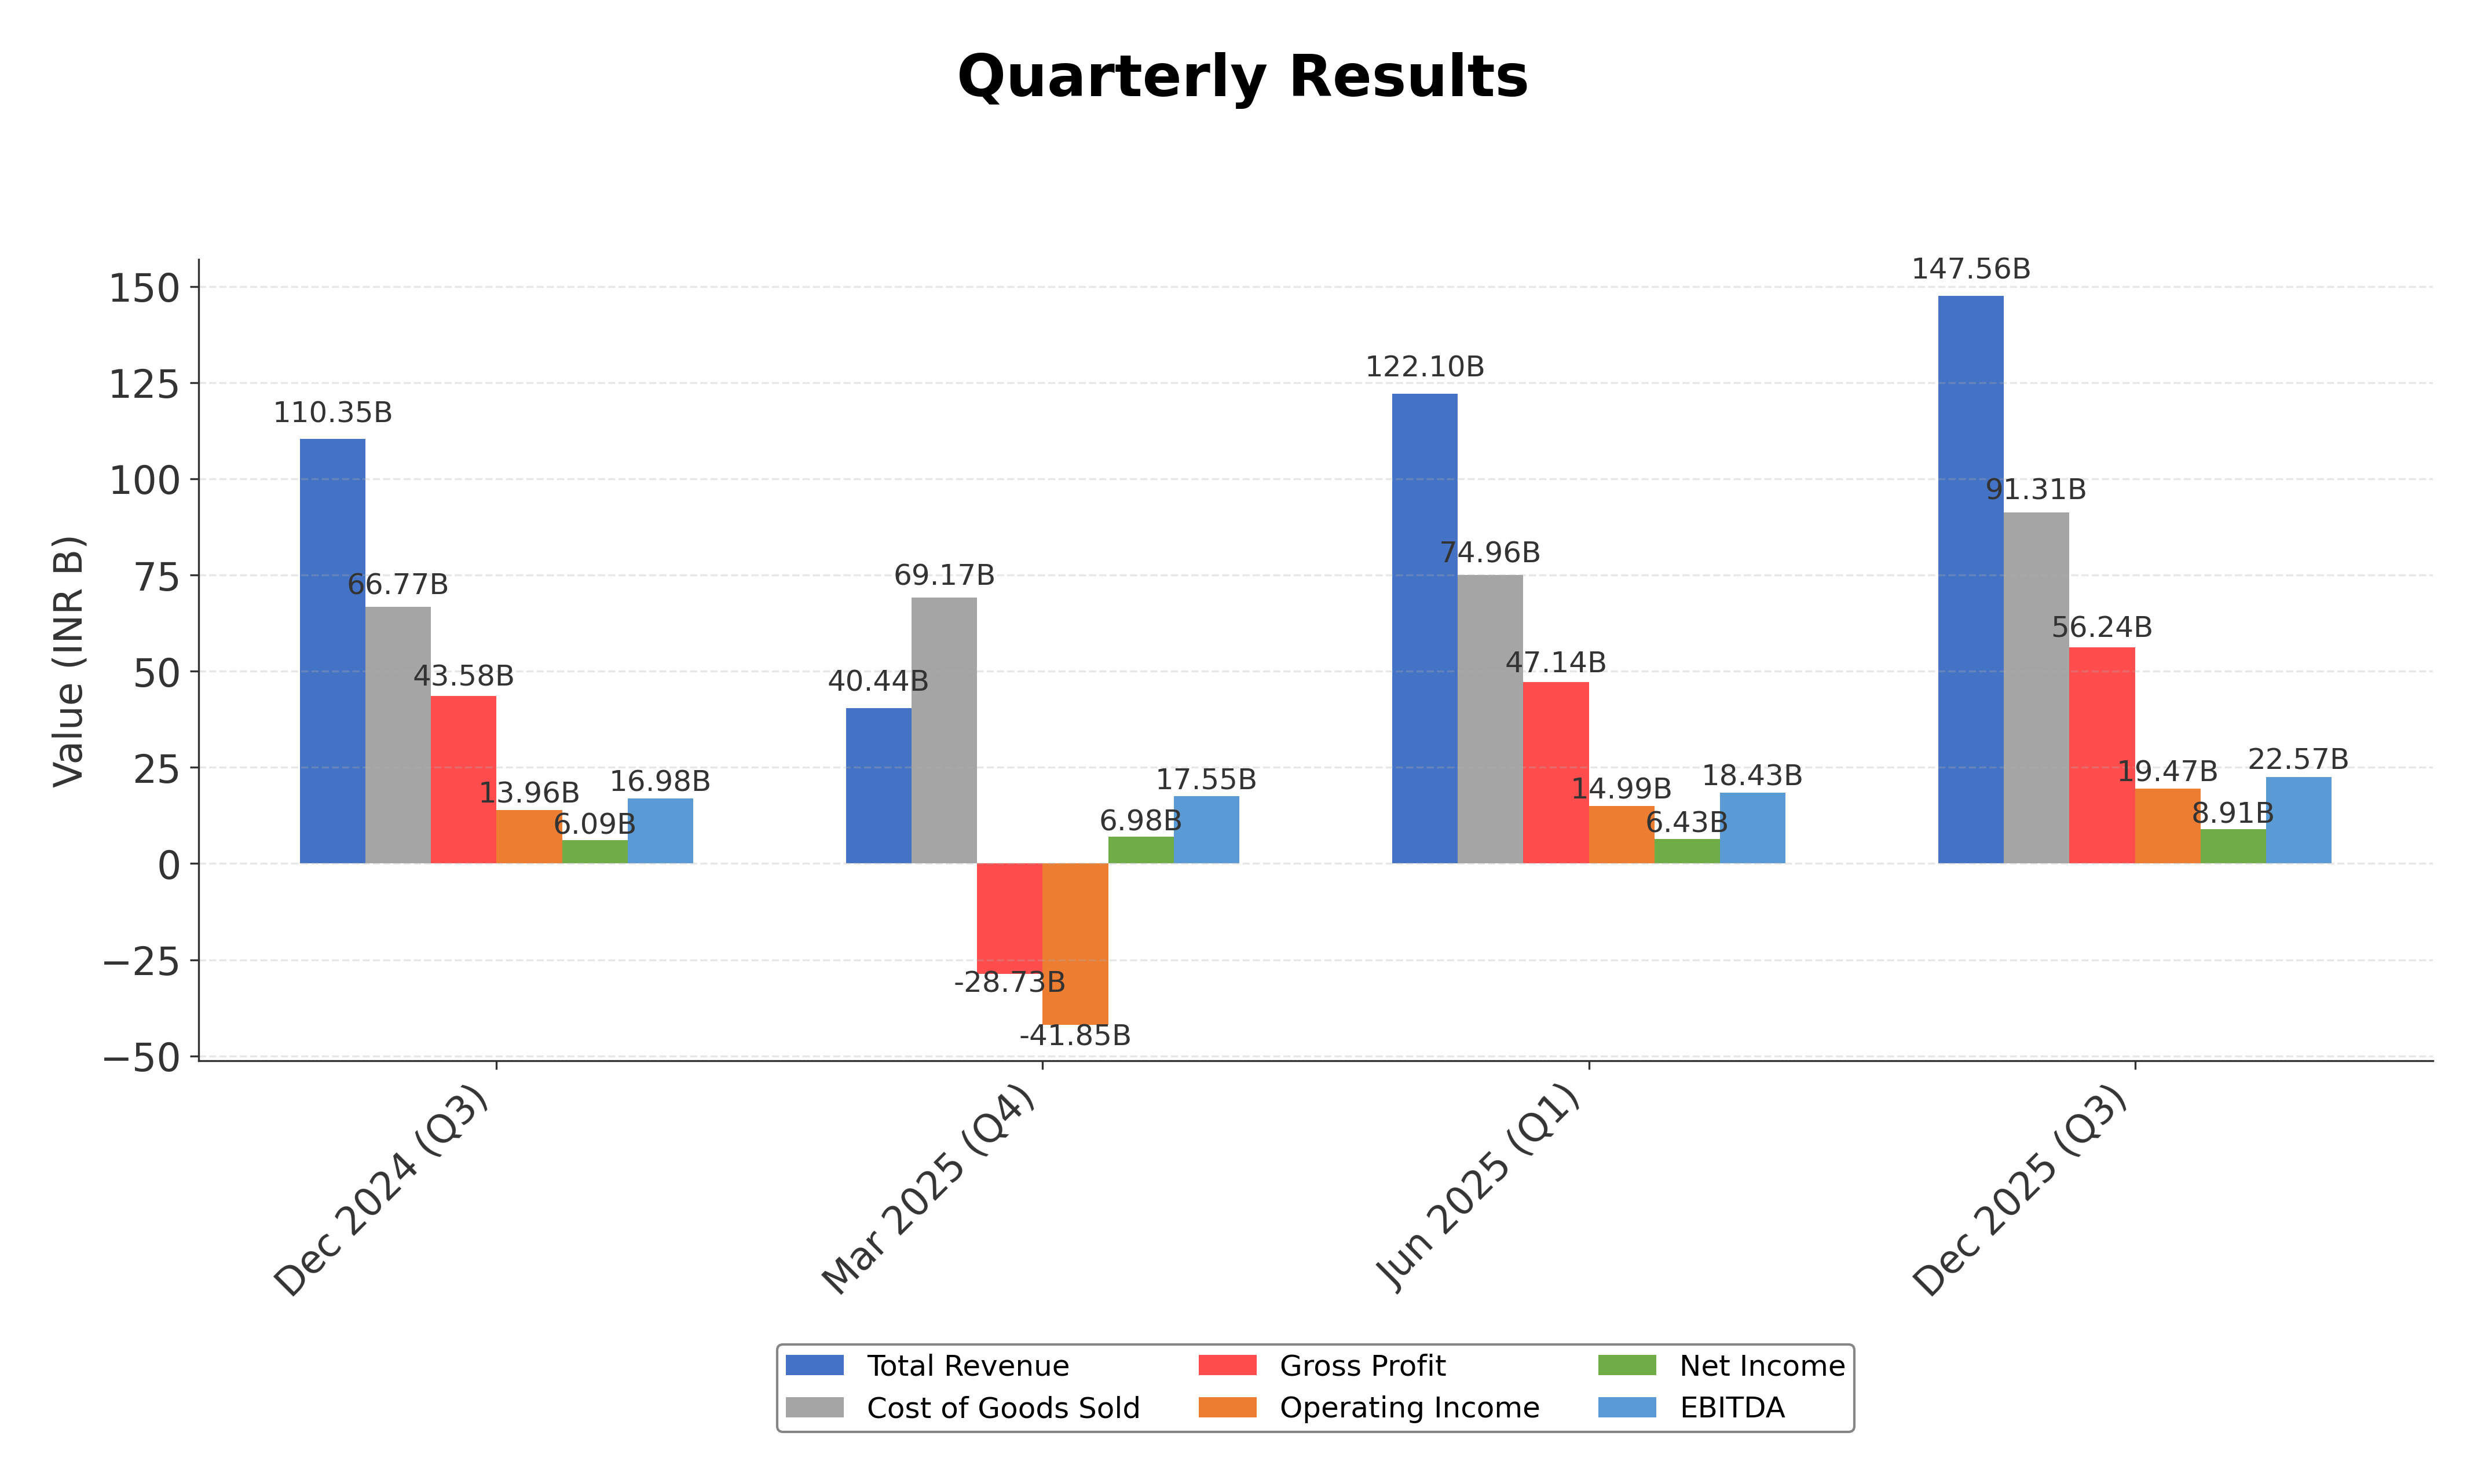
- Strong revenue growth with a quarterly increase of 31.7% and year-over-year earnings growth of 48.6%, indicating robust operational expansion.
- High return on equity at 23.7%, reflecting efficient capital utilization and profitability.
- Positive free cash flow of ₹22.36 billion, supporting financial flexibility and operational needs.
Cons
- Elevated trailing P/E ratio of 74.8, significantly above industry average, suggesting premium valuation.
- High debt-to-equity ratio of 346.1%, indicating substantial leverage and potential financial risk.
- Price-to-book ratio of 20.17, markedly higher than peers, reflecting stretched valuation multiples.
Disclosure: This information is for general awareness and does not constitute investment advice
Report Summary
TVS Motor Company Limited operates as a prominent Indian automotive manufacturer specializing in two-wheelers and three-wheelers. The company holds a significant position in the Indian automotive sector, offering a diverse product portfolio including motorcycles, scooters, mopeds, and autorickshaws. TVS Motor emphasizes innovation, safety, and customer satisfaction, with a presence extending to over 60 countries through exports.
Financially, TVS Motor reported a trailing P/E ratio of approximately 74.8 and a forward P/E of 36.9, reflecting premium valuation levels relative to earnings. The companyâs market capitalization stands near â¹1.68 trillion, supported by a revenue of â¹524.8 billion over the trailing twelve months and a net income of â¹28.8 billion. Key profitability metrics include a gross margin of 38.1%, operating margin of 13.1%, and return on equity of 23.7%. The balance sheet shows a current ratio of 1.12 and total debt of â¹315.9 billion.
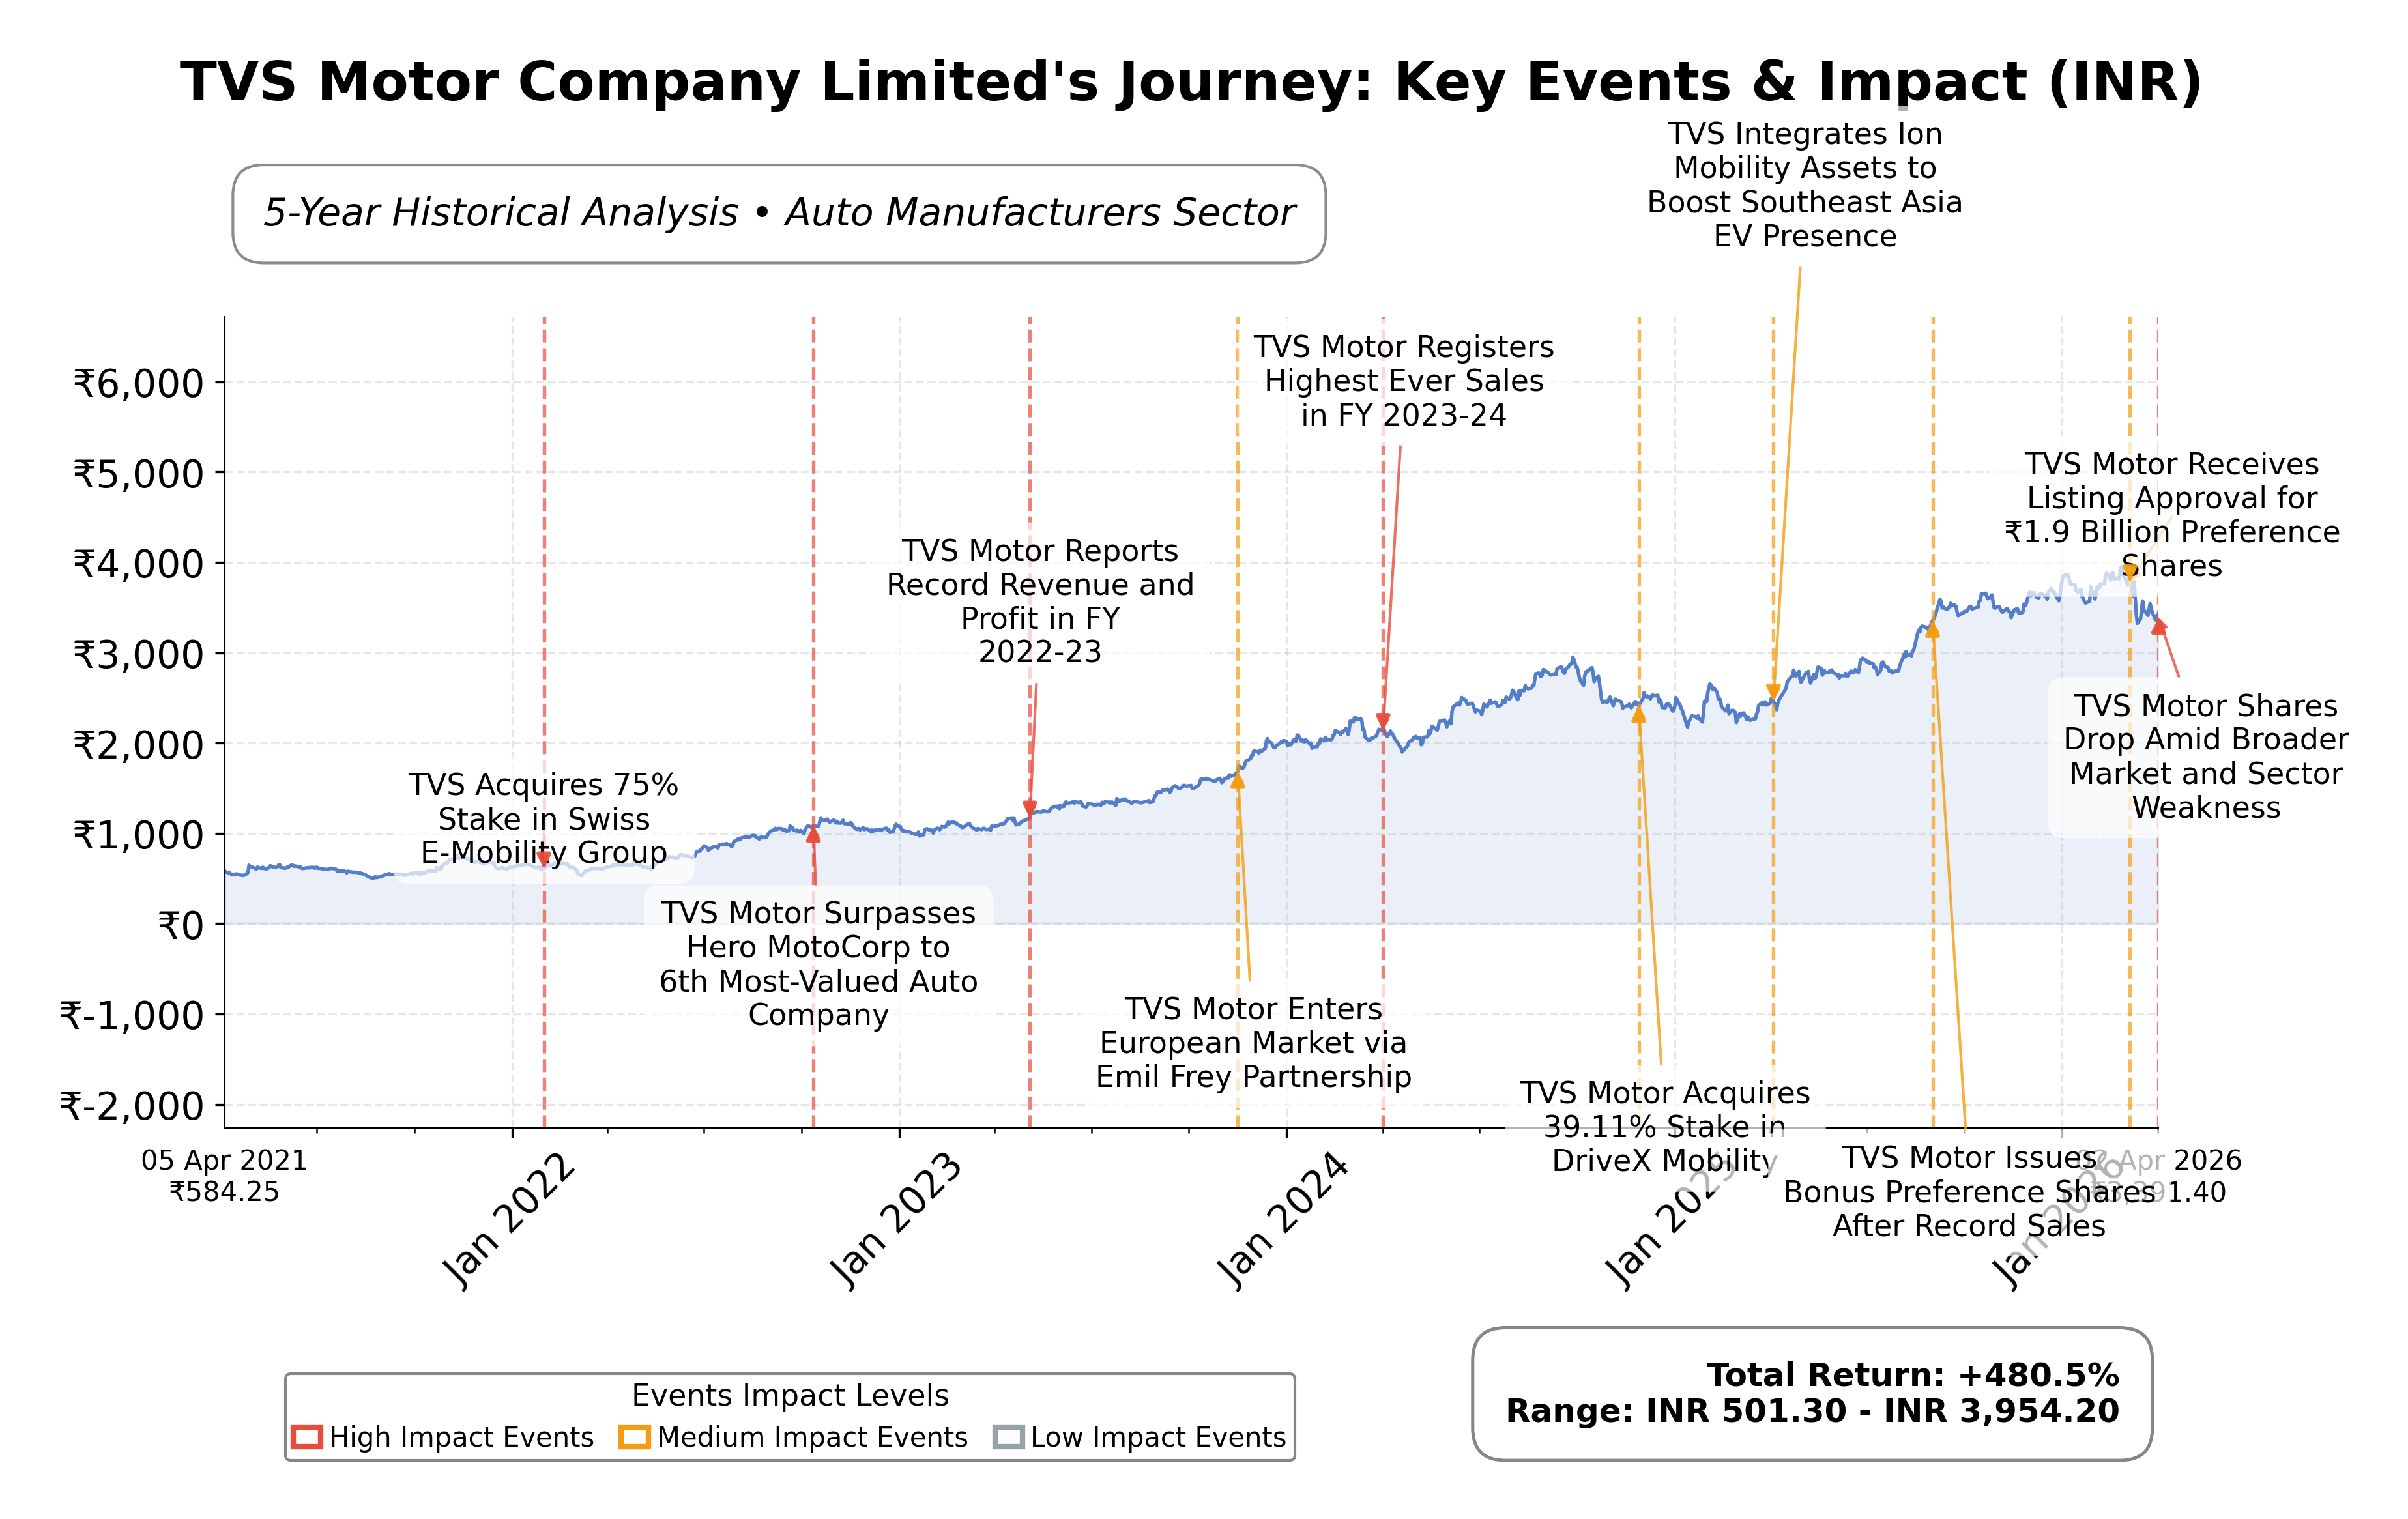
Technically, the stock trades near â¹3,391 with a 52-week range between â¹2,221 and â¹3,970, indicating upside potential relative to the current price. Recent strategic initiatives include product updates such as the 2026 Apache RTR 160 4V with enhanced features, contributing to record sales growth of 25% in March 2026. Leadership remains stable, and the companyâs strengths include strong brand recognition and innovation focus, while risks involve elevated valuation multiples and sectoral cyclicality.
Within the Indian auto manufacturing industry, TVS Motorâs valuation multiples are notably higher than peers such as Hero Motocorp, Mahindra & Mahindra, and Bajaj Auto. While TVS Motorâs return on equity is competitive at 23.7%, its P/E and P/B ratios exceed industry averages, reflecting market expectations for growth. Peer companies show a range of valuations and operational metrics, positioning TVS Motor as a premium player in the regional market.
TVS Motor Company navigates a dynamic automotive landscape marked by evolving consumer preferences and technological advancements. The companyâs recent achievements include record sales and product enhancements, yet challenges remain in managing valuation levels and competitive pressures. The stakes involve sustaining growth momentum while balancing profitability and innovation. Observers evaluating the stock might consider the current premium valuation alongside strong operational performance, suggesting a measured approach to position adjustments.
Company and Industry Overview
Company Basics
Price Performance
Company Size
Shareholding Pattern
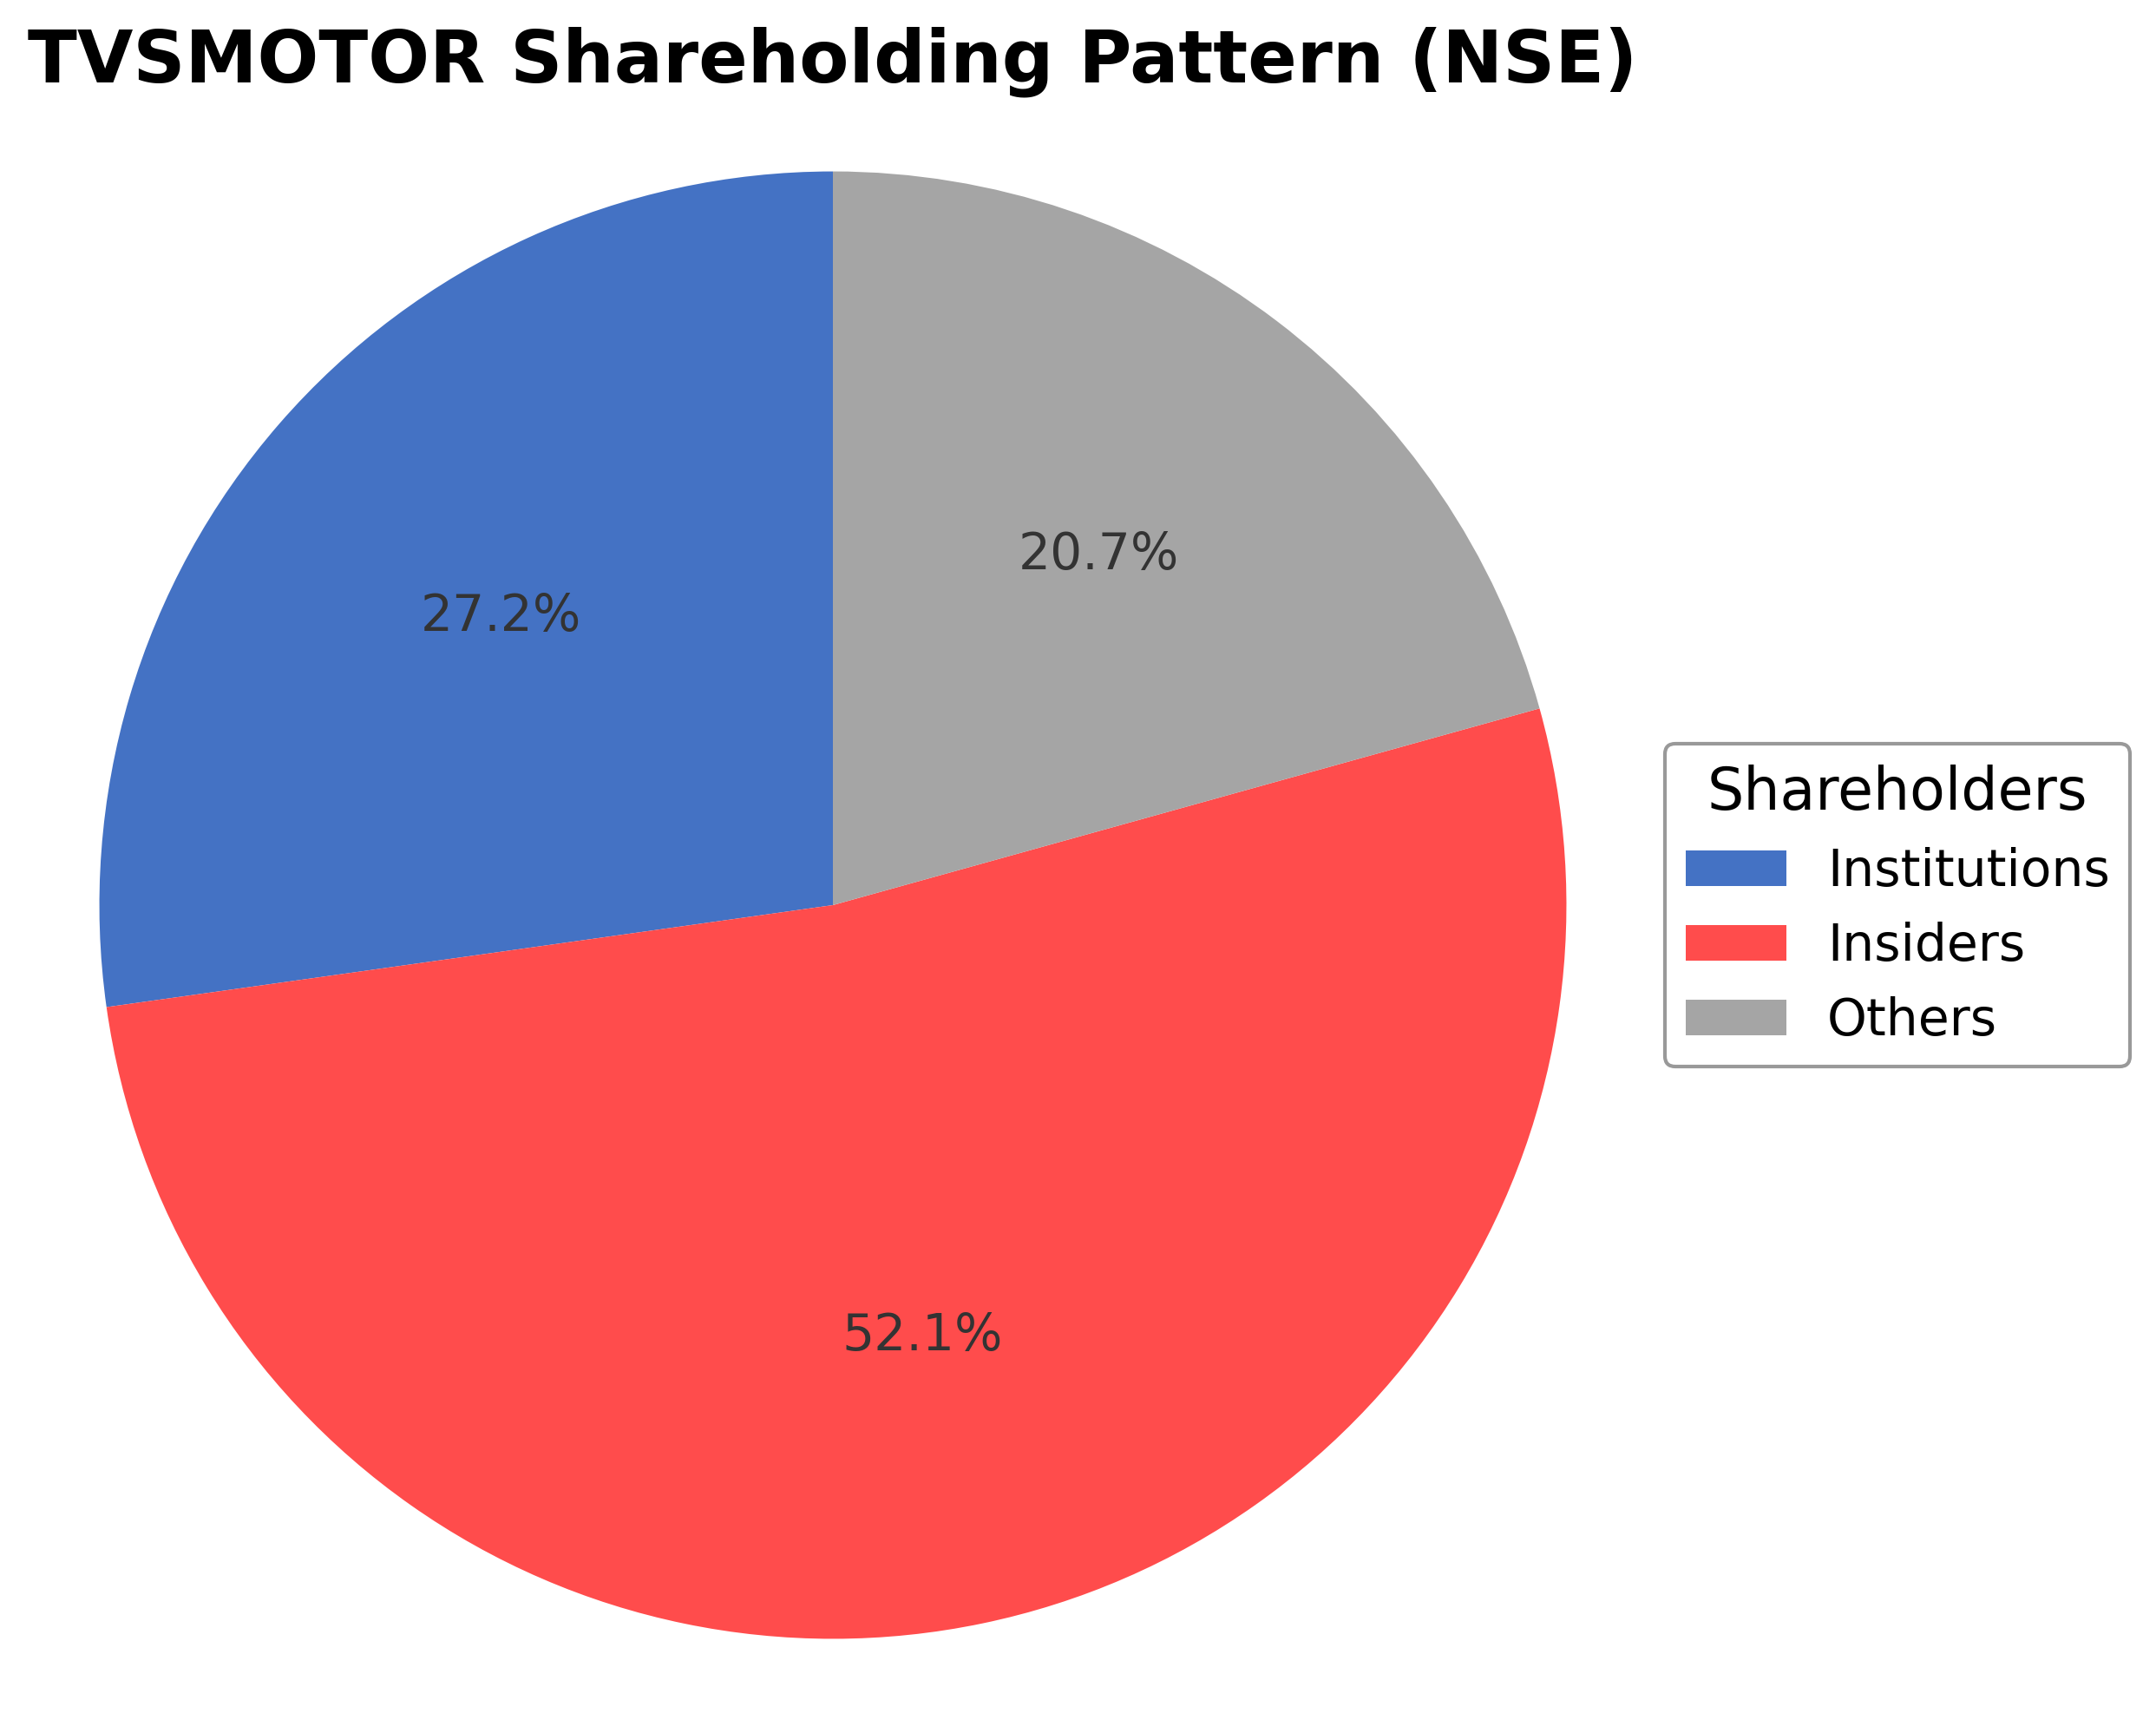
The ownership structure of TVS Motor Company Limited is characterized by a majority stake held by insiders, including executives and board members, accounting for approximately 52.10% of shares. Institutional investors, comprising mutual funds, pension funds, and asset managers, hold around 27.22%, while the remaining 20.68% is held by public shareholders including retail investors and employee stock plans. Over the past 12 to 24 months, institutional holdings have shown moderate accumulation, reflecting sustained confidence from major funds. This shareholding pattern suggests a stable governance framework with significant promoter control, balanced by institutional oversight, which may influence strategic decisions and corporate actions in alignment with long-term growth objectives.
Sector and Industry Analysis
TVS Motor Company Limited operates within the broader Automotive sector, specifically in the two-wheeler and three-wheeler segment of the Vehicles & Parts industry. The global automotive sector is substantial, with the two-wheeler market in India and emerging economies representing a significant growth engine due to increasing urbanization, rising disposable incomes, and demand for affordable personal mobility. The Indian two-wheeler market alone is one of the largest worldwide, with annual volumes exceeding 20 million units, driven by both rural and urban demand. Key players in this segment include TVS Motor, Hero MotoCorp, Bajaj Auto, Honda Motorcycle & Scooter India, and Royal Enfield, each competing on product innovation, cost efficiency, and distribution reach.
Industry trends are currently shaped by rapid technological shifts, including the electrification of two-wheelers, integration of connected vehicle technologies, and a growing emphasis on sustainability. Consumer behavior is evolving with increased preference for electric vehicles (EVs) due to environmental concerns and government incentives. Additionally, digital sales channels and after-sales service innovations are gaining prominence. Emerging opportunities lie in electric scooters and motorcycles, battery swapping infrastructure, and smart mobility solutions, which are expected to redefine market dynamics over the next decade. The COVID-19 pandemic accelerated demand for personal vehicles over public transport, further bolstering two-wheeler sales.
The regulatory environment is a critical factor influencing the sector. Governments, particularly in India, have implemented stringent emission norms such as Bharat Stage VI (BS-VI) standards, pushing manufacturers toward cleaner technologies. Subsidies and incentives under schemes like FAME (Faster Adoption and Manufacturing of Hybrid and Electric Vehicles) promote EV adoption. Compliance with safety standards, homologation requirements, and evolving taxation policies also shape operational strategies. Trade policies and import duties affect the cost structure, especially for components and electric powertrain elements. Regulatory uncertainty around battery disposal and recycling is an emerging compliance challenge.
Competitive dynamics in the two-wheeler industry are characterized by high fragmentation but dominated by a few large players with strong brand equity and extensive dealer networks. Barriers to entry include significant capital investment in R&D, manufacturing facilities, and distribution infrastructure, as well as the need for compliance with evolving regulatory standards. TVS Motor leverages its diversified product portfolio, innovation in electric mobility, and strategic partnerships to maintain competitive positioning. Price sensitivity among consumers necessitates cost optimization and value engineering. The market structure is also influenced by aftermarket services and financing options, which are critical for customer retention and revenue diversification. Overall, the sector is poised for transformation driven by electrification, digitalization, and evolving consumer preferences.
Note: Analysis synthesized from industry research, market reports, and regulatory filings. Information is subject to change based on market conditions.
Illustrative Scenario Analysis
DCF Assumptions:
Method: Two-Stage EPS-Priority Model
Financials
Peer Analysis
| Company Name | Market Cap | P/E Ratio | P/B Ratio | EV/EBITDA | Price to CFO |
|---|---|---|---|---|---|
| TVS Motor Company Limited | ₹1.68T | 74.80 | 20.17 | 25.63 | 66.69 |
| Hero Motocorp Ltd. | ₹1.06T | 18.92 | 4.90 | 14.54 | 30.46 |
| Mahindra & Mahindra Ltd. | ₹4.31T | 29.09 | 4.95 | 15.39 | 64.54 |
| Eicher Motors Ltd. | ₹1.92T | 34.91 | 8.46 | 34.99 | 35.19 |
| Tata Motors Ltd. | ₹1.17T | 6.66 | 1.29 | 3.99 | 3.61 |
| Bajaj Auto Limited | ₹2.53T | 28.03 | 7.27 | 17.95 | 457.57 |
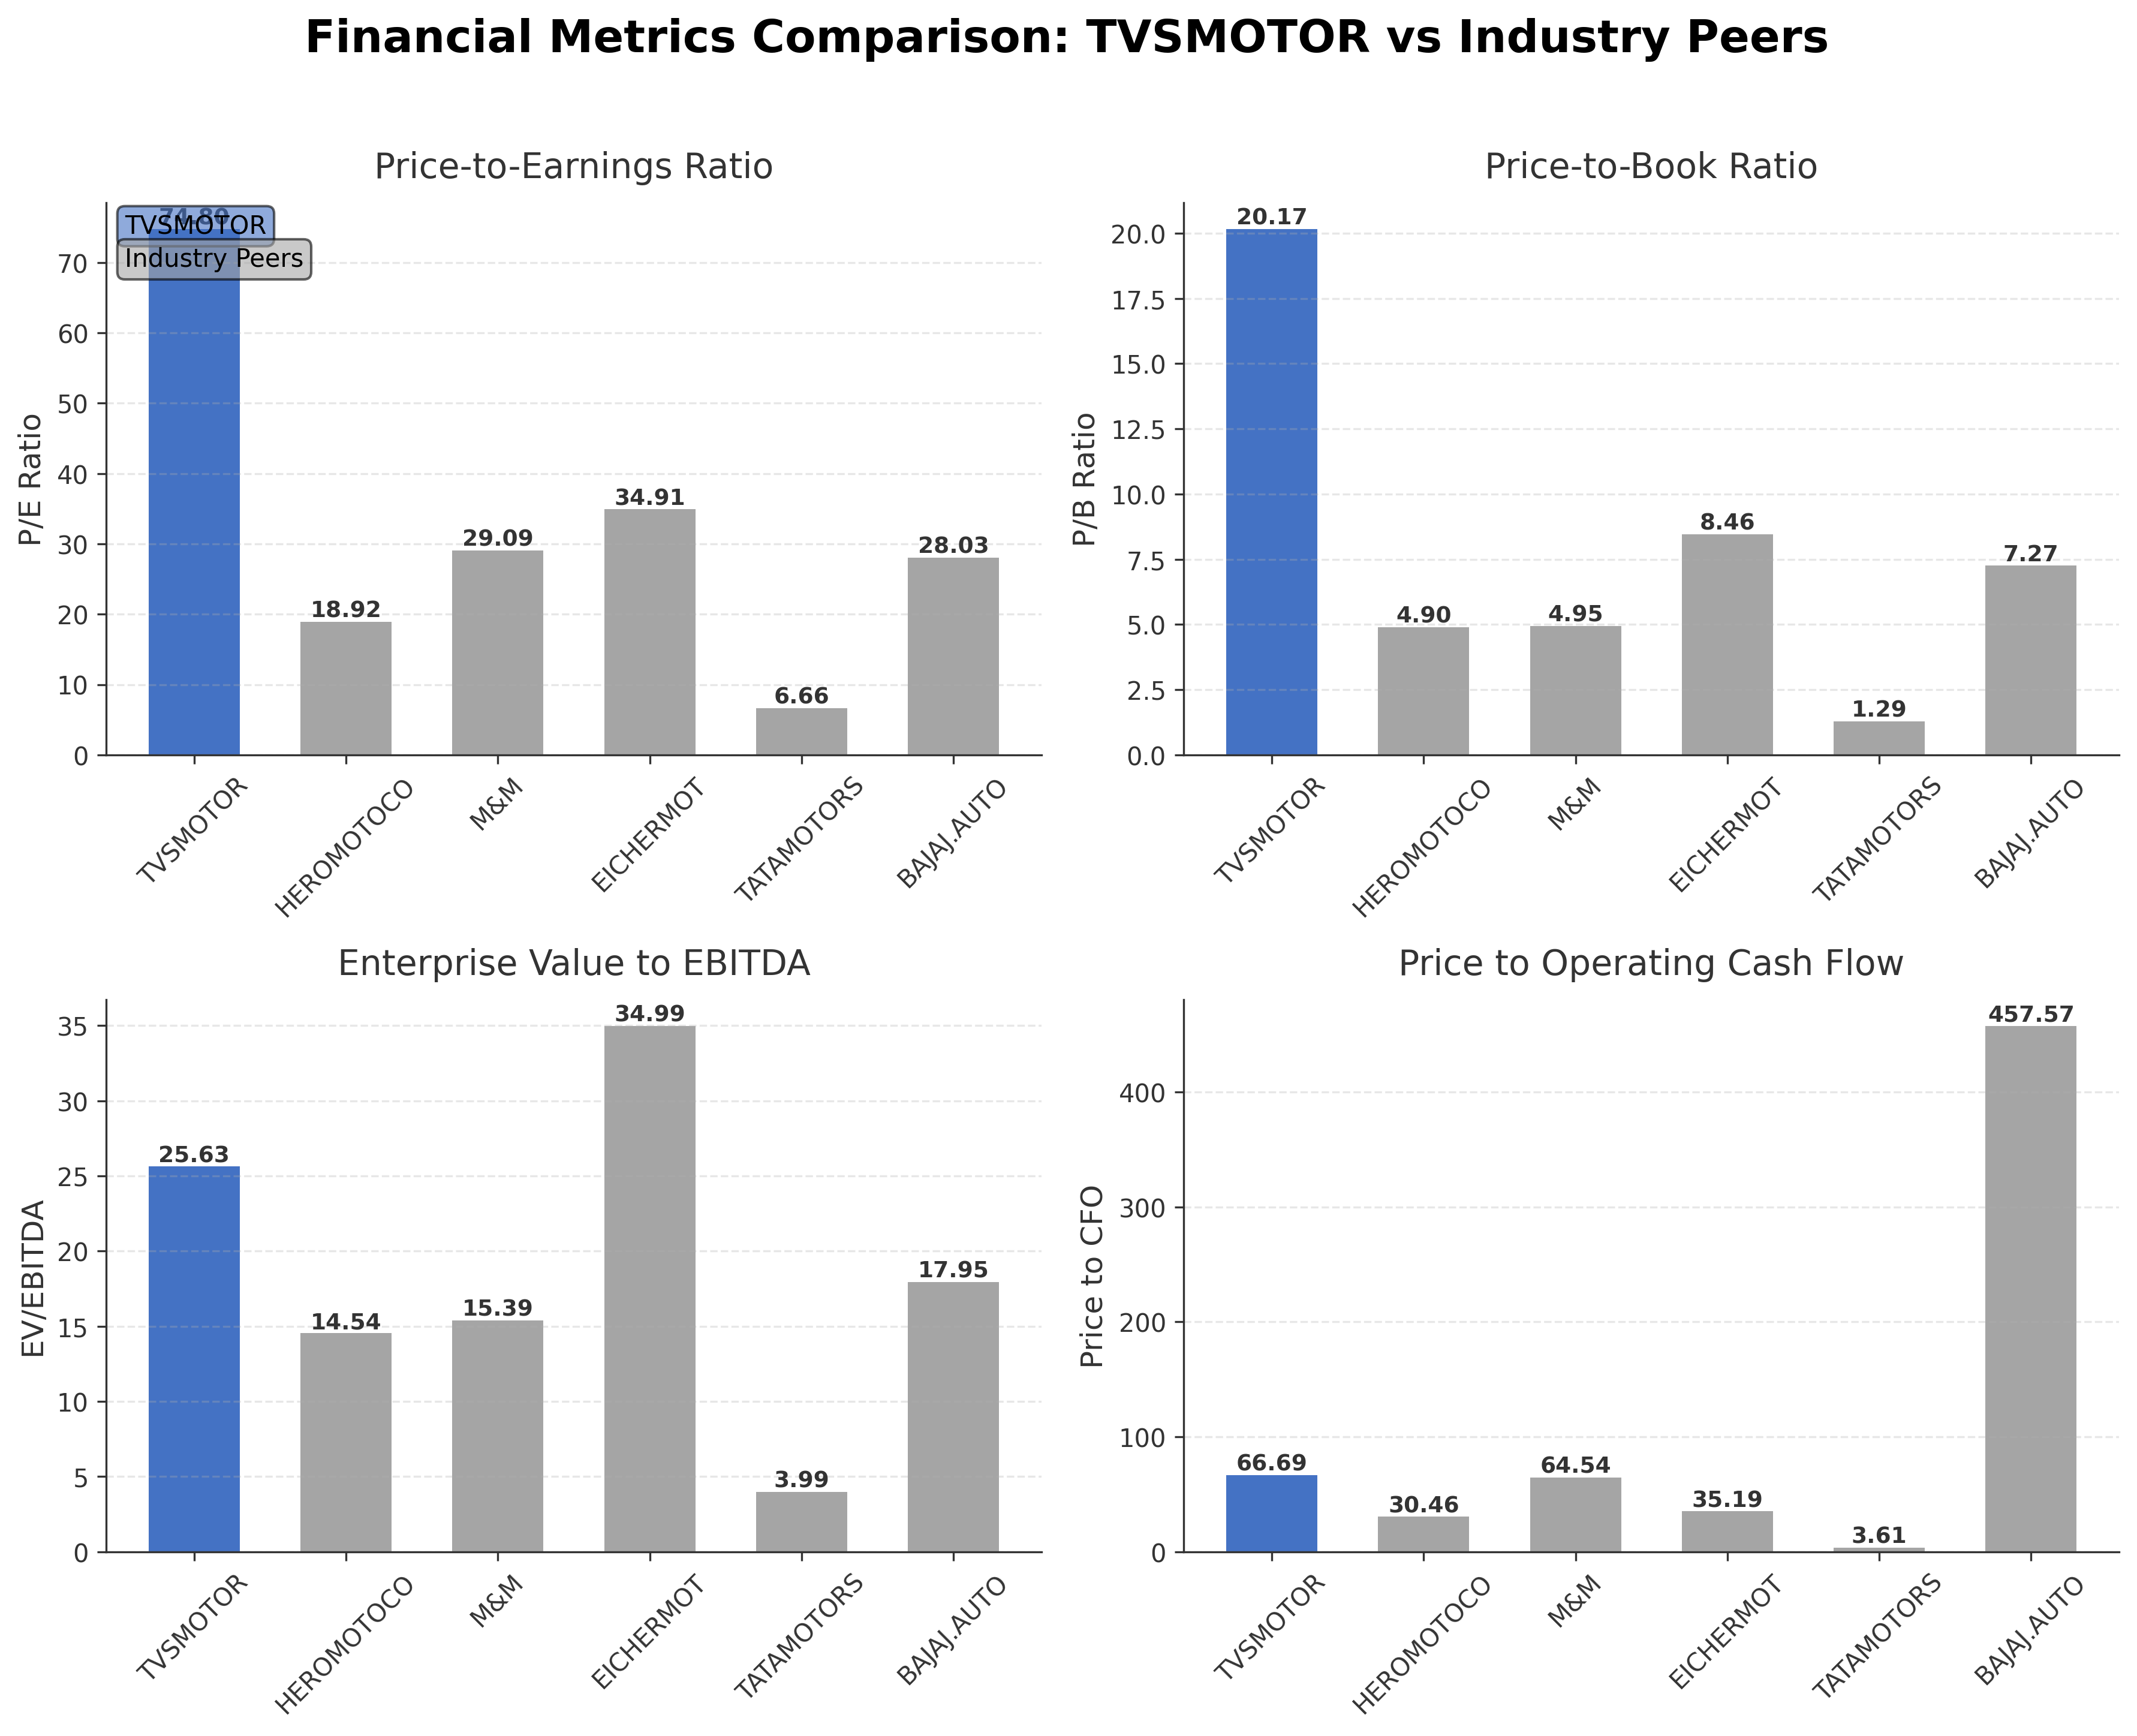
Comparison Analysis: TVS Motor Company Limited exhibits higher valuation multiples compared to its Indian automotive peers, with a trailing P/E of 74.80 significantly exceeding the industry range. Its price-to-book ratio at 20.17 also stands out as elevated relative to competitors. Despite this, TVS Motor maintains a competitive return on equity of 23.68%, comparable to Hero Motocorp and Tata Motors. The enterprise value to EBITDA ratio of 25.63 is higher than many peers, indicating premium pricing. These metrics position TVS Motor as a premium player with strong profitability but elevated valuation relative to regional industry counterparts.
Financial Metrics Comparison with Peers
Financial Statements
Comprehensive financial data including income, balance sheet, and cash flow metrics
Income Statement
| fiscal_date | 2025-03-31 | 2024-03-31 | 2023-03-31 | 2022-03-31 | 2021-03-31 |
|---|---|---|---|---|---|
| Sales | 368.87B | 330.34B | 274.34B | 213.21B | 170.31B |
| Cost Of Goods | 267.80B | 244.65B | 209.06B | 163.17B | 129.76B |
| Gross Profit | 101.08B | 85.70B | 65.28B | 50.04B | 40.55B |
| Operating Expense Selling General And Administrative | 22.73B | 18.11B | 13.36B | 11.16B | 9.70B |
| Operating Expense Other Operating Expenses | 47.94B | 39.32B | 27.75B | 20.41B | 15.13B |
| Operating Income | -1.83B | -5.35B | -5.47B | -4.33B | -3.34B |
| Non Operating Interest Income | 58.26B | 51.33B | 37.66B | 24.55B | 20.75B |
| Non Operating Interest Expense | 20.83B | 19.17B | 13.56B | 8.83B | 8.56B |
| Pretax Income | 35.05B | 27.03B | 19.36B | 10.67B | 8.22B |
| Income Tax | 11.55B | 9.24B | 6.27B | 3.36B | 2.14B |
| Net Income | 23.80B | 17.79B | 13.09B | 7.31B | 6.08B |
| Eps Basic | 47.05 | 35.50 | 27.97 | 15.93 | 12.51 |
| Eps Diluted | 47.05 | 35.50 | 27.97 | 15.93 | 12.51 |
| Basic Shares Outstanding | 475.09M | 475.09M | 475.09M | 475.09M | 475.09M |
| Diluted Shares Outstanding | 475.09M | 475.09M | 475.09M | 475.09M | 475.09M |
| Ebit | 55.89B | 46.20B | 32.92B | 19.50B | 16.78B |
| Ebitda | 66.07B | 55.29B | 40.43B | 27.30B | 22.52B |
| Net Income Continuous Operations | 35.28B | 27.03B | 19.36B | 10.67B | 8.22B |
| Minority Interests | -1.44B | -921.70M | 192.10M | 259.40M | -132.40M |
| Preferred Stock Dividends | 0.00 | 0.00 | 0.00 | 0.00 | 0.00 |
Data provided by Twelve Data
Balance Sheet
| fiscal_date | 2025-03-31 | 2024-03-31 | 2023-03-31 | 2022-03-31 | 2021-03-31 |
|---|---|---|---|---|---|
| Cash And Cash Equivalents | 41.15B | 23.56B | 18.51B | 14.46B | 15.74B |
| Accounts Receivable | 17.17B | 18.39B | 12.56B | 11.77B | 10.36B |
| Total Assets | 479.37B | 422.20B | 352.33B | 271.27B | 219.93B |
| Total Liabilities | 384.95B | 347.09B | 293.23B | 220.74B | 177.78B |
| Long Term Debt | 146.85B | 131.33B | 96.28B | 77.09B | 64.65B |
| Shareholders Equity | 94.42B | 75.11B | 59.10B | 50.53B | 42.15B |
Data provided by Twelve Data
Cash Flow Statement
| fiscal_date | 2025-03-31 | 2024-03-31 | 2023-03-31 | 2022-03-31 | 2021-03-31 |
|---|---|---|---|---|---|
| Operating Activities Net Income | 35.28B | 27.03B | 19.36B | 10.67B | 8.22B |
| Operating Activities Stock Based Compensation | 330.80M | N/A | N/A | N/A | N/A |
| Operating Activities Other Non Cash Items | 2.03B | 2.47B | 1.89B | 1.50B | 1.19B |
| Operating Activities Accounts Receivable | -7.18B | -55.15B | -66.26B | -30.02B | -13.02B |
| Operating Activities Other Assets Liabilities | -5.22B | -2.90B | -6.19B | -4.92B | 310.90M |
| Operating Activities Operating Cash Flow | 25.23B | -28.55B | -51.20B | -22.77B | -3.30B |
| Investing Activities Capital Expenditures | -24.59B | -11.11B | -13.19B | -9.56B | -9.25B |
| Investing Activities Net Acquisitions | -943.40M | 2.61B | 2.64B | -4.67B | 19.50M |
| Investing Activities Purchase Of Investments | -4.24B | -2.23B | -2.66B | -1.47B | -55.10M |
| Investing Activities Sale Of Investments | 563.20M | 478.20M | 0.00 | 874.40M | 167.80M |
| Investing Activities Investing Cash Flow | -29.21B | -5.45B | -12.52B | -14.83B | -8.57B |
| Financing Activities Short Term Debt Issuance | 10.26B | -1.82B | 11.20B | 6.20B | -6.73B |
| Financing Activities Common Stock Repurchase | -952.70M | N/A | N/A | N/A | N/A |
| Financing Activities Common Dividends | -4.75B | -3.80B | -2.92B | -1.90B | -997.70M |
| Financing Activities Other Financing Charges | 427.40M | -439.60M | 622.70M | -72.40M | -552.10M |
| Financing Activities Financing Cash Flow | 4.98B | -6.06B | 63.58B | 31.56B | -8.28B |
| End Cash Position | 41.15B | 23.56B | 18.51B | 14.46B | 15.74B |
| Free Cash Flow | 10.25B | -23.98B | -57.46B | -25.45B | 2.23B |
| Investing Activities Other Investing Activity | N/A | 4.80B | 688.00M | -4.00M | 545.10M |
| Financing Activities Long Term Debt Issuance | N/A | N/A | 54.68B | 27.33B | N/A |
| Investing Activities Net Intangibles | N/A | N/A | N/A | N/A | N/A |
Data provided by Twelve Data
Technical Analysis
Key Insights
- The current trend shows consolidation near the ₹3,391 price level after recent volatility, with price action exhibiting range-bound behavior between the 50-day moving average (~₹3,700) and 200-day moving average (~₹3,429).
- Key support levels are identified near ₹3,300 and ₹3,200, while resistance is observed around ₹3,700 and the 52-week high of ₹3,970.
- The stock is trading below the 50-day moving average but above the 200-day moving average, suggesting mixed momentum across short and long-term timeframes.
- Momentum indicators show the Relative Strength Index (RSI) in a neutral range, MACD near the signal line indicating potential indecision, and stochastic oscillators reflecting moderate momentum without overbought or oversold conditions.
- Multi-timeframe analysis reveals daily charts with sideways movement, weekly charts indicating a mild uptrend, and monthly charts showing longer-term bullish tendencies.
- Potential market scenarios include a breakout above resistance levels to resume upward momentum or a breakdown below support levels leading to further consolidation or correction.
Trending News
Summary: TVS Motor Company has announced the launch of updated variants of its Apache RTR 160 4V motorcycle, reinforcing its position in the premium 160cc performance segment. The latest update introduces enhanced features across the entire range, with a focus on improving rider safety, visibility, ...
Sentiment: positive
2. Headline: TVS Motor Company Ltd Hits Intraday Low Amid Price Pressure on 2 April 2026
Summary: Shares of TVS Motor Company Ltd declined sharply on 2 Apr 2026, touching an intraday low of Rs 3,306, reflecting a 3.47% drop amid broader market weakness and sectoral pressures. The stock underperformed its sector and the benchmark Sensex, weighed down by negative market sentiment and technical ...
Sentiment: negative
3. Headline: TVS Motor Hits Record FY26 Sales - Scooters, Bikes and EVs Drive The Growth | Times Now
Summary: TVS Motor Company recorded its highest-ever sales in FY2025-26 with 5.9 million units, up 24%. Strong growth in scooters, motorcycles, electric vehicles, and exports drove performance, while March 2026 sales rose 25%, reflecting rising demand for affordable and practical mobility., Bike News, ...
Sentiment: positive
4. Headline: Two-wheeler sales March ’26: Record sales, how brands performed - The Times of India
Summary: Bikes News: India’s two-wheeler market ended March 2026 on a strong note, with most manufacturers reporting healthy growth across segments. Demand for motorcycles.
Sentiment: positive
5. Headline: TVS Motor shares in focus after March sales jump 25%, three-wheeler sales rocket 46% - The Economic Times
Summary: TVS Motor Company announced impressive March 2026 sales figures. Total sales surged 25% to over 519,000 units. Two-wheeler sales also grew 25%. Electric vehicle sales saw a 44% jump. Three-wheeler sales registered a robust 46% increase. International business posted 25% growth.
Sentiment: positive
6. Headline: TVS Motor Company achieves record sales growth with 25% increase in March 2026 | Business Upturn
Summary: TVS Motor Company reported a 25% increase in sales for March 2026, achieving record growth in the financial year 2025-26 with total sales reaching 5.9 million units.
Sentiment: positive
7. Headline: TVS Motor Company Ltd Surges 3.04% to Day's High of Rs 3470.95 — Outperforms Sector by 2.07 Percentage Points
Summary: The Sensex advanced 2.7% on 1 Apr 2026, yet TVS Motor Company Ltd outpaced the broader market with a 3.04% gain, touching an intraday high of Rs 3470.95. This 2.07 percentage-point outperformance over the Automobiles sector highlights a distinctly stock-specific strength in a generally positive ...
Sentiment: positive
8. Headline: March Auto Sales 2026 Highlights: TVS Motor Company sales jump 25% to 5.19 lakh units in March
Summary: March Auto Sales 2026 Highlights: Hero MotoCorp reported an 8.84% YoY increase in its total sales (including exports), which stood at 5.98 lakh units in March 2026, compared to 5.5 lakh units in the same period last year.
Sentiment: positive
Summary: Indian markets experienced a sharp decline on Friday, with Nifty and Sensex falling over 2% due to volatility, primarily driven by financials, auto, and consumer stocks. Elevated energy prices and a weakening rupee further impacted investor sentiment.
Sentiment: negative
10. Headline: TVS Motor Company Ltd is Rated Buy
Summary: Currently, TVS Motor Company is considered 'expensive' based on valuation metrics. The premium valuation reflects investor confidence in the company’s growth trajectory and market position. While a higher valuation may imply limited upside from current price levels, it also signals expectations ...
Sentiment: positive
Powered by Brave
Recent Updates
News Summary
Recent news highlights TVS Motor Company's strong revenue growth trajectory from 2020 to 2024, supported by consistent sales expansion and product innovation. Corporate actions such as upcoming ex-dividend trading dates reflect ongoing shareholder engagement. Despite short-term price pressure observed in early April 2026, the company maintains robust operational performance with record sales growth and expanding market presence. The stock has delivered significant returns over the past three years, underscoring investor confidence. Overall, the news cycle emphasizes TVS Motor's sustained growth momentum amid sectoral dynamics and market volatility.
News Sentiment
Sentiment across recent news is predominantly positive, with multiple reports highlighting record sales growth, product enhancements, and strong market performance. Neutral and negative sentiments are limited to short-term price fluctuations and market-wide volatility, suggesting that underlying business fundamentals remain solid. Positive sentiment is reinforced by strategic corporate actions and sustained revenue expansion, indicating favorable market perception.
Analytical Overview
Analysis Summary
Valuation Metrics: TVS Motor's trailing P/E ratio of 74.8 is significantly higher than the industry average, indicating a premium valuation. The forward P/E of 36.9 suggests expectations of earnings growth, though still above peer averages.
Growth Trajectory: The company demonstrates strong growth with a quarterly revenue growth rate of 31.7% and a 48.6% year-over-year quarterly earnings growth, supported by record sales volumes and expanding product lines.
Financial Health: TVS Motor maintains a current ratio of 1.12, indicating adequate short-term liquidity, but carries a relatively high debt-to-equity ratio of 346.1%, which may pose leverage considerations. Operating cash flow and free cash flow remain positive, supporting operational stability.
Sector Specific Factors: The Indian automotive sector presents opportunities through rising demand for two-wheelers and electric vehicles, though challenges include regulatory changes and competitive pressures. TVS Motor's innovation focus and export footprint position it to capitalize on these trends.
Market Positioning: TVS Motor holds a strong market position in India with a diversified product portfolio and a growing international presence, leveraging brand strength and technological advancements.
Overall Business and Market Assessment
Supporting Factors: Robust revenue and earnings growth with record sales volumes.
Risk Factors: Elevated valuation multiples relative to industry peers.
SWOT Analysis
Strengths
- Established brand with a diversified product portfolio in two and three-wheelers.
- Strong return on equity at approximately 23.7%.
- Robust revenue growth and record sales volumes in recent fiscal periods.
- Global export presence to over 60 countries enhancing market reach.
Weaknesses
- High trailing P/E ratio indicating premium valuation.
- Elevated debt-to-equity ratio of over 346%, suggesting leverage risk.
- Price-to-book ratio significantly above industry average.
- Current ratio slightly above 1, indicating limited short-term liquidity buffer.
Opportunities
- Growing demand for electric vehicles and two-wheelers in India and abroad.
- Product innovation and recent launches enhancing competitive positioning.
- Expansion in international markets through exports.
- Favorable demographic trends supporting mobility sector growth.
Threats
- Intense competition within the Indian automotive industry.
- Regulatory changes impacting emissions and safety standards.
- Market volatility affecting stock price and investor sentiment.
- Economic fluctuations influencing consumer purchasing power.
Company Description
TVS Motor Company Limited is a renowned automotive manufacturer based in India, specializing in the production of two-wheelers and three-wheelers. As one of the major players in the Indian automotive industry, TVS Motor is dedicated to advancing mobility through its diverse range of products, which includes motorcycles, scooters, mopeds, and autorickshaws. The company is well-known for its focus on innovation, safety, and customer satisfaction. TVS Motor's portfolio encompasses popular names such as the Apache series, Jupiter scooters, and NTorq, among others, catering to both urban and rural segments. With a strong emphasis on technological advancements, TVS Motor invests in research and development to drive future growth, enhance fuel efficiency, and reduce environmental impact. The company also exports to over 60 countries, marking its presence on the global stage. TVS Motor plays a pivotal role in India's automotive sector, contributing to employment, manufacturing, and the overall economy, while continuously striving to enhance the riding experience for its consumers.