

TVS Motor Company Limited (TVSMOTOR)
Stock Analysis Report
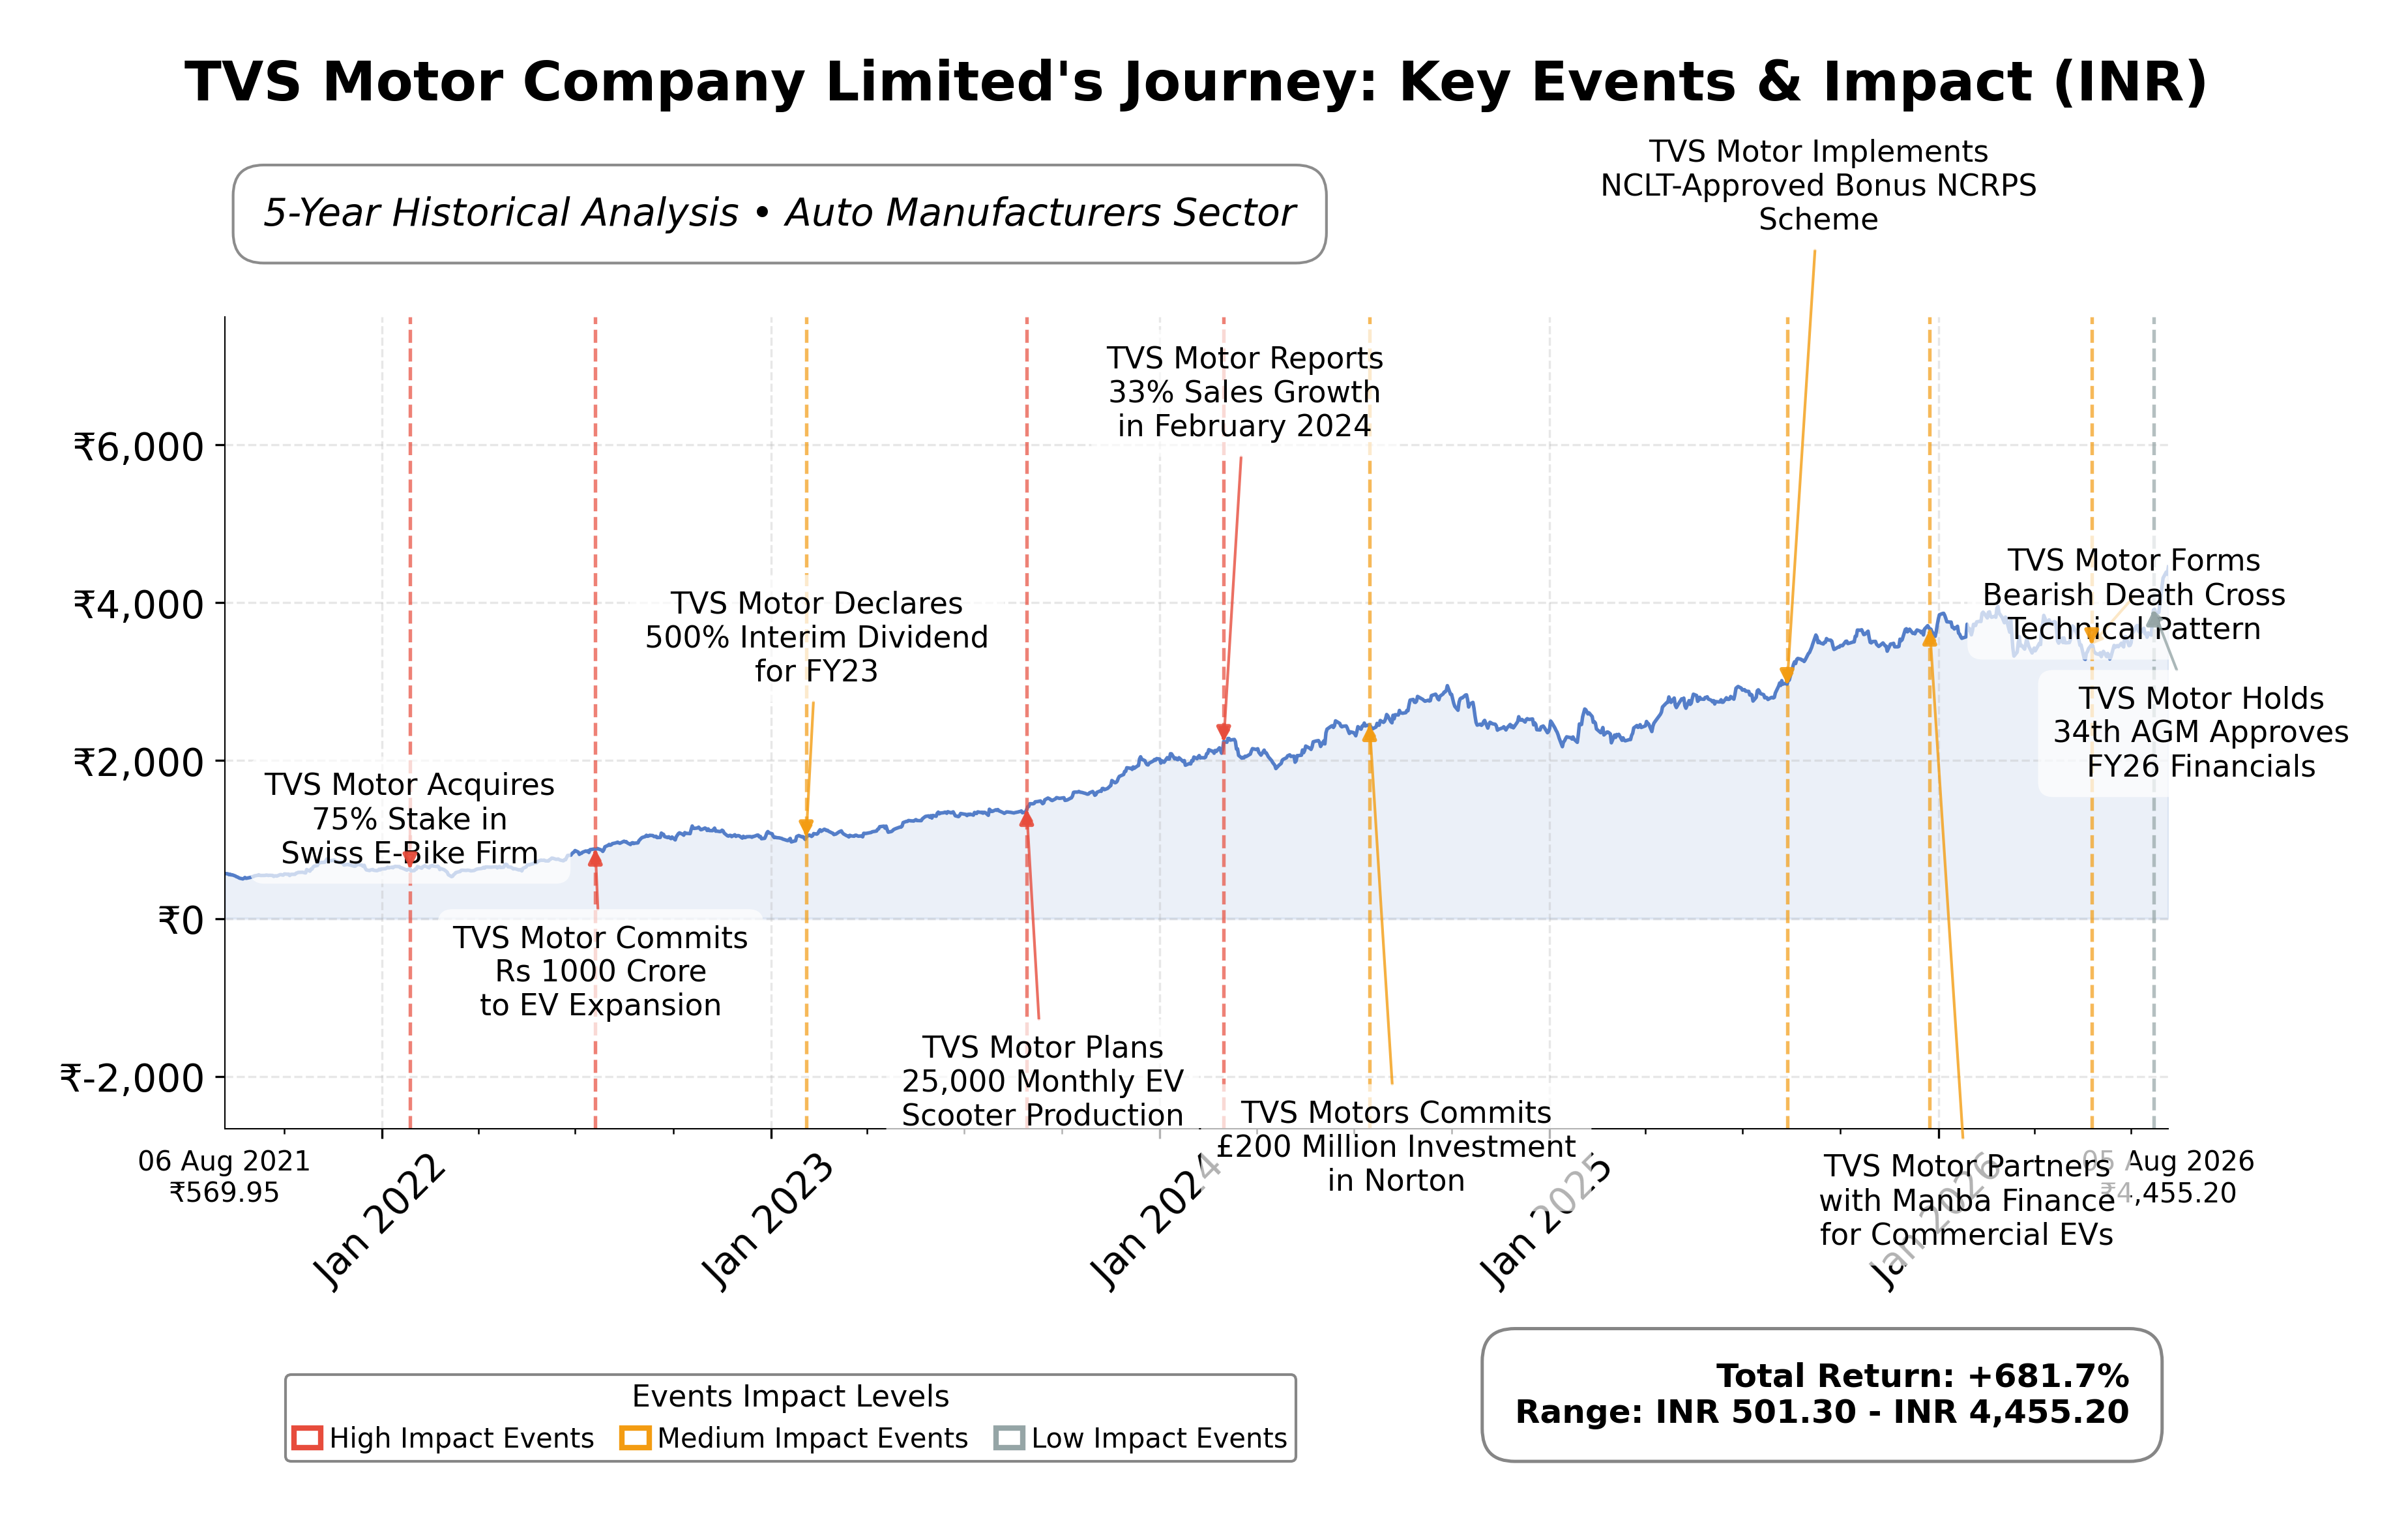
Stock Journey
Key Positives and Key Risks
Pros
- Robust revenue growth of 34.3% year-over-year demonstrates strong market demand and operational execution.
- Return on equity of 28.2% indicates efficient use of shareholder capital and profitability.
- Significant free cash flow of INR 30.2 billion supports financial flexibility and investment capacity.
Cons
- High debt-to-equity ratio of 306% raises concerns about financial leverage and interest obligations.
- Elevated trailing P/E ratio of 53.7 and price-to-book ratio of 55.2 suggest the stock is trading at a premium valuation.
- Negative operating cash flow of INR -1.8 billion indicates potential short-term liquidity or working capital challenges.
Disclosure: This information is for general awareness and does not constitute investment advice
Report Summary
TVS Motor Company Limited is a leading Indian automotive manufacturer specializing in two-wheelers and three-wheelers, including motorcycles, scooters, mopeds, and autorickshaws. Listed on the NSE under the consumer cyclical sector, TVS Motor is recognized for its innovation and extensive product portfolio, including popular models like the Apache series and Jupiter scooters. The company serves both domestic and international markets, exporting to over 60 countries, and plays a significant role in India's automotive industry with a focus on mobility, safety, and fuel efficiency.
Financially, TVS Motor reported trailing twelve months (TTM) revenue of approximately INR 602 billion with a gross margin of 35.8%, operating margin of 13.1%, and net profit margin of 5.7%. The company’s return on equity (ROE) stands at a robust 28.2%, while return on assets (ROA) is 5.3%, indicating efficient use of equity capital and assets. The return on invested capital (ROIC) is reflected in an enterprise value to EBITDA ratio of 25.3, suggesting moderate capital efficiency relative to earnings.
Valuation metrics show a trailing price-to-earnings (P/E) ratio of 53.7 and a forward P/E of 34.0, with a price-to-book (P/B) ratio of 55.2, indicating a premium valuation relative to book value. The market capitalization is approximately INR 1.84 trillion. The stock trades near its 52-week high of INR 3,974.7, currently priced at INR 4,386.3, reflecting strong recent price appreciation and investor interest.
Key strengths include strong brand recognition, a diversified product portfolio, and significant export growth with a 35% year-over-year increase. The company maintains a solid cash position of INR 44.7 billion but carries substantial debt of INR 328 billion, resulting in a high debt-to-equity ratio of 306%. Risks include commodity price inflation, competitive pressures in the two-wheeler segment, and supply chain constraints, particularly in electric vehicle components. Recent strategic initiatives focus on premiumization, EV growth, and international market expansion.
Technically, the stock exhibits upward momentum, trading above its 50-day moving average but slightly below the 200-day average, with positive momentum indicators across multiple timeframes. Recent news highlights strong earnings growth and market share gains. Overall, the data suggests a cautious but constructive environment for monitoring the stock’s performance and market developments.
Company and Industry Overview
Company Basics
Price Performance
Company Size
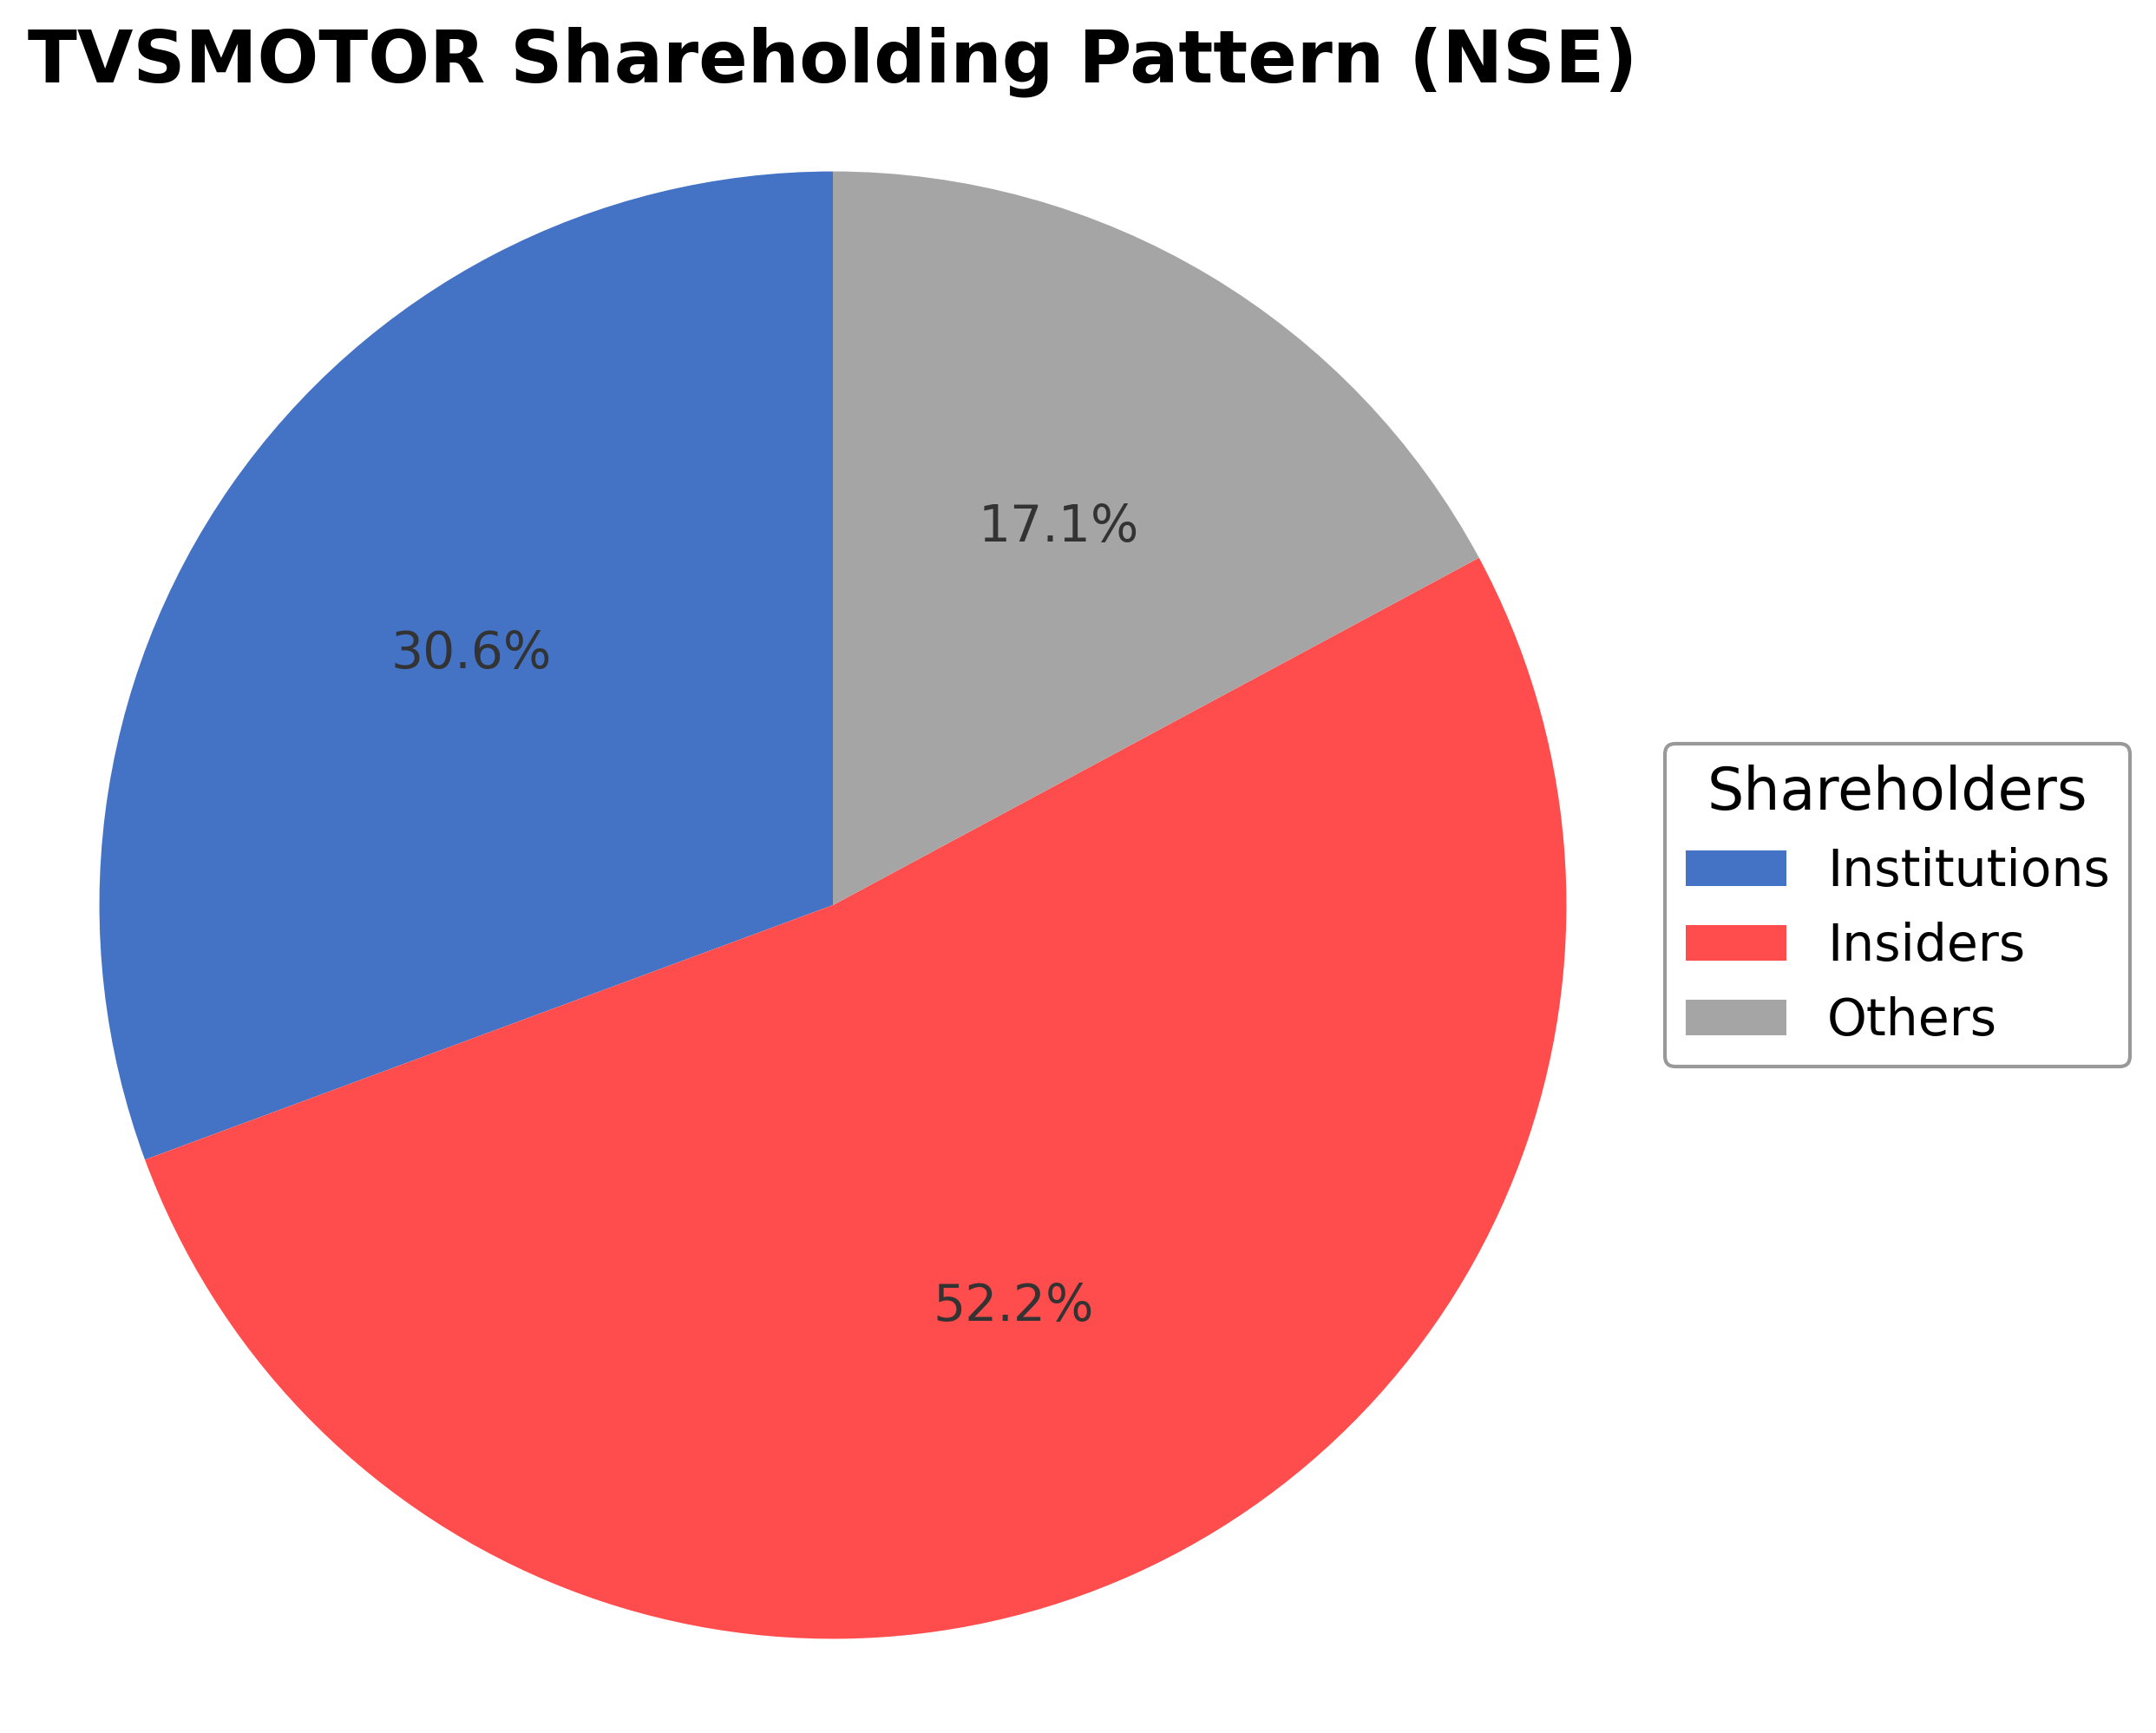
Shareholding Pattern
Sector and Industry Analysis
The two-wheeler sector in India is a significant component of the automotive market, characterized by robust demand driven by urbanization, rising disposable incomes, and increasing need for affordable personal mobility. The market has demonstrated strong growth, with a compounded annual growth rate (CAGR) in sales exceeding 20% over recent years. Major players include Hero MotoCorp, Bajaj Auto, Honda Motorcycle & Scooter India, and TVS Motor Company, collectively commanding substantial market share and driving innovation and volume growth.
Industry trends highlight a shift towards electric mobility, with manufacturers investing heavily in electric two-wheelers to align with environmental goals and changing consumer preferences. Competition remains intense, with established players leveraging brand loyalty, extensive distribution networks, and product diversification to maintain leadership. Barriers to entry are high due to capital intensity, technology requirements, and regulatory compliance, which favor well-established companies with scale and R&D capabilities.
The regulatory environment is increasingly focused on emissions reduction and safety standards, with policies such as the Bharat Stage VI emission norms and incentives for electric vehicle adoption shaping industry dynamics. Government initiatives promoting electric vehicles through subsidies and infrastructure development are accelerating the transition to cleaner mobility. These regulations and policies are expected to influence product development, cost structures, and competitive positioning in the medium to long term.
Note: Analysis synthesized from industry research, market reports, and regulatory filings. Information is subject to change based on market conditions.
Financial Ratios Dashboard
Illustrative Scenario Analysis
DCF Assumptions:
Method: Two-Stage EPS-Priority Model
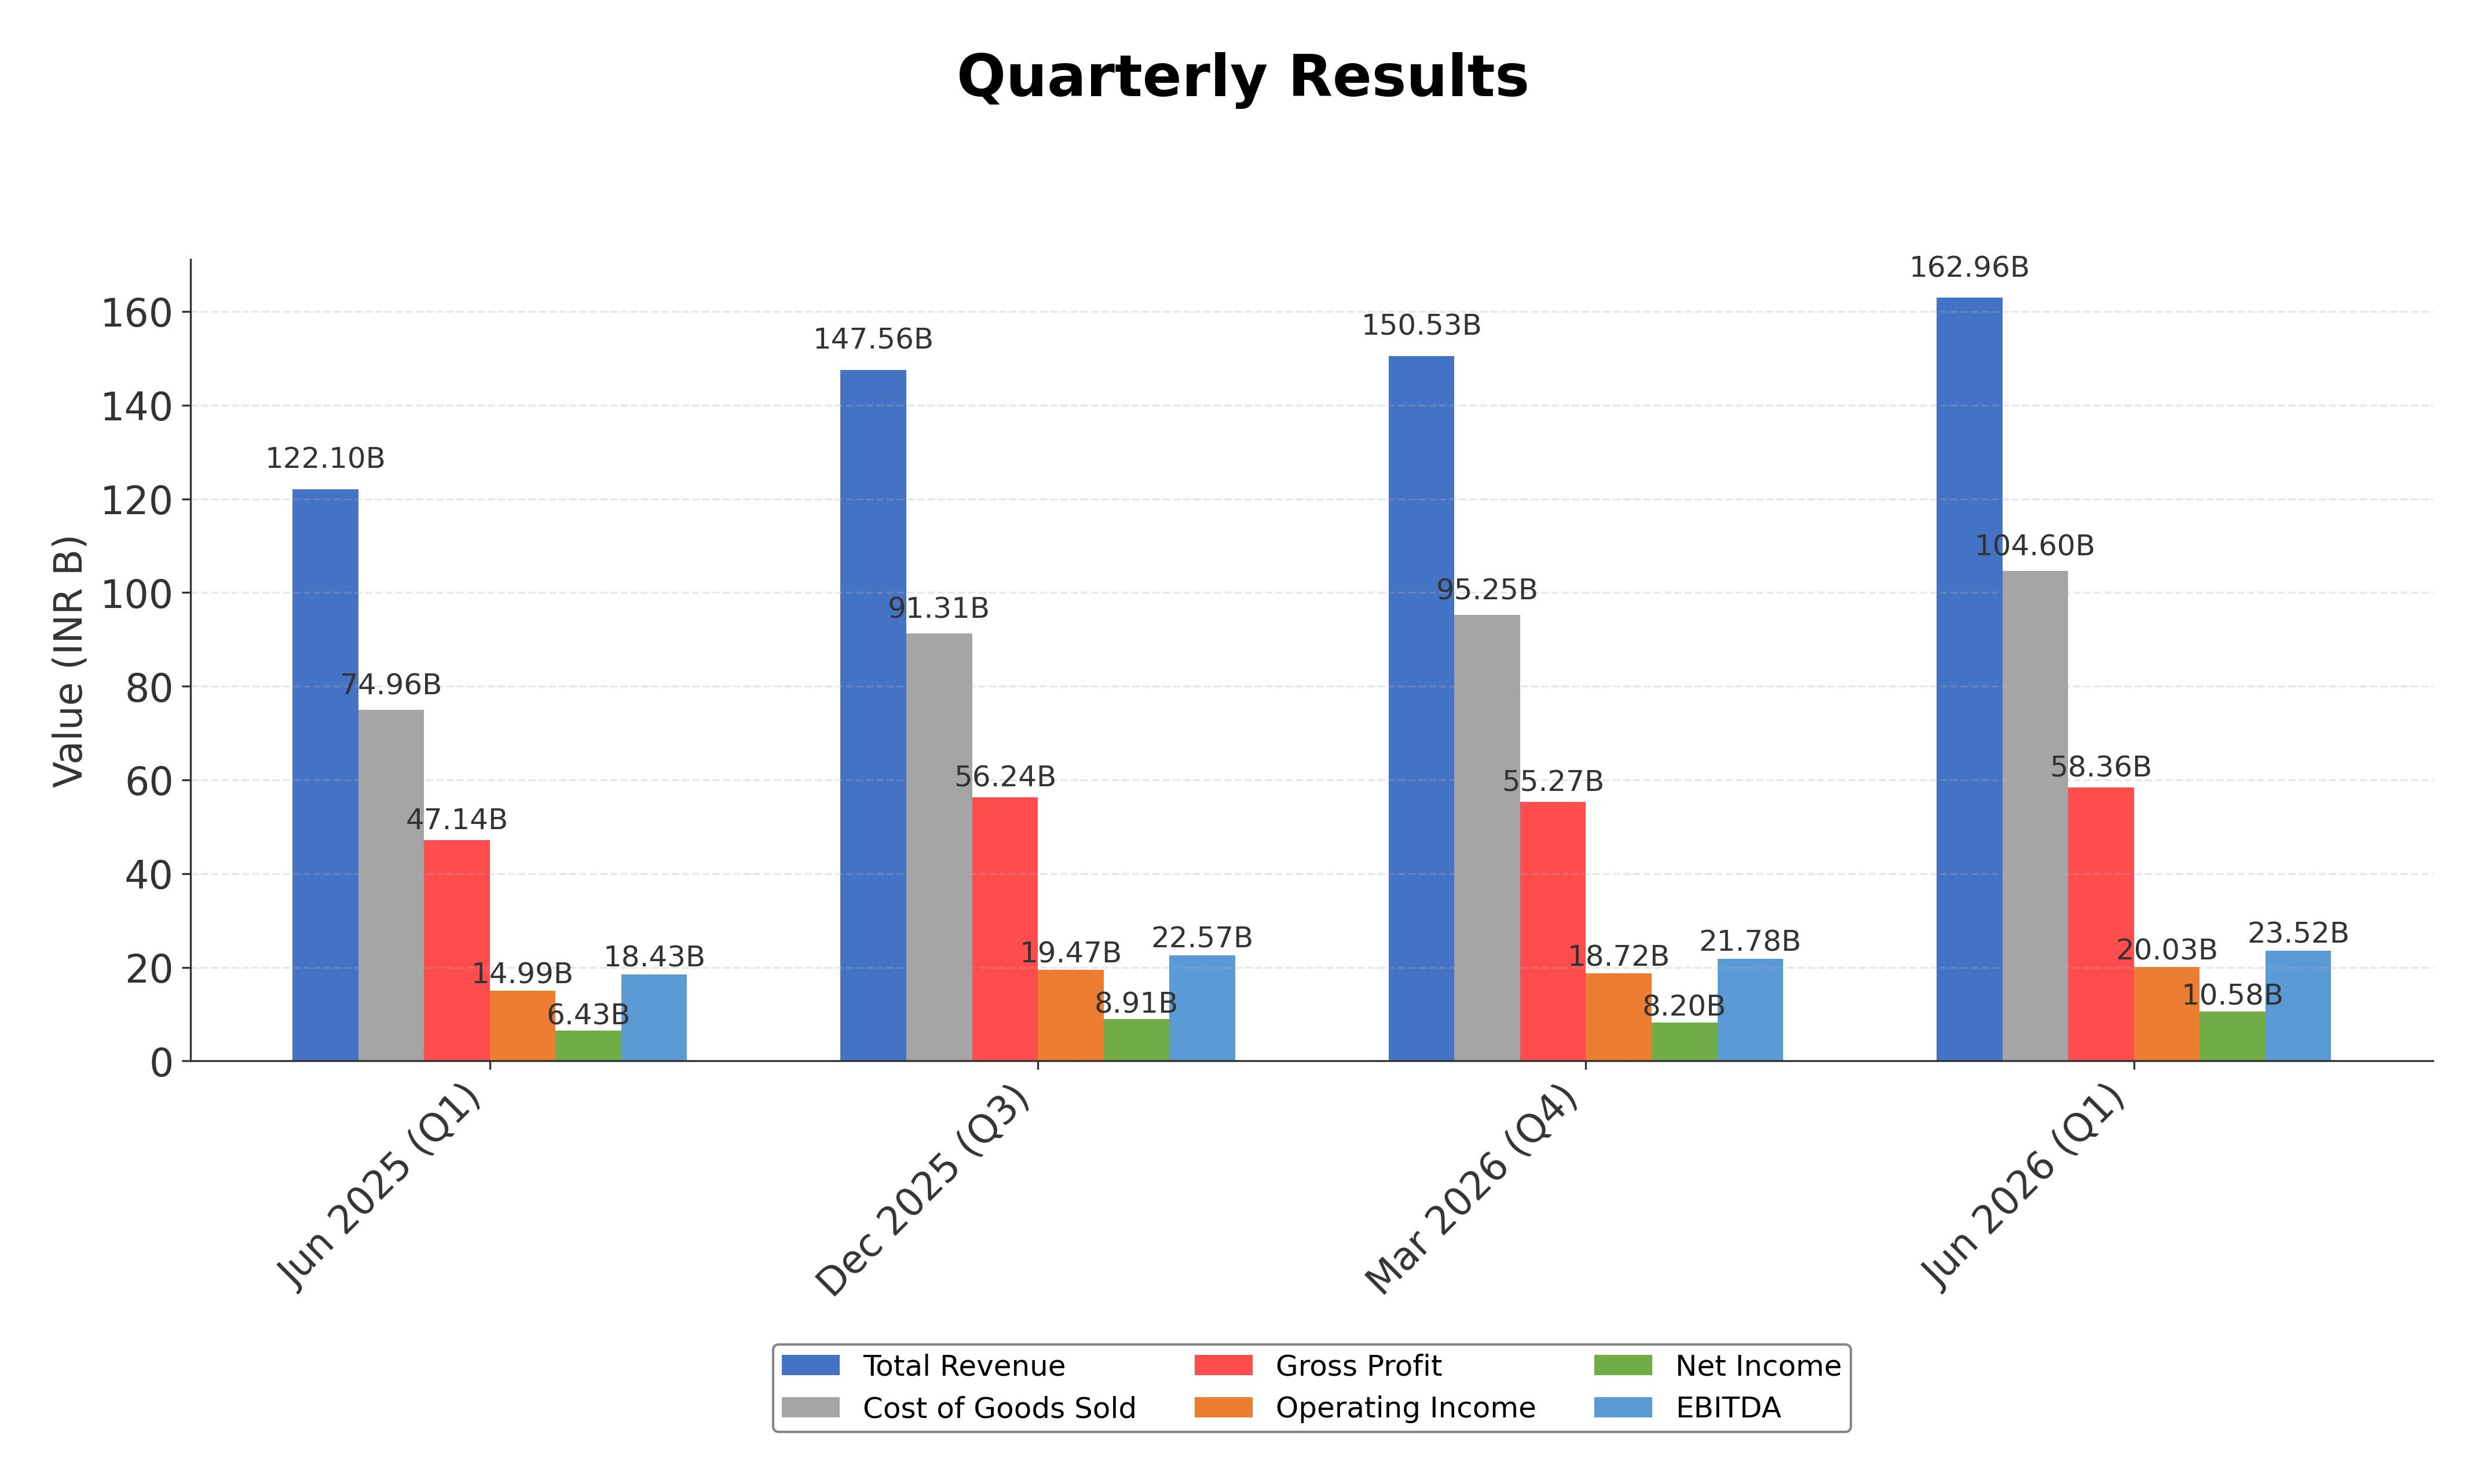
Financials
Peer Analysis
| Company Name | Market Cap | P/E Ratio | P/B Ratio | EV/EBITDA | Price to CFO |
|---|---|---|---|---|---|
| TVS Motor Company Limited | ₹1.84T | 53.70 | 55.21 | 25.34 | -1020.49 |
| Bajaj Auto Limited | ₹3.11T | 26.86 | 8.12 | 19.70 | 52.19 |
| Eicher Motors Ltd. | ₹2.09T | 38.47 | 8.44 | 35.65 | 43.58 |
| Hero Motocorp Ltd. | ₹1.00T | 18.04 | 4.79 | 13.43 | 12.06 |
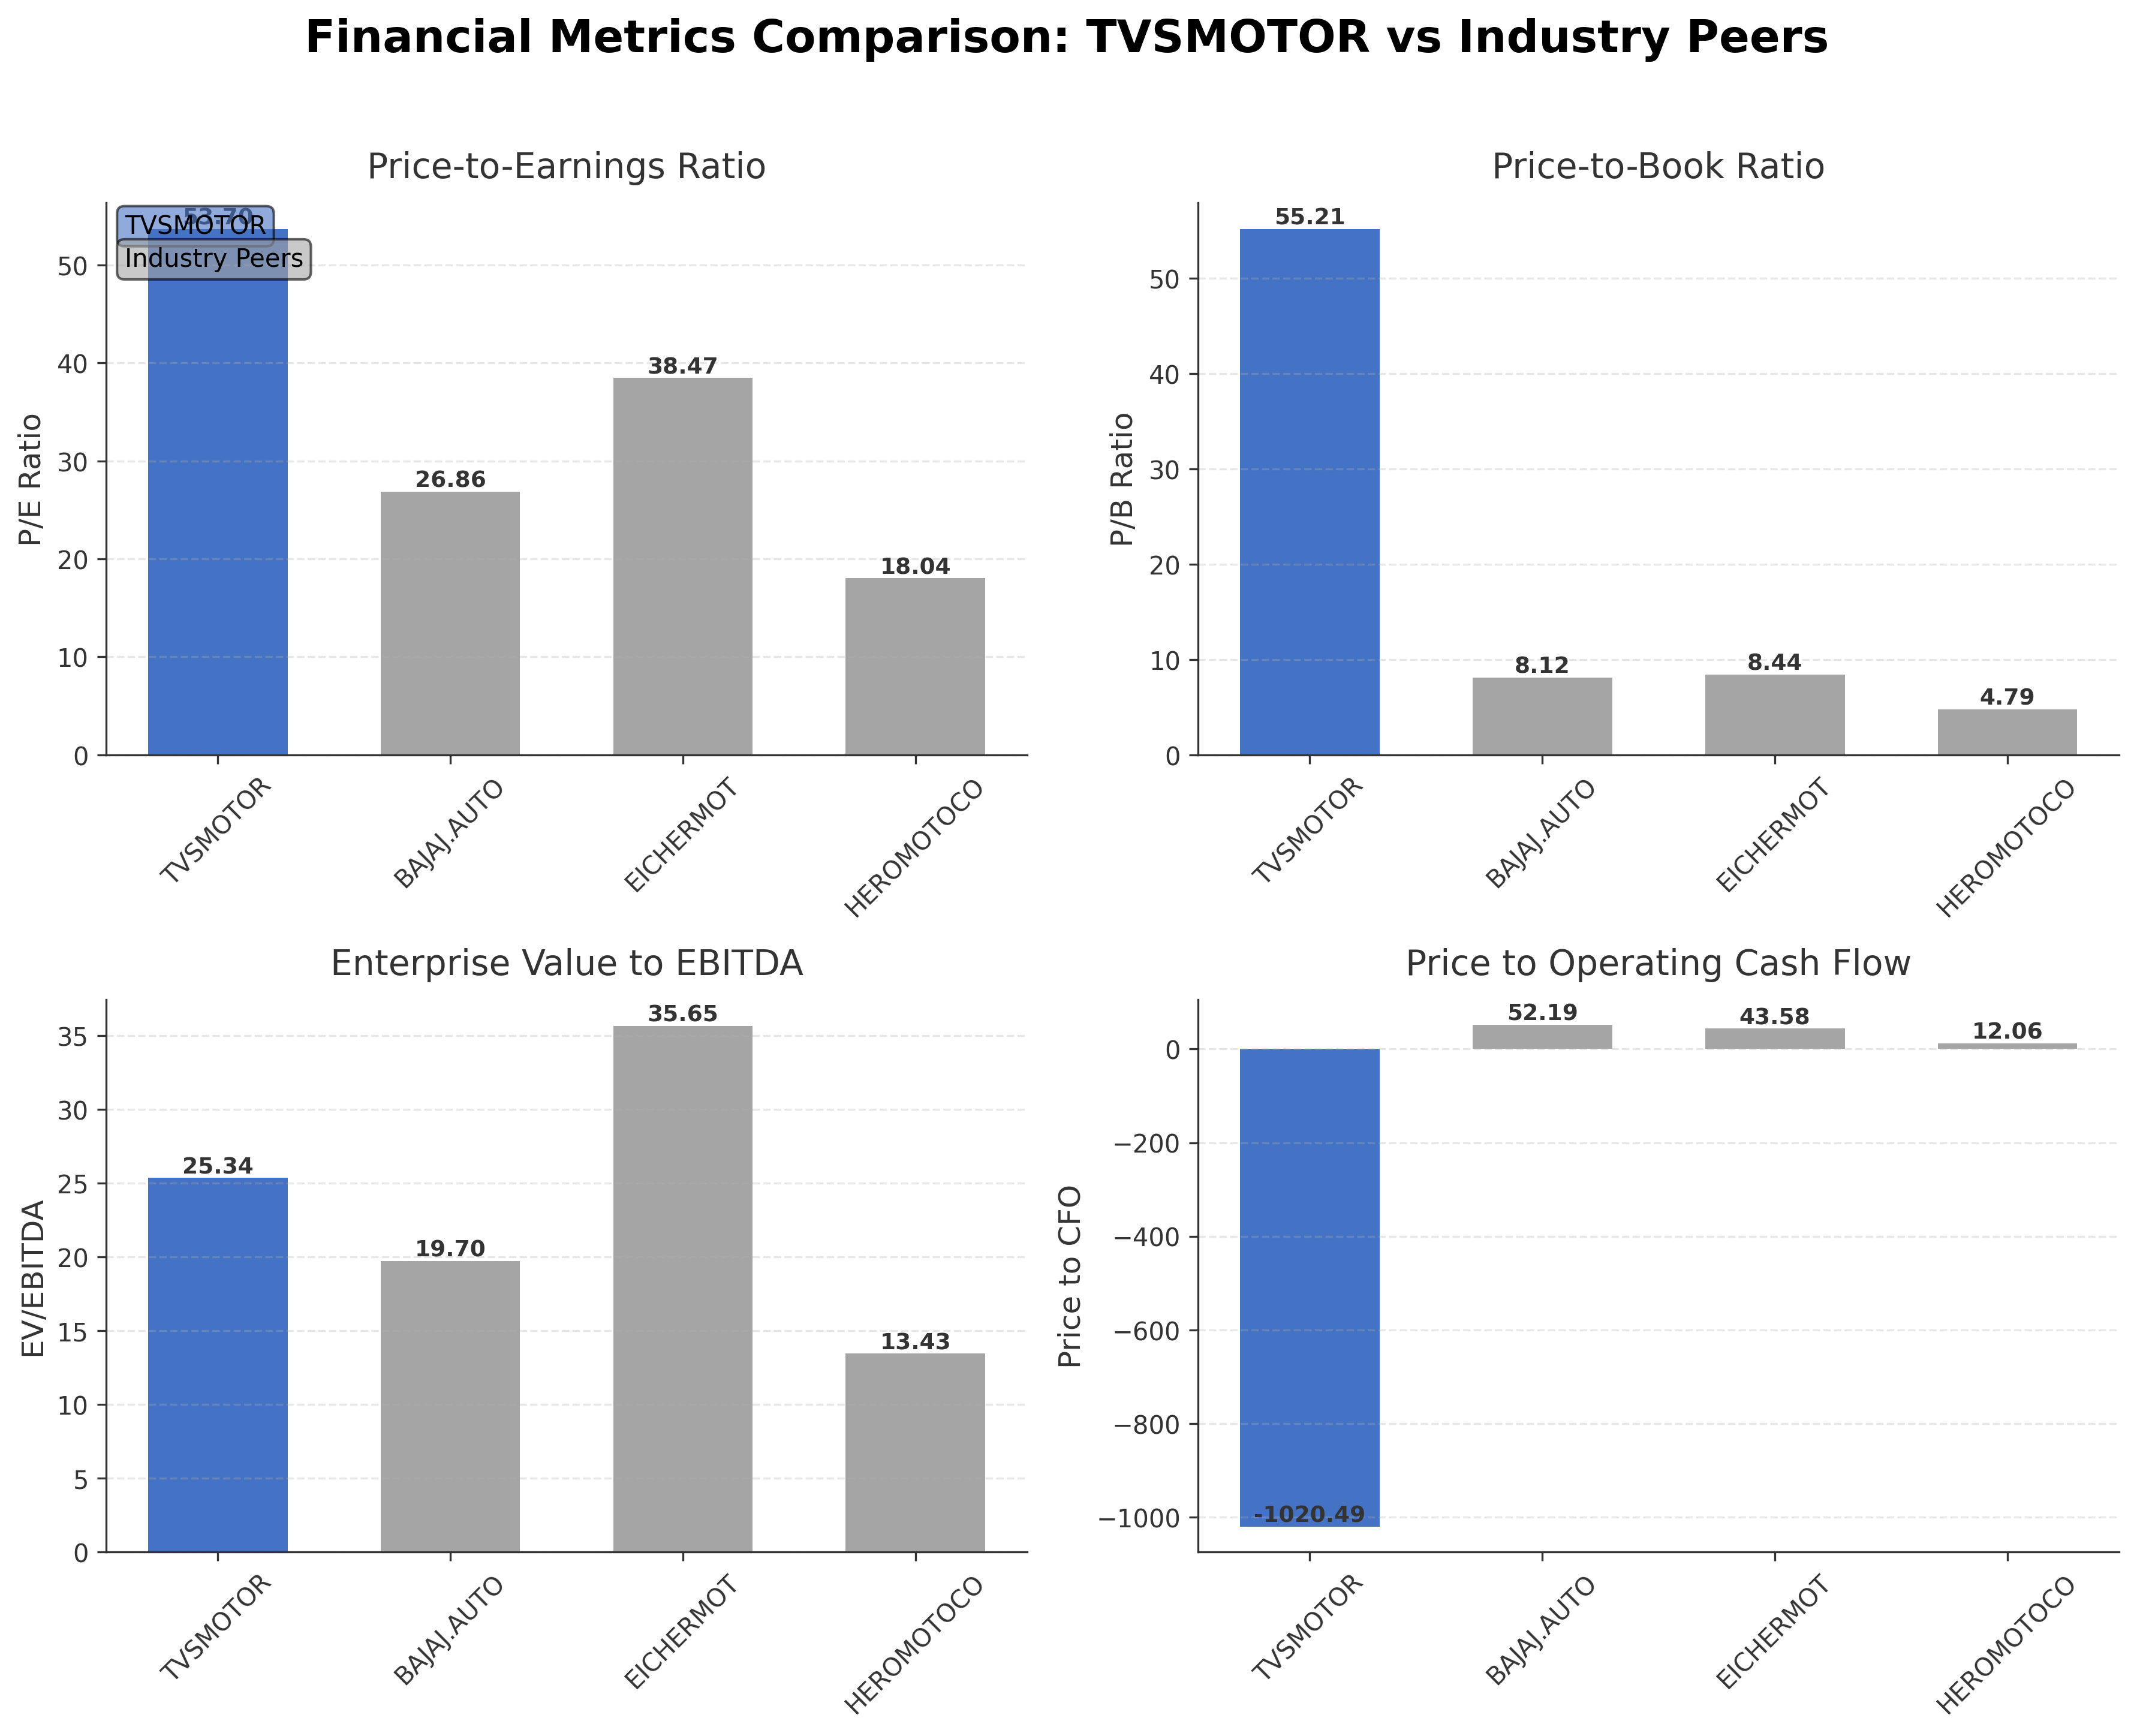
Comparison Analysis: TVS Motor Company trades at a significantly higher P/E ratio of 53.7 compared to its peers Bajaj Auto (26.9), Eicher Motors (38.5), and Hero Motocorp (18.0), indicating a premium valuation. Its P/B ratio of 55.2 is also substantially above the peer range of 4.79 to 8.44, reflecting market expectations for growth or intangible asset value. The EV/EBITDA multiple of 25.3 is moderate relative to Eicher Motors’ 35.7 but higher than Bajaj Auto and Hero Motocorp. TVS Motor’s return on equity of 28.2% is competitive, slightly above Bajaj Auto and Hero Motocorp, and superior to Eicher Motors. However, the negative price to cash flow ratio contrasts with positive values for peers, suggesting caution on cash flow metrics. Overall, TVS Motor shows strong profitability but trades at a valuation premium relative to regional industry peers.
Financial Metrics Comparison with Peers
Financial Statements
Comprehensive financial data including income, balance sheet, and cash flow metrics
Income Statement
| fiscal_date | 2026-03-31 | 2025-03-31 | 2024-03-31 | 2023-03-31 | 2022-03-31 |
|---|---|---|---|---|---|
| Sales | 476.52B | 368.87B | 330.34B | 274.34B | 213.21B |
| Cost Of Goods | 349.44B | 267.80B | 244.65B | 209.06B | 163.17B |
| Gross Profit | 127.08B | 101.08B | 85.70B | 65.28B | 50.04B |
| Operating Expense Selling General And Administrative | 28.19B | 22.73B | 18.11B | 13.36B | 11.16B |
| Operating Expense Other Operating Expenses | 55.09B | 47.94B | 39.32B | 27.75B | 20.41B |
| Operating Income | 9.20B | -1.83B | -5.35B | -5.47B | -4.33B |
| Non Operating Interest Income | 62.56B | 58.26B | 51.33B | 37.66B | 24.55B |
| Non Operating Interest Expense | 22.20B | 20.83B | 19.17B | 13.56B | 8.83B |
| Pretax Income | 48.22B | 35.05B | 27.03B | 19.36B | 10.67B |
| Income Tax | 16.35B | 11.55B | 9.24B | 6.27B | 3.36B |
| Net Income | 31.86B | 23.80B | 17.79B | 13.09B | 7.31B |
| Eps Basic | 63.53 | 47.05 | 35.50 | 27.97 | 15.93 |
| Eps Diluted | 63.53 | 47.05 | 35.50 | 27.97 | 15.93 |
| Basic Shares Outstanding | 475.09M | 475.09M | 475.09M | 475.09M | 475.09M |
| Diluted Shares Outstanding | 475.09M | 475.09M | 475.09M | 475.09M | 475.09M |
| Ebit | 70.42B | 55.89B | 46.20B | 32.92B | 19.50B |
| Ebitda | 84.33B | 66.07B | 55.29B | 40.43B | 27.30B |
| Net Income Continuous Operations | 48.22B | 35.28B | 27.03B | 19.36B | 10.67B |
| Minority Interests | -1.68B | -1.44B | -921.70M | 192.10M | 259.40M |
| Preferred Stock Dividends | 0.00 | 0.00 | 0.00 | 0.00 | 0.00 |
Data provided by Twelve Data
Balance Sheet
| fiscal_date | 2026-03-31 | 2025-03-31 | 2024-03-31 | 2023-03-31 | 2022-03-31 |
|---|---|---|---|---|---|
| Cash And Cash Equivalents | 39.26B | 41.15B | 23.56B | 18.51B | 14.46B |
| Accounts Receivable | 26.54B | 17.17B | 18.39B | 12.56B | 11.77B |
| Total Assets | 565.01B | 479.37B | 422.20B | 352.33B | 271.27B |
| Total Liabilities | 457.88B | 384.95B | 347.09B | 293.23B | 220.74B |
| Long Term Debt | 129.86B | 146.85B | 131.33B | 96.28B | 77.09B |
| Shareholders Equity | 107.13B | 94.42B | 75.11B | 59.10B | 50.53B |
Data provided by Twelve Data
Cash Flow Statement
| fiscal_date | 2026-03-31 | 2025-03-31 | 2024-03-31 | 2023-03-31 | 2022-03-31 |
|---|---|---|---|---|---|
| Operating Activities Net Income | 48.22B | 35.28B | 27.03B | 19.36B | 10.67B |
| Operating Activities Stock Based Compensation | 196.60M | 330.80M | N/A | N/A | N/A |
| Operating Activities Other Non Cash Items | 2.67B | 2.03B | 2.47B | 1.89B | 1.50B |
| Operating Activities Accounts Receivable | -48.61B | -7.18B | -55.15B | -66.26B | -30.02B |
| Operating Activities Other Assets Liabilities | -4.27B | -5.22B | -2.90B | -6.19B | -4.92B |
| Operating Activities Operating Cash Flow | 18.67B | 25.23B | -28.55B | -51.20B | -22.77B |
| Investing Activities Net Acquisitions | -40.40M | -943.40M | 2.61B | 2.64B | -4.67B |
| Investing Activities Purchase Of Investments | -1.87B | -4.24B | -2.23B | -2.66B | -1.47B |
| Investing Activities Sale Of Investments | 3.35B | 563.20M | 478.20M | 0.00 | 874.40M |
| Investing Activities Investing Cash Flow | 1.44B | -29.21B | -5.45B | -12.52B | -14.83B |
| Financing Activities Short Term Debt Issuance | 35.56B | 10.26B | -1.82B | 11.20B | 6.20B |
| Financing Activities Common Stock Issuance | 60.80M | N/A | N/A | N/A | N/A |
| Financing Activities Common Dividends | -5.70B | -4.75B | -3.80B | -2.92B | -1.90B |
| Financing Activities Other Financing Charges | 284.80M | 427.40M | -439.60M | 622.70M | -72.40M |
| Financing Activities Financing Cash Flow | 30.20B | 4.98B | -6.06B | 63.58B | 31.56B |
| End Cash Position | 39.26B | 41.15B | 23.56B | 18.51B | 14.46B |
| Free Cash Flow | -13.68B | 10.25B | -23.98B | -57.46B | -25.45B |
| Investing Activities Capital Expenditures | N/A | -24.59B | -11.11B | -13.19B | -9.56B |
| Financing Activities Common Stock Repurchase | N/A | -952.70M | N/A | N/A | N/A |
| Investing Activities Other Investing Activity | N/A | N/A | 4.80B | 688.00M | -4.00M |
| Financing Activities Long Term Debt Issuance | N/A | N/A | N/A | 54.68B | 27.33B |
Data provided by Twelve Data
Technical Analysis
Key Insights
- The current trend shows an upward price movement with the stock trading above its 50-day moving average (₹3,484) but slightly below the 200-day moving average (₹3,591), indicating a short-term bullish trend within a longer-term consolidation phase.
- Key support levels are identified near ₹3,750 and ₹3,500, while resistance is observed around the recent highs near ₹4,000 to ₹4,450.
- The stock is positioned above the 10-day moving average, suggesting recent positive momentum, but remains close to the 200-day average, indicating potential volatility.
- Momentum indicators show RSI in a moderately overbought range, MACD is positive with a bullish crossover, and Stochastic oscillators confirm upward momentum on daily and weekly timeframes.
- Multi-timeframe analysis reveals consistent strength on daily and weekly charts, while monthly charts suggest a longer-term sideways trend with potential for breakout.
- Current technical setup supports scenarios of continued upward momentum with possible short-term pullbacks near resistance levels, warranting close monitoring of volume and momentum shifts.
Trending News
1. Headline: Sensex Today, Stock Market Highlights | Nifty | Share Market: Sensex Settles 373 Points Higher As Oil Falls Below $80
Summary: Stock Market, Sensex, Share Market, Nifty Highlights: Oil prices slip below $80 as Iran-Oman talks fuel hopes for US-Iran peace deal.
Sentiment: negative
Summary: New 52-week high: Rs 4452.45| CMP: Rs 4417.3. In the last one month, the stock has gained about 22%. TVS Motor Company
Sentiment: positive
Summary: A total of 112 stocks hit their upper circuit limits, and 85 touched their lower circuit bands in the afternoon session.
Sentiment: positive
4. Headline: TVS Motor Company shares gain over 2% to Rs 4,450 — TradingView News
Summary: TVS Motor Company shares saw a notable uptick in Wednesday's trading session, rising 2.06% to trade at Rs 4,450. The stock is a constituent of the NIFTY NEXT 50 index.The company has demonstrated robust financial performance across both quarterly and annual metrics.
Sentiment: positive
5. Headline: TVS Motor: Gaining market share, growing margins- Moneycontrol.com
Summary: Premiumisation, new product launches and market penetration have put the firm’s profitability on firm ground
Sentiment: positive
Powered by Brave
Recent Updates
News Summary
As of 2026-01-28. TVS Motor Company Limited has demonstrated strong financial and operational performance in recent quarters, highlighted by record revenue growth of 37% year-over-year and all-time high profitability. The company’s strategic focus on premiumization and electric vehicle segments has driven robust volume growth, with EV sales increasing by 40% YoY despite temporary supply constraints. Export markets have expanded significantly, growing 35% YoY, supported by demand recovery in Africa, Latin America, and parts of Asia. Capital expenditures have been increased to INR 1,700 crores, emphasizing capacity expansion and brand development. Management remains optimistic about sustained industry growth, projecting an 8–9% CAGR for two-wheelers, backed by infrastructure improvements and rising mobility needs.
News Sentiment
The overall sentiment across recent updates is positive, driven by strong earnings performance, accelerating EV sales, and expanding export revenues. Positive investor interest is reflected in the stock’s recent price appreciation and trading volumes. However, cautiousness remains due to commodity inflation pressures and supply chain challenges in EV components, which management is addressing through cost control and pricing strategies. The balanced approach to growth and margin management supports a constructive outlook, tempered by external risks such as raw material costs and global market uncertainties.
Source List
- https://www.tvsmotor.com/investors/overview
- https://www.alphaspread.com/security/nse/tvsmotor/investor-relations
- https://www.tvsmotor.com/investors/investor-information
- https://www.tvsmotor.com/investors/financial-reports
- https://www.alphaspread.com/security/nse/tvsmotor/investor-relations/earnings-call/q3-2026
Analytical Overview
Analysis Summary
TVS Motor’s valuation metrics, including a trailing P/E of 53.7 and forward P/E of 34.0, are elevated relative to the industry average P/E of 53.7, reflecting market expectations for growth but also a premium valuation. The company’s revenue growth of 34.3% year-over-year and positive free cash flow of INR 30.2 billion demonstrate a strong growth trajectory supported by expanding product lines and geographic reach. Financial health shows a high debt-to-equity ratio of 306%, indicating leverage risk, though ample cash reserves and positive operating cash flow trends mitigate liquidity concerns. Sector-specific challenges include commodity inflation and supply chain constraints, while opportunities arise from electric vehicle adoption and export market expansion. Considering India’s regulatory environment and growing consumer demand for mobility, TVS Motor is well positioned to capitalize on these trends.
Overall Business and Market Assessment
Supporting Factors: robust revenue and profit growth driven by premiumization and EV expansion, strong return on equity of 28.2%, and significant export market penetration
Risk Factors: the elevated debt levels and exposure to commodity price volatility, which could pressure margins
SWOT Analysis
Strengths
- Strong brand presence and diversified product portfolio in two-wheelers and three-wheelers.
- Robust revenue growth of 34.3% year-over-year supported by premium and EV segments.
- High return on equity at 28.2%, indicating efficient capital utilization.
- Significant export market expansion with 35% growth in international sales.
Weaknesses
- High debt-to-equity ratio of 306%, indicating elevated financial leverage.
- Negative operating cash flow despite positive free cash flow, suggesting working capital pressures.
- Premium valuation metrics with P/E of 53.7 and P/B of 55.2 may limit upside.
- Current ratio below 1 (0.98), indicating tight short-term liquidity.
Opportunities
- Growing electric vehicle market with 40% YoY increase in EV sales.
- Expansion into international markets, especially Africa and Latin America.
- Capacity expansion and increased capital investment to support future growth.
- Premiumization trend in product offerings enhancing margins.
Threats
- Commodity price inflation impacting input costs and margins.
- Supply chain constraints, particularly in EV component availability.
- Intense competition in the Indian two-wheeler market.
- Macroeconomic uncertainties affecting consumer demand.
Company Description
TVS Motor Company Limited is a renowned automotive manufacturer based in India, specializing in the production of two-wheelers and three-wheelers. As one of the major players in the Indian automotive industry, TVS Motor is dedicated to advancing mobility through its diverse range of products, which includes motorcycles, scooters, mopeds, and autorickshaws. The company is well-known for its focus on innovation, safety, and customer satisfaction. TVS Motor's portfolio encompasses popular names such as the Apache series, Jupiter scooters, and NTorq, among others, catering to both urban and rural segments. With a strong emphasis on technological advancements, TVS Motor invests in research and development to drive future growth, enhance fuel efficiency, and reduce environmental impact. The company also exports to over 60 countries, marking its presence on the global stage. TVS Motor plays a pivotal role in India's automotive sector, contributing to employment, manufacturing, and the overall economy, while continuously striving to enhance the riding experience for its consumers.