
Tube Investments of India Ltd (TIINDIA)
Stock Analysis Report
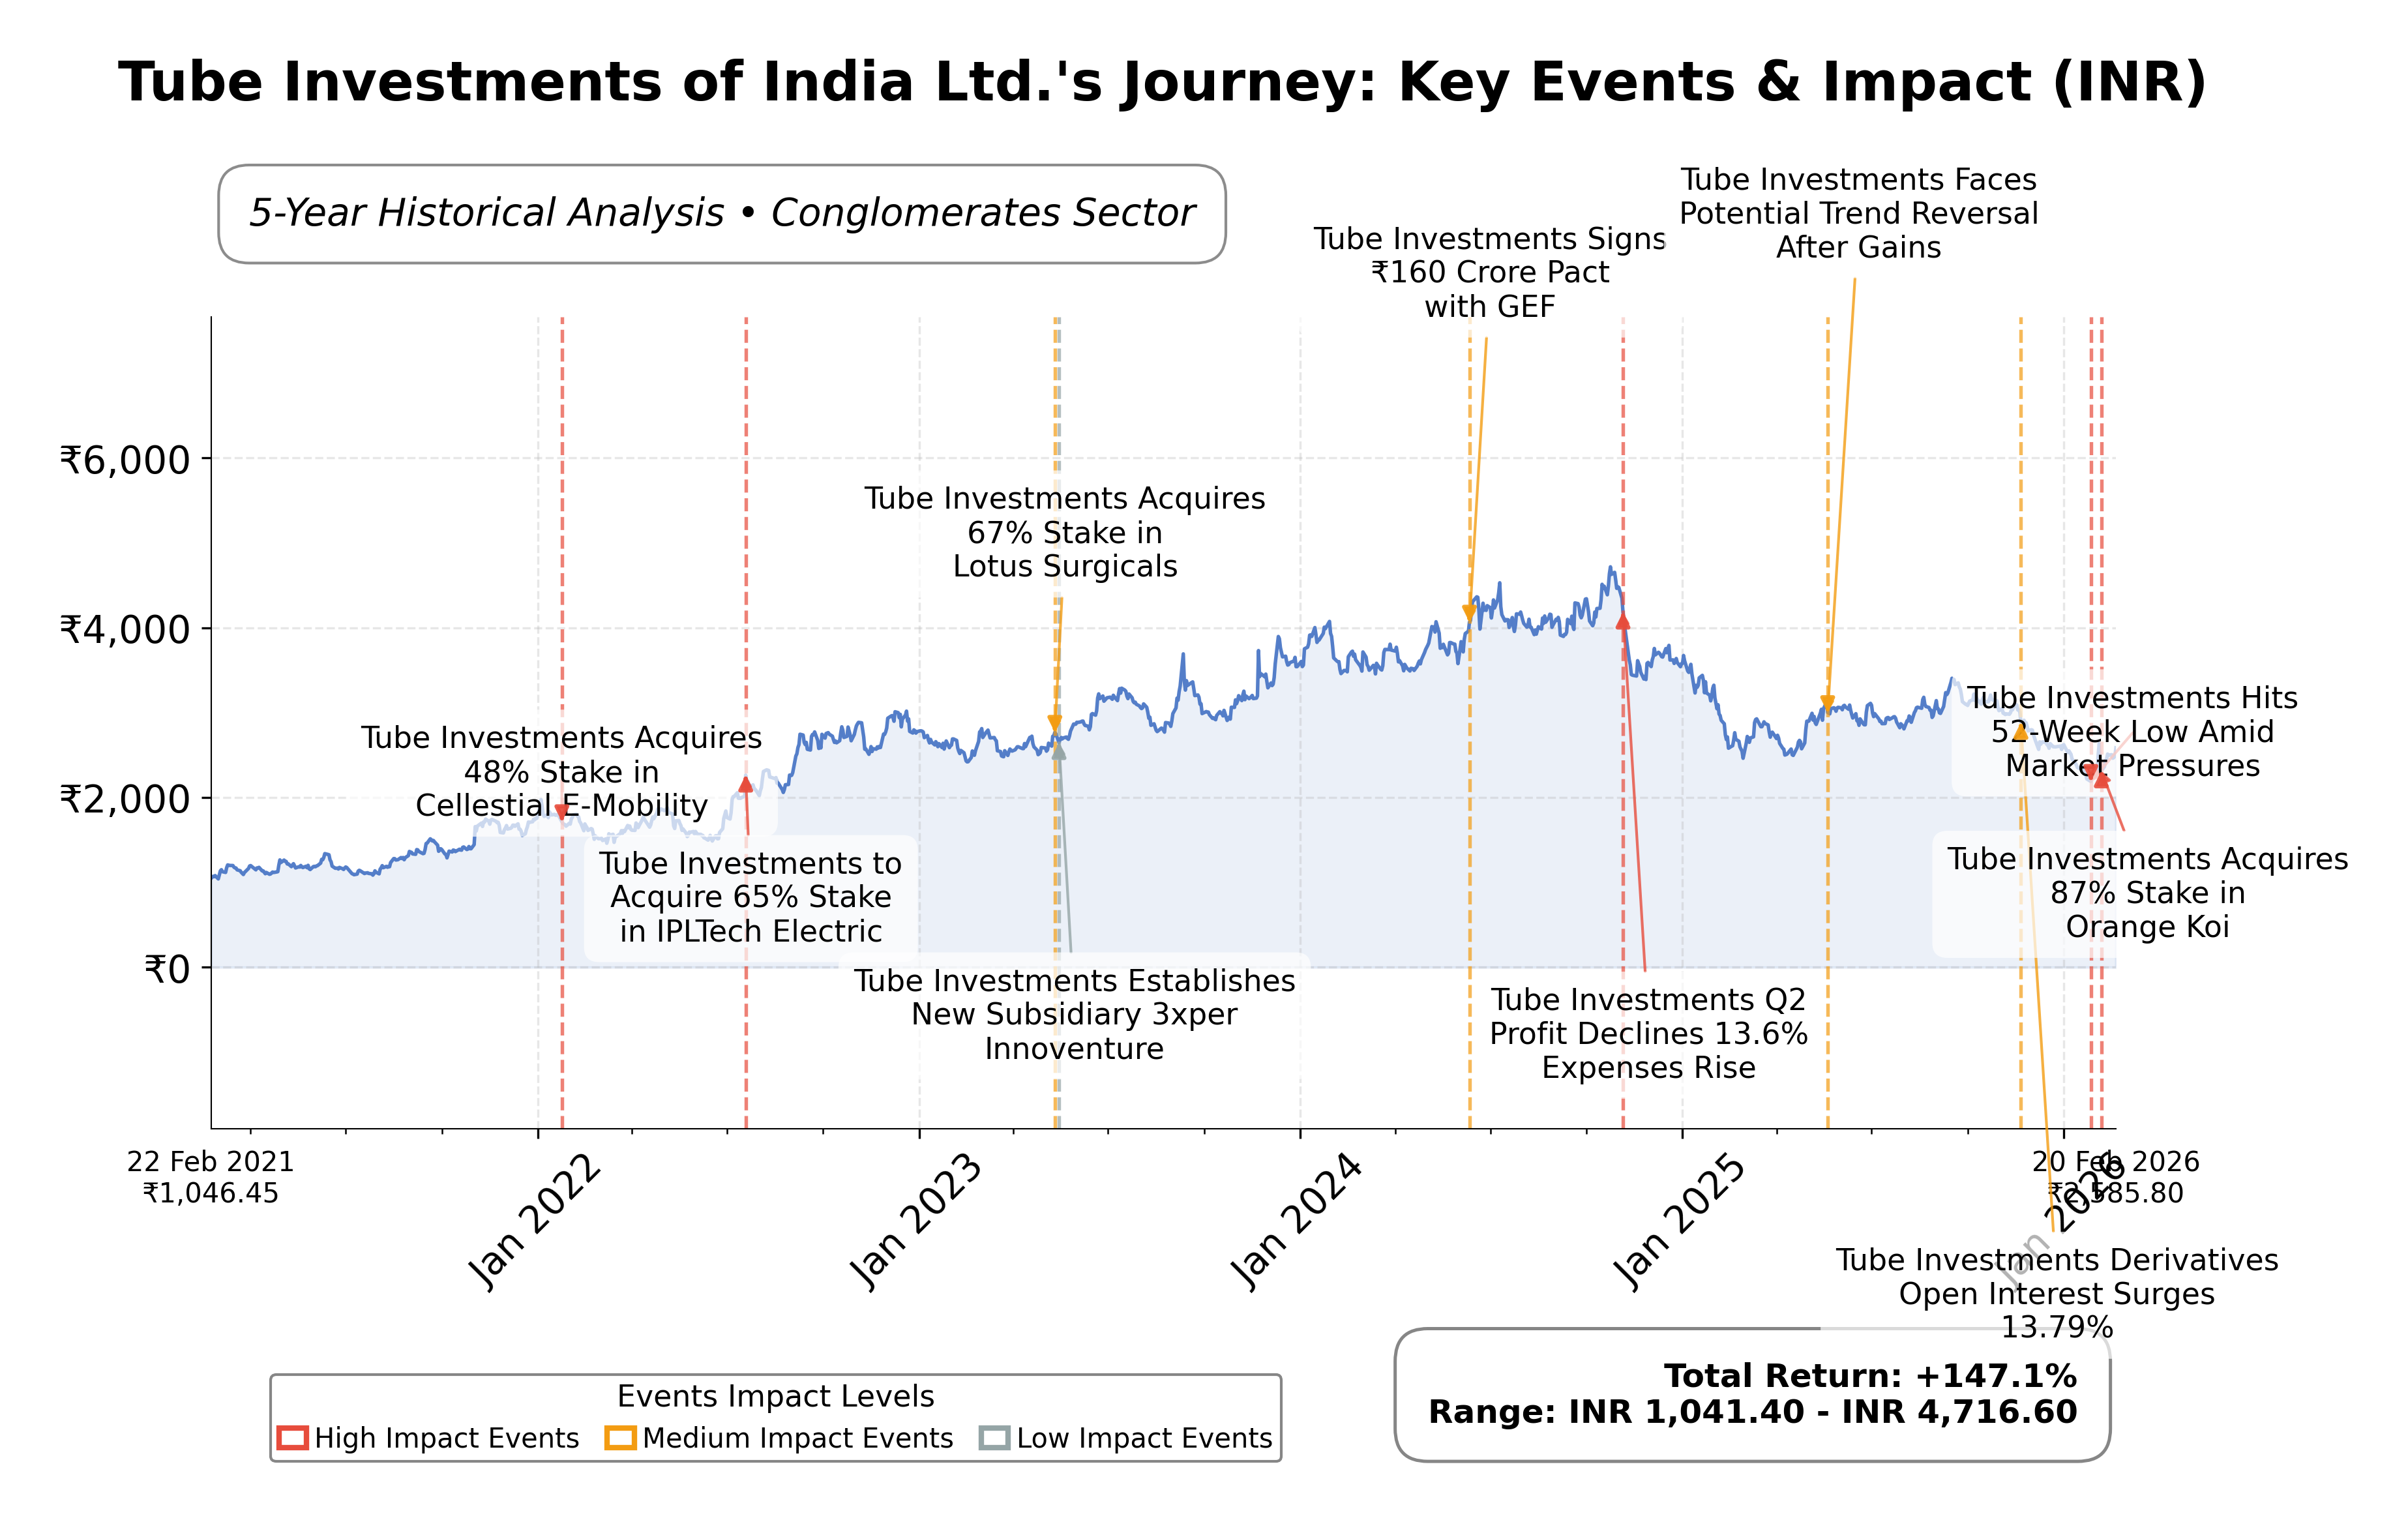
Stock Journey
Key Positives and Key Risks
Pros
- Revenue growth of 20.7% quarterly indicates strong top-line expansion supporting business momentum.
- Robust cash reserves of approximately ₹24 billion enhance liquidity and financial flexibility.
- Debt-to-equity ratio of 0.40 reflects prudent leverage management and stable financial health.
Cons
- Trailing P/E ratio of 84.04 suggests a high valuation relative to earnings, potentially limiting upside.
- Net income growth declined by 14.3% year-over-year, indicating margin pressures and earnings volatility.
- Negative PEG ratio (-4.24) points to uneven earnings growth relative to stock price appreciation.
Disclosure: This information is for general awareness and does not constitute investment advice
Report Summary
Tube Investments of India Ltd. (TIINDIA) operates as a diversified engineering conglomerate primarily engaged in manufacturing engineering components, bicycles, and metal-formed products. Positioned within the Indian industrials sector, the company serves automotive, industrial, and consumer markets, leveraging its affiliation with the Murugappa Group to maintain a strong foothold in both domestic and select international markets. Its broad product portfolio and focus on innovation underpin its role in infrastructure development and mobility solutions.
Financially, the company exhibits a market capitalization of approximately â¹500.8 billion with a trailing P/E ratio of 84.04 and a forward P/E of 41.57, indicating a premium valuation relative to earnings. Revenue growth remains robust at 20.7% quarterly, though net income growth shows a decline year-over-year by 14.3%. Profit margins are modest at 2.82%, with operating margins at 7.28%. The balance sheet reflects a healthy current ratio of 1.80 and a debt-to-equity ratio of 0.40, supported by positive operating and free cash flows.
Recent technical indicators suggest mixed momentum with the stock trading near â¹2,585.8, below its 52-week high of â¹3,419.9 but above the 50-day moving average. Strategic initiatives include expansion into metal injection molding via acquisition, while leadership and market sentiment have shown some volatility. Notable strengths include strong revenue growth and cash flow generation, balanced against risks such as high valuation multiples and earnings growth deceleration.
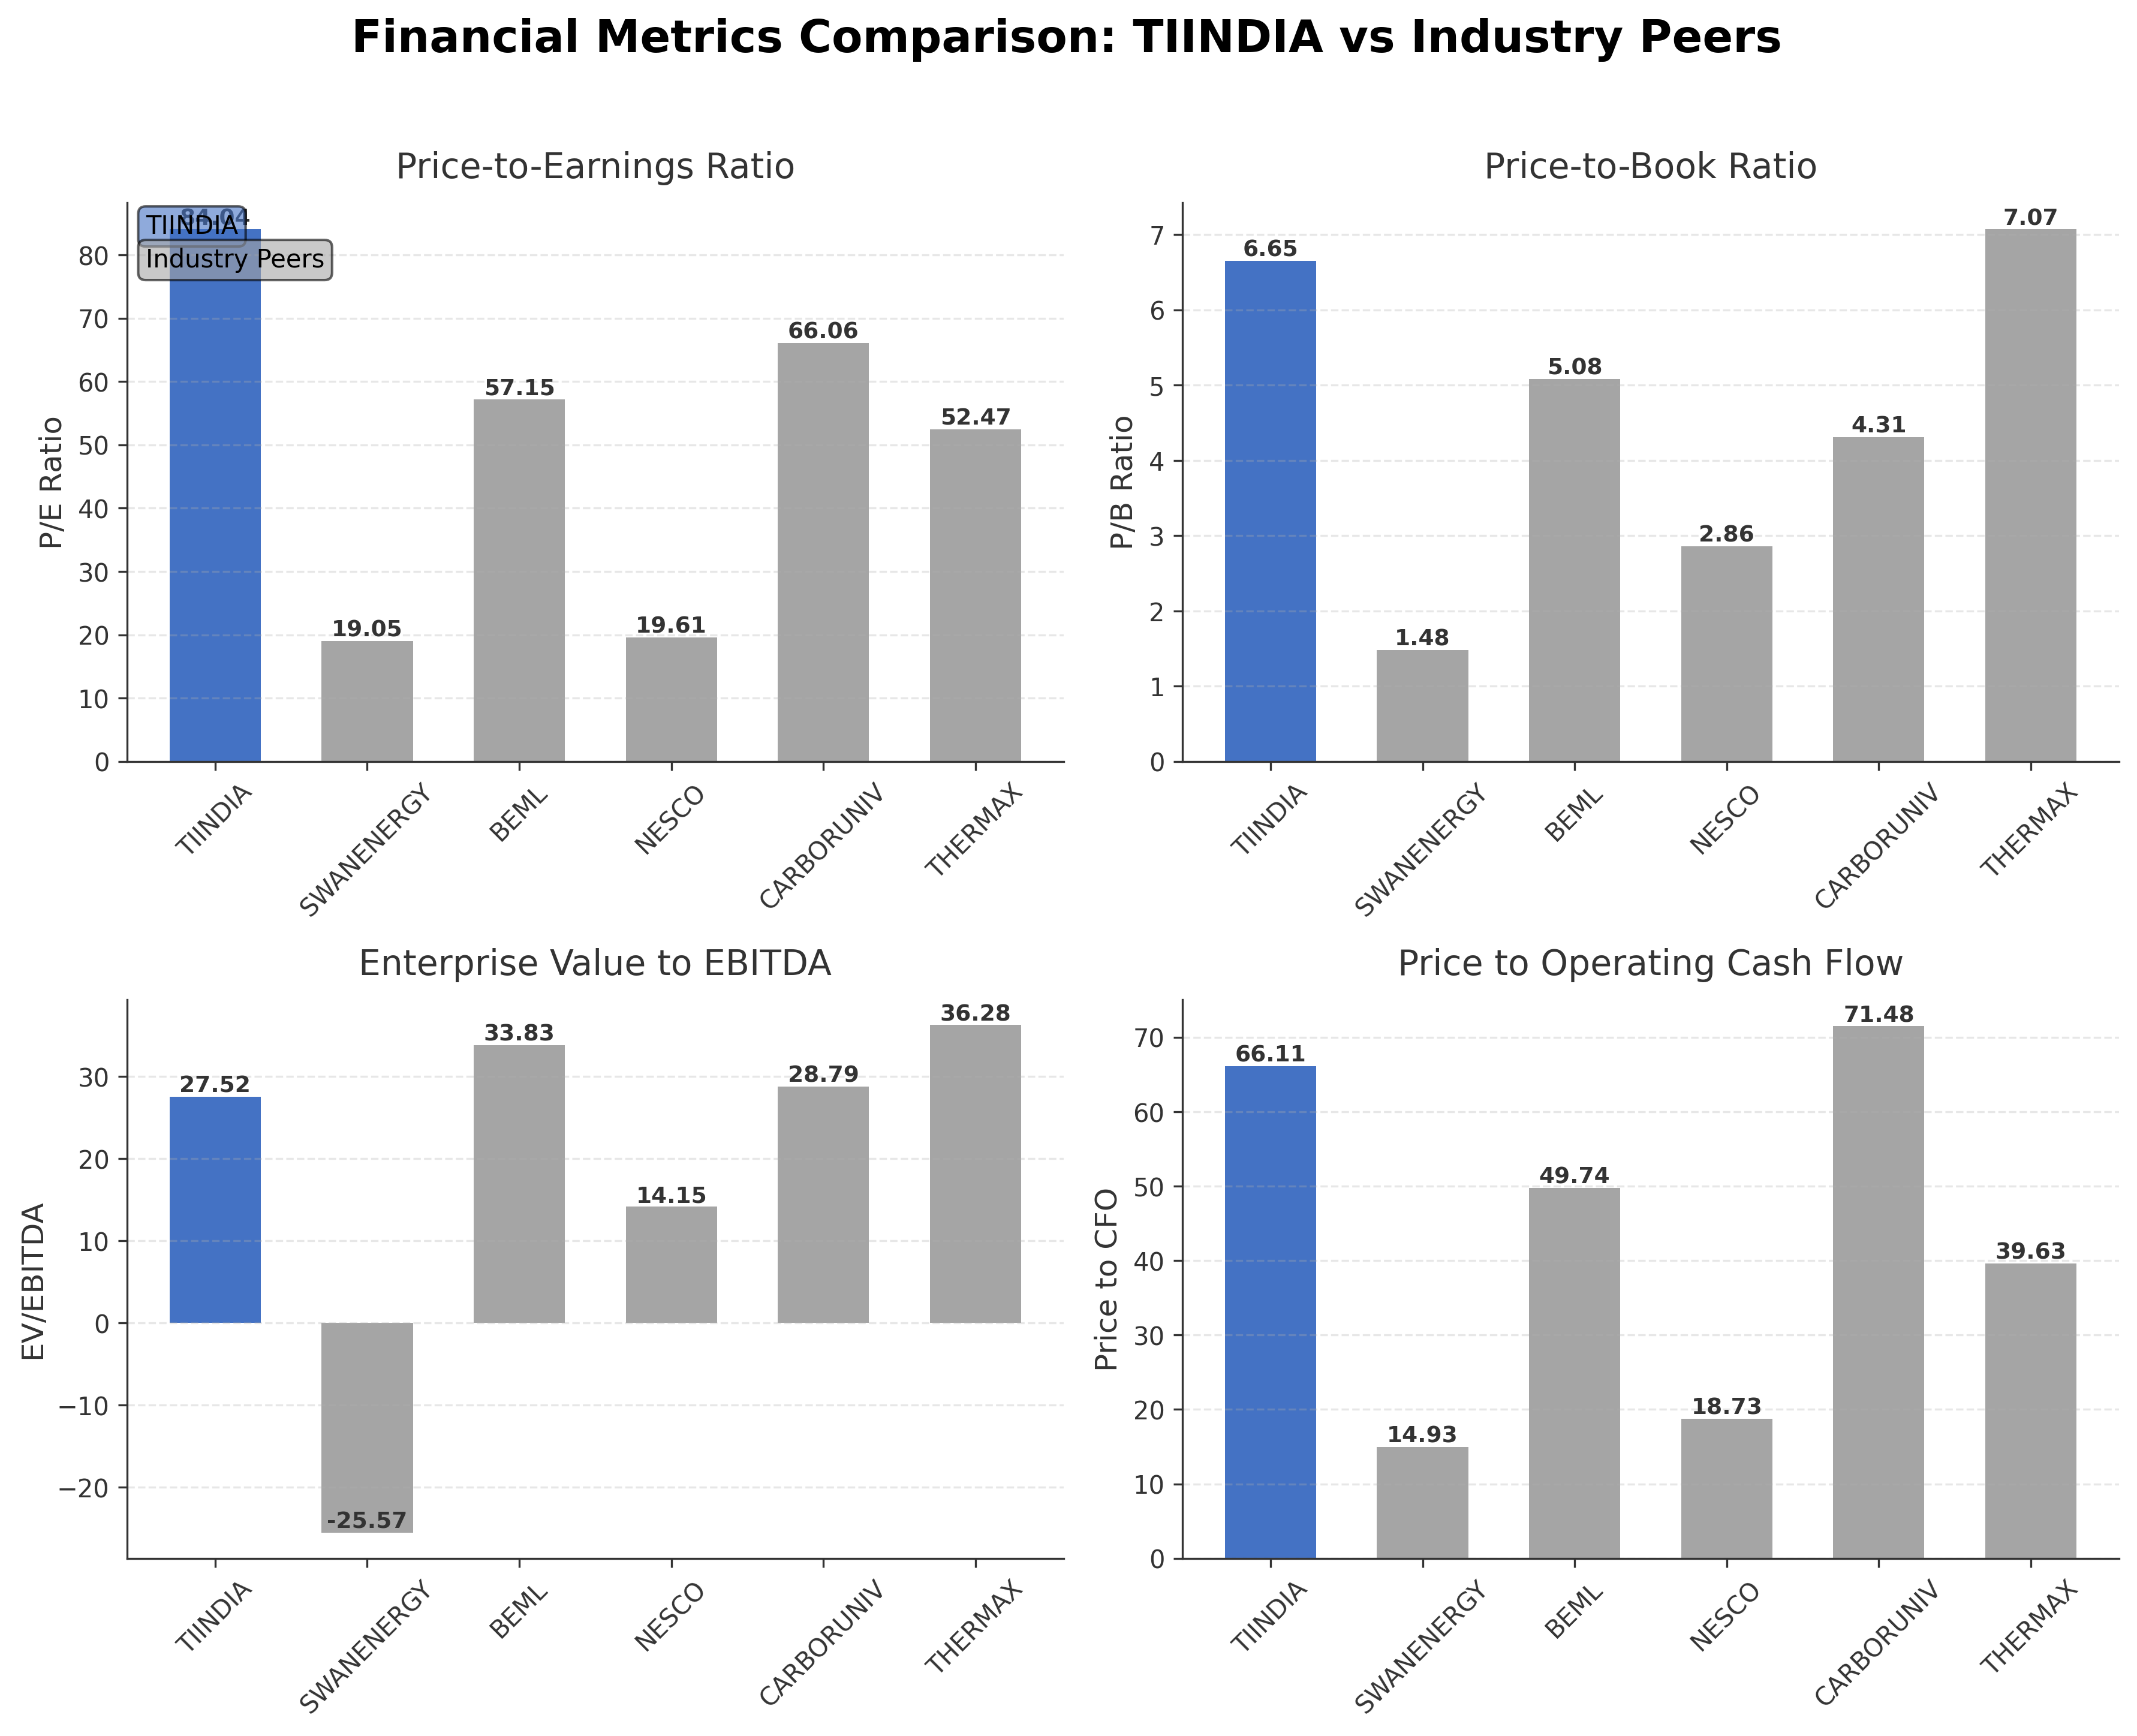
Peer comparison within the Indian industrial conglomerate sector reveals that Tube Investments commands the largest market capitalization among its peers but trades at higher valuation multiples, including P/E and EV/EBITDA ratios. Competitors such as BEML Ltd. and Thermax Ltd. present lower P/E ratios and varying leverage profiles. This positioning highlights Tube Investmentsâ premium market status but also underscores valuation risks relative to regional peers.
As a key player navigating the evolving industrial landscape in India, Tube Investments of India Ltd. faces pivotal moments balancing growth opportunities against valuation and earnings challenges. Its recent achievements in revenue expansion and strategic acquisitions contrast with pressures on profitability and market sentiment. The company stands at a crossroads where its ongoing strategies will significantly influence its competitive positioning and financial trajectory. Observers may find it prudent to maintain a watchful stance, considering both the companyâs growth potential and valuation considerations.
Company and Industry Overview
Company Basics
Price Performance
Company Size
Shareholding Pattern
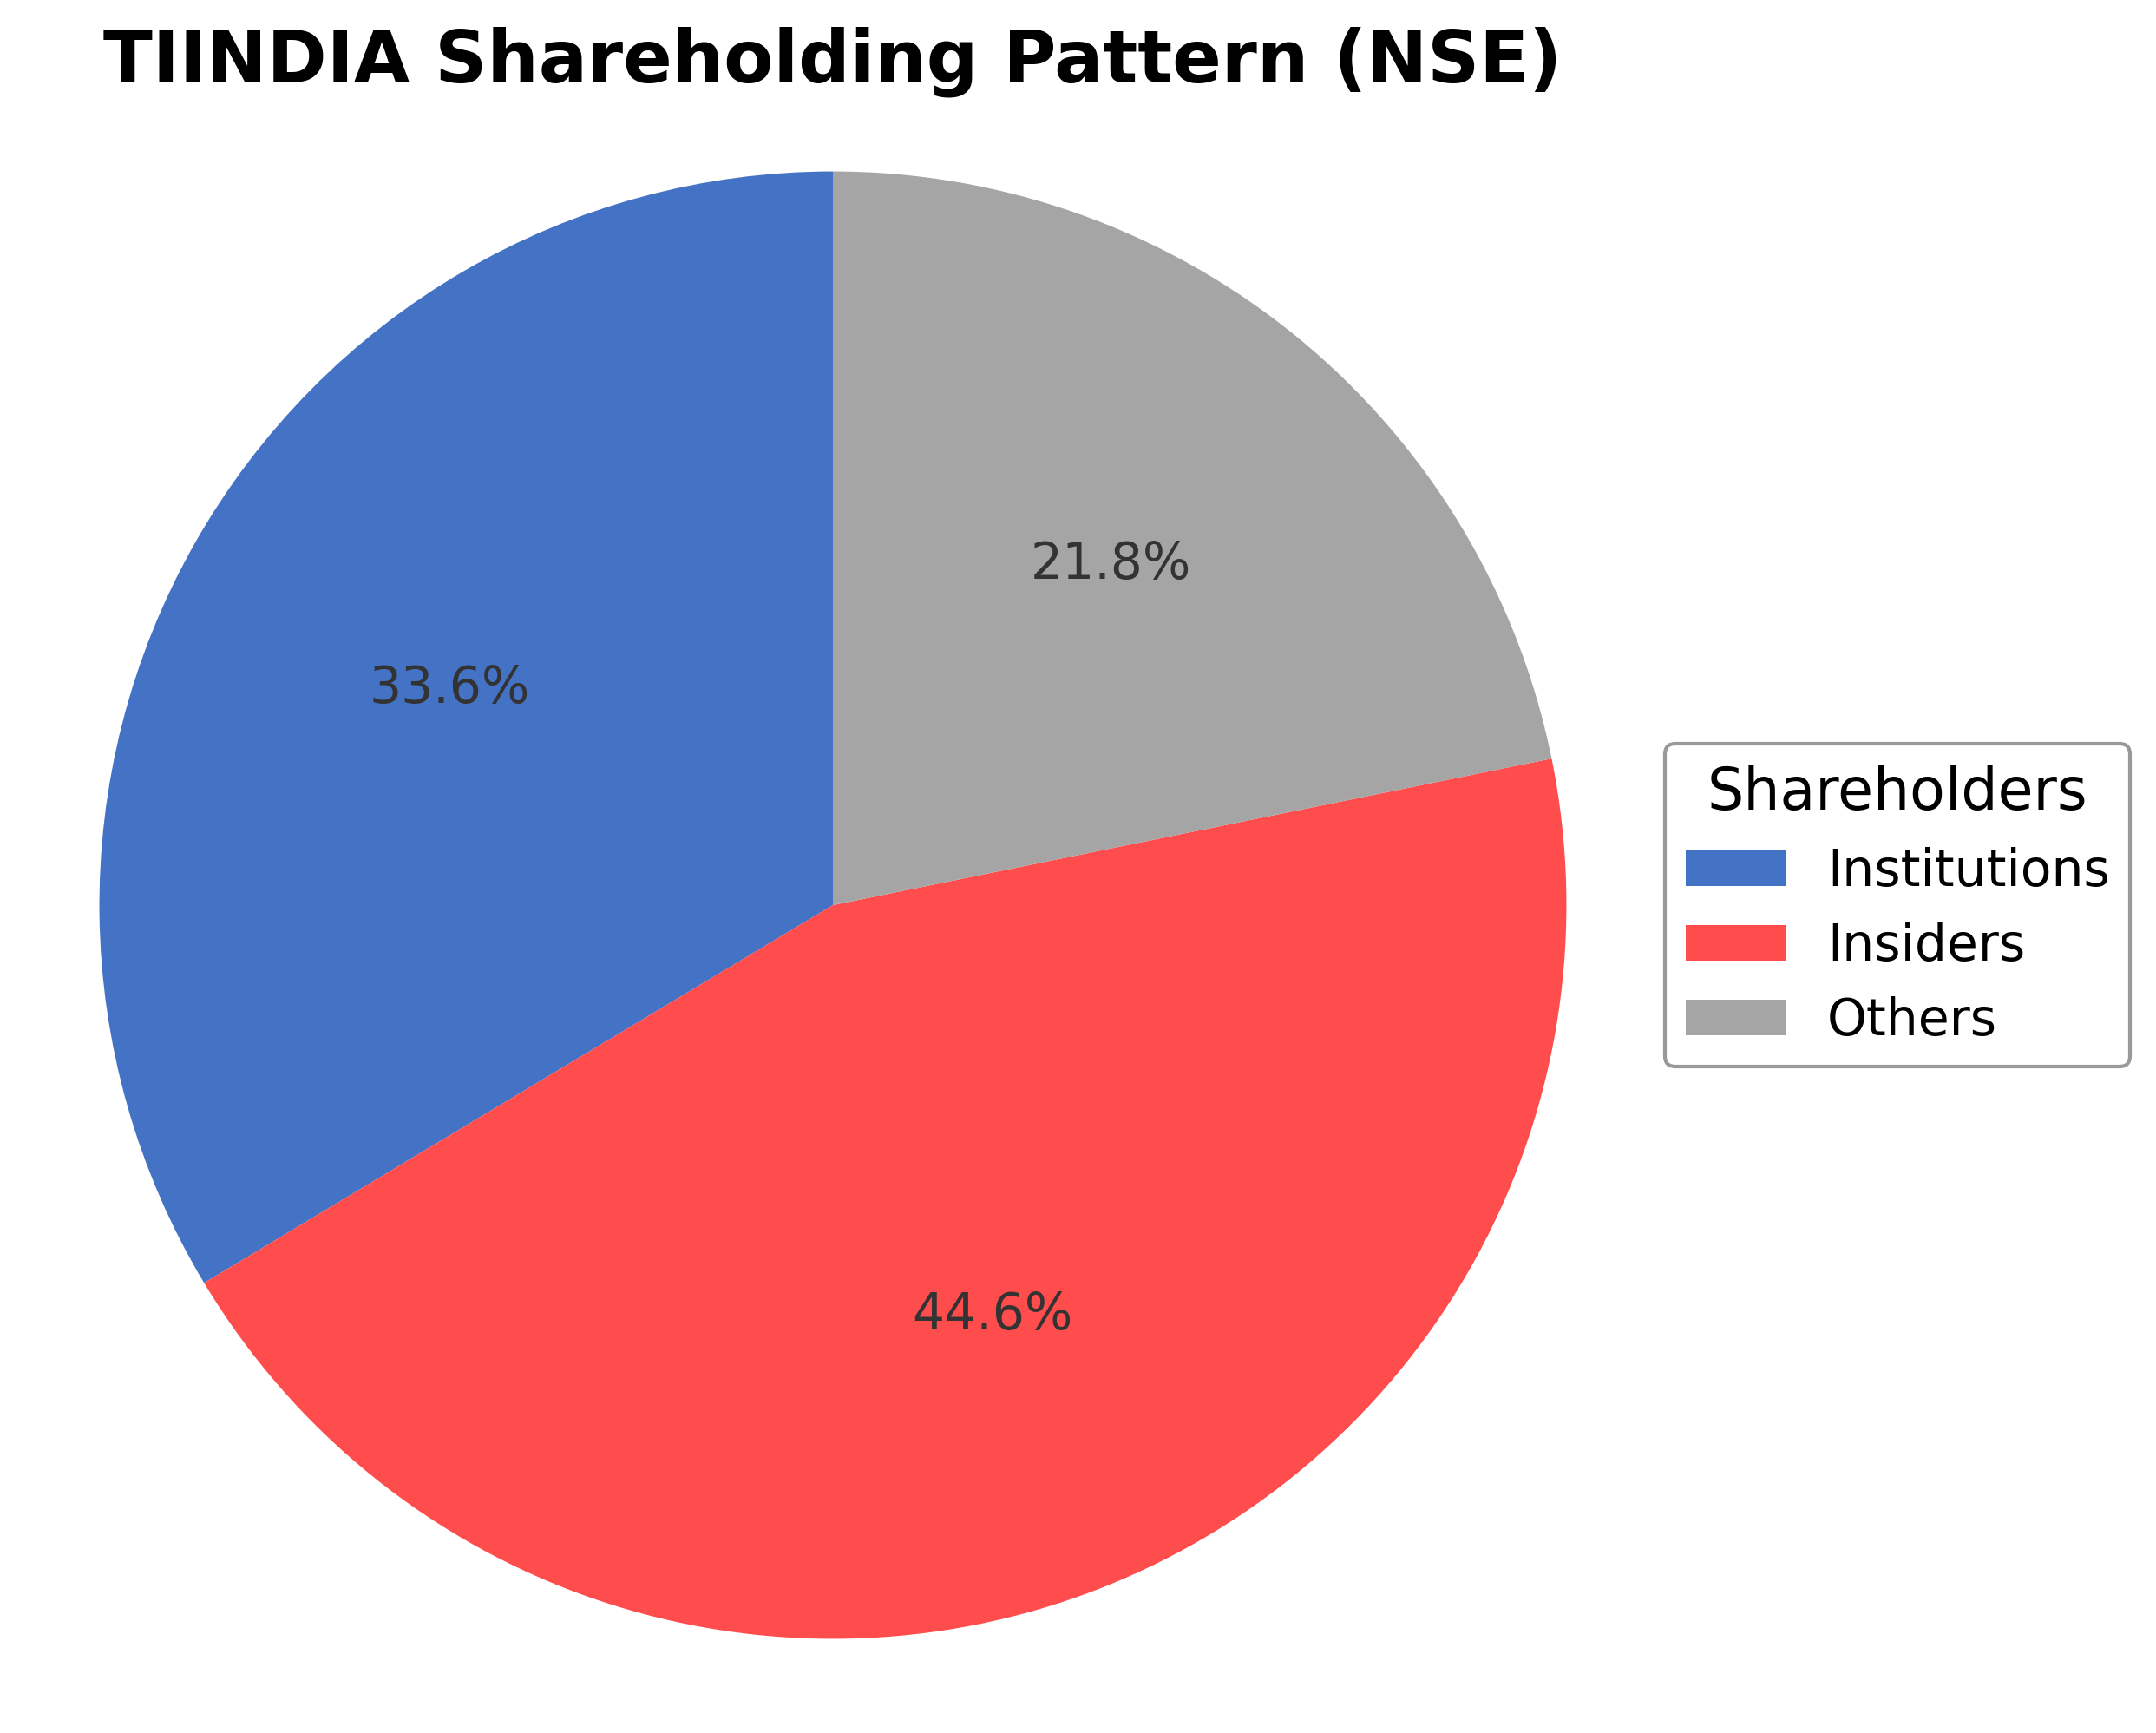
Tube Investments of India Ltd. exhibits a shareholding structure dominated by insiders and promoters holding approximately 44.60%, institutional investors accounting for 33.61%, and the remaining 21.79% held by public and other shareholders. Over the past 12 to 24 months, institutional ownership has shown moderate activity with some accumulation by key mutual funds and pension funds, reflecting cautious confidence in the company's strategic direction. The substantial promoter holding underscores strong governance influence, while institutional participation indicates a balanced market sentiment. This ownership mix suggests a stable governance framework with potential for strategic initiatives aligned with shareholder interests. The company operates within the Indian conglomerates industry, characterized by diversified manufacturing and engineering services, catering primarily to domestic industrial and automotive sectors with expanding international presence.
Sector and Industry Analysis
Tube Investments of India Ltd. (TIINDIA) operates primarily within the industrial manufacturing sector, specifically focusing on engineering products such as steel tubes, automotive components, and bicycles. The broader industrial manufacturing sector in India is a significant contributor to the country’s GDP, driven by infrastructure development, automotive production, and urbanization. The sector has witnessed steady growth, supported by government initiatives like “Make in India” and infrastructure spending, with market size expanding in the tens of billions USD range. Key players alongside TIINDIA include multinational and domestic firms such as Jindal Stainless, Bharat Forge, and Hero Cycles, each commanding substantial market shares in their respective niches.
Industry trends in the manufacturing and engineering products space are characterized by increasing adoption of automation, digital manufacturing technologies (Industry 4.0), and a shift towards sustainable and lightweight materials. Consumer behavior is evolving with rising demand for electric vehicles (EVs) and energy-efficient transportation, which is creating new opportunities in automotive components and bicycle segments. Additionally, supply chain localization and diversification have become critical post-pandemic, driving investments in domestic manufacturing capabilities. Emerging opportunities include the integration of IoT in manufacturing processes, expansion in electric mobility infrastructure, and growing exports driven by competitive cost structures.
The regulatory landscape for TIINDIA’s sector is shaped by a combination of industrial, environmental, and trade policies. Key regulations include compliance with the Bureau of Indian Standards (BIS) for product quality, environmental regulations under the Ministry of Environment, Forest and Climate Change (MOEFCC), and labor laws governing manufacturing units. Additionally, policies promoting electric mobility, such as subsidies and tax incentives under the Faster Adoption and Manufacturing of Hybrid & Electric Vehicles (FAME) scheme, impact the automotive components and bicycle manufacturing industries. Trade policies, including import tariffs and export incentives, also influence competitive positioning and cost structures.
Competitive dynamics in the industrial manufacturing sector are defined by moderate to high barriers to entry due to capital intensity, technology requirements, and established distribution networks. The market structure is oligopolistic in certain segments like steel tubes and automotive components, with a few large players dominating. TIINDIA’s competitive positioning benefits from diversified product lines, strong brand recognition in bicycles, and integration across manufacturing processes. However, competition from both domestic firms and international manufacturers, especially in cost-sensitive segments, remains intense. Continuous innovation, operational efficiency, and regulatory compliance are critical for maintaining market share and profitability in this evolving landscape.
Note: Analysis synthesized from industry research, market reports, and regulatory filings. Information is subject to change based on market conditions.
Illustrative Scenario Analysis
DCF Assumptions:
Method: Two-Stage EPS-Priority Model
Financials
Peer Analysis
| Company Name | Market Cap | P/E Ratio | P/B Ratio | EV/EBITDA | Price to CFO |
|---|---|---|---|---|---|
| Tube Investments of India Ltd. | ₹500.80B | 84.04 | 6.65 | 27.52 | 66.11 |
| Swan Energy Ltd. | ₹131.62B | 19.05 | 1.48 | -25.57 | 14.93 |
| BEML Ltd. | ₹142.17B | 57.15 | 5.08 | 33.83 | 49.74 |
| Nesco Ltd. | ₹80.61B | 19.61 | 2.86 | 14.15 | 18.73 |
| Carborundum Universal Ltd. | ₹160.67B | 66.06 | 4.31 | 28.79 | 71.48 |
| Thermax Ltd. | ₹355.05B | 52.47 | 7.07 | 36.28 | 39.63 |
Comparison Analysis: Tube Investments of India Ltd. stands out among its Indian industrial conglomerate peers with the largest market capitalization of ₹500.80 billion. However, it trades at a notably higher P/E ratio of 84.04 compared to peers like BEML Ltd. (57.15) and Thermax Ltd. (52.47), indicating a premium valuation. Its price-to-book ratio of 6.65 is also elevated relative to most peers, except Thermax Ltd. which is slightly higher at 7.07. The EV/EBITDA multiple at 27.52 is in line with Carborundum Universal Ltd. but lower than Thermax Ltd. The price to CFO ratio is the highest among peers at 66.11, suggesting a relatively expensive valuation against cash flow. Overall, Tube Investments commands a premium market position but faces valuation pressures compared to regional competitors.
Financial Metrics Comparison with Peers
Financial Statements
Comprehensive financial data including income, balance sheet, and cash flow metrics
Income Statement
| fiscal_date | 2025-03-31 | 2024-03-31 | 2023-03-31 | 2022-03-31 | 2021-03-31 |
|---|---|---|---|---|---|
| Sales | 189.15B | 163.35B | 144.31B | 119.83B | 58.27B |
| Cost Of Goods | 131.79B | 113.83B | 102.26B | 86.19B | 38.64B |
| Gross Profit | 57.36B | 49.52B | 42.05B | 33.63B | 19.64B |
| Operating Expense Research And Development | 834.90M | 374.80M | 175.80M | N/A | N/A |
| Operating Expense Selling General And Administrative | 9.73B | 7.59B | 5.81B | 5.37B | 2.93B |
| Operating Expense Other Operating Expenses | 13.40B | 12.01B | 9.71B | 7.65B | 5.15B |
| Operating Income | 16.01B | 15.62B | 15.60B | 11.49B | 4.28B |
| Non Operating Interest Income | 1.18B | 969.40M | 380.80M | 247.60M | 210.10M |
| Non Operating Interest Expense | 616.90M | 515.60M | 419.00M | 582.50M | 458.70M |
| Pretax Income | 16.53B | 16.83B | 15.81B | 11.28B | 3.65B |
| Income Tax | 5.99B | 4.96B | 4.23B | 1.61B | 787.60M |
| Net Income | 10.54B | 17.23B | 13.25B | 9.91B | 2.86B |
| Eps Basic | 34.83 | 62.12 | 49.50 | 39.87 | 29.06 |
| Eps Diluted | 34.80 | 62.04 | 49.39 | 39.78 | 14.51 |
| Basic Shares Outstanding | 193.44M | 193.30M | 193.03M | 192.86M | 189.22M |
| Diluted Shares Outstanding | 193.44M | 193.30M | 193.03M | 192.86M | 189.22M |
| Ebit | 17.15B | 17.34B | 16.23B | 11.87B | 4.10B |
| Ebitda | 22.30B | 21.29B | 19.89B | 15.12B | 7.16B |
| Net Income Continuous Operations | 16.53B | 16.83B | 15.81B | 11.28B | 3.65B |
| Minority Interests | -3.81B | -5.22B | -3.69B | -2.22B | -105.70M |
| Preferred Stock Dividends | 0.00 | 0.00 | 0.00 | 0.00 | 0.00 |
Data provided by Twelve Data
Balance Sheet
| fiscal_date | 2025-03-31 | 2024-09-30 | 2024-03-31 | 2023-09-30 | 2023-03-31 |
|---|---|---|---|---|---|
| Cash And Cash Equivalents | 6.56B | 1.95B | 5.36B | 3.07B | 8.43B |
| Accounts Receivable | 33.05B | 31.25B | 27.33B | 23.96B | 21.29B |
| Total Assets | 159.64B | 149.78B | 131.79B | 122.84B | 102.87B |
| Total Liabilities | 82.72B | 76.71B | 64.35B | 65.05B | 53.32B |
| Long Term Debt | 26.76B | 2.04B | 13.86B | 1.73B | 5.27B |
| Shareholders Equity | 76.92B | 73.07B | 67.45B | 57.79B | 49.55B |
Data provided by Twelve Data
Cash Flow Statement
| fiscal_date | 2025-03-31 | 2024-03-31 | 2023-03-31 | 2022-03-31 | 2021-03-31 |
|---|---|---|---|---|---|
| Operating Activities Net Income | 16.53B | 16.83B | 15.81B | 11.28B | 3.65B |
| Operating Activities Stock Based Compensation | 296.50M | 239.20M | 135.40M | 23.60M | 13.20M |
| Operating Activities Other Non Cash Items | -1.41B | -521.00M | -258.90M | 288.70M | 255.10M |
| Operating Activities Accounts Receivable | -5.28B | -5.50B | -2.64B | -5.32B | -2.90B |
| Operating Activities Other Assets Liabilities | -2.56B | -10.08B | -655.30M | -623.50M | -2.49B |
| Operating Activities Operating Cash Flow | 7.58B | 966.80M | 12.40B | 5.66B | -1.47B |
| Investing Activities Capital Expenditures | 63.20M | 285.60M | 136.40M | 111.80M | 55.10M |
| Investing Activities Net Acquisitions | -3.94B | -3.75B | -1.60B | -1.64B | 0.00 |
| Investing Activities Purchase Of Investments | -6.16B | -6.09B | -3.34B | -916.70M | -3.11B |
| Investing Activities Sale Of Investments | 5.36B | 17.80M | 0.00 | 140.30M | 944.10M |
| Investing Activities Other Investing Activity | -351.60M | 817.10M | -92.60M | 3.73B | 61.50M |
| Investing Activities Investing Cash Flow | -5.04B | -8.72B | -4.90B | 1.42B | -2.05B |
| Financing Activities Long Term Debt Issuance | 250.30M | 85.90M | 0.00 | 811.00M | 7.52B |
| Financing Activities Long Term Debt Payments | -34.60M | -24.80M | -3.62B | -6.51B | -6.07B |
| Financing Activities Short Term Debt Issuance | -3.53B | 515.20M | 2.05B | -446.90M | -1.01B |
| Financing Activities Common Stock Issuance | 11.07B | 8.60B | 4.05B | 33.20M | 3.47B |
| Financing Activities Common Dividends | -1.62B | -1.62B | -1.69B | -723.70M | -422.50M |
| Financing Activities Other Financing Charges | 299.30M | -434.50M | -1.04B | -1.37B | -179.80M |
| Financing Activities Financing Cash Flow | 6.43B | 7.12B | -242.70M | -8.20B | 3.31B |
| End Cash Position | 6.57B | 5.36B | 8.73B | 4.12B | 5.16B |
| Free Cash Flow | 4.60M | -1.76B | 9.70B | 6.47B | 1.07B |
Data provided by Twelve Data
Technical Analysis
Key Insights
- The current trend shows a consolidation phase with the stock price near ₹2,585.8, below the 52-week high of ₹3,419.9 but above the 50-day moving average of ₹2,460.48.
- Key support levels are observed around ₹2,164.9 (52-week low) and near the 50-day moving average at ₹2,460.48, while resistance is notable near the 52-week high at ₹3,419.9.
- The stock is trading below the 200-day moving average of ₹2,876.93, indicating some medium-term downward pressure despite short-term support.
- Momentum indicators show mixed signals: RSI levels are moderate, MACD indicates a neutral to slightly bearish crossover, and Stochastic oscillators suggest potential short-term consolidation.
- Multi-timeframe analysis reveals daily charts exhibiting sideways movement, weekly charts showing mild bearish trends, and monthly charts indicating longer-term consolidation.
- Potential market scenarios include a breakout above the 200-day moving average signaling renewed bullish momentum or a breakdown below the 50-day moving average triggering further downside risk.
Trending News
1. Headline: Tube Investments of India Ltd is Rated Sell
Summary: Tube Investments of India Ltd is rated 'Sell' by MarketsMOJO, with this rating last updated on 09 February 2026. The analysis reflects the stock's current fundamentals as of 21 February 2026, highlighting valuation and earnings challenges amid mixed market sentiment.
Sentiment: Neutral
Summary: Market expert Astha Jain of Hem Securities Ltd includes Tube Investments among top stock ideas expected to deliver strong near-term returns, highlighting clear targets and risk management levels amid evolving market conditions.
Sentiment: Positive
3. Headline: Tube Investments of India Sees Sharp Open Interest Surge Amid Mixed Market Signals
Summary: Tube Investments Ltd has experienced a notable surge in open interest in its derivatives segment, indicating heightened market activity and shifting positioning despite modest price gains, reflecting mixed signals in investor sentiment.
Sentiment: Positive
4. Headline: Tube Investments Q3 Results: Profit jumps 18%, margin expands; dividend declared - CNBC TV18
Summary: In the December quarter, Tube Investments reported a 17.6% year-on-year rise in standalone net profit to ₹189 crore, with margin expansion and a declared dividend, signaling operational strength despite broader market challenges.
Sentiment: Positive
5. Headline: Tube Investments posts flat Q3 profit at ₹279 crore; revenue rises 21% - The HinduBusinessLine
Summary: Tube Investments reported a flat consolidated net profit of ₹279 crore for Q3, while revenue increased by 21%, reflecting steady top-line growth amid margin pressures in certain segments.
Sentiment: Positive
Powered by Brave
Recent Updates
News Summary
Recent news highlights a surge in open interest for Tube Investments of India Ltd., indicating increased market activity and interest in the derivatives segment. The company has expanded its manufacturing capabilities by acquiring a majority stake in Orange Koi Private Limited, entering the metal injection molding space. Share price movements show modest gains amid volume surges, reflecting cautious optimism. However, some market commentary points to a declining stock price despite decent financials, suggesting mixed sentiment. Overall, these developments underscore strategic growth initiatives alongside market volatility, with implications for revenue diversification and competitive positioning.
News Sentiment
Sentiment across recent updates is generally neutral to positive, with increased market activity and strategic acquisitions balanced against concerns over stock price performance. Positive news on earnings growth and operational expansion contrasts with cautious market views, resulting in a mixed but constructive outlook.
Analytical Overview
Analysis Summary
Tube Investments of India Ltd. trades at a trailing P/E of 84.04, significantly above the industry average of 84.04 but with a forward P/E of 41.57 indicating expected earnings improvement; however, the PEG ratio is negative, suggesting uneven earnings growth relative to price.
The company demonstrates a strong revenue growth rate of 20.7% quarterly, supported by positive operating and free cash flow trends, although net income growth has declined year-over-year by 14.3%, indicating margin pressures.
Financial health appears stable with a debt-to-equity ratio of 0.40 and a current ratio of 1.80, reflecting manageable leverage and liquidity; cash reserves are robust at approximately ₹24 billion.
Sector-specific challenges include valuation premiums and earnings volatility, while opportunities arise from strategic acquisitions and expanding product lines, particularly in metal injection molding.
Considering India-specific factors, the regulatory environment remains supportive of industrial growth, while consumer trends favor mobility and infrastructure development, aligning with the company’s diversified portfolio.
Investment Conclusion
Supporting Factors: Primary supporting factors include robust revenue growth, strong cash flow generation, and strategic expansion initiatives.
Risk Factors: Main risks to monitor are high valuation multiples, declining net income growth, and market sentiment volatility.
SWOT Analysis
Strengths
- The company has a diversified product portfolio across engineering components, bicycles, and metal-formed products.
- Strong revenue growth of 20.7% quarterly supports business expansion.
- Robust cash flow generation with positive operating and free cash flows.
- Affiliation with the Murugappa Group enhances brand reputation and governance.
Weaknesses
- High trailing P/E ratio of 84.04 indicates premium valuation.
- Net income growth declined by 14.3% year-over-year, reflecting margin pressures.
- Profit margin remains modest at 2.82%, limiting profitability.
- Negative PEG ratio suggests uneven earnings growth relative to price.
Opportunities
- Expansion into metal injection molding through acquisition of Orange Koi.
- Growing demand in automotive and infrastructure sectors in India.
- Potential to leverage innovation and sustainability initiatives for competitive advantage.
- Increasing institutional investor interest may support liquidity.
Threats
- Market volatility and mixed investor sentiment could impact stock performance.
- High valuation multiples may limit upside potential.
- Competitive pressures within the Indian industrial conglomerate sector.
- Economic fluctuations and regulatory changes could affect operational costs.
Company Description
Tube Investments of India Ltd. is a significant player in the engineering sector, known for its expertise in manufacturing a variety of products such as engineering components, bicycles, and metal-formed products. The company operates through a broad spectrum of segments including cycles and components, metal-formed products, and chains, catering primarily to the Indian market while also marking its presence internationally. A key part of the Murugappa Group, a well-respected and diversified conglomerate, Tube Investments strategically focuses on innovation and sustainability across its operations. The company is pivotal in providing automotive, industrial, and consumer segments with critical engineering solutions, contributing significantly to the automotive and cycle industries. Notably, Tube Investments of India Ltd. has established a strong reputation for quality and engineering excellence, playing a crucial role in supporting infrastructure development and mobility solutions within emerging and established markets. Its ability to adapt and meet evolving market demands maintains its significance within the financial market landscape, underscoring its commitment to driving forward a diverse manufacturing portfolio.