


Trent Ltd (TRENT)
Stock Analysis Report
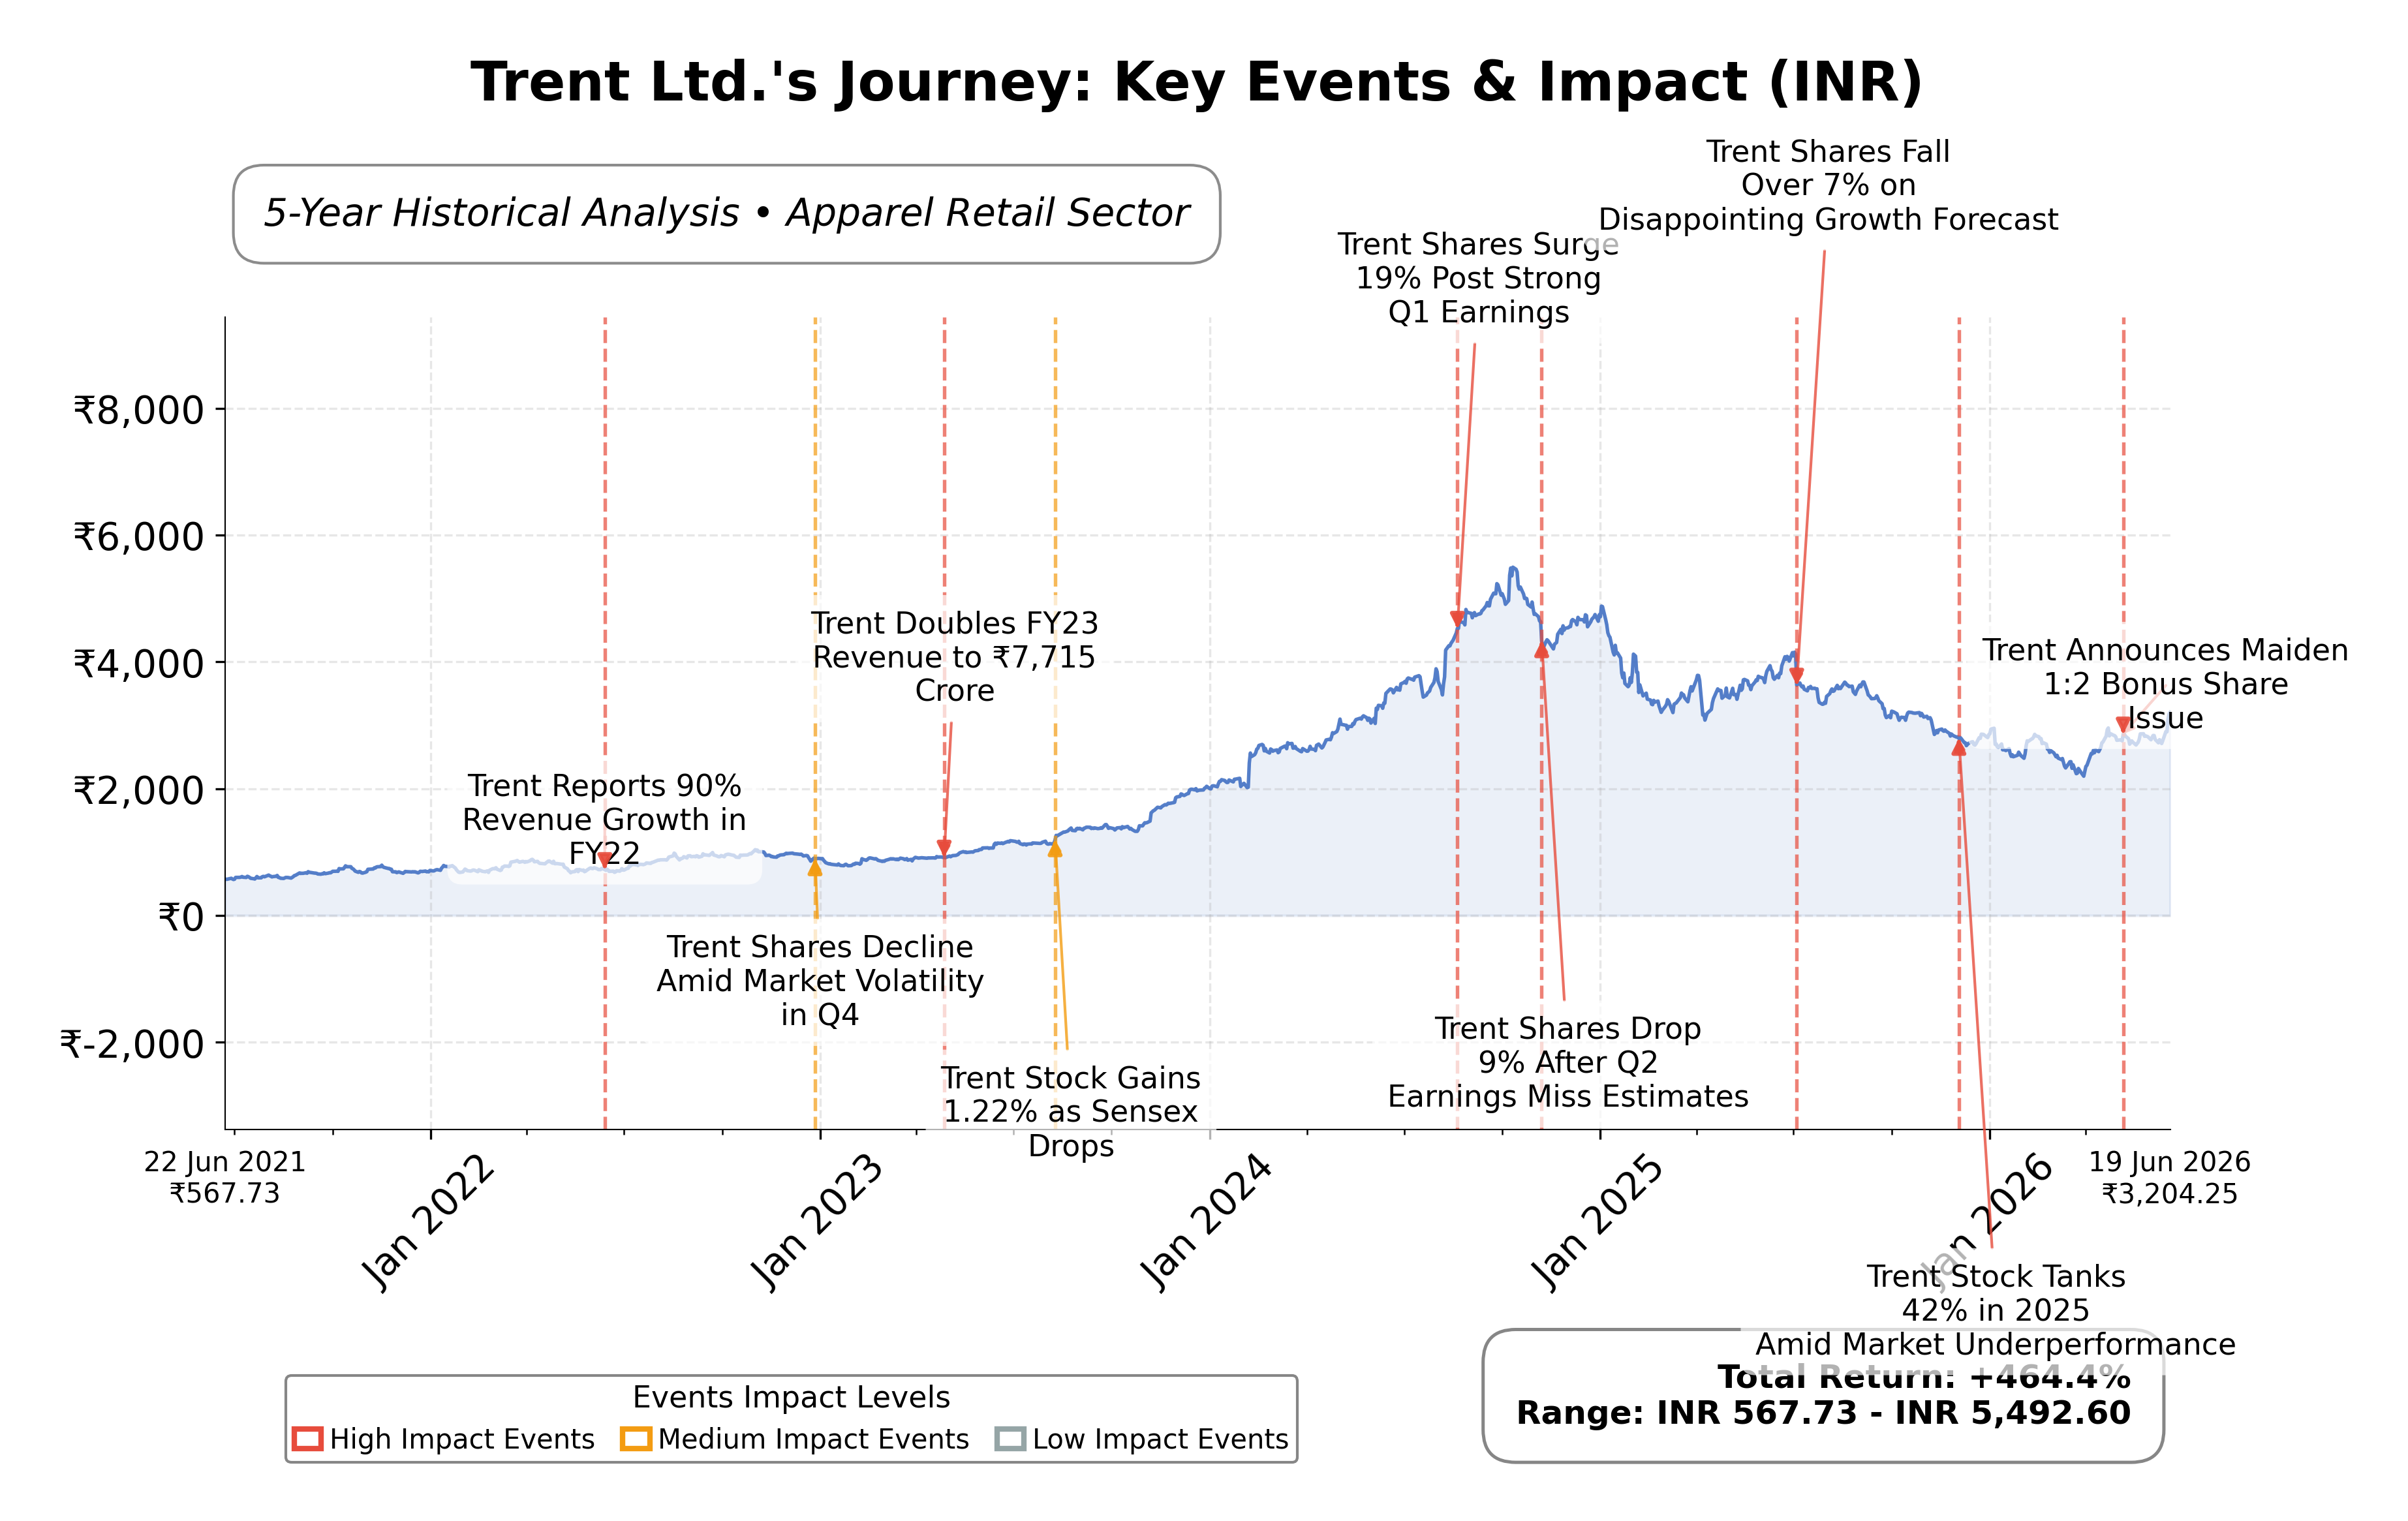
Stock Journey
Key Positives and Key Risks
Pros
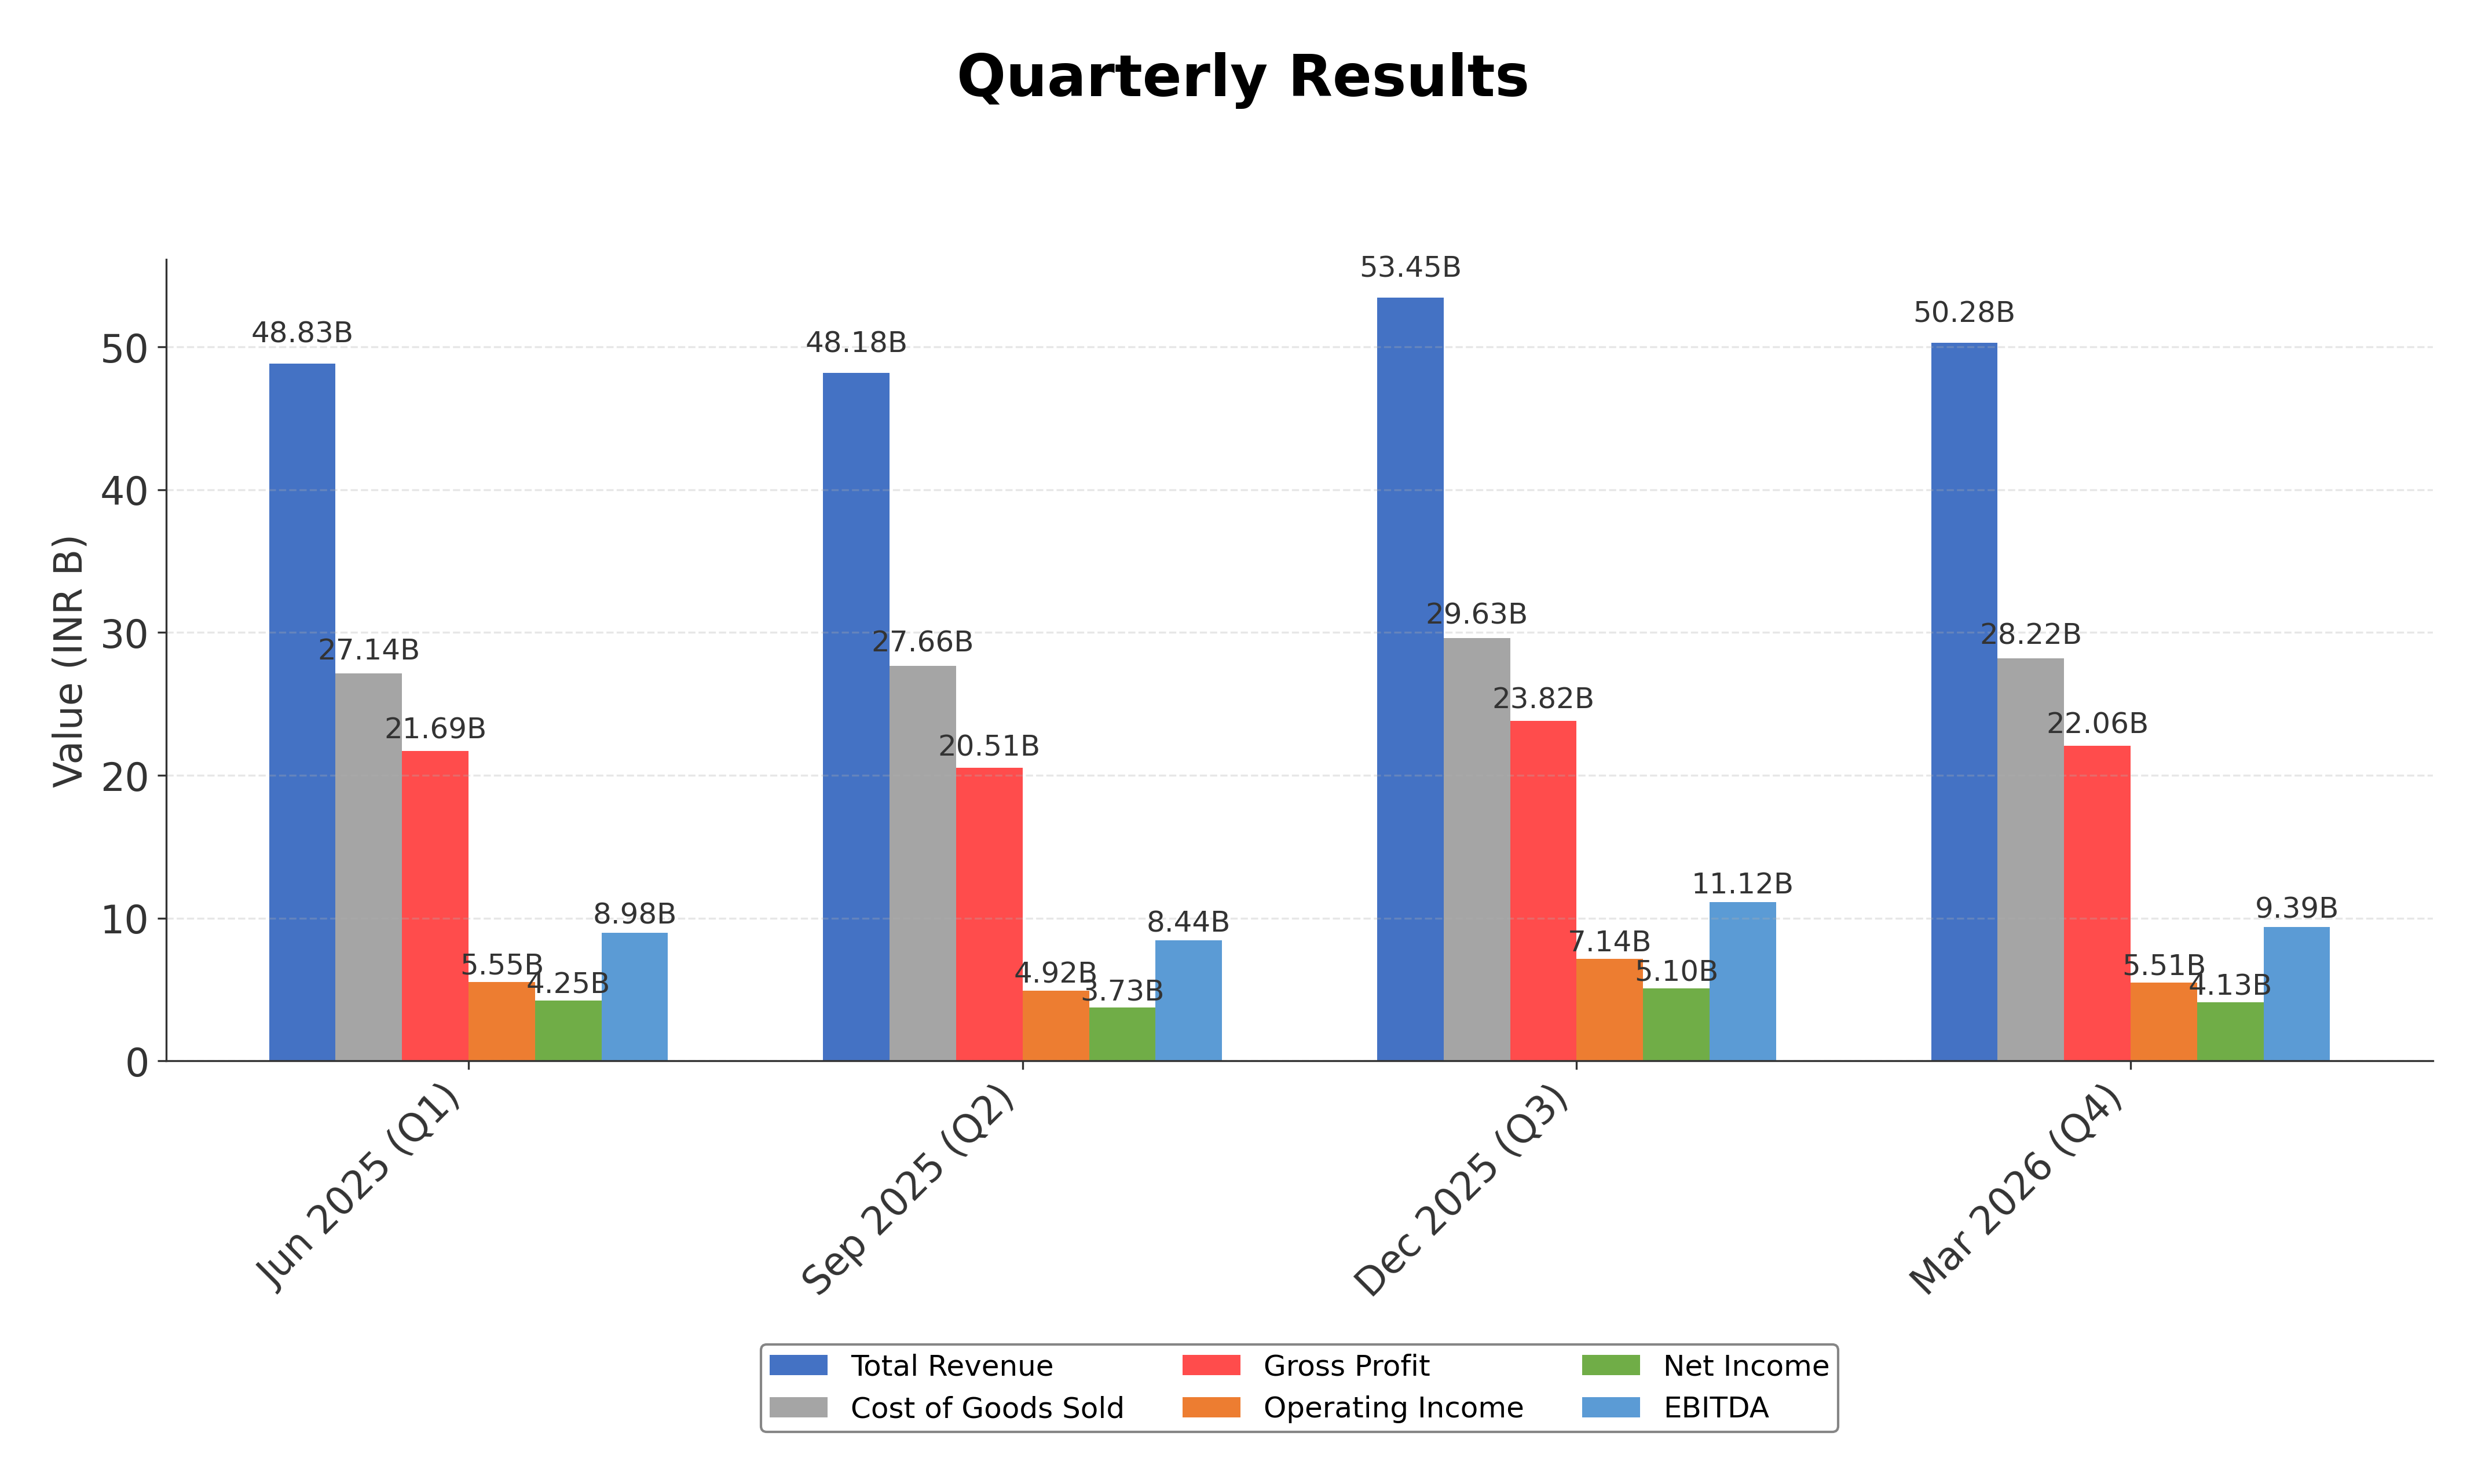
- Strong revenue growth of 15.9% quarter-over-quarter demonstrating operational momentum.
- Healthy return on equity of 29.38% indicating efficient use of shareholder capital.
- Robust operating cash flow of ₹24.39 billion supporting financial stability.
Cons
- High trailing P/E ratio of 69.22 and EV/EBITDA of 57.98 reflecting premium valuation.
- Moderate debt-to-equity ratio of 37.79% which may constrain financial flexibility.
- Significant downside risk of 31.3% from 52-week high indicating stock price volatility.
Disclosure: This information is for general awareness and does not constitute investment advice
Report Summary
Trent Ltd. is a prominent player in the Indian retail industry, operating primarily on the Bombay Stock Exchange (BSE) under the consumer cyclical sector. The company manages a diverse portfolio of retail stores, including lifestyle brands like Westside and Landmark, serving urban and suburban customers with apparel, accessories, home goods, and specialty items such as books and toys. Trent also leverages strategic partnerships, notably with Tata and Tesco, to strengthen its presence in the hypermarket and supermarket segments, positioning itself as a significant contributor to organized retail growth in India.
Financially, Trent Ltd. reported a trailing twelve months (TTM) revenue of approximately ₹185.75 billion with a gross margin of 43.88%, operating margin of 10.22%, and a net profit margin of 8.73%. The company demonstrated strong profitability and operational efficiency, reflected in a return on equity (ROE) of 29.38% and return on assets (ROA) of 13.35%. Its return on invested capital (ROIC) is supported by robust cash flows, with operating cash flow totaling ₹24.39 billion and free cash flow of ₹5.94 billion over the same period.
Valuation metrics indicate a premium pricing relative to fundamentals, with a trailing price-to-earnings (P/E) ratio of 69.22 and a forward P/E of 50.87, both aligned with the industry average P/E of 69.22. The price-to-book (P/B) ratio stands at 18.61, and the enterprise value to EBITDA (EV/EBITDA) ratio is notably high at 57.98, suggesting elevated market expectations. The stock trades at ₹3,179.25, within a 52-week range of ₹4,172.67 (high) to ₹2,184.07 (low), currently closer to the mid-range but with a downside risk of approximately 31.3% from the 52-week high.
Trent’s strengths include strong cash flow generation, a manageable debt-to-equity ratio of 37.79%, and market leadership in lifestyle retailing. Key risks involve competitive pressures in the Indian retail sector, regulatory challenges, and the impact of macroeconomic factors on consumer spending. Recent strategic moves such as the 1:2 bonus share issue and expansion of store formats, particularly the Zudio brand, reflect proactive management actions to enhance shareholder value and market penetration.
Technically, the stock has shown positive momentum with recent price rallies supported by strong demand trends, despite some bearish analyst ratings. The stock is trading near its 50-day moving average but below the 200-day average, indicating mixed trend signals. Overall, the data suggests a cautious stance with attention to valuation and market dynamics, suitable for monitoring accumulation or partial realization depending on evolving conditions.
Company and Industry Overview
Company Basics
Price Performance
Company Size
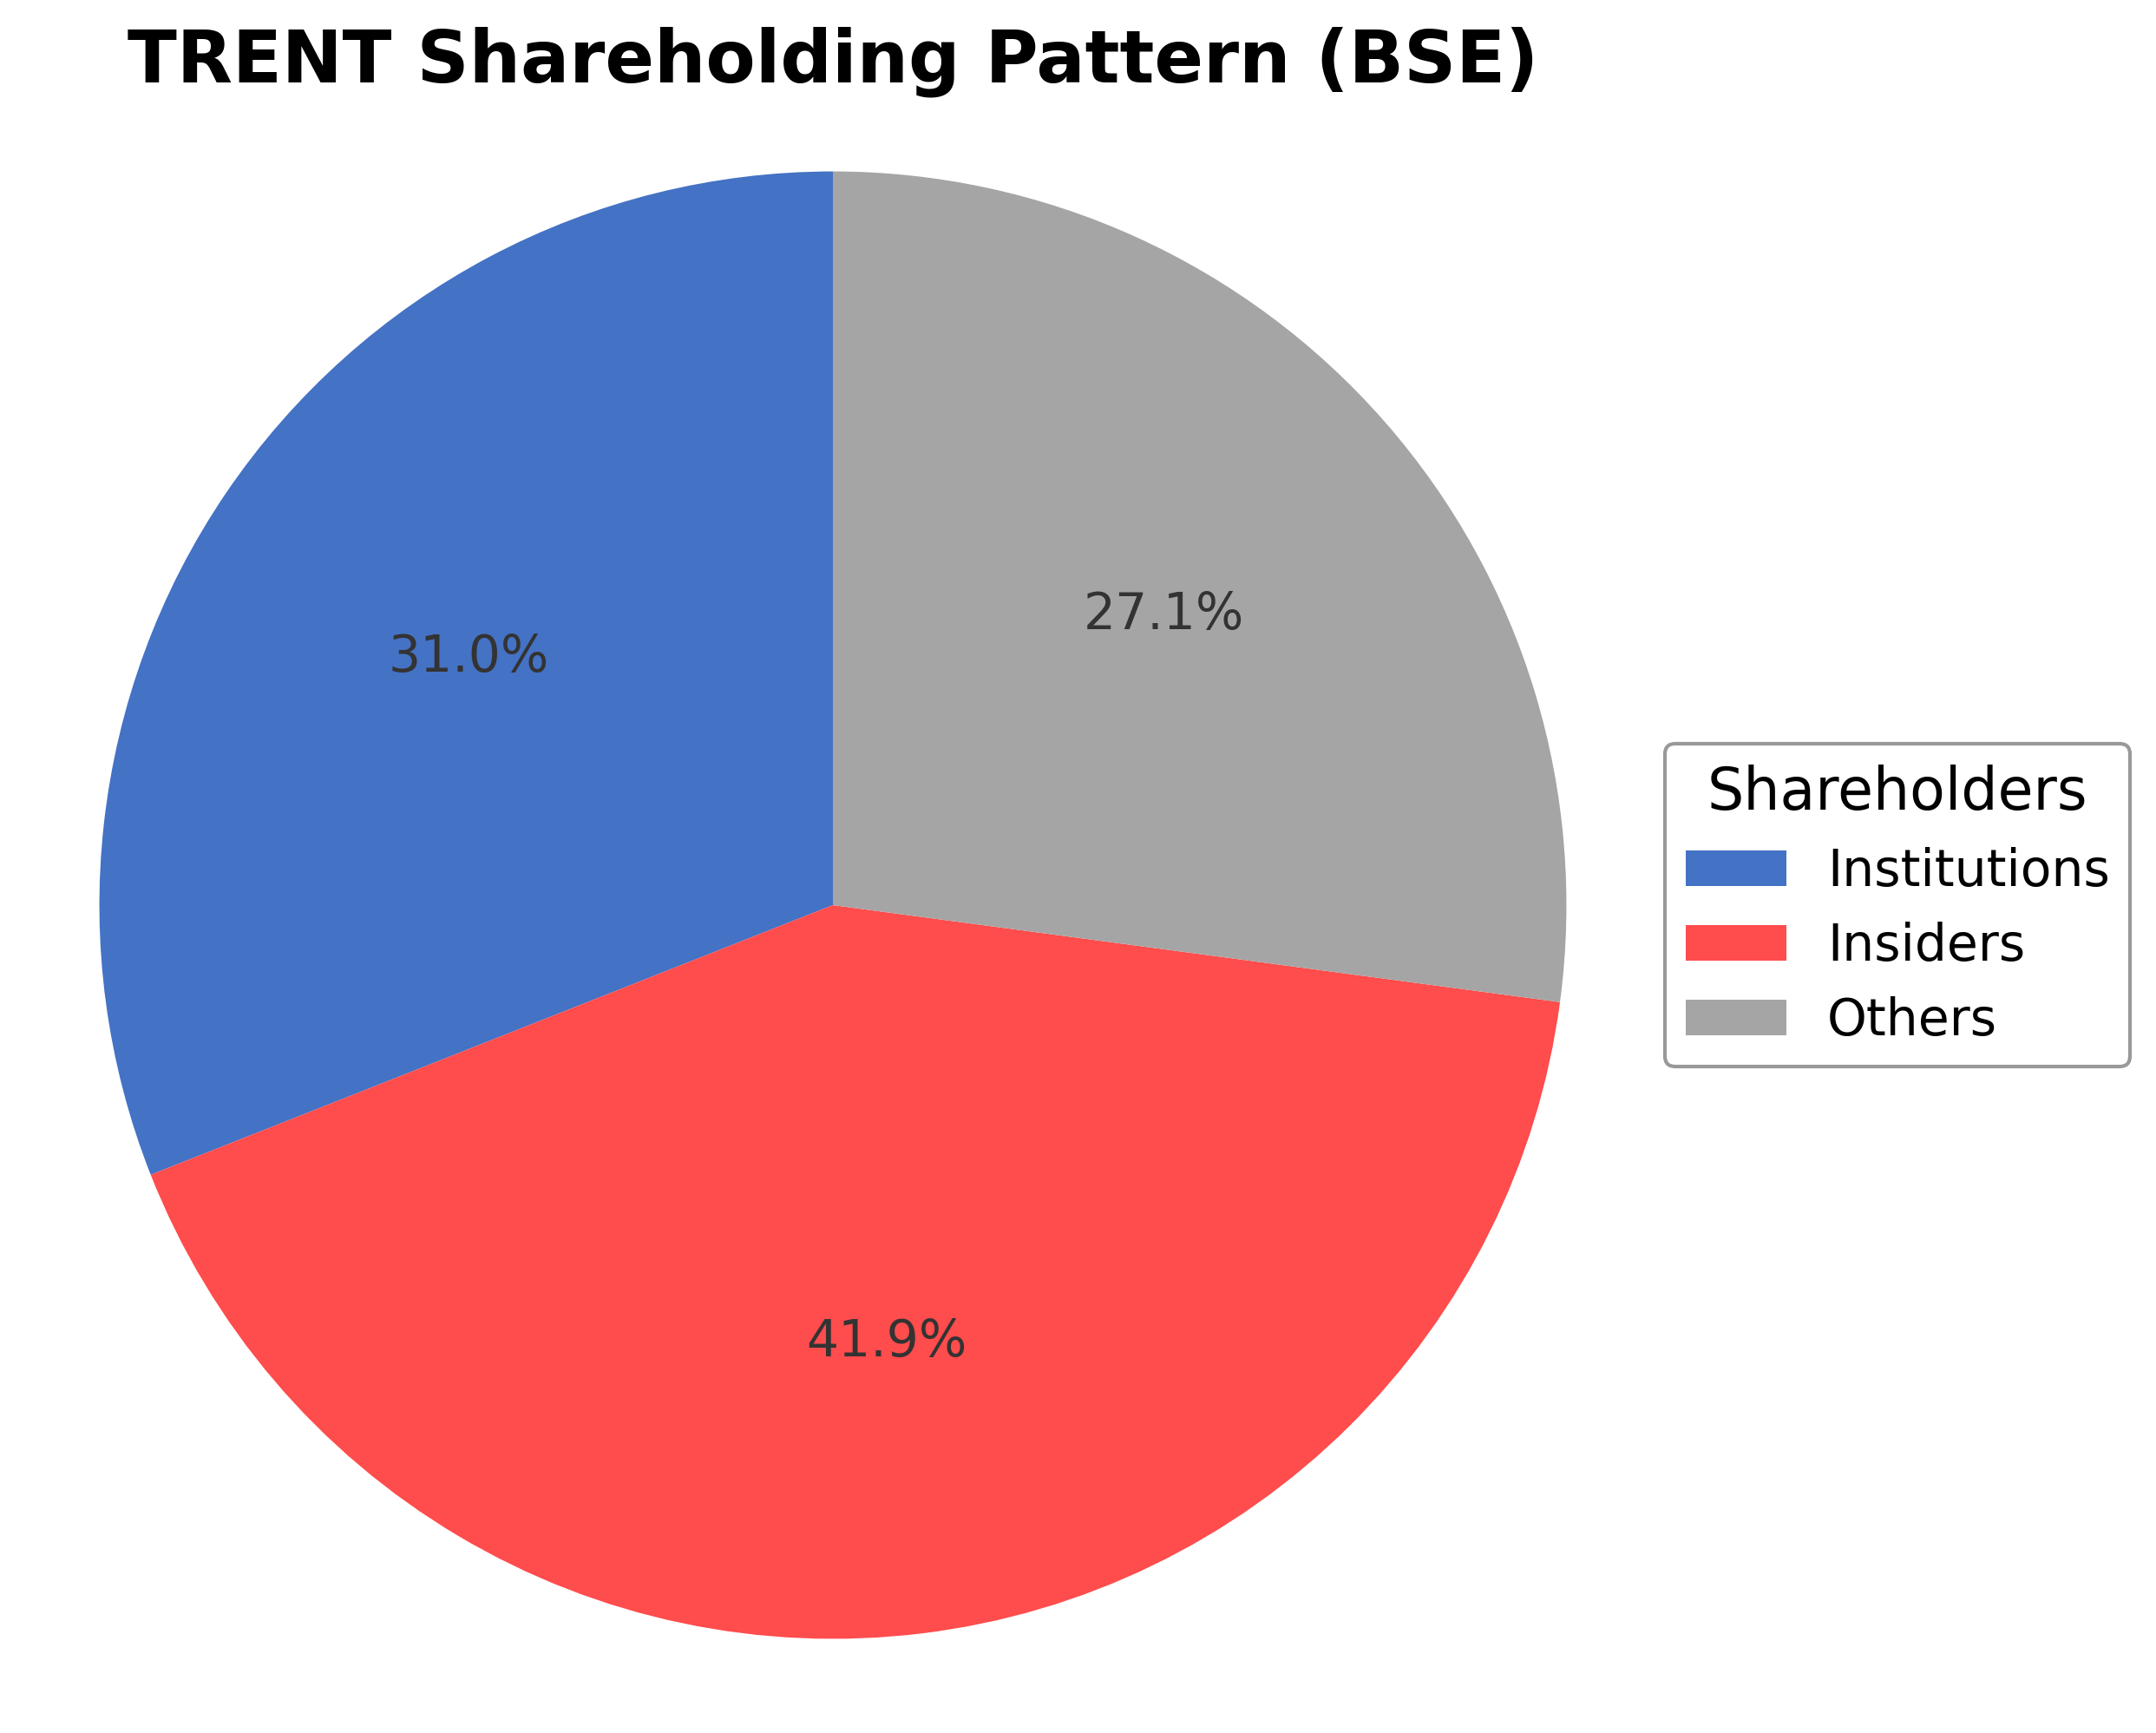
Shareholding Pattern
Sector and Industry Analysis
The retail sector in India is a large and rapidly growing market, driven by rising consumer incomes and urbanization. It encompasses diverse formats including organized retail chains, e-commerce, and specialty stores, with an expanding footprint across tier 1 and tier 2 cities. Key players include Reliance Retail, Aditya Birla Fashion, and Trent Ltd., each commanding significant market share and leveraging extensive distribution networks.
Industry trends highlight a shift towards omnichannel retailing, with companies investing heavily in digital platforms and direct-to-consumer models to enhance customer engagement. Supply chain optimization and aggressive store expansions remain critical competitive levers, while barriers to entry include high capital requirements and established brand loyalty. Trent Ltd. is positioned to capitalize on these trends through its store rollout strategy and integration within the Tata ecosystem, which provides operational synergies.
The regulatory environment for retail is evolving, with policies aimed at balancing foreign investment and protecting domestic players. Compliance with taxation reforms, labor laws, and consumer protection regulations remains essential for operational stability. Potential regulatory changes could impact supply chain costs and market entry strategies, necessitating vigilance from industry participants to maintain growth momentum.
Note: Analysis synthesized from industry research, market reports, and regulatory filings. Information is subject to change based on market conditions.
Financial Ratios Dashboard
Financials
Peer Analysis
| Company Name | Market Cap | P/E Ratio | P/B Ratio | EV/EBITDA | Price to CFO |
|---|---|---|---|---|---|
| Trent Ltd. | ₹1.13T | 69.22 | 18.61 | 57.98 | 46.34 |
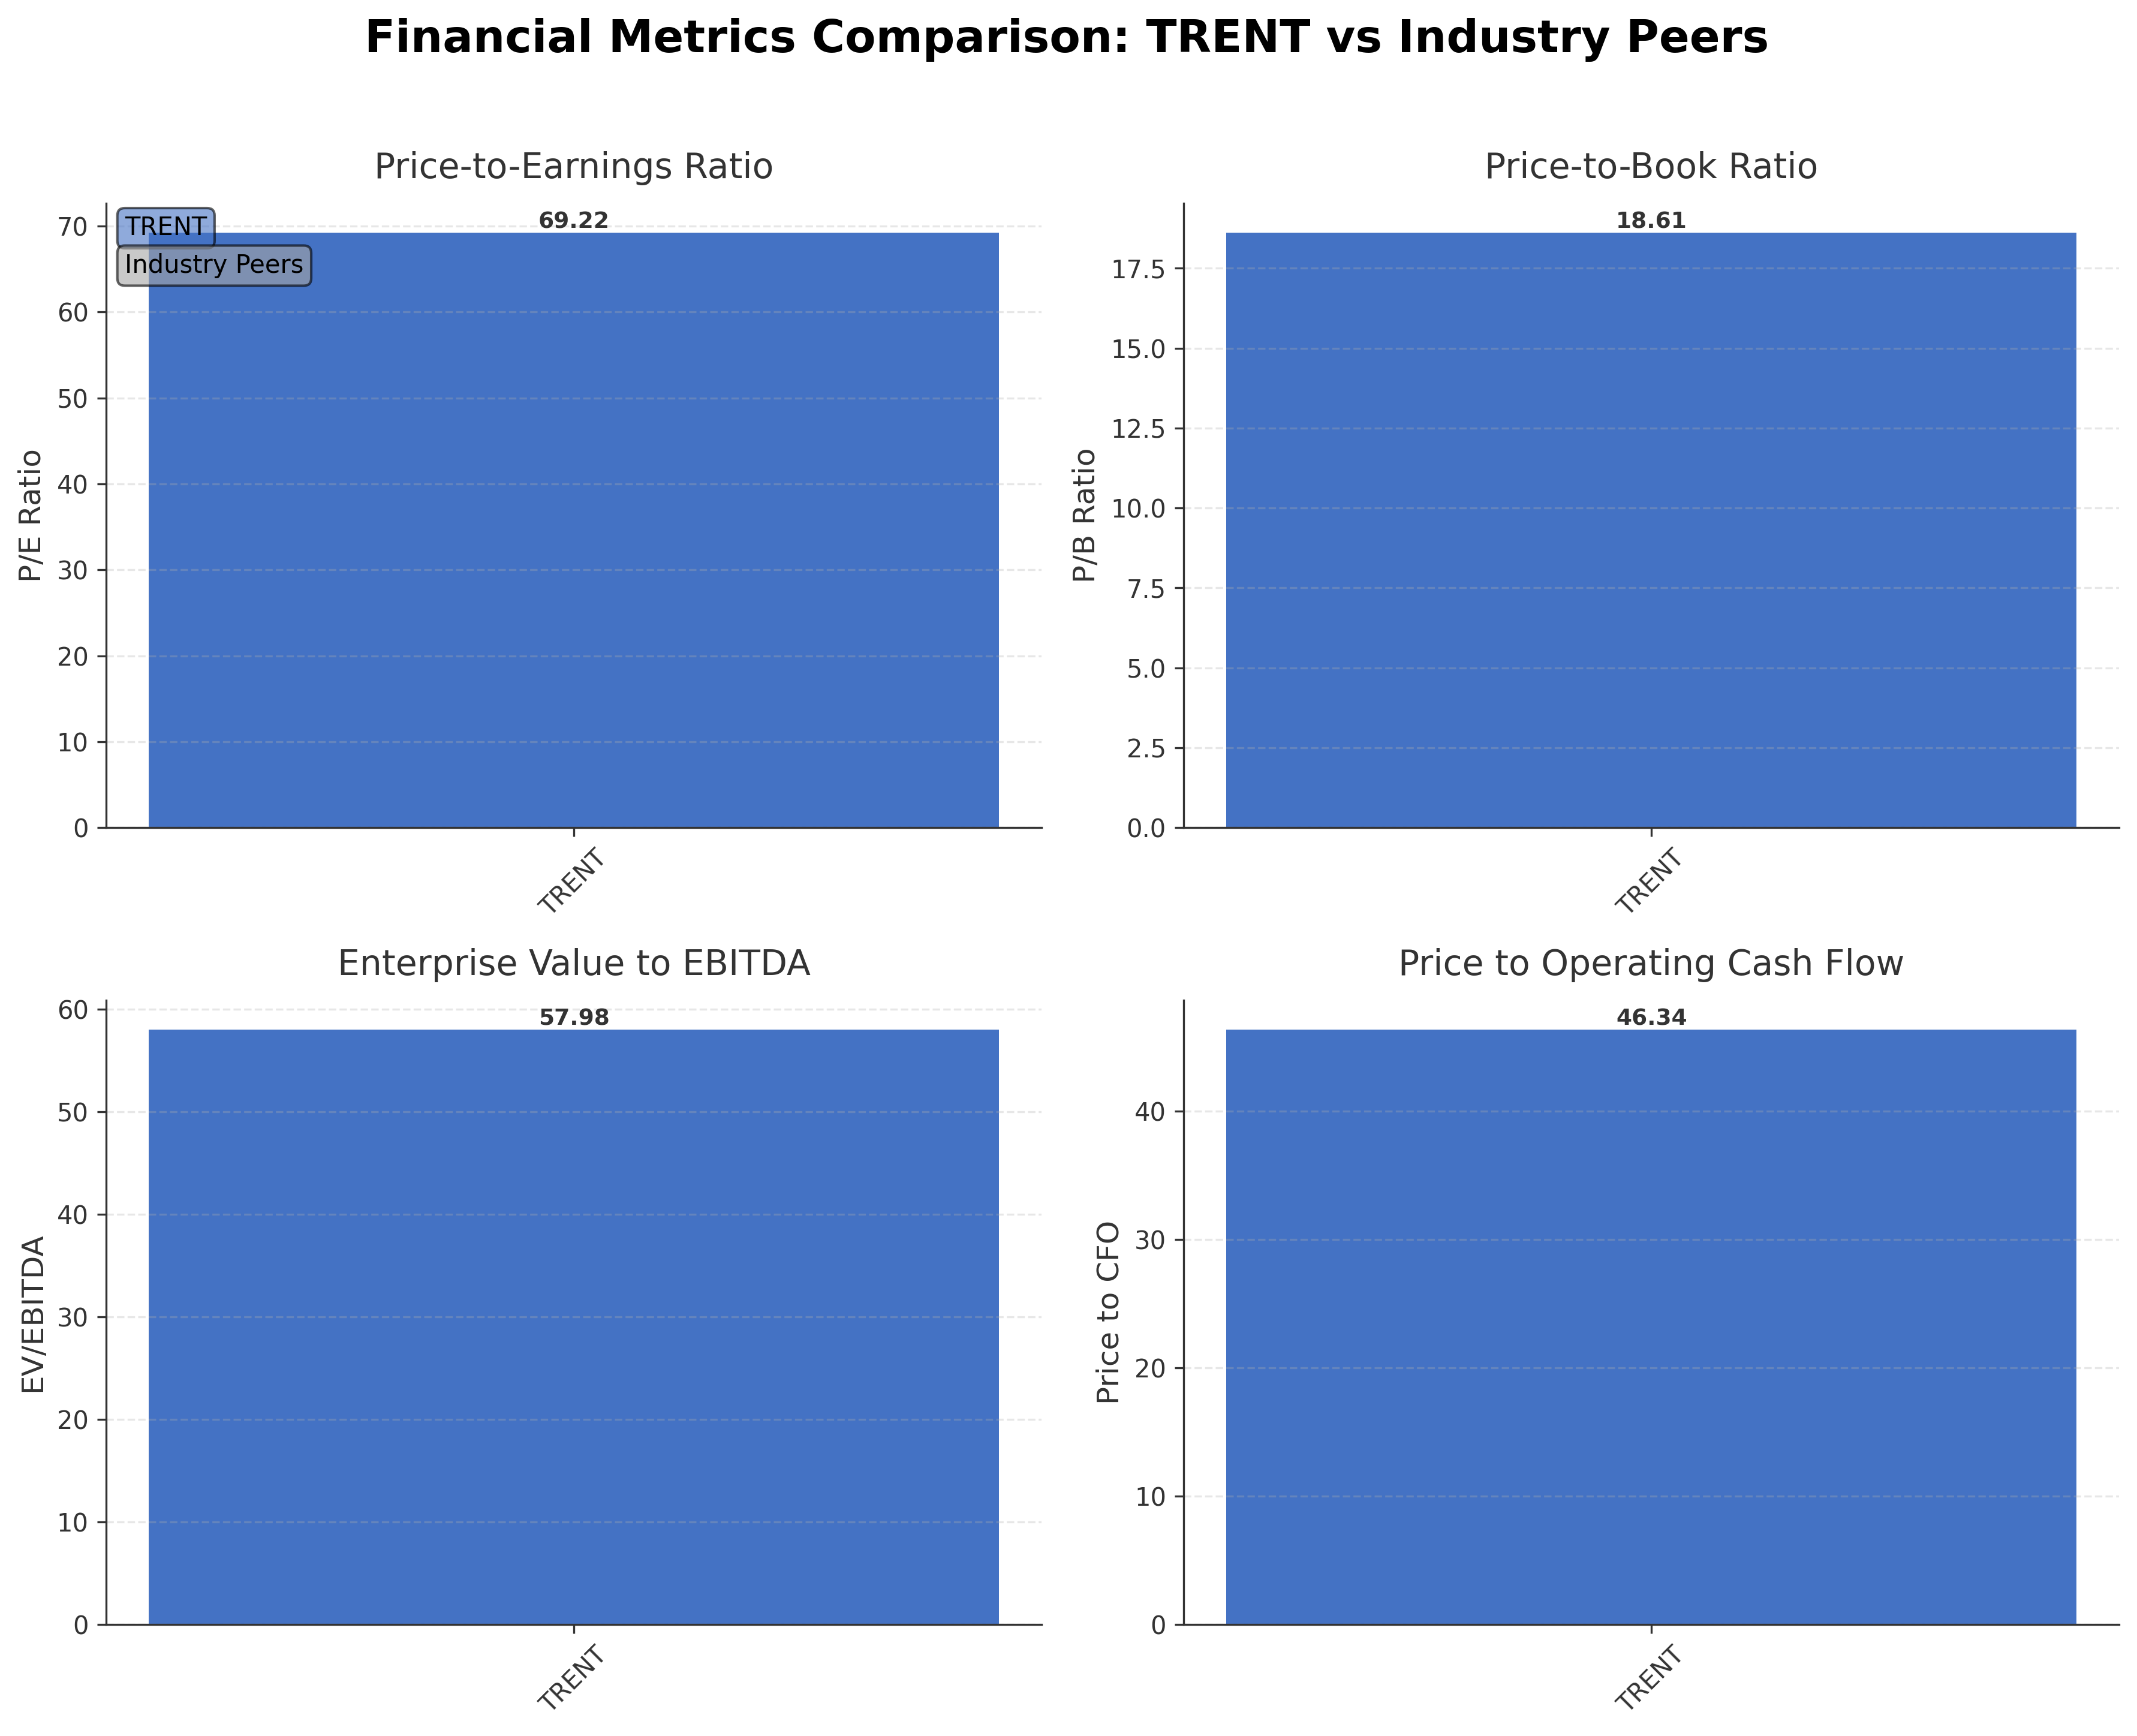
Comparison Analysis: Trent Ltd. currently stands as a leading apparel retail company with a market capitalization of ₹1.13 trillion. Its valuation metrics such as P/E ratio of 69.22 and P/B ratio of 18.61 are high, reflecting premium market expectations consistent with the apparel retail sector in India. The EV/EBITDA ratio of 57.98 and price to cash flow of 46.34 further indicate elevated valuation levels. The company’s return on equity of 29.38% demonstrates strong profitability relative to peers. However, the absence of direct peer data limits detailed comparative insights, though Trent’s metrics suggest it is positioned as a high-growth, high-valuation entity within its industry.
Financial Metrics Comparison with Peers
Financial Statements
Comprehensive financial data including income, balance sheet, and cash flow metrics
Income Statement
| fiscal_date | 2026-03-31 | 2025-03-31 | 2024-03-31 | 2023-03-31 | 2022-03-31 |
|---|---|---|---|---|---|
| Sales | 198.50B | 168.74B | 122.05B | 81.12B | 44.17B |
| Cost Of Goods | 113.59B | 98.44B | 69.59B | 47.20B | 24.82B |
| Gross Profit | 84.91B | 70.29B | 52.46B | 33.93B | 19.36B |
| Operating Expense Selling General And Administrative | 10.28B | 8.79B | 6.75B | 6.14B | 4.19B |
| Operating Expense Other Operating Expenses | 10.00B | 7.54B | 6.34B | 4.45B | 2.38B |
| Operating Income | 23.78B | 19.04B | 12.84B | 6.13B | 2.74B |
| Non Operating Interest Income | 490.50M | 307.70M | 185.60M | 166.70M | 209.70M |
| Non Operating Interest Expense | 1.68B | 1.39B | 3.19B | 3.69B | 3.05B |
| Pretax Income | 22.36B | 20.30B | 19.21B | 5.52B | 1.11B |
| Income Tax | 5.15B | 4.95B | 4.43B | 1.58B | 766.20M |
| Net Income | 17.21B | 15.34B | 14.77B | 3.94B | 346.00M |
| Eps Basic | 32.25 | 43.51 | 41.82 | 12.51 | 2.98 |
| Eps Diluted | 32.25 | 43.51 | 41.82 | 12.51 | 2.98 |
| Basic Shares Outstanding | 533.23M | 355.49M | 355.49M | 355.49M | 355.49M |
| Diluted Shares Outstanding | 533.23M | 355.49M | 355.49M | 355.49M | 355.49M |
| Ebit | 24.05B | 21.68B | 22.40B | 9.21B | 4.16B |
| Ebitda | 37.51B | 28.82B | 20.73B | 11.86B | 6.05B |
| Net Income Continuous Operations | 22.36B | 20.30B | 13.45B | 5.55B | 1.39B |
| Minority Interests | -16.80M | 123.10M | 93.40M | 510.00M | 712.30M |
| Preferred Stock Dividends | 0.00 | 0.00 | 0.00 | 0.00 | 0.00 |
Data provided by Twelve Data
Balance Sheet
| fiscal_date | 2026-03-31 | 2025-03-31 | 2024-03-31 | 2023-03-31 | 2022-03-31 |
|---|---|---|---|---|---|
| Cash And Cash Equivalents | 2.81B | 3.38B | 2.95B | 832.30M | 823.90M |
| Accounts Receivable | 511.40M | 629.50M | 817.40M | 343.90M | 182.60M |
| Total Assets | 117.29B | 94.20B | 71.62B | 80.82B | 77.26B |
| Total Liabilities | 46.21B | 38.36B | 30.59B | 54.19B | 53.16B |
| Long Term Debt | 12.07B | 16.01B | 13.44B | 42.48B | 46.23B |
| Shareholders Equity | 71.08B | 55.83B | 41.03B | 26.63B | 24.10B |
Data provided by Twelve Data
Cash Flow Statement
| fiscal_date | 2026-03-31 | 2025-03-31 | 2024-03-31 | 2023-03-31 | 2022-03-31 |
|---|---|---|---|---|---|
| Operating Activities Net Income | 22.36B | 20.30B | 13.45B | 5.55B | 1.39B |
| Operating Activities Other Non Cash Items | 684.10M | 775.10M | 2.40B | 2.62B | 1.66B |
| Operating Activities Accounts Receivable | -4.84B | -3.31B | -3.20B | -1.73B | -1.48B |
| Operating Activities Other Assets Liabilities | -2.26B | -4.48B | -1.29B | -4.52B | -4.16B |
| Operating Activities Operating Cash Flow | 15.95B | 13.28B | 11.35B | 1.92B | -2.59B |
| Investing Activities Capital Expenditures | -17.36B | -8.62B | -3.94B | -2.23B | -2.10B |
| Investing Activities Net Acquisitions | 540.10M | 893.40M | -618.50M | -515.00M | -662.70M |
| Investing Activities Purchase Of Investments | -48.25B | -38.85B | -19.38B | -16.10B | -13.22B |
| Investing Activities Sale Of Investments | 48.63B | 37.26B | 18.08B | 16.16B | 15.30B |
| Investing Activities Investing Cash Flow | -16.45B | -9.31B | -5.85B | -2.69B | -679.90M |
| Financing Activities Common Stock Issuance | 0.00 | 934.90M | 357.30M | 463.10M | 5.51B |
| Financing Activities Common Dividends | -1.77B | -1.14B | -782.70M | -392.60M | -427.20M |
| Financing Activities Financing Cash Flow | -1.77B | -201.00M | -425.90M | -1.66B | 2.08B |
| End Cash Position | 2.81B | 3.38B | 2.95B | 832.30M | 823.90M |
| Free Cash Flow | 9.05B | 3.93B | 6.12B | 914.80M | -2.13B |
| Financing Activities Long Term Debt Payments | N/A | 0.00 | -500.00K | -1.73B | -3.01B |
| Financing Activities Short Term Debt Issuance | N/A | N/A | 0.00 | 0.00 | 0.00 |
| Financing Activities Common Stock Repurchase | N/A | N/A | N/A | N/A | N/A |
Data provided by Twelve Data
Technical Analysis
Key Insights
- Trent Ltd. is currently exhibiting an upward trend with recent price rallies indicating strong buying interest and momentum.
- Key support levels are identified near ₹3,000, with resistance around the 52-week high of ₹4,172.67 acting as a critical barrier.
- The stock price is trading above the 10-day moving average and near the 50-day moving average at ₹4,062, but remains below the 200-day moving average of ₹4,932, suggesting mixed medium-term momentum.
- Momentum indicators show a moderately strong Relative Strength Index (RSI) indicating neither overbought nor oversold conditions, while MACD signals recent bullish crossover.
- Analysis across daily, weekly, and monthly timeframes confirms short-term strength with potential consolidation in the medium term.
- Current technical setup suggests scenarios of continued upward movement if support holds, or potential retracement if resistance levels prove strong.
Trending News
Summary: Stocks to buy for the short term: Anand Rathi's Jigar Patel identifies three stocks, including Trent and Eternal, as prime investments for the next 1-2 weeks, highlighting key bullish indicators.
Sentiment: neutral
Summary: Trent Share Price: Find the latest news on Trent Stock Price. Get all the information on Trent with historic price charts for NSE / BSE. Experts & Broker view also get the Trent Ltd. buy/sell tips detailed news, announcements, Forecasts, Analysts, Valuation, Earning forecasts, Estimates, ...
Sentiment: neutral
3. Headline: Trent Ltd: Understanding The Recent Momentum and Business Context | Whalesbook
Summary: Trent Ltd shares have seen strong upward momentum, marked by a technical breakout and a series of gains. While the company’s rapid store expansion and business growth, particularly through the Zudio brand, continue to drive market interest, investors should consider the stock's premium valuation ...
Sentiment: positive
4. Headline: Severn Trent (LSE:SVT) Stock Fair Value Edges Lower As Analysts Split On Targets
Summary: Price target moves around Severn Trent are relatively modest, with fair value in one updated model trimmed from £32.12 to £31.69. That aligns with a wider mix of analyst views, where targets span roughly 2,879 GBp to 3,500 GBp as opinions differ on how confidently to price the company’s ...
Sentiment: negative
5. Headline: Trent Shares Jump 5% as Strong Demand Trends Offset Broker Concerns - HDFCSky
Summary: Mumbai, June 17: Trent Ltd share price surged nearly 5% on Wednesday, the rally coming despite brokerage firm Citi maintaining its “Sell” rating on the stock, as investors focused instead on the company’s strong demand outlook and continued operational momentum.
Sentiment: positive
Powered by Brave
Recent Updates
News Summary
As of June 22, 2026. Trent Ltd. reported strong financial results for Q4 FY26, driven by significant growth in its retail operations, especially through the Westside and Zudio brands, highlighting expanding market presence and operational efficiency. The company also executed a 1:2 bonus share issue, which doubled the number of shares held by investors and adjusted the share price accordingly, impacting liquidity and shareholder value distribution without changing market capitalization. These developments underscore Trent's growth trajectory and proactive capital management strategies, reinforcing investor confidence in its business model and future prospects.
News Sentiment
The overall sentiment from recent updates is positive, reflecting strong operational performance and strategic corporate actions. The Q4 FY26 earnings report indicates robust retail growth, while the bonus share issue demonstrates effective capital management. Although share price adjustments followed the bonus issue, the underlying fundamentals and market response remain constructive. This positive tone is balanced by the need for investors to monitor valuation levels and market conditions closely.
Source List
- https://www.ad-hoc-news.de/boerse/news/ueberblick/trent-ltd-stock-ine849a01020-retail-growth-story-after-strong-q4-fy26/69510124
- https://www.cnbctv18.com/market/trent-share-price-record-date-for-bonus-issue-today-all-you-need-to-know-ws-el-19919100.htm
Analytical Overview
Analysis Summary
Trent Ltd.'s valuation metrics, including a trailing P/E of 69.22 and forward P/E of 50.87, are in line with the apparel retail industry average, indicating a premium valuation reflecting growth expectations. The company's revenue growth of 15.9% quarter-over-quarter and positive cash flow trends, with operating cash flow of ₹24.39 billion and free cash flow of ₹5.94 billion, support a solid growth trajectory. Financial health appears stable, with a debt-to-equity ratio of 37.79% and a current ratio of 1.24, suggesting manageable leverage and adequate liquidity. Sector-specific opportunities include expanding organized retail in India and increasing consumer spending, while challenges involve intense competition and regulatory complexities. Considering the Indian market environment, regulatory frameworks, and evolving consumer preferences, Trent is well-positioned but must navigate sectoral risks carefully.
Overall Business and Market Assessment
Supporting Factors: strong revenue growth, robust cash flow generation, and a balanced capital structure with moderate debt levels
Risk Factors: elevated valuation multiples, competitive pressures in the retail sector, and sensitivity to macroeconomic fluctuations affecting consumer demand
SWOT Analysis
Strengths
- Strong brand portfolio with Westside and Landmark catering to diverse customer segments.
- Robust revenue growth of 15.9% quarter-over-quarter indicating operational momentum.
- Healthy return on equity of 29.38% reflecting efficient capital utilization.
- Strategic partnerships with Tata and Tesco enhancing market reach in retail segments.
Weaknesses
- High valuation multiples with a trailing P/E of 69.22 and EV/EBITDA of 57.98.
- Moderate debt-to-equity ratio of 37.79% which could impact financial flexibility.
- Relatively low dividend yield of 0.13% limiting income appeal.
- Stock price volatility with a 52-week range showing significant downside risk.
Opportunities
- Growing organized retail sector in India offering expansion potential.
- Increasing consumer spending and urbanization supporting retail demand.
- Expansion of the Zudio brand to capture value-conscious customer segments.
- Potential for further strategic partnerships to diversify product offerings.
Threats
- Intense competition from both organized and unorganized retail players.
- Regulatory changes impacting retail operations and pricing strategies.
- Macroeconomic factors such as inflation affecting consumer purchasing power.
- Risks related to supply chain disruptions and inventory management.
Company Description
Trent Ltd. operates as a key player in the retail industry, focusing on the Indian market. The company is known for its chain of retail stores offering a variety of products including apparels, accessories, and home goods. Through its lifestyle retailing divisions like Westside and Landmark, Trent Ltd. caters to diverse customer segments, emphasizing quality and style at competitive prices. Westside offers a unique combination of branded and in-house designed fashion, targeting both urban and suburban demographics. Landmark complements this by specializing in books, toys, stationery, and gift items. Additionally, Trent has entered strategic partnerships to expand its market reach, such as with Tata and Tesco through Star supermarkets. This partnership aims to enhance Trent's presence in the hypermarket and supermarket space, providing competitive pricing and a comprehensive range of grocery products. Trent Ltd.'s role in the financial market is significant not only because of its retail penetration but also due to its contribution to the evolving consumer landscape in India, showcasing the growing importance of organized retail and distribution in emerging markets.