


Torrent Pharmaceuticals Ltd (TORNTPHARM)
Stock Analysis Report
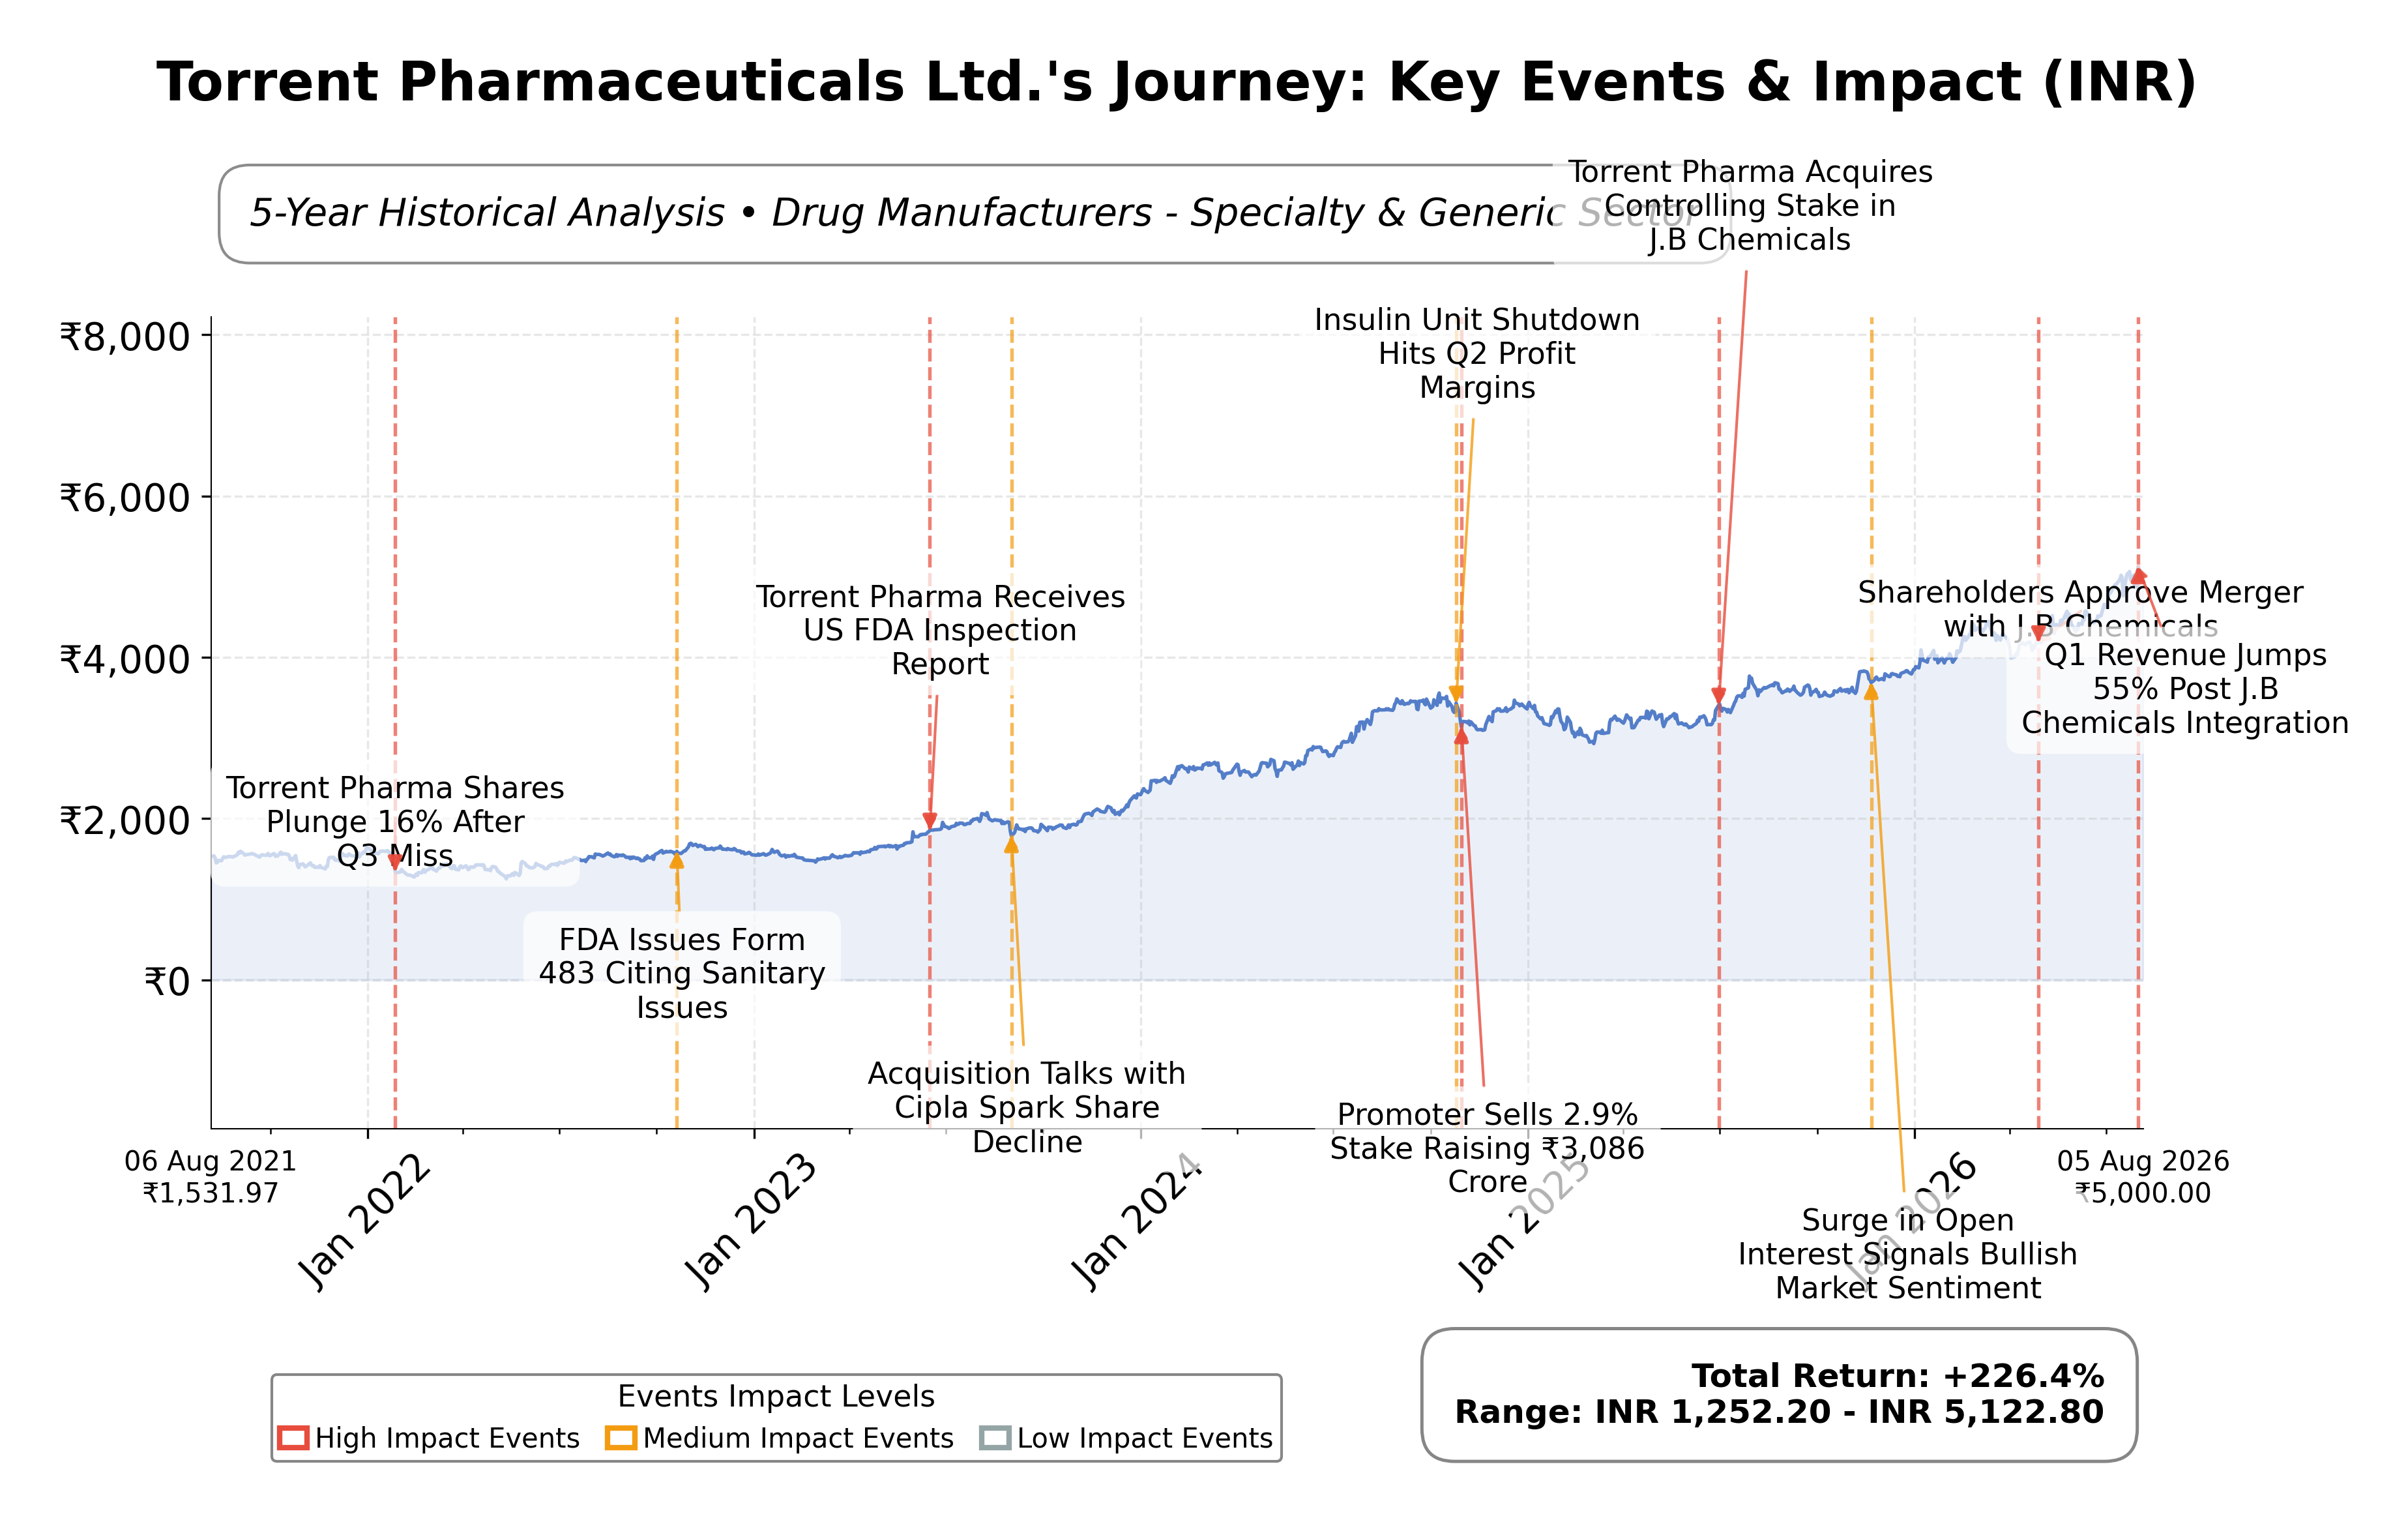
Stock Journey
Key Positives and Key Risks
Pros
- Revenue growth of 41.8% quarter-over-quarter indicates strong top-line momentum.
- Operating cash flow of INR 30.2 billion and free cash flow of INR 26.0 billion demonstrate robust cash generation.
- Return on equity of 16.99% reflects efficient use of shareholder capital.
Cons
- Trailing P/E ratio of 77.52 is significantly higher than industry peers, suggesting premium valuation.
- Debt-to-equity ratio of 85.45% indicates elevated leverage which may constrain financial flexibility.
- Quarterly earnings growth year-over-year declined by 21.9%, signaling potential margin pressure.
Disclosure: This information is for general awareness and does not constitute investment advice
Report Summary
Torrent Pharmaceuticals Ltd. operates as a prominent pharmaceutical company listed on the NSE in India, specializing in the development, manufacturing, and distribution of generic and branded medicines. Its product portfolio spans multiple therapeutic areas including cardiovascular, central nervous system, gastrointestinal, and anti-infective treatments. The company maintains a strong foothold in both domestic and international markets, notably in regulated regions such as the United States and Europe, positioning itself as a key player in the specialty and generic drug manufacturing sector within the healthcare industry.
Financially, Torrent Pharmaceuticals reported trailing twelve months (TTM) revenue of approximately INR 139.8 billion, with a gross margin of 75.4%, operating margin of 20.2%, and net profit margin of 15.5%. The return on equity (ROE) stands at 16.99%, and return on assets (ROA) at 7.25%, reflecting efficient capital utilization and profitability. Operating cash flow for the TTM period was INR 30.2 billion, supporting a levered free cash flow of INR 26.0 billion, indicating healthy cash generation relative to earnings.
Valuation metrics reveal a trailing price-to-earnings (P/E) ratio of 77.52 and a forward P/E of 52.80, which are elevated compared to industry peers, alongside a price-to-book (P/B) ratio of 20.02 and an enterprise value to EBITDA (EV/EBITDA) multiple of 42.21. The market capitalization is approximately INR 1.89 trillion, with the stock trading near INR 5,000, close to its 52-week high of INR 5,085.80 and well above its 52-week low of INR 3,480.60, indicating a strong price appreciation over the past year.
Key strengths include robust cash flow generation, a diversified product portfolio, and significant presence in regulated markets, which contribute to its market leadership. Risks encompass high valuation multiples relative to peers, potential regulatory challenges in international markets, and competitive pressures in the pharmaceutical sector. Recent strategic developments include the proposed appointment of Shanti Ekambaram as an Independent Director, bringing extensive financial expertise, which may enhance governance and oversight.
Technically, the stock has demonstrated an upward trend with recent price momentum supported by multiple timeframes, trading above key moving averages such as the 50-day and 200-day. Market activity shows increased call option volumes near the INR 5,000 strike price, reflecting heightened investor interest. Overall, the data suggests a market environment where accumulation and monitoring of developments may be prudent, given the premium valuation and recent positive operational updates.
Company and Industry Overview
Company Basics
Price Performance
Company Size
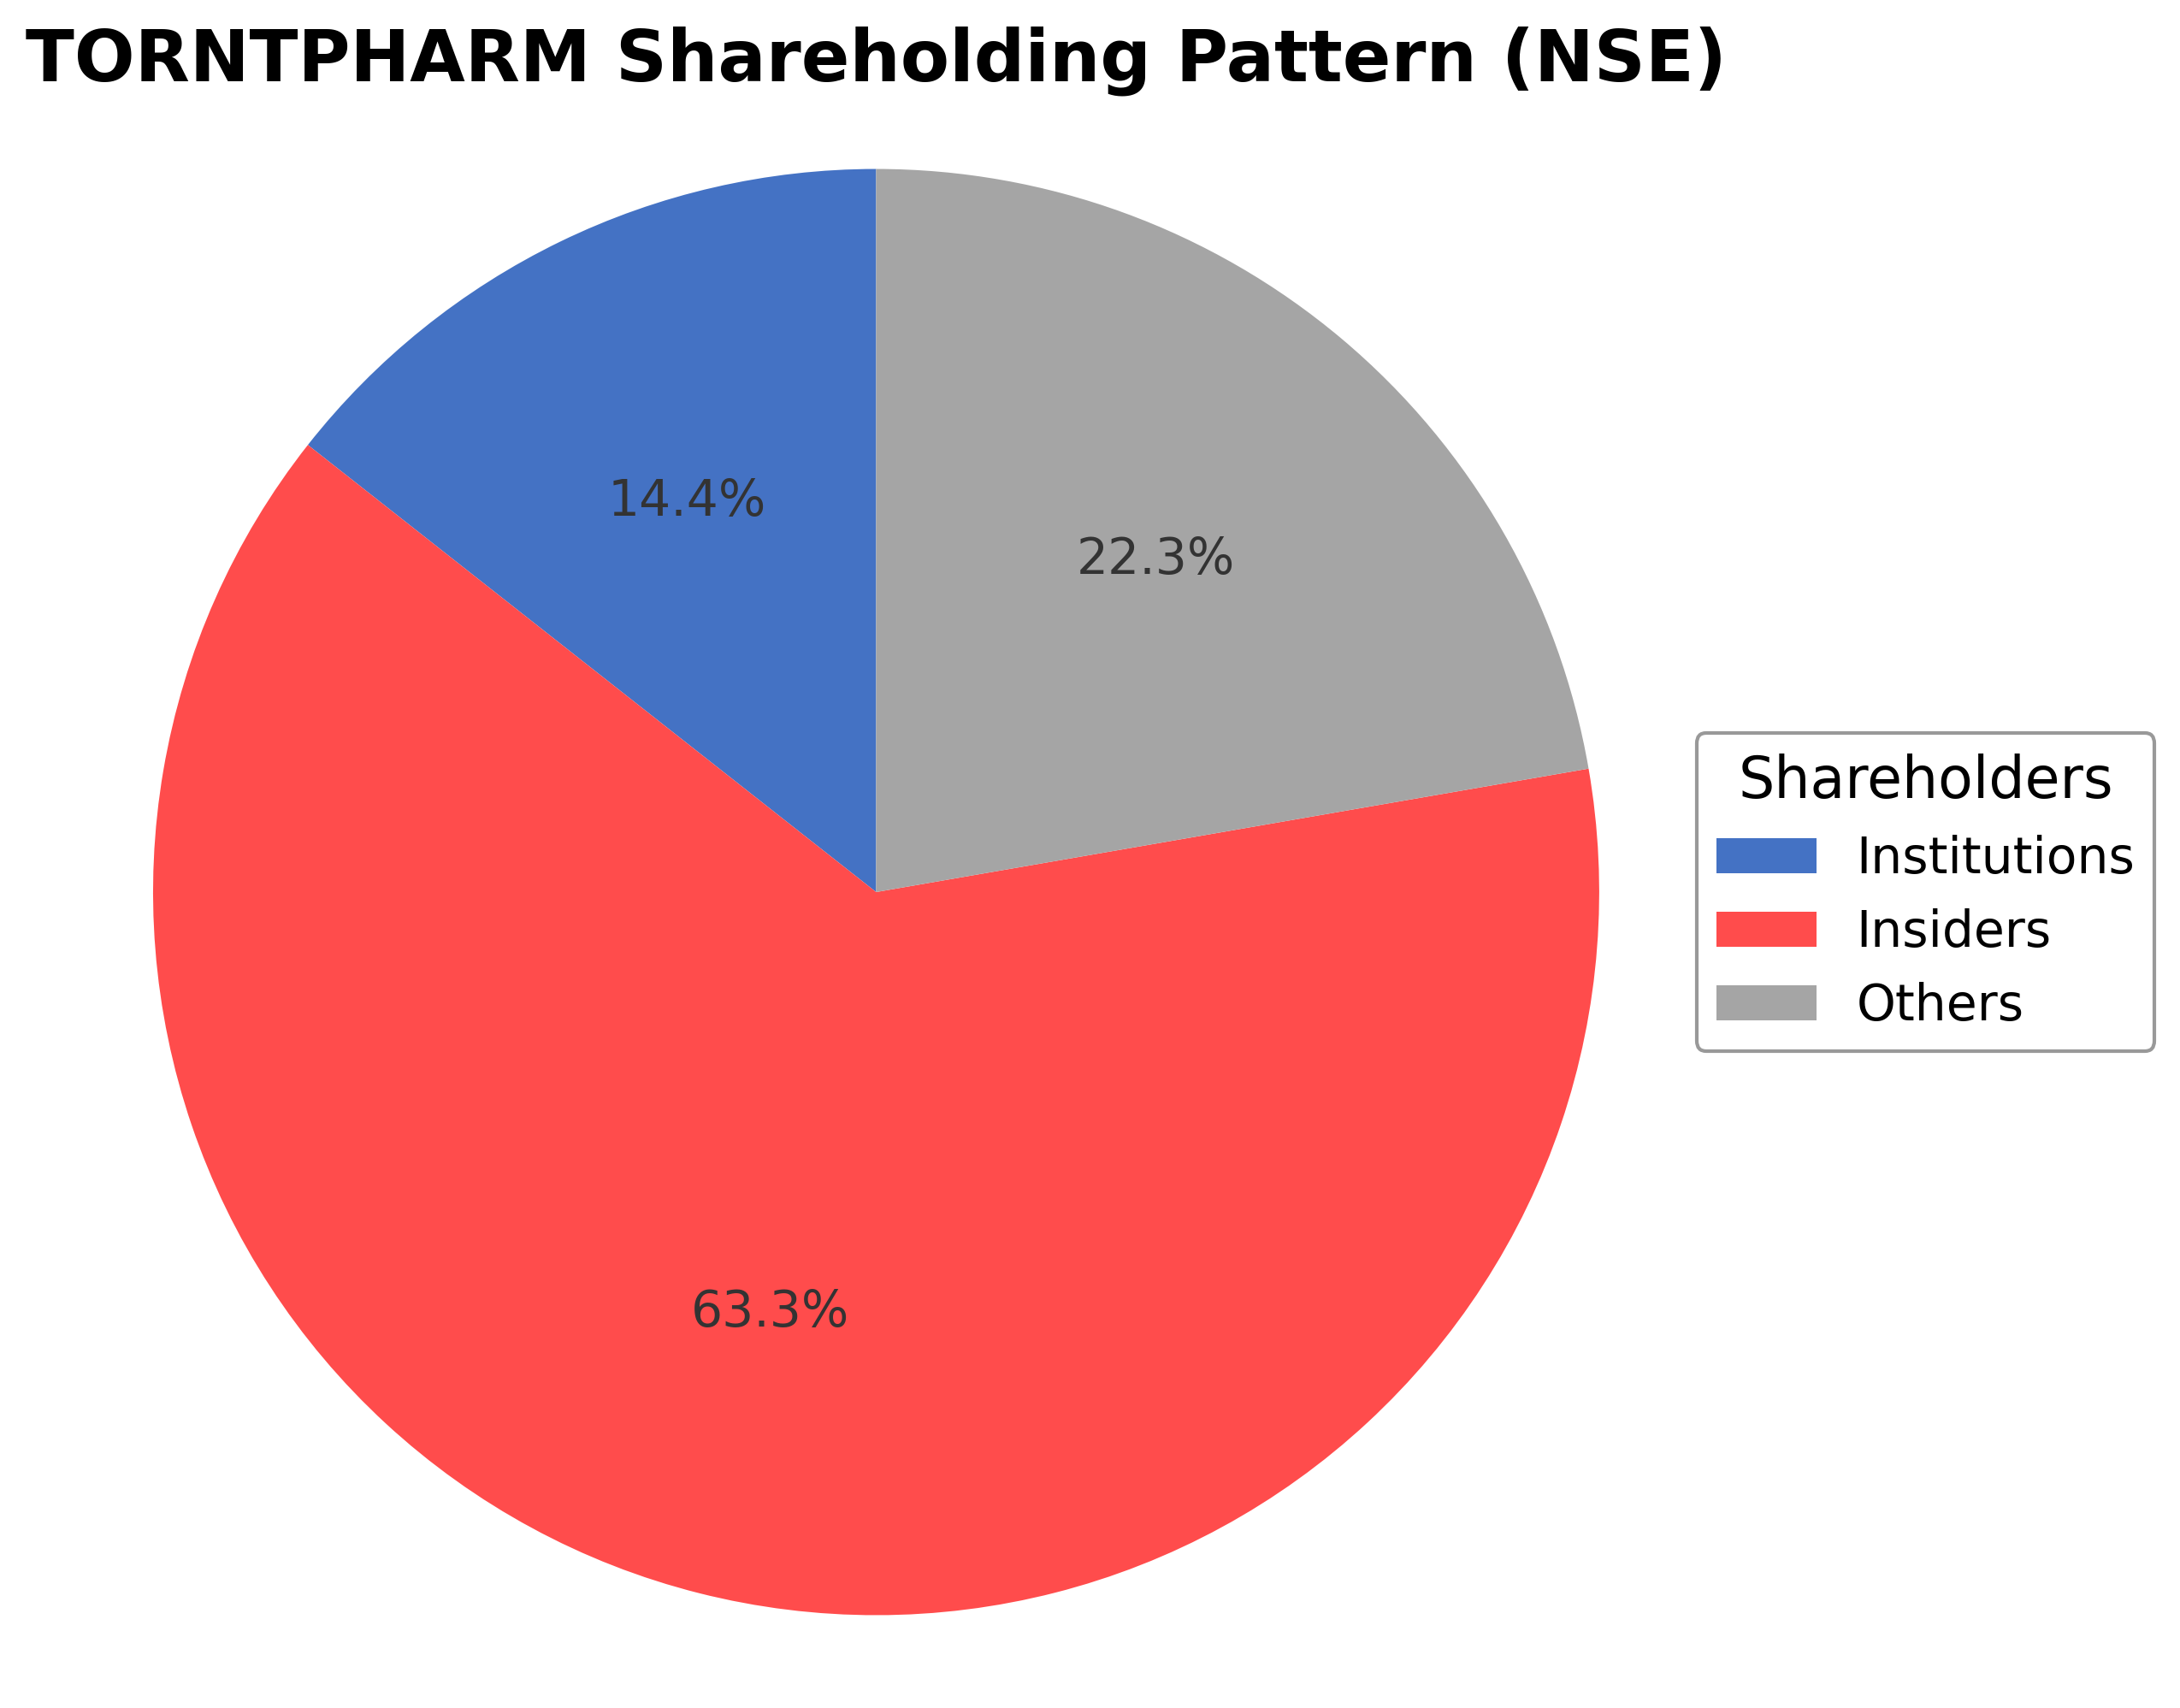
Shareholding Pattern
Sector and Industry Analysis
The pharmaceutical sector in India is a significant contributor to the global generics market, with a market size expected to reach substantial growth driven by rising healthcare demand and expanding access. The sector has witnessed a compounded sales growth of around 12% over the past five years, reflecting steady expansion. Key players include Torrent Pharmaceuticals, Sun Pharma, Dr. Reddy’s, and Cipla, which dominate both domestic and international markets, especially in branded generics and generic formulations.
Industry trends show a growing emphasis on branded generics, which constitute a major portion of revenues for companies like Torrent Pharmaceuticals, focusing on therapeutic segments such as cardiovascular, CNS, and diabetes. The generics segment is expanding in regulated markets like the US and Europe, though it faces intense competition and pricing pressures. Barriers to entry include high R&D costs, regulatory approvals, and the need for robust manufacturing capabilities, positioning established firms with strong product pipelines and global reach favorably.
The regulatory landscape is characterized by stringent compliance requirements from bodies such as the US FDA and Indian regulatory authorities, impacting market access and product approvals. Patent expirations continue to open opportunities for generic manufacturers, while evolving policies on drug pricing and quality standards influence operational strategies. Overall, regulatory oversight aims to ensure drug safety and efficacy, shaping the competitive environment and growth prospects for pharmaceutical companies.
Note: Analysis synthesized from industry research, market reports, and regulatory filings. Information is subject to change based on market conditions.
Financial Ratios Dashboard
Illustrative Scenario Analysis
DCF Assumptions:
Method: Two-Stage EPS-Priority Model
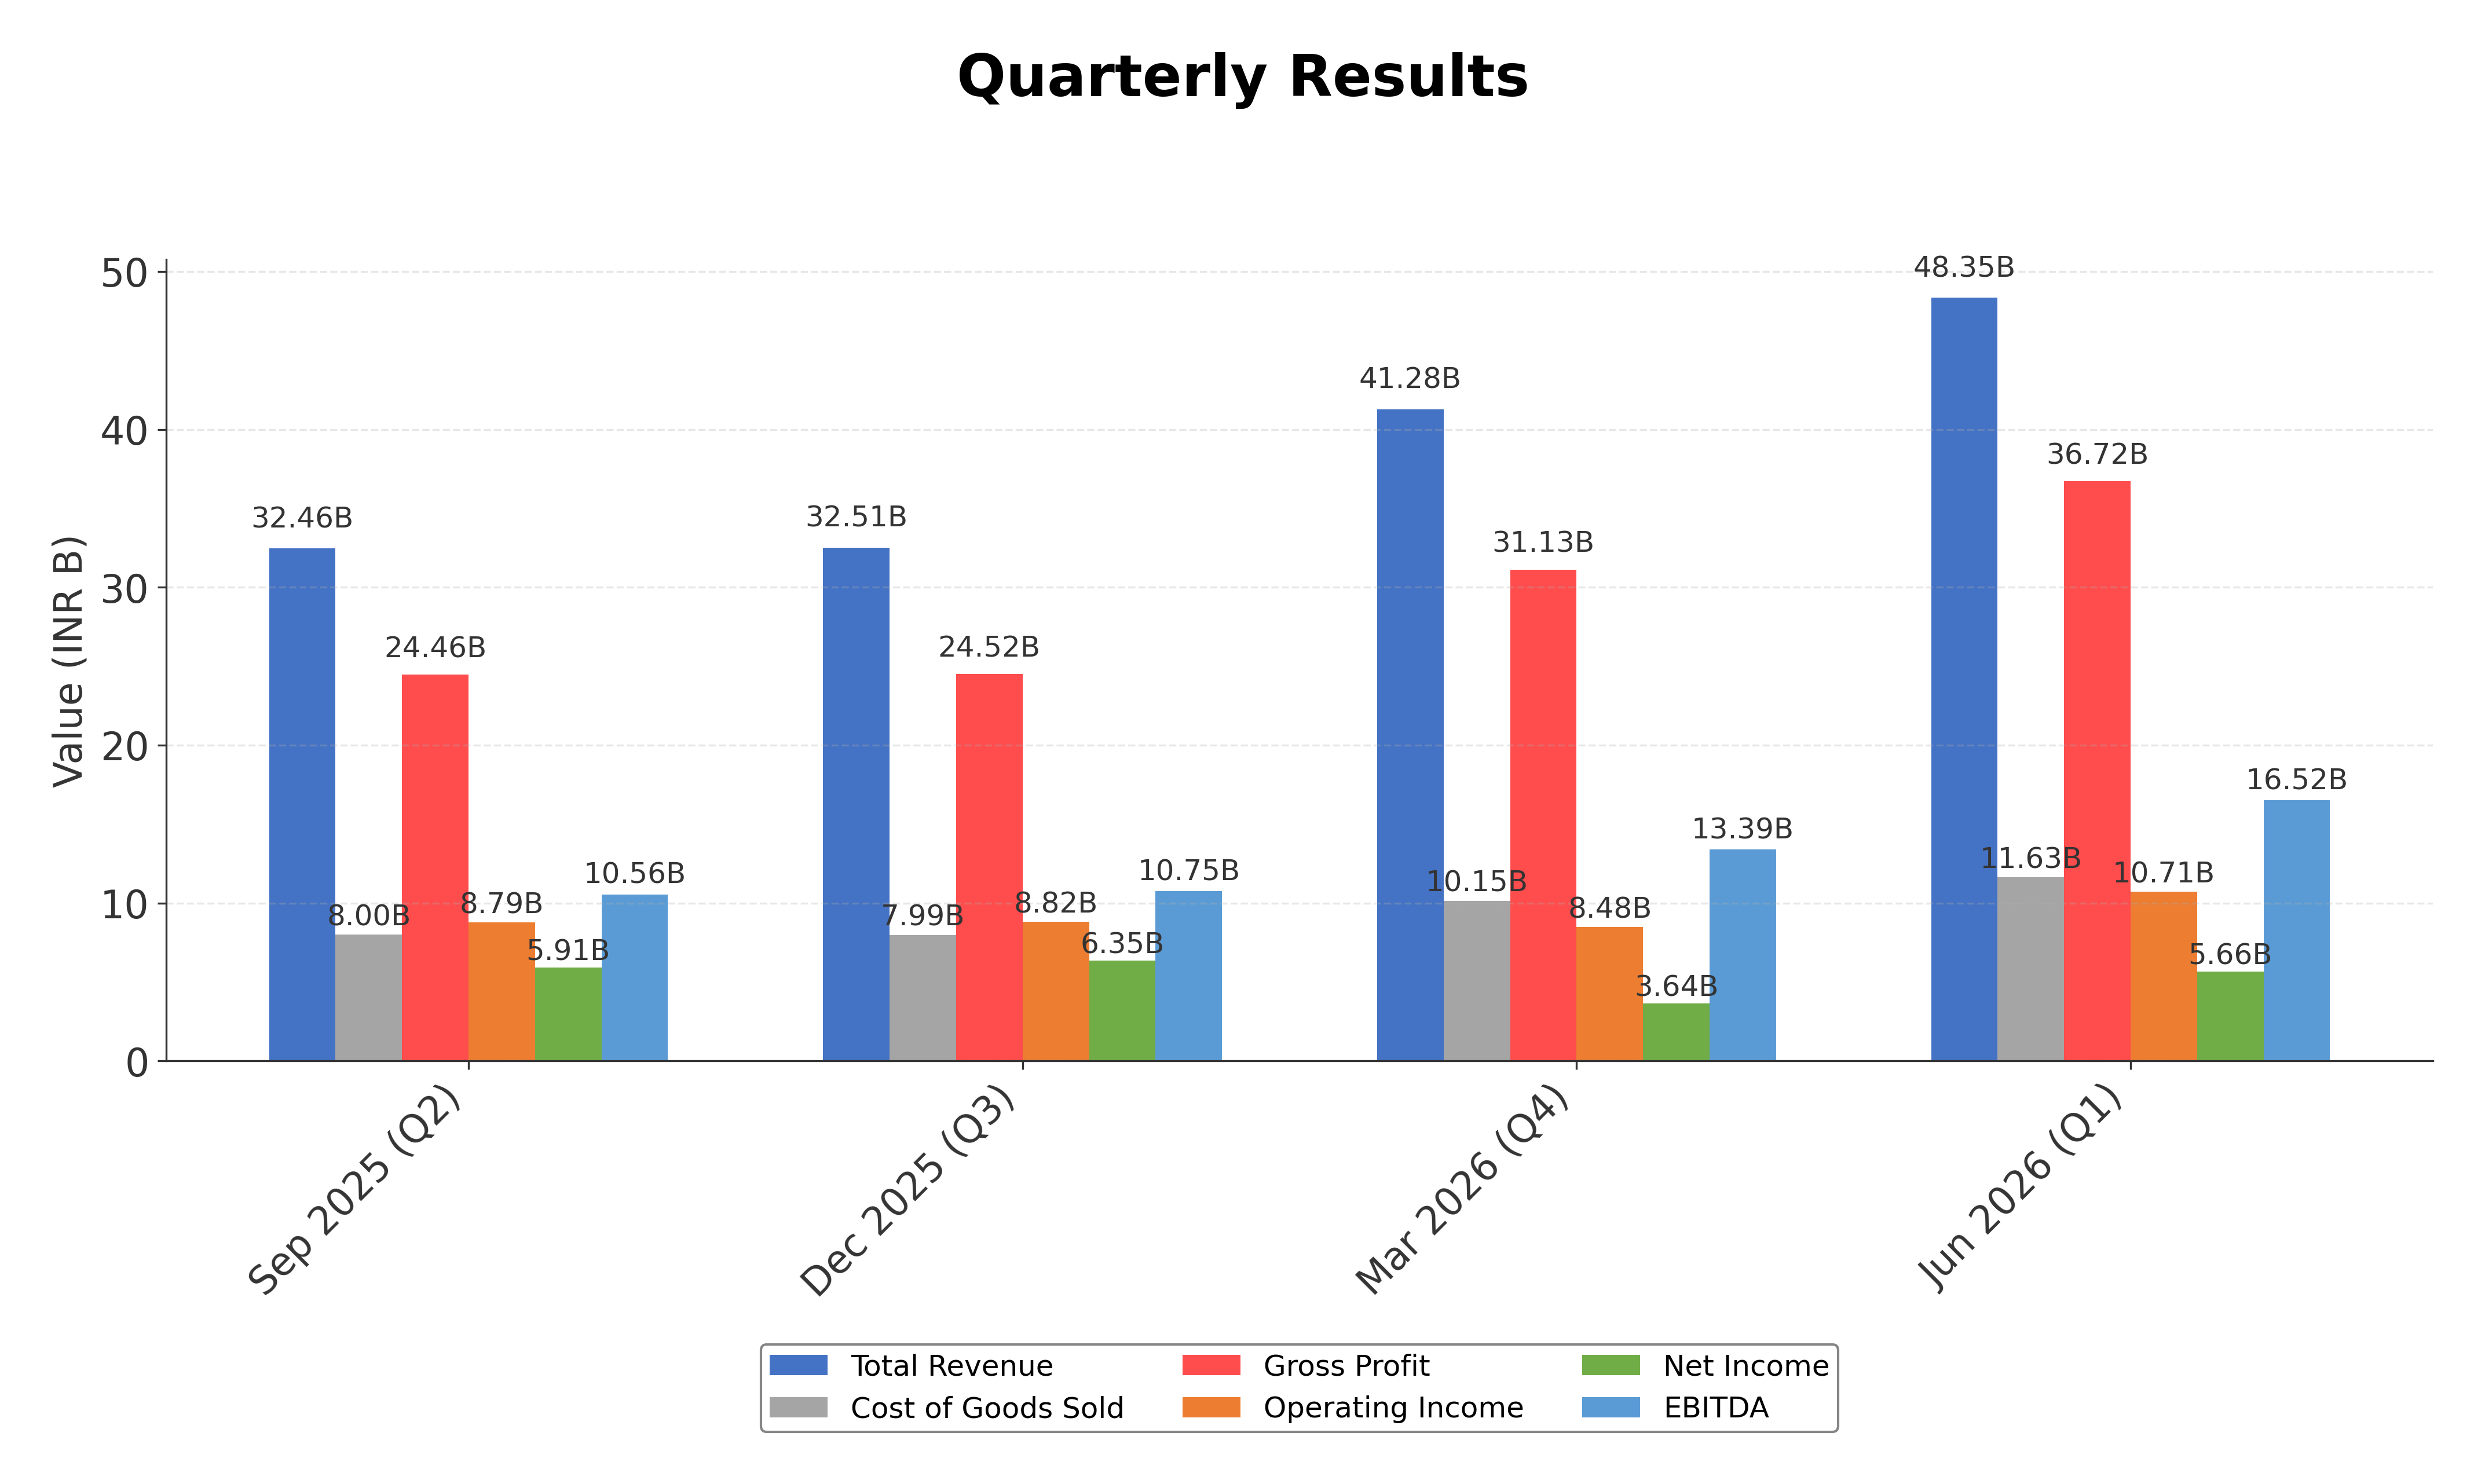
Financials
Peer Analysis
| Company Name | Market Cap | P/E Ratio | P/B Ratio | EV/EBITDA | Price to CFO |
|---|---|---|---|---|---|
| Torrent Pharmaceuticals Ltd. | ₹1.89T | 77.52 | 20.02 | 42.21 | 62.43 |
| Sun Pharmaceutical Industries Ltd. | ₹4.66T | 40.88 | 5.61 | 26.99 | 37.50 |
| Cipla Ltd. | ₹1.14T | 33.79 | 3.31 | 20.19 | 27.00 |
| Lupin Ltd. | ₹1.08T | 20.32 | 4.82 | 13.62 | 14.78 |
| Zydus Lifesciences Ltd. | ₹1.11T | 22.13 | 4.11 | 16.97 | 52.25 |
| Alkem Laboratories Ltd. | ₹687.68B | 30.21 | 4.98 | 23.11 | 35.03 |
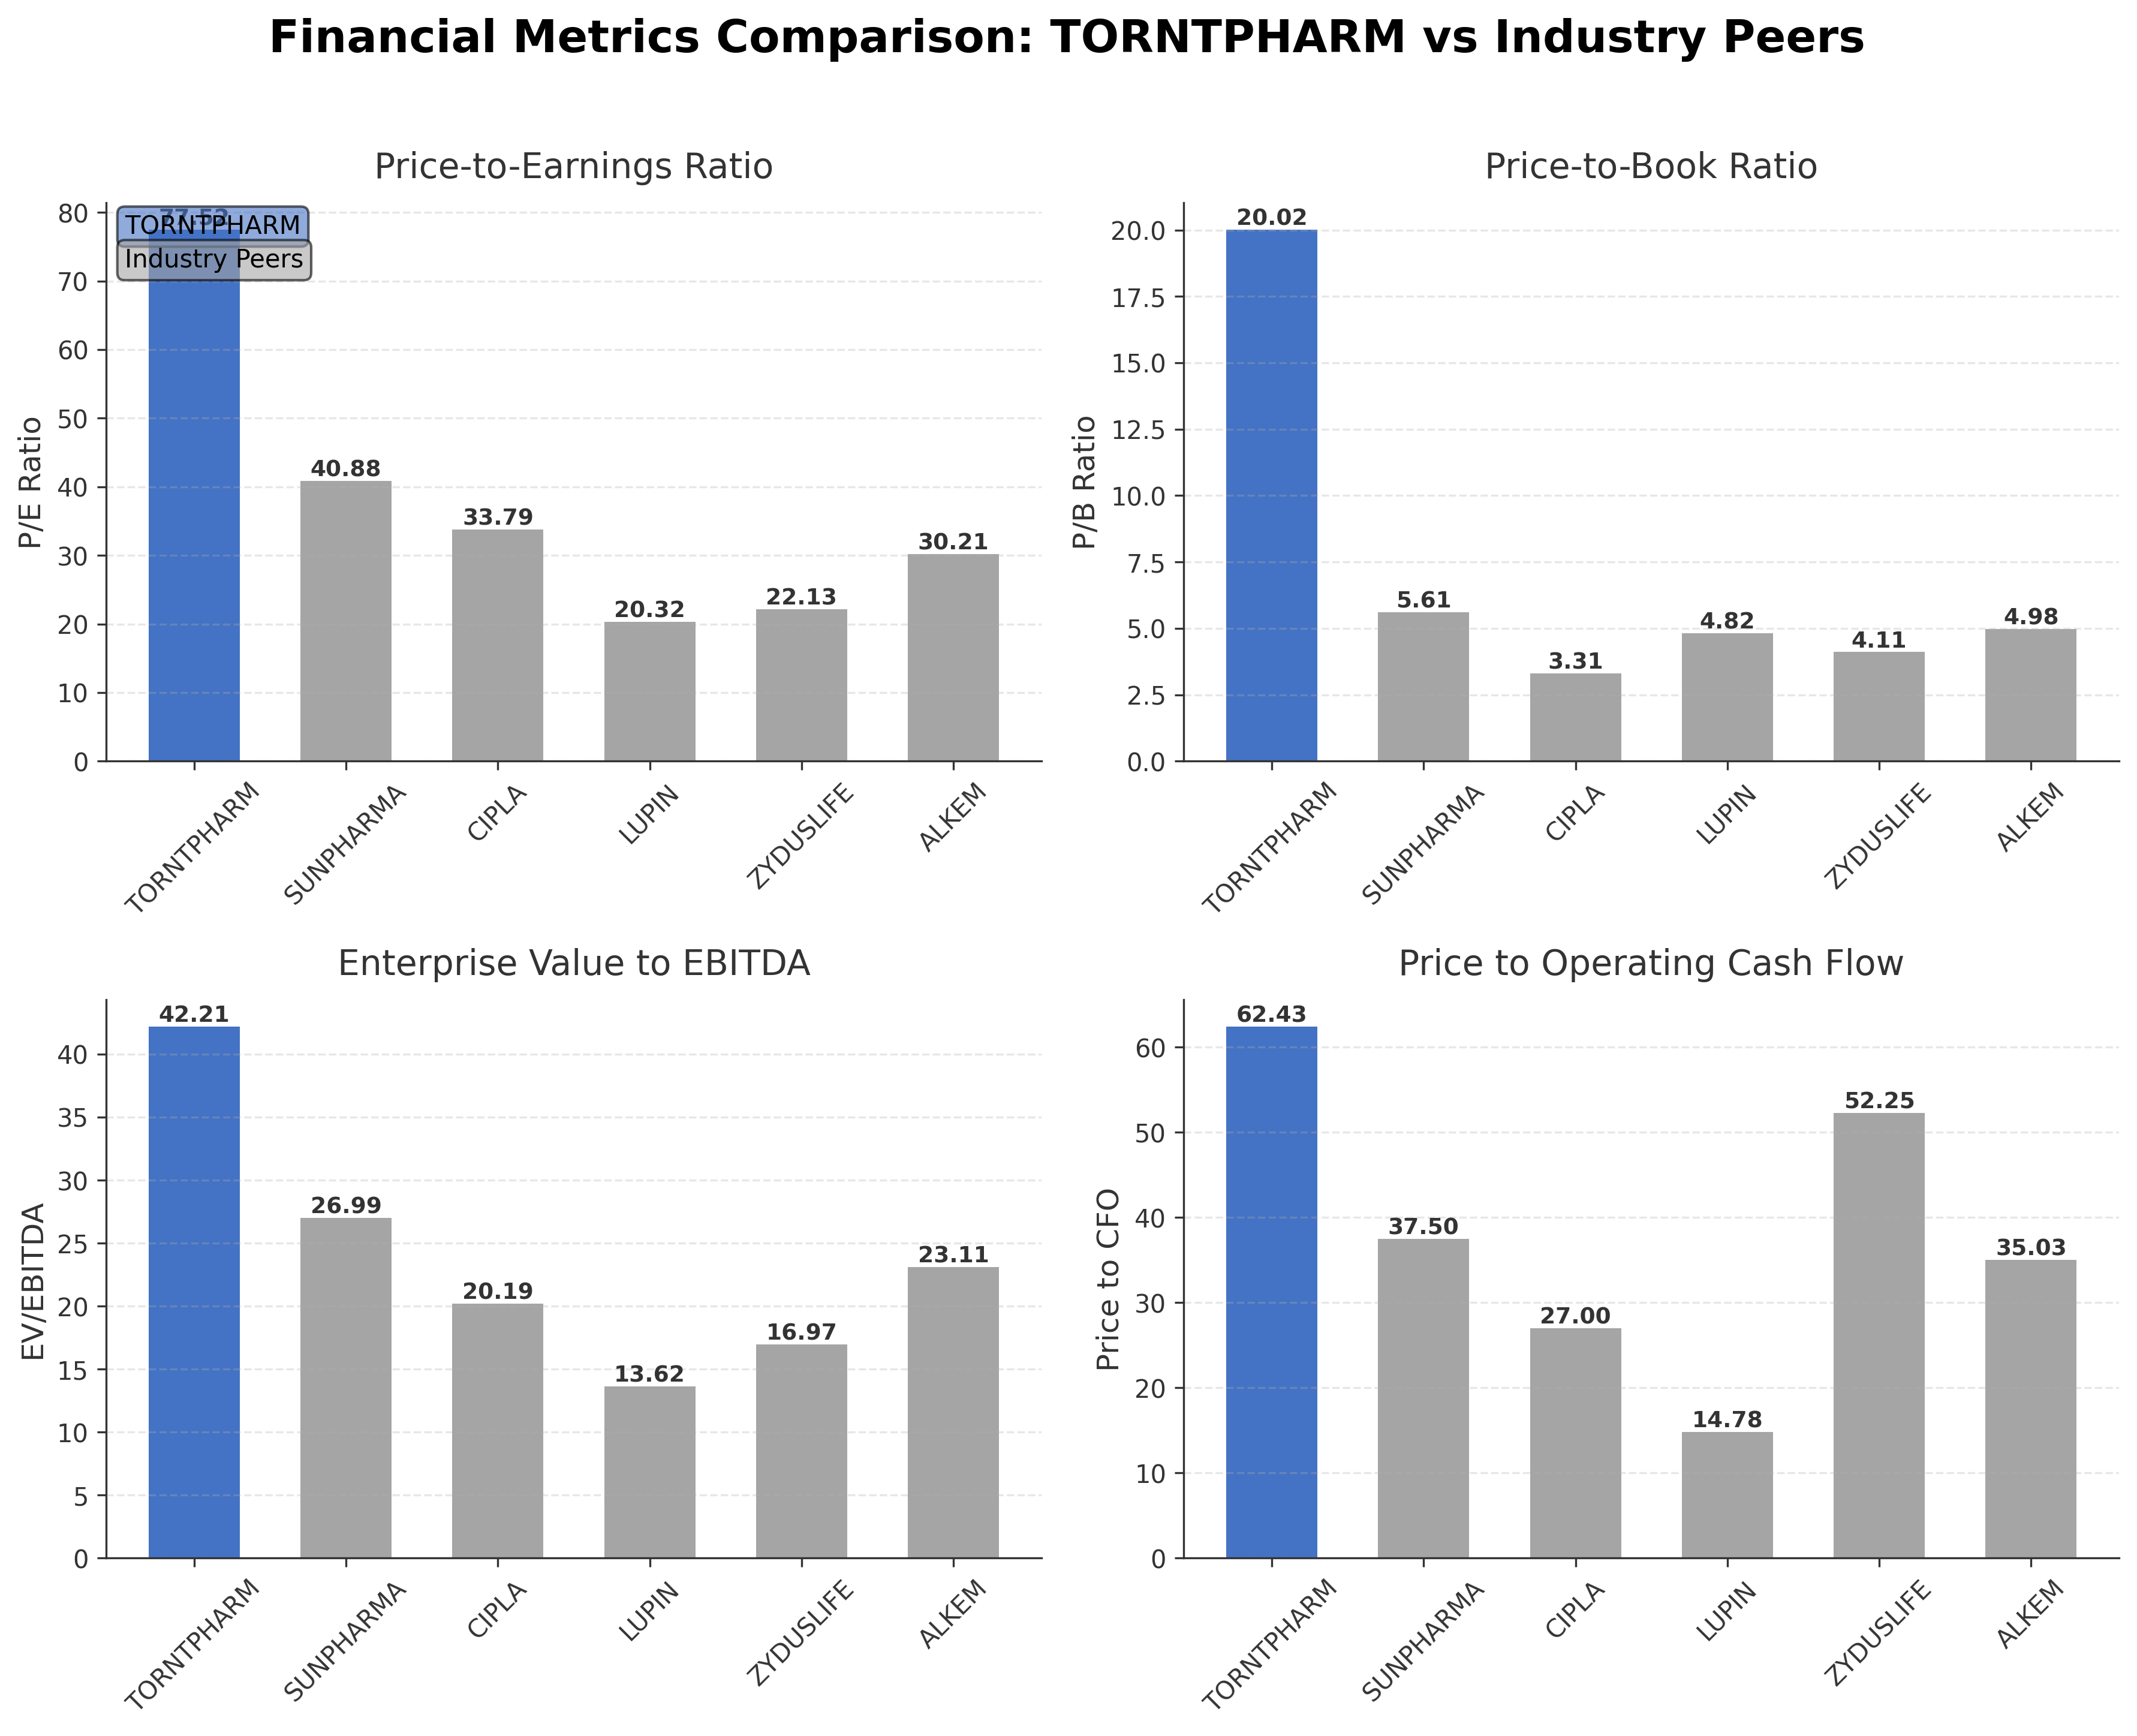
Comparison Analysis: Torrent Pharmaceuticals Ltd. trades at significantly higher valuation multiples compared to its Indian pharmaceutical peers, with a trailing P/E of 77.52 versus peer averages ranging from approximately 20.32 to 40.88. Its price-to-book ratio of 20.02 is also markedly above the peer range of 3.31 to 5.61. Despite this premium, Torrent maintains a competitive return on equity of 16.99%, which is above some peers but below Lupin's 26.91%. The enterprise value to EBITDA multiple of 42.21 is substantially higher than peers, indicating a premium valuation possibly reflecting growth expectations or market positioning. Price to cash flow ratios similarly suggest a higher price relative to operational cash generation. Overall, Torrent stands out for its elevated valuation metrics relative to regional industry competitors.
Financial Metrics Comparison with Peers
Financial Statements
Comprehensive financial data including income, balance sheet, and cash flow metrics
Income Statement
| fiscal_date | 2026-03-31 | 2025-03-31 | 2024-03-31 | 2023-03-31 | 2022-03-31 |
|---|---|---|---|---|---|
| Sales | 137.53B | 113.17B | 105.62B | 94.64B | 84.19B |
| Cost Of Goods | 35.25B | 28.84B | 27.88B | 28.28B | 25.37B |
| Gross Profit | 102.28B | 84.33B | 77.75B | 66.36B | 58.81B |
| Operating Expense Research And Development | 449.50M | 304.20M | 247.30M | 312.70M | 386.50M |
| Operating Expense Selling General And Administrative | 23.92B | 19.99B | 19.02B | 16.41B | 14.40B |
| Operating Expense Other Operating Expenses | 6.50B | 5.69B | 5.63B | 5.13B | 4.45B |
| Operating Income | 34.40B | 29.26B | 25.72B | 21.40B | 17.69B |
| Non Operating Interest Income | 384.30M | 201.90M | 114.80M | 147.80M | 71.50M |
| Non Operating Interest Expense | 3.85B | 2.51B | 3.53B | 3.32B | 2.53B |
| Pretax Income | 28.72B | 26.73B | 23.52B | 18.47B | 12.26B |
| Income Tax | 7.34B | 7.62B | 6.96B | 6.02B | 4.49B |
| Net Income | 21.38B | 19.11B | 16.56B | 12.45B | 7.77B |
| Eps Basic | 63.92 | 56.47 | 48.94 | 36.79 | 22.96 |
| Eps Diluted | 63.92 | 56.47 | 48.94 | 36.79 | 22.96 |
| Basic Shares Outstanding | 338.45M | 338.45M | 338.45M | 338.45M | 338.45M |
| Diluted Shares Outstanding | 338.45M | 338.45M | 338.45M | 338.45M | 338.45M |
| Ebit | 32.57B | 29.24B | 27.05B | 21.79B | 14.79B |
| Ebitda | 44.16B | 37.25B | 34.07B | 28.45B | 26.16B |
| Net Income Continuous Operations | 28.72B | 26.73B | 23.52B | 18.47B | 12.26B |
| Minority Interests | 251.90M | 0.00 | 0.00 | 0.00 | 0.00 |
| Preferred Stock Dividends | 0.00 | 0.00 | 0.00 | 0.00 | 0.00 |
Data provided by Twelve Data
Balance Sheet
| fiscal_date | 2026-03-31 | 2025-03-31 | 2024-03-31 | 2023-03-31 | 2022-03-31 |
|---|---|---|---|---|---|
| Cash And Cash Equivalents | 11.17B | 5.73B | 8.35B | 5.09B | 3.98B |
| Accounts Receivable | 30.31B | 18.66B | 18.44B | 19.44B | 16.32B |
| Total Assets | 443.12B | 149.90B | 150.61B | 150.12B | 131.00B |
| Total Liabilities | 267.27B | 73.99B | 82.04B | 88.14B | 71.47B |
| Long Term Debt | 118.41B | 13.38B | 16.68B | 25.49B | 21.60B |
| Shareholders Equity | 175.85B | 75.91B | 68.56B | 61.98B | 59.53B |
Data provided by Twelve Data
Cash Flow Statement
| fiscal_date | 2026-03-31 | 2025-03-31 | 2024-03-31 | 2023-03-31 | 2022-03-31 |
|---|---|---|---|---|---|
| Operating Activities Net Income | 28.72B | 26.73B | 23.52B | 18.47B | 12.26B |
| Operating Activities Other Non Cash Items | 3.46B | 2.32B | 2.54B | 3.19B | 7.33B |
| Operating Activities Accounts Receivable | -3.63B | -348.00M | 715.40M | -3.09B | -1.13B |
| Operating Activities Other Assets Liabilities | -1.43B | -1.68B | -670.10M | 3.49B | 1.54B |
| Operating Activities Operating Cash Flow | 30.23B | 27.02B | 26.10B | 22.06B | 19.99B |
| Investing Activities Net Acquisitions | -123.15B | N/A | 0.00 | -20.00B | 0.00 |
| Investing Activities Purchase Of Investments | -127.90M | -117.50M | N/A | -603.80M | -347.90M |
| Investing Activities Sale Of Investments | 2.16B | 455.40M | 1.18B | 474.00M | 267.00M |
| Investing Activities Investing Cash Flow | -121.12B | -5.60B | -1.81B | -24.28B | -2.04B |
| Financing Activities Long Term Debt Issuance | 109.90B | N/A | 0.00 | 13.95B | 0.00 |
| Financing Activities Long Term Debt Payments | -6.72B | -9.26B | -12.36B | -9.72B | -10.33B |
| Financing Activities Short Term Debt Issuance | 16.04B | -3.96B | -1.33B | 8.42B | 2.19B |
| Financing Activities Common Dividends | -12.89B | -10.83B | -10.15B | -8.63B | -6.77B |
| Financing Activities Financing Cash Flow | 106.33B | -24.05B | -23.85B | 4.02B | -14.91B |
| End Cash Position | 11.17B | 5.73B | 8.35B | 5.09B | 3.98B |
| Free Cash Flow | 23.45B | 19.73B | 28.33B | 17.94B | 16.00B |
| Investing Activities Capital Expenditures | N/A | -5.94B | -2.99B | -4.15B | -1.96B |
Data provided by Twelve Data
Technical Analysis
Key Insights
- Torrent Pharmaceuticals exhibits a sustained upward trend with price action forming higher highs and higher lows over recent months.
- Key support levels are identified near INR 4,600 and INR 4,200, while resistance is observed around the 52-week high near INR 5,085.
- The stock is trading above its 10-day, 50-day (INR 4,626.54), and 200-day (INR 4,166.99) moving averages, indicating bullish momentum across short to long-term timeframes.
- Momentum indicators show RSI in a moderately overbought zone, MACD remains positive with a bullish crossover, and stochastic oscillators suggest sustained upward momentum.
- Multi-timeframe analysis confirms strength on daily, weekly, and monthly charts, with consistent volume supporting the price advances.
- Current technical setup suggests potential continuation of the upward trend, though overbought conditions warrant monitoring for possible consolidation or pullbacks.
Trending News
1. Headline: Torrent Pharma seeks shareholder approval for Shanti Ekambaram
Summary: Torrent Pharmaceuticals Limited seeks shareholder approval via postal ballot to appoint Shanti Ekambaram as an Independent Director for three years starting July 30, 2026. E-voting runs from August 8 to September 6, 2026. Ms. Ekambaram brings 39 years of financial services experience, including ...
Sentiment: neutral
2. Headline: Torrent Pharmaceuticals Q1 result: Net profit up at 3.3% at ₹566 crore | Company Results - Business Standard
Summary: The company had posted a consolidated net profit of ₹548 crore in the corresponding quarter last fiscal, Torrent Pharmaceuticals Ltd said
Sentiment: positive
Summary: Torrent Pharma Share Price: Find the latest news on Torrent Pharma Stock Price. Get all the information on Torrent Pharma with historic price charts for NSE / BSE. Experts & Broker view also get the Torrent Pharma Ltd. buy/sell tips detailed news, announcements, Forecasts, Analysts, Valuation, ...
Sentiment: neutral
4. Headline: 4,901 Call Contracts Traded on Torrent Pharmaceuticals Ltd. as Stock Nears Rs 5,000 Strike
Summary: On 31 Jul 2026, 4,901 call contracts on Torrent Pharmaceuticals Ltd. changed hands at the Rs 5,000 strike, with the stock closing at Rs 4,932.80. This near-the-money activity coincides with a 1.57% gain in the cash market, signalling a synchronised directional stance between options and underlying ...
Sentiment: positive
5. Headline: Torrent Pharma Q1 Review: Motilal Oswal Sees Strong India, US Growth After Earnings Beat — Check Target Price
Summary: Torrent Pharmaceuticals reported better-than-expected first quarter results with strong domestic sales and US generics growth boosting revenue and profits.
Sentiment: positive
Powered by Brave
Recent Updates
News Summary
As of August 6, 2026. Torrent Pharmaceuticals Limited is in the process of seeking shareholder approval through a postal ballot to appoint Shanti Ekambaram as an Independent Director for a three-year term commencing July 30, 2026. Ms. Ekambaram brings extensive experience of 39 years in financial services, including senior leadership roles at Kotak Mahindra Bank. The e-voting period for this resolution is scheduled from August 8 to September 6, 2026. Additionally, the Q1 2027 earnings call transcript provides insights into the company’s recent financial performance, highlighting revenue growth drivers and strategic initiatives. These developments reflect ongoing governance enhancements and operational focus aimed at sustaining growth momentum.
News Sentiment
The overall sentiment from recent updates is moderately positive, driven primarily by the company’s steady earnings growth and strategic board appointment. The appointment of a seasoned financial expert to the board is viewed as a governance strength, while the Q1 earnings call transcript underscores operational progress and management’s proactive approach. No significant negative news or regulatory challenges were reported in the recent updates, supporting a constructive outlook on corporate governance and financial performance.
Source List
Analytical Overview
Analysis Summary
Torrent Pharmaceuticals’ valuation metrics, including a trailing P/E of 77.52 and forward P/E of 52.80, are significantly higher than industry averages, reflecting elevated market expectations relative to peers. The company’s revenue growth rate of 41.8% quarter-over-quarter and strong cash flow trends, with operating cash flow of INR 30.2 billion and free cash flow of INR 26.0 billion, indicate a robust growth trajectory. Financial health is supported by a current ratio of 1.13 and manageable debt levels with a debt-to-equity ratio of 85.45%, though leverage remains notable. Sector-specific challenges include regulatory scrutiny in global markets and intense competition in generics, while opportunities arise from expanding presence in regulated markets and ongoing R&D investments. Considering India-specific factors, the company benefits from a growing domestic pharmaceutical market and favorable regulatory reforms promoting generics.
Overall Business and Market Assessment
Supporting Factors: strong revenue growth, solid cash flow generation, and a diversified product portfolio with international market exposure
Risk Factors: the high valuation multiples relative to peers and the company’s leverage levels, which could impact financial flexibility
SWOT Analysis
Strengths
- Strong revenue growth with a 41.8% quarterly increase.
- Robust cash flow generation supporting operational needs.
- Diversified product portfolio across multiple therapeutic segments.
- Significant presence in regulated international markets.
Weaknesses
- High valuation multiples compared to industry peers.
- Elevated debt-to-equity ratio at 85.45%.
- Profit margin contraction with a 21.9% year-over-year earnings decline.
- Relatively low dividend yield of 0.77%.
Opportunities
- Expansion in US and European generic markets.
- Increased R&D investment to drive product innovation.
- Favorable regulatory environment in India supporting generics.
- Potential strategic partnerships and board strengthening.
Threats
- Regulatory risks in global pharmaceutical markets.
- Intense competition from other generic drug manufacturers.
- Currency fluctuation impacts on international revenues.
- Pricing pressures in key markets affecting margins.
Company Description
Torrent Pharmaceuticals Ltd. is a leading pharmaceutical company that manufactures, markets, and distributes a diversified range of generic and branded pharmaceutical products. The company's primary function is to develop and supply medicines that cater to various therapeutic segments, including cardiovascular, central nervous system, gastrointestinal, and anti-infective therapeutics. Torrent Pharmaceuticals has established a strong presence in both domestic markets in India and international territories, with significant operations in regulated markets such as the United States and Europe. As part of its business model, Torrent focuses on research and development to drive innovation and ensure a pipeline of new products, while maintaining high standards of quality and compliance. In the global pharmaceutical industry, it plays a critical role in enhancing access to affordable medication, thereby impacting health care systems and patient outcomes worldwide.