

Titan Company Limited (TITAN)
Stock Analysis Report
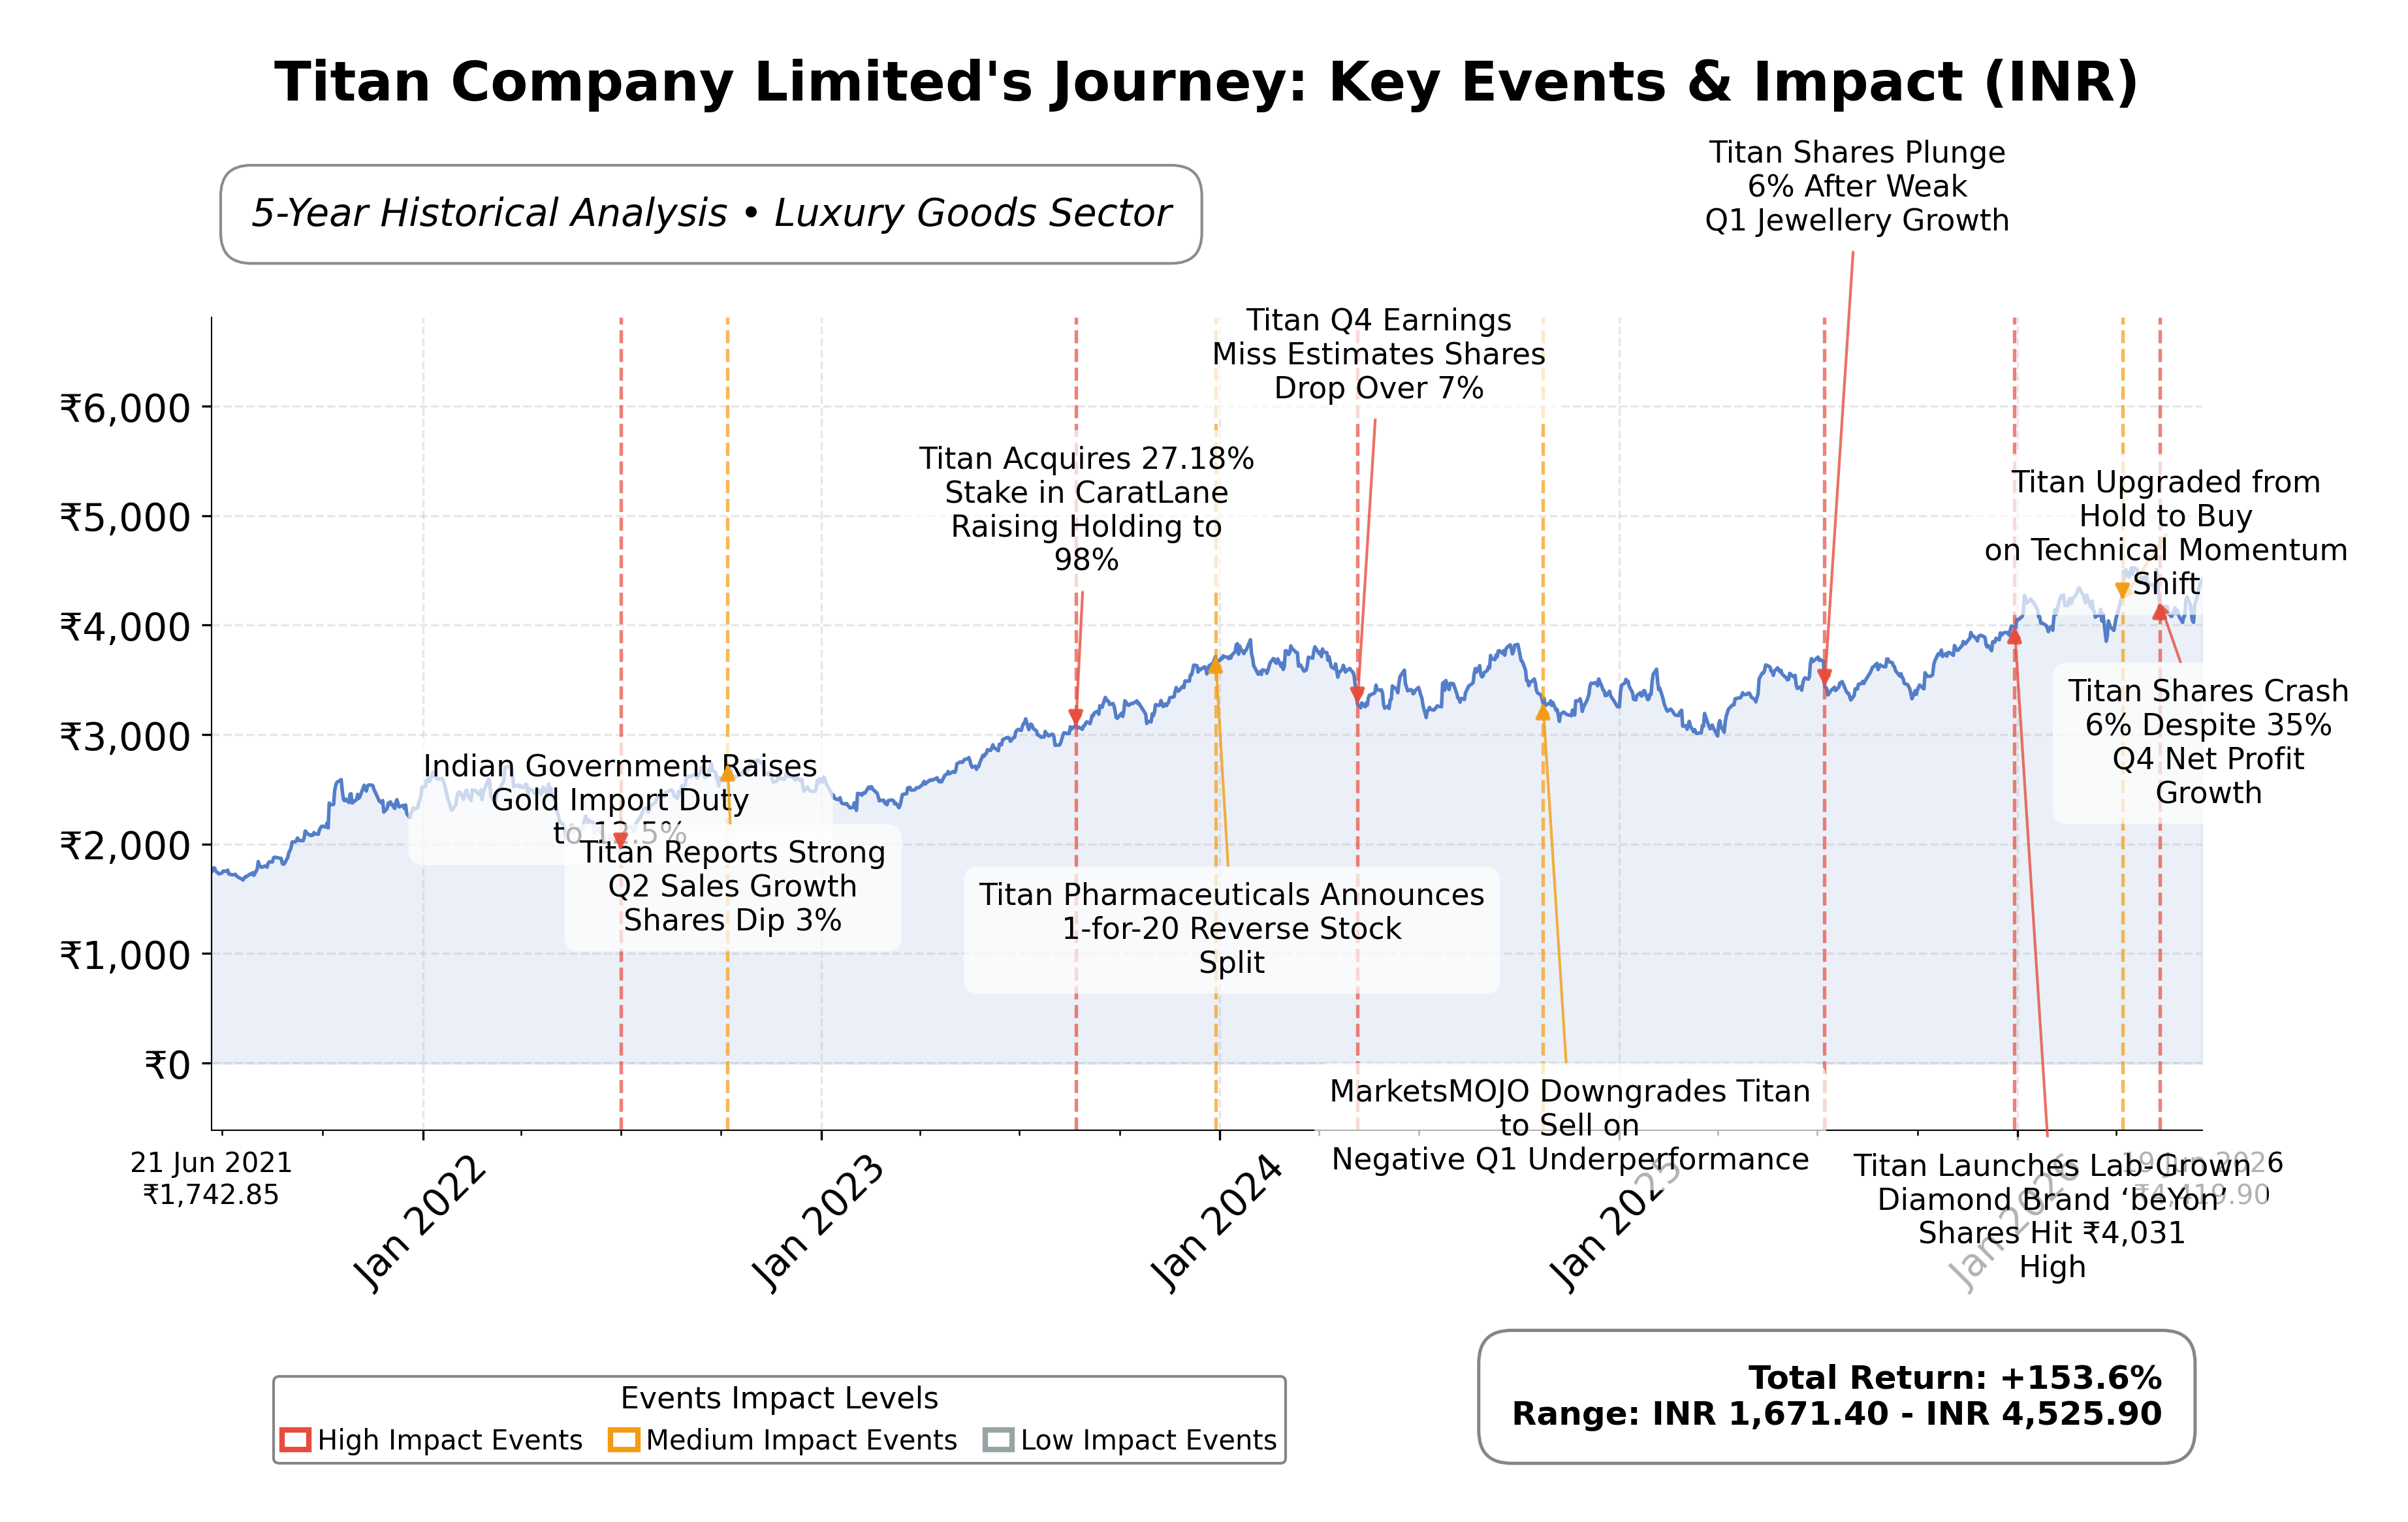
Stock Journey
Key Positives and Key Risks
Pros
- Strong return on equity of 37.13% demonstrates efficient capital use and profitability.
- Robust revenue growth of 80.5% year-over-year indicates strong market demand and expansion.
- Market capitalization of ₹3.92 trillion reflects Titan’s leadership and scale in the luxury goods sector.
Cons
- High debt-to-equity ratio of 195.0 raises concerns about financial leverage and risk.
- Elevated valuation multiples with a trailing P/E of 77.19 and price-to-book of 24.99 suggest stretched pricing.
- Negative levered free cash flow of approximately ₹-65.1 billion indicates cash outflows exceeding inflows, impacting liquidity.
Disclosure: This information is for general awareness and does not constitute investment advice
Report Summary
Titan Company Limited is a prominent Indian lifestyle company specializing in fashion accessories, including jewellery, watches, eyewear, wearables, fragrances, women's bags, and Indian dresswear. Operating primarily on the NSE under the consumer cyclical sector, Titan holds leading market positions with trusted brands such as Tanishq, Titan, Fastrack, Titan Eyeplus, CaratLane, and Taneira. The company leverages an extensive retail network and experiential formats, catering to diverse customer segments with a focus on luxury goods. Founded in 1984 and headquartered in Bangalore, Titan continues to innovate within India's lifestyle market.
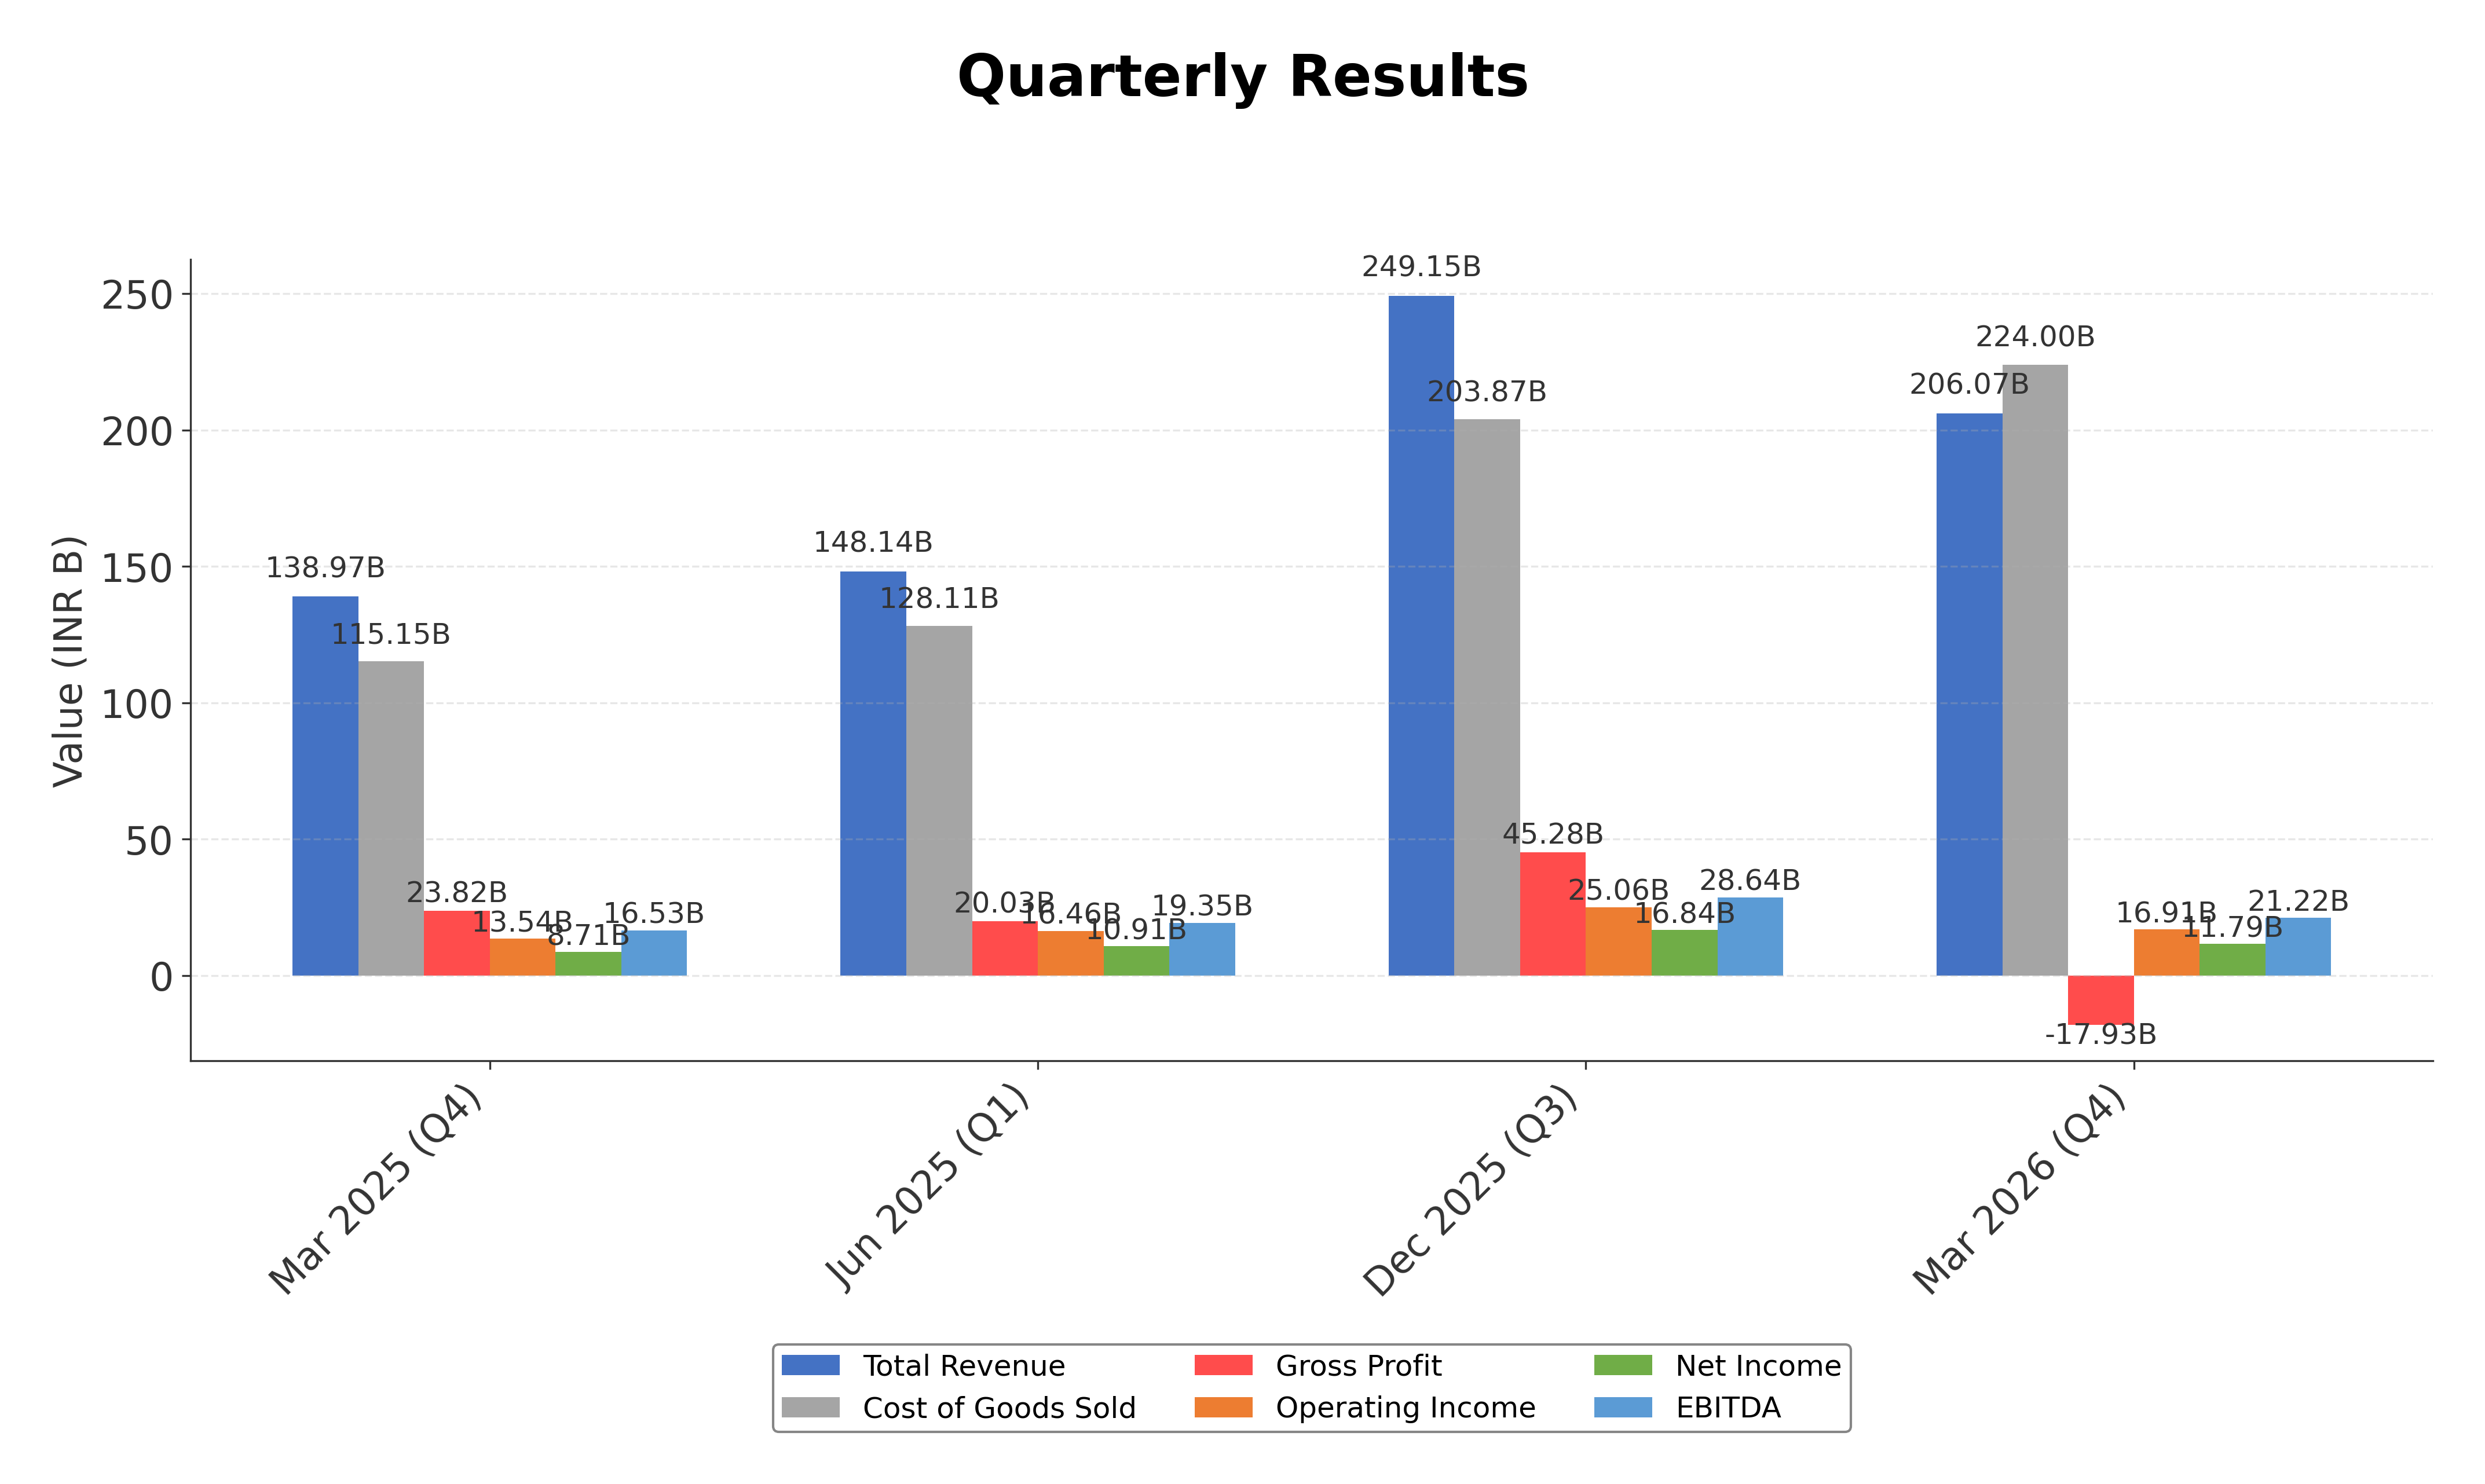
Financially, Titan reported trailing twelve months revenue of approximately ₹875.8 billion with a profit margin of 5.79%, an operating margin of 6.28%, and a negative gross margin of -8.7%, which may reflect inventory or cost adjustments. The company demonstrates strong efficiency with a return on equity (ROE) of 37.13% and return on assets (ROA) of 9.3%, indicating effective capital utilization. Its operating cash flow stands at ₹55.9 billion, although levered free cash flow is negative at approximately ₹-65.1 billion, suggesting capital expenditures or financing activities impacting liquidity.
Valuation metrics show Titan trading at a trailing P/E of 77.19 and a forward P/E of 51.59, with a price-to-book ratio near 25 and an enterprise value to EBITDA multiple of 49.26, all indicating a premium valuation relative to earnings and book value. The stock price is currently ₹4,419.90, within a 52-week range of ₹3,303.10 to ₹4,605.00, reflecting a 20.6% increase over the past year. Market capitalization is approximately ₹3.92 trillion, underscoring its status as a large-cap leader in the luxury goods segment.
Titan's strengths include a dominant market position, strong brand portfolio, and robust return metrics. Key risks involve high valuation multiples, negative gross margin, and elevated debt-to-equity ratio of 195.0, which may affect financial flexibility. Recent strategic actions include maintaining a stable promoter and institutional ownership structure, supporting governance and liquidity. The company’s dividend yield remains modest at 0.25%, with a payout ratio of 19.2%.
Technically, Titan exhibits bullish momentum supported by moving averages and momentum indicators, trading above its 50-day and 200-day moving averages. Recent news highlights positive sentiment around fundamentals and technicals, though valuation remains elevated. Overall, the data suggests a cautious stance with attention to valuation and cash flow dynamics, balancing growth prospects against premium pricing.
Company and Industry Overview
Company Basics
Price Performance
Company Size
Shareholding Pattern
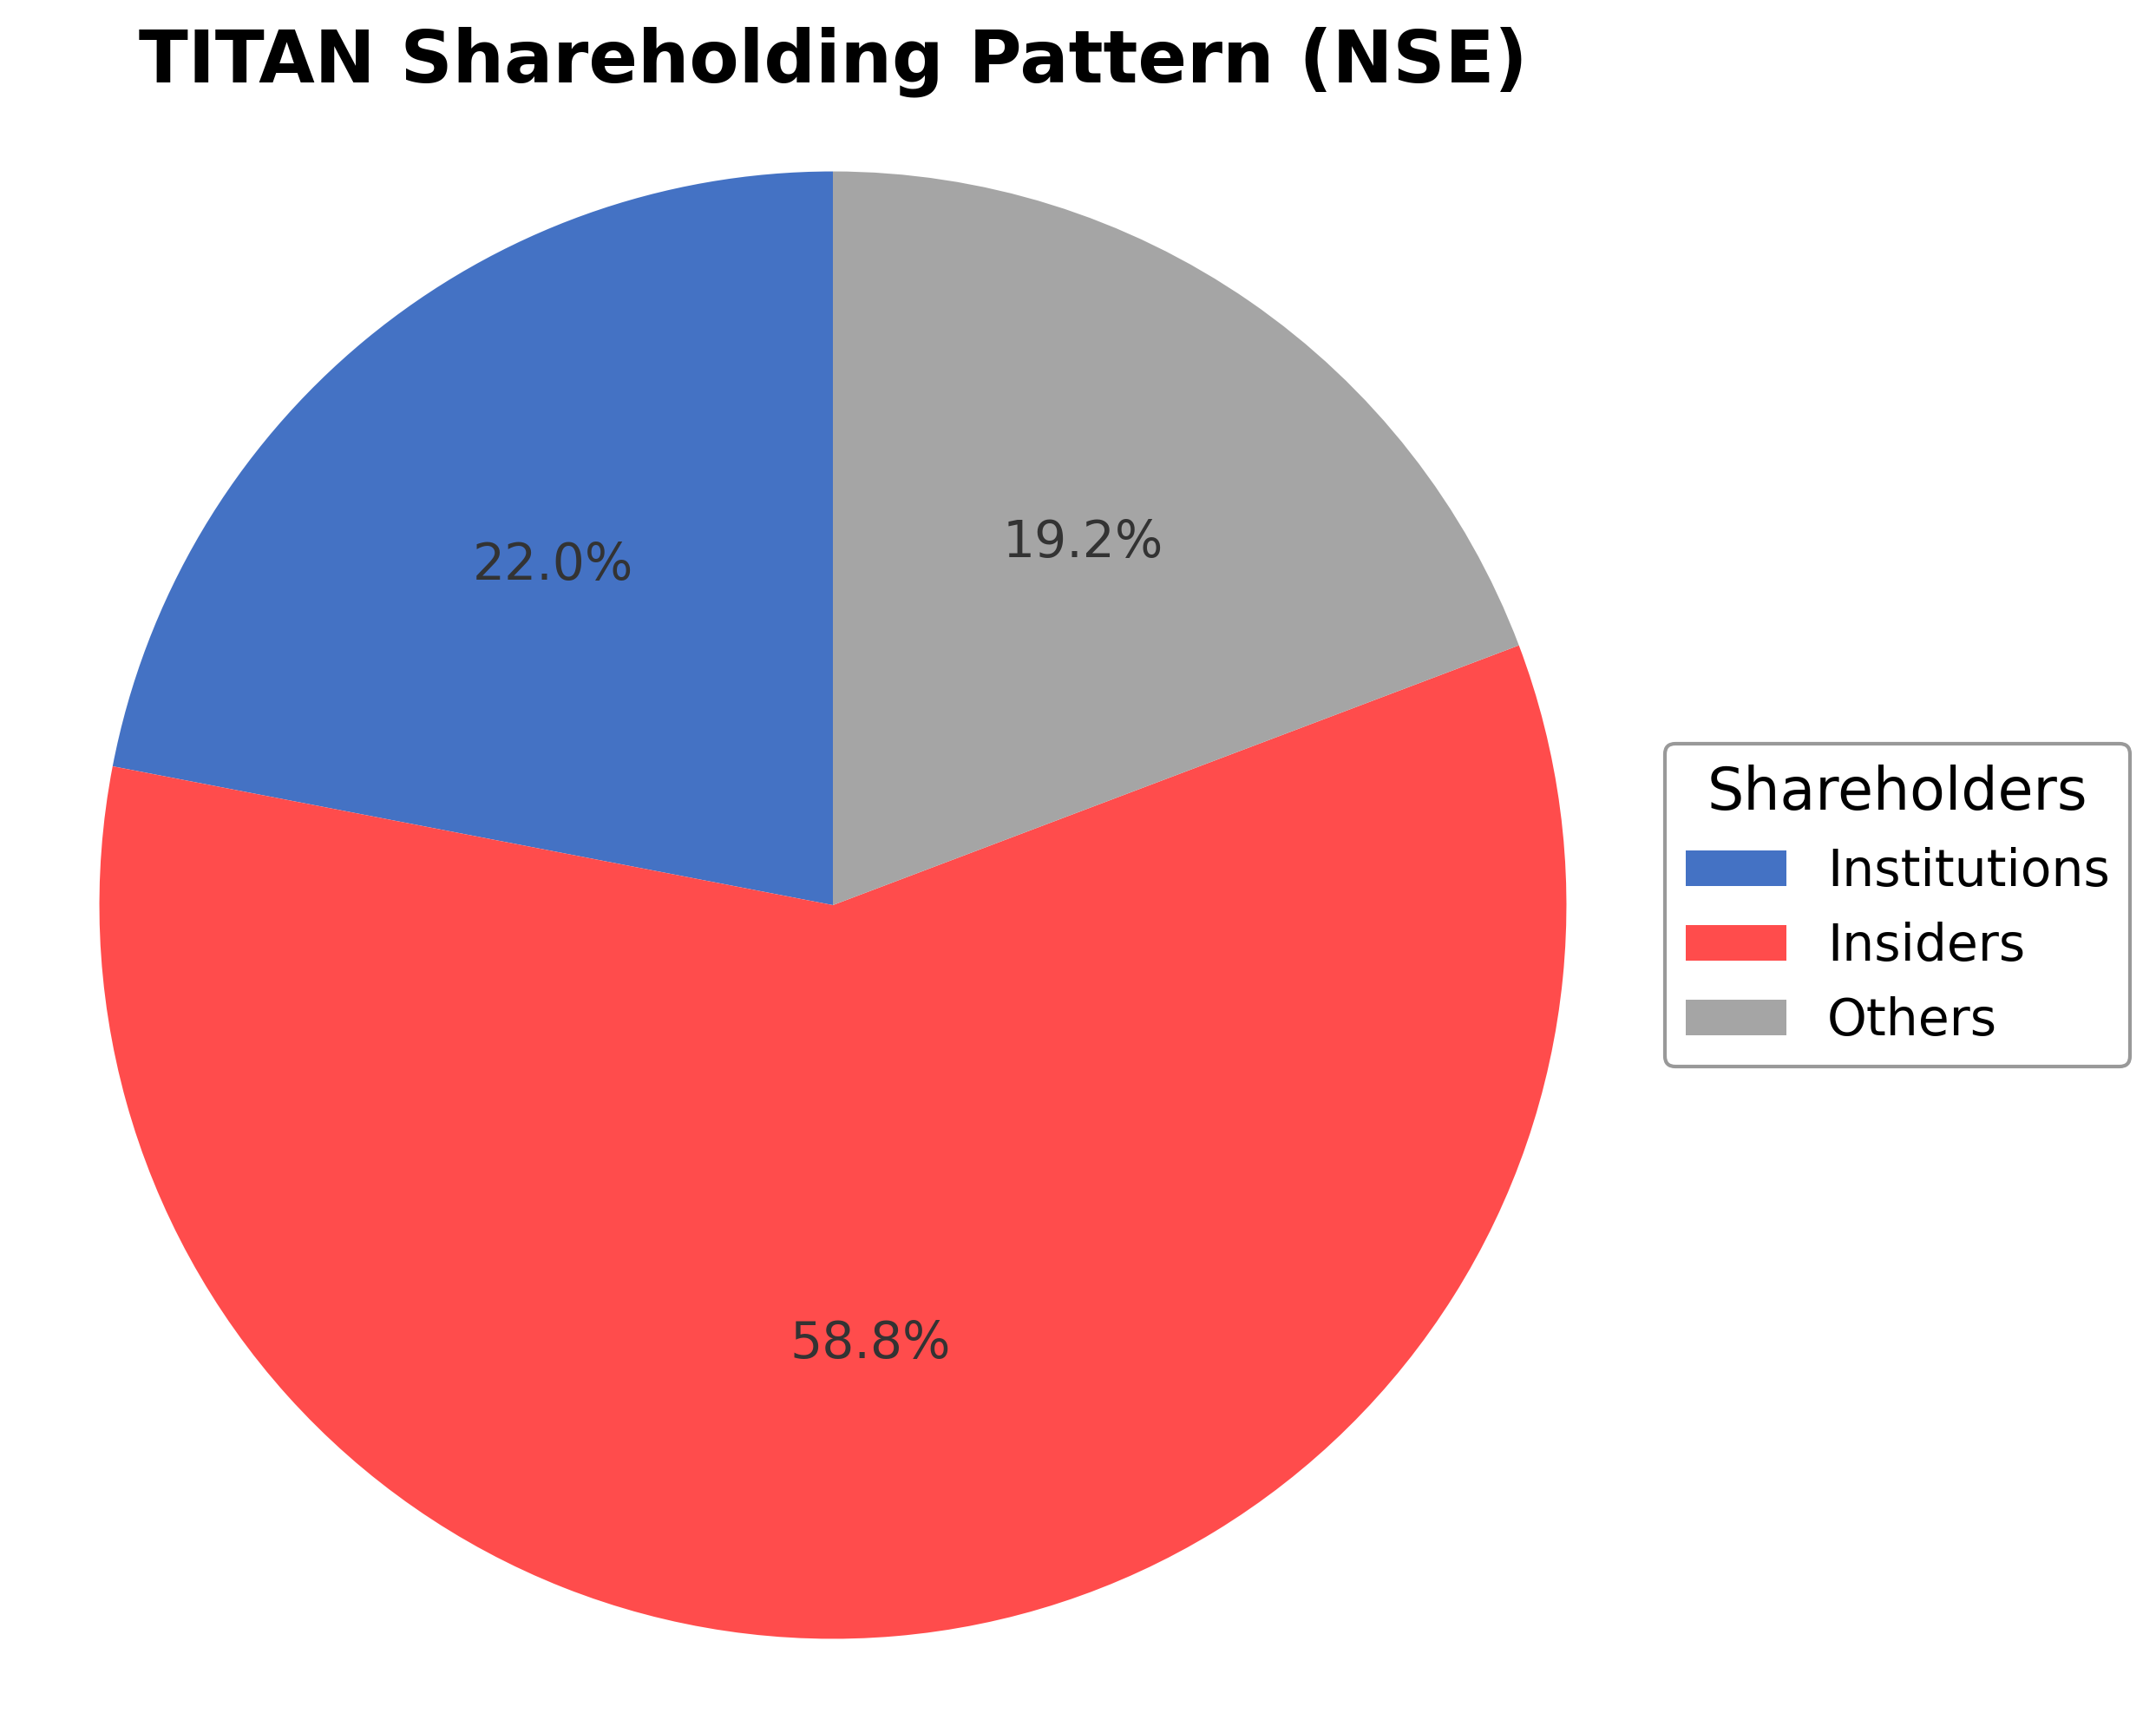
Titan Company Limited's ownership structure is characterized by a dominant promoter stake of 58.79%, primarily held by Tata group entities, ensuring aligned management incentives and strategic control. Institutional investors hold 21.97%, comprising both domestic mutual funds and foreign portfolio investors, reflecting confidence in Titan's market leadership and growth prospects. The remaining 19.24% is held by public shareholders, including retail investors and employee stock plans. Over the past 12-24 months, institutional ownership has remained stable with incremental accumulation by long-term funds, supporting liquidity and governance. This ownership pattern suggests a balanced market sentiment with strong promoter control complemented by diversified institutional participation, which may influence corporate governance and strategic initiatives positively.
Sector and Industry Analysis
The Indian lifestyle retail sector, encompassing jewellery, watches, and eyewear, is a sizable and growing market driven by rising urbanization and increasing consumer spending. Key players include Titan Company Limited, Kalyan Jewellers, Malabar Gold & Diamonds, and Lenskart, each commanding significant market share in their respective segments. The jewellery segment remains the largest contributor to revenue, supported by strong demand for bridal and gifting occasions, while watches and eyewear continue to evolve with changing consumer preferences.
Industry dynamics are shaped by a blend of traditional retail and digital innovation, with companies like Titan leveraging multi-brand portfolios to address diverse consumer segments. Competitive pressures arise from organised chains, regional specialists, and digital-first entrants, particularly in eyewear and watches where smart devices and app-based sales disrupt conventional models. Barriers to entry include brand trust, retail footprint, and supply chain scale, with established players focusing on retail expansion and service quality to maintain market leadership.
The regulatory environment emphasizes hallmarking and consumer protection, especially in the jewellery segment, to ensure transparency and trust in organised retail. Compliance with hallmarking standards is critical for brand credibility and consumer confidence, influencing purchasing decisions in urban and semi-urban markets. Looking ahead, regulatory frameworks are expected to continue supporting organised retail growth while encouraging digital integration and consumer rights protection across lifestyle retail categories.
Note: Analysis synthesized from industry research, market reports, and regulatory filings. Information is subject to change based on market conditions.
Financial Ratios Dashboard
Illustrative Scenario Analysis
DCF Assumptions:
Method: Two-Stage EPS-Priority Model
Financials
Peer Analysis
| Company Name | Market Cap | P/E Ratio | P/B Ratio | EV/EBITDA | Price to CFO |
|---|---|---|---|---|---|
| Titan Company Limited | ₹3.92T | 77.19 | 24.99 | 49.26 | 70.06 |
| Senco Gold Ltd. | ₹54.10B | 9.42 | 2.57 | 8.09 | -6.85 |
| Kalyan Jewellers India Ltd. | ₹396.06B | 29.36 | 6.27 | 19.62 | 30.06 |
| Thanga Mayil Jewellery Ltd. | ₹169.21B | 48.35 | 14.57 | 31.17 | 52.50 |
| Rajesh Exports Ltd. | ₹28.79B | 25.59 | 0.17 | 3.77 | 7.74 |
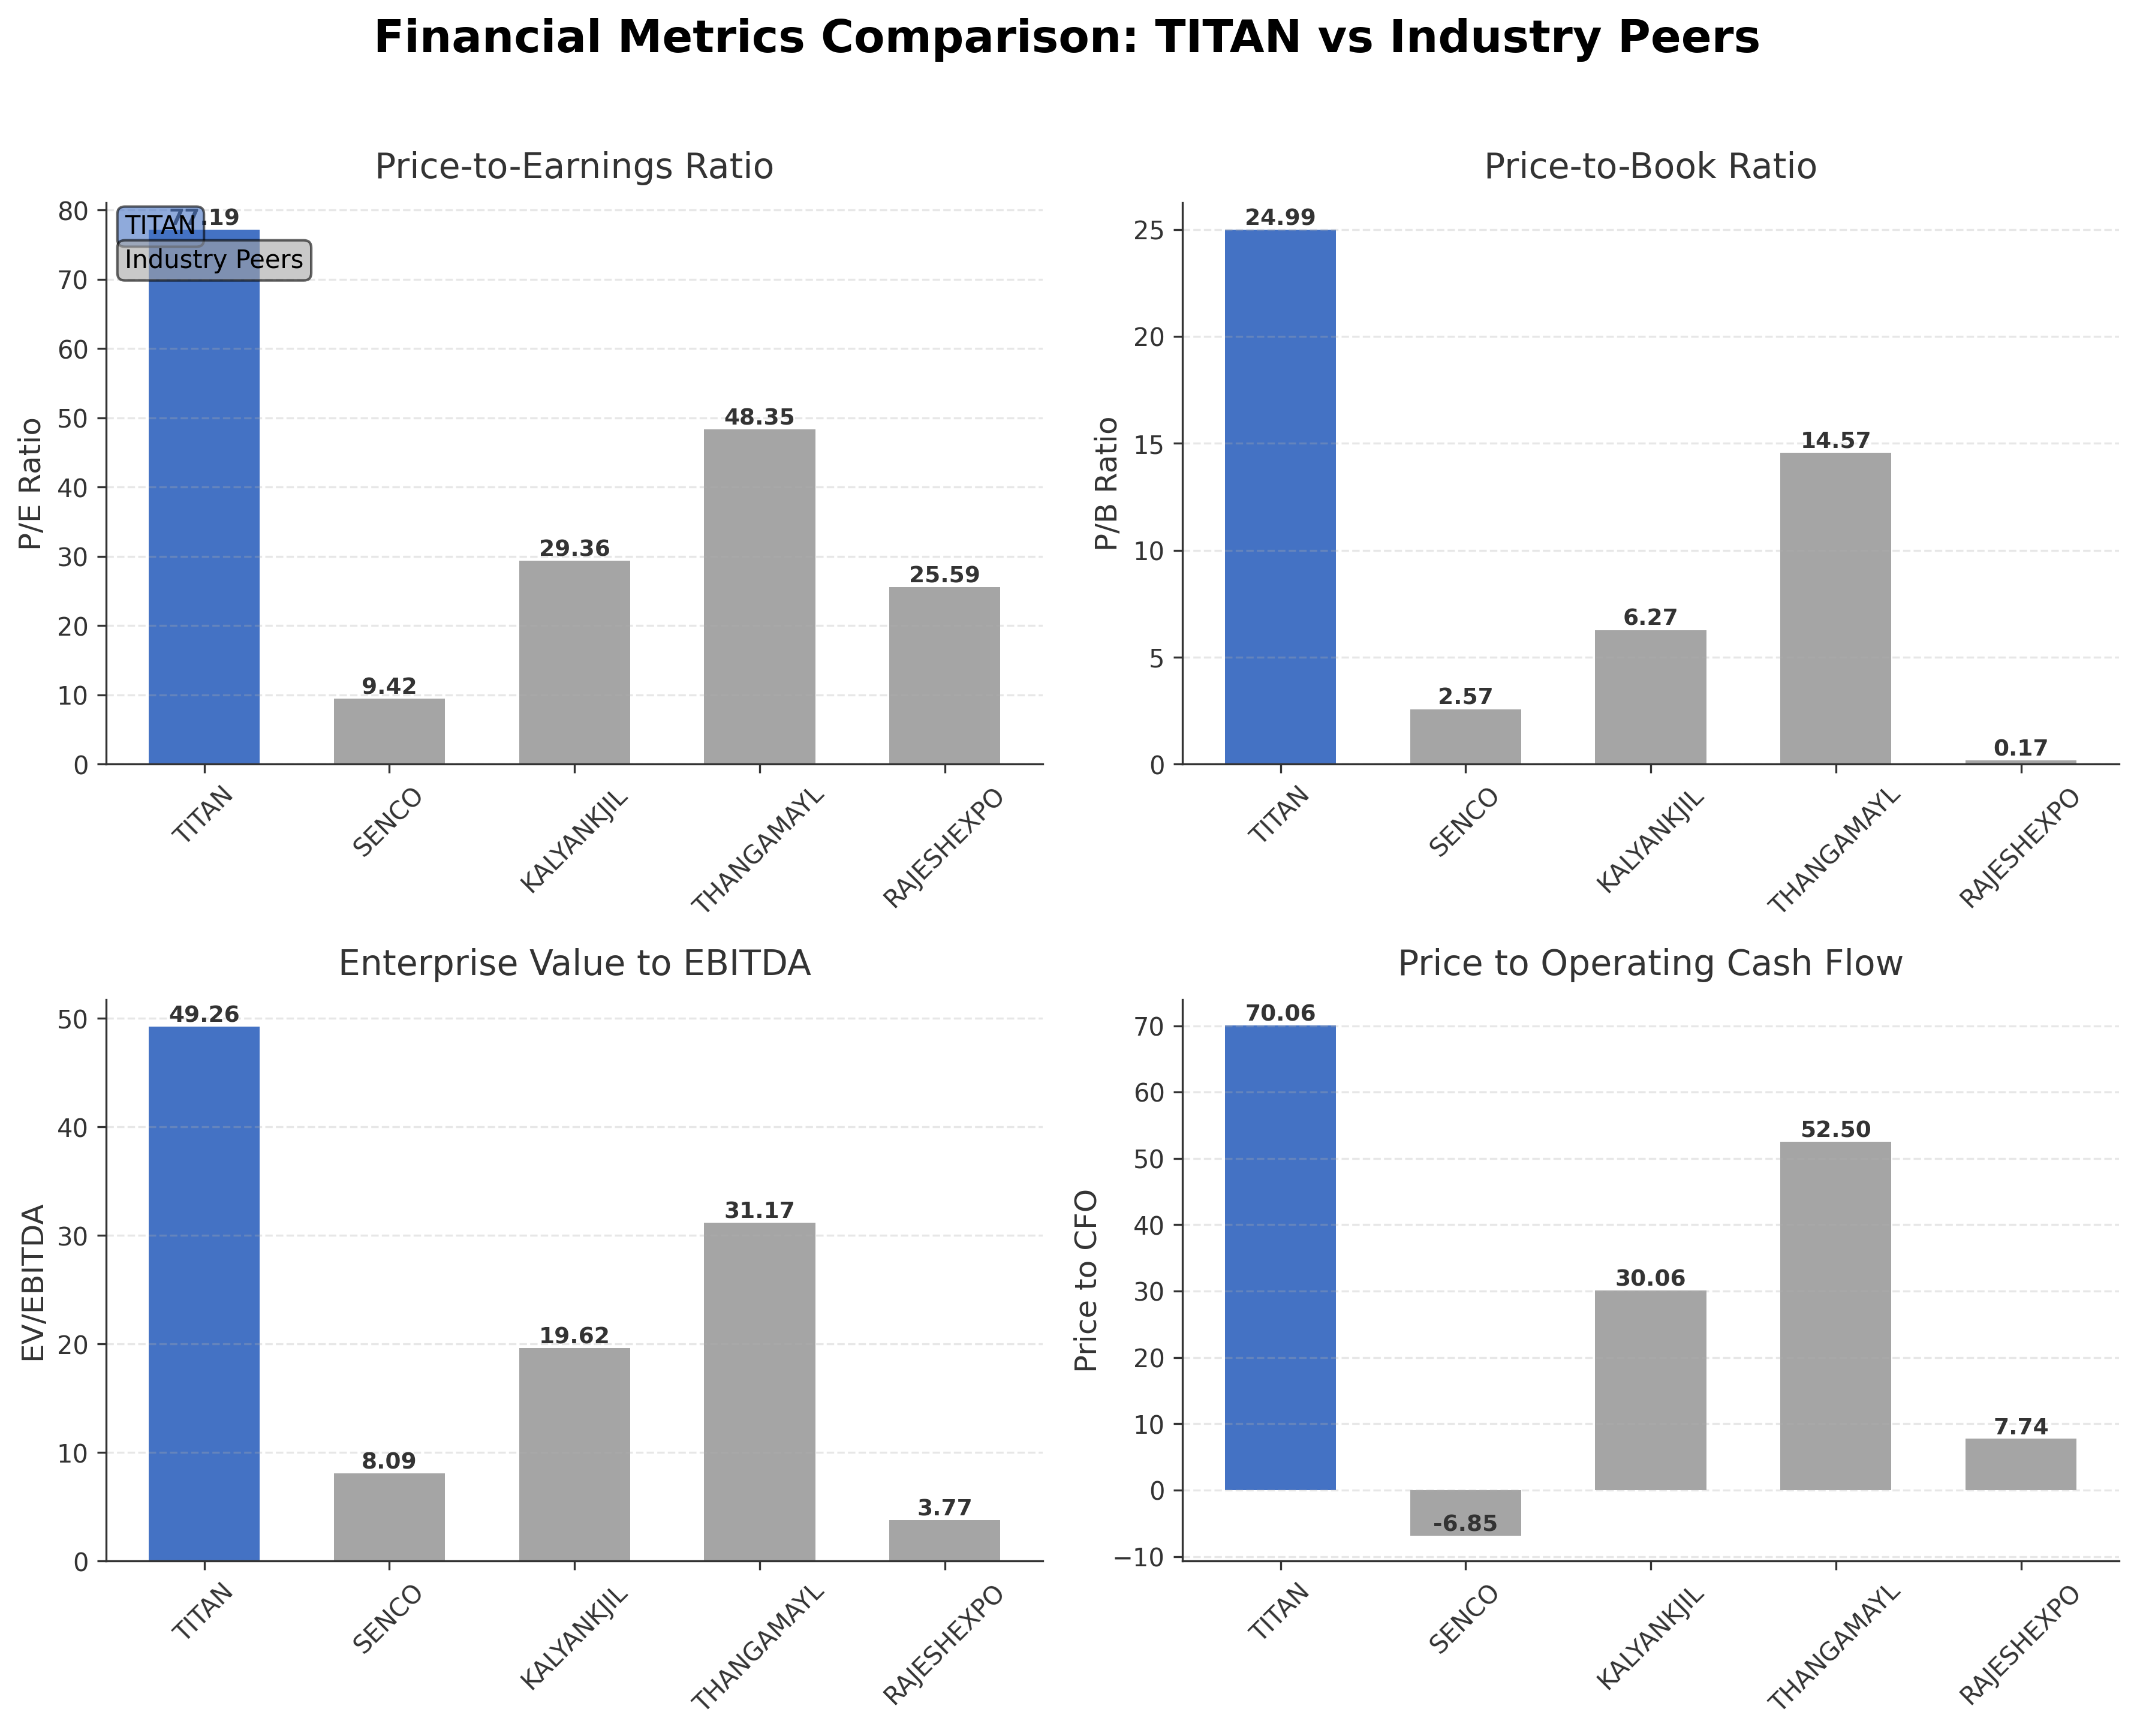
Comparison Analysis: Titan Company Limited stands out among its Indian luxury goods peers with a significantly higher market capitalization of ₹3.92 trillion, reflecting its dominant market position. Its valuation multiples, including a P/E of 77.19 and EV/EBITDA of 49.26, are substantially elevated compared to peers such as Kalyan Jewellers and Senco Gold, indicating a premium pricing relative to earnings and cash flow. Titan also leads in return on equity at 37.13%, surpassing competitors who range between 0.68% and 27.93%, demonstrating superior profitability. However, its price-to-cash-flow ratio of 70.06 is notably higher than peers, suggesting stretched valuation on cash generation metrics. Overall, Titan exhibits leadership in scale and profitability but trades at a premium relative to its industry peers.
Financial Metrics Comparison with Peers
Financial Statements
Comprehensive financial data including income, balance sheet, and cash flow metrics
Income Statement
| fiscal_date | 2026-03-31 | 2025-03-31 | 2024-03-31 | 2023-03-31 | 2022-03-31 |
|---|---|---|---|---|---|
| Sales | 767.97B | 571.43B | 509.36B | 404.47B | 287.36B |
| Cost Of Goods | 703.07B | 474.56B | 394.89B | 304.11B | 216.85B |
| Gross Profit | 64.90B | 96.87B | 114.47B | 100.36B | 70.51B |
| Operating Expense Selling General And Administrative | 15.35B | 13.08B | 30.74B | 25.75B | 16.54B |
| Operating Expense Other Operating Expenses | 47.06B | 38.42B | 11.17B | 8.52B | 6.30B |
| Operating Income | 75.29B | 50.01B | 47.23B | 44.80B | 29.71B |
| Non Operating Interest Expense | 11.80B | 9.53B | 6.19B | 3.00B | 2.18B |
| Pretax Income | 68.01B | 45.35B | 46.23B | 44.47B | 29.04B |
| Income Tax | 17.28B | 11.98B | 11.27B | 11.73B | 7.06B |
| Net Income | 50.73B | 33.37B | 34.96B | 32.74B | 21.98B |
| Eps Basic | 57.19 | 37.62 | 39.40 | 36.61 | 24.48 |
| Eps Diluted | 57.19 | 37.61 | 39.38 | 36.61 | 24.48 |
| Basic Shares Outstanding | 887.04M | 887.03M | 887.40M | 887.79M | 887.79M |
| Diluted Shares Outstanding | 887.04M | 887.03M | 887.40M | 887.79M | 887.79M |
| Ebit | 79.81B | 54.88B | 52.42B | 47.47B | 31.22B |
| Ebitda | 89.08B | 61.81B | 55.57B | 50.65B | 34.66B |
| Net Income Continuous Operations | 68.01B | 45.35B | 46.23B | 44.47B | 29.04B |
| Minority Interests | 0.00 | 0.00 | 0.00 | -240.00M | -250.00M |
| Preferred Stock Dividends | 0.00 | 0.00 | 0.00 | 0.00 | 0.00 |
| Non Operating Interest Income | N/A | 3.01B | 2.49B | 1.43B | 960.00M |
Data provided by Twelve Data
Balance Sheet
| fiscal_date | 2026-03-31 | 2025-03-31 | 2024-03-31 | 2023-03-31 | 2022-03-31 |
|---|---|---|---|---|---|
| Cash And Cash Equivalents | 8.73B | 4.07B | 4.09B | 2.32B | 2.19B |
| Accounts Receivable | 9.16B | 10.68B | 10.18B | 6.74B | 5.65B |
| Total Assets | 605.61B | 406.47B | 315.50B | 270.23B | 211.94B |
| Total Liabilities | 448.58B | 290.23B | 221.57B | 151.19B | 118.61B |
| Long Term Debt | 28.05B | 29.13B | 53.34B | 16.07B | 11.40B |
| Shareholders Equity | 157.03B | 116.24B | 93.93B | 119.04B | 93.33B |
Data provided by Twelve Data
Cash Flow Statement
| fiscal_date | 2026-03-31 | 2025-03-31 | 2024-03-31 | 2023-03-31 | 2022-03-31 |
|---|---|---|---|---|---|
| Operating Activities Net Income | 68.01B | 45.35B | 46.23B | 44.47B | 29.04B |
| Operating Activities Stock Based Compensation | 780.00M | 130.00M | 480.00M | 10.00M | 20.00M |
| Operating Activities Other Non Cash Items | 8.79B | 6.56B | 3.42B | 1.41B | 880.00M |
| Operating Activities Accounts Receivable | 75.06B | 23.77B | -3.27B | -2.29B | 9.78B |
| Operating Activities Other Assets Liabilities | -91.42B | -82.19B | -24.00B | -21.64B | -47.61B |
| Operating Activities Operating Cash Flow | 61.22B | -6.38B | 22.86B | 21.96B | -7.89B |
| Investing Activities Capital Expenditures | -8.77B | -4.70B | -6.71B | -4.20B | -2.16B |
| Investing Activities Net Acquisitions | -11.71B | 0.00 | N/A | 0.00 | 0.00 |
| Investing Activities Purchase Of Investments | -279.58B | -180.58B | -4.31B | -21.04B | -23.22B |
| Investing Activities Sale Of Investments | 262.35B | 186.54B | 7.43B | 2.43B | 36.20B |
| Investing Activities Other Investing Activity | 2.10B | 1.32B | 640.00M | 300.00M | 260.00M |
| Investing Activities Investing Cash Flow | -35.61B | 2.58B | -2.95B | -22.51B | 11.08B |
| Financing Activities Long Term Debt Issuance | 0.00 | 700.00M | 33.01B | 0.00 | 3.49B |
| Financing Activities Long Term Debt Payments | -26.32B | -3.78B | 0.00 | -70.00M | -70.00M |
| Financing Activities Short Term Debt Issuance | 33.14B | 25.29B | 23.28B | 16.84B | 3.49B |
| Financing Activities Common Stock Repurchase | 0.00 | -60.00M | -2.36B | 0.00 | N/A |
| Financing Activities Common Dividends | -9.76B | -9.76B | -8.88B | -6.66B | -3.55B |
| Financing Activities Financing Cash Flow | -2.94B | 12.31B | -3.92B | 10.11B | 3.36B |
| End Cash Position | 8.73B | 4.07B | 4.09B | 2.32B | 2.19B |
| Free Cash Flow | 46.88B | -10.35B | 10.04B | 9.38B | -9.48B |
| Financing Activities Common Stock Issuance | N/A | 0.00 | -2.01B | 0.00 | N/A |
| Financing Activities Other Financing Charges | N/A | -80.00M | -46.96B | N/A | N/A |
Data provided by Twelve Data
Technical Analysis
Key Insights
- Titan Company Limited is currently in a bullish trend with price action showing consistent higher highs and higher lows over recent months.
- Key support levels are identified near ₹4,000 and ₹3,800, while resistance is observed around the 52-week high of ₹4,605.
- The stock price is trading above its 10-day (approx. ₹4,400), 50-day (₹4,272), and 200-day (₹4,016) moving averages, indicating positive momentum across short to long-term timeframes.
- Momentum indicators show RSI in the mid-60s, suggesting moderate strength without overbought conditions; MACD is positive with a bullish crossover; Stochastic oscillator confirms upward momentum.
- Multi-timeframe analysis reveals daily and weekly charts supporting a sustained uptrend, while monthly charts indicate a longer-term bullish bias with occasional consolidation phases.
- Potential market scenarios include continuation of the upward trend if support levels hold, with possible short-term pullbacks near resistance; failure of support could signal consolidation or correction.
Trending News
1. Headline: Is Titan America SA (TTAM) A Good Stock To Buy Now?
Summary: Is TTAM a good stock to buy? We came across a bullish thesis on Titan America SA on Karst Research’s Substack. In this article, we will summarize the bulls’ thesis on TTAM. Titan America SA’s share was trading at $17.59 as of June 17th. TTAM’s trailing P/E was 17.27 according to Yahoo ...
Sentiment: positive
2. Headline: DBGI says 9.6M cash warrants expired | DBGI Stock News
Summary: The company also canceled 7.1 million pre-funded warrants on June 15, bringing total dilution overhang removed to 16.7 million in three days.
Sentiment: positive
3. Headline: Tianci closes $4.9M public offering | CIIT Stock News
Summary: The logistics firm sold 6,055,000 units at $0.81 each. Net proceeds will fund working capital, product development and capacity expansion.
Sentiment: neutral
Summary: Titan Company Share Price: Find the latest news on Titan Company Stock Price. Get all the information on Titan Company with historic price charts for NSE / BSE. Experts & Broker view also get the Titan Company Ltd. buy/sell tips detailed news, announcements, Forecasts, Analysts, Valuation, ...
Sentiment: neutral
5. Headline: Titan Company Ltd Upgraded to Strong Buy on Robust Fundamentals and Technicals
Summary: Finally, technical indicators have ... in the stock price. Investors looking for a large-cap gem in the Gems, Jewellery and Watches sector with a proven track record of growth, solid fundamentals, and favourable technicals will find Titan Company Ltd a compelling proposition. The comprehensive upgrade reflects confidence in the company’s ability to continue delivering value in the medium to long term. Get 33% Off on our 1 Year Plan - Limited Period ...
Sentiment: positive
Powered by Brave
Recent Updates
News Summary
As of June 21, 2026. Titan Company Limited continues to demonstrate strong market positioning supported by a concentrated promoter ownership of 58.79%, primarily held by Tata group entities, alongside significant institutional holdings of 21.97%. This ownership structure underpins stable governance and trading liquidity. Financially, Titan reported robust revenue growth of 80.5% year-over-year for the latest quarter with a trailing twelve months revenue of ₹875.8 billion and a net income of approximately ₹50.7 billion. The company maintains a high return on equity of 37.13% and a current ratio of 1.28, although its debt-to-equity ratio remains elevated at 195.0. Recent quarterly results indicate continued operational strength, supported by a diversified product portfolio and strong brand equity. However, the company faces challenges related to negative gross margins and negative levered free cash flow, which warrant monitoring. Overall, Titan's fundamentals remain solid with ongoing investor interest reflected in stable shareholding patterns and positive market sentiment.
News Sentiment
The overall sentiment from recent updates is moderately positive, driven by strong revenue growth, robust profitability metrics such as a 37.13% ROE, and stable ownership by promoters and institutions. Positive news includes expectations of good quarterly performance and strategic stability from the Tata group backing. Neutral tones arise from the high valuation multiples and negative gross margin figures, which temper enthusiasm. Negative sentiment is minimal but present due to the negative levered free cash flow and elevated debt levels. The balance of these factors suggests cautious optimism with attention to financial health indicators and valuation.
Source List
- https://www.ad-hoc-news.de/boerse/news/ueberblick/titan-company-ltd-stock-ine280a01028-ownership-structure-and/69524715
- https://www.screener.in/company/TITAN/consolidated/
- https://www.prnewswire.com/news-releases/titan-international-inc-reports-first-quarter-financial-results-302758053.html
Analytical Overview
Analysis Summary
Titan Company Limited's valuation metrics, including a trailing P/E of 77.19 and forward P/E of 51.59, are significantly higher than the industry average P/E of 77.19, reflecting a premium valuation that may incorporate growth expectations. The company's revenue growth rate of 80.5% year-over-year and positive cash flow from operations indicate a strong growth trajectory, though negative levered free cash flow signals capital expenditure or financing costs that impact liquidity. Financial health shows a high debt-to-equity ratio of 195.0, which is elevated and may pose risks, but the current ratio of 1.28 suggests adequate short-term liquidity. Sector-specific challenges include intense competition in luxury goods and sensitivity to discretionary consumer spending, while opportunities arise from expanding premiumization and brand loyalty in India. Considering the Indian market, regulatory stability and rising consumer income levels support demand for Titan's products, though macroeconomic factors such as inflation and interest rates remain relevant.
Overall Business and Market Assessment
Supporting Factors: No data
Risk Factors: No data
SWOT Analysis
Strengths
- Titan holds leading market positions in jewellery, watches, and eyewear categories.
- The company benefits from strong brand recognition under Tata group ownership.
- High return on equity of 37.13% indicates efficient capital utilization.
- Extensive retail network supports differentiated customer experiences.
Weaknesses
- Negative gross margin suggests cost or inventory management challenges.
- Elevated debt-to-equity ratio of 195.0 may constrain financial flexibility.
- Negative levered free cash flow indicates cash outflows exceeding inflows.
- High valuation multiples may limit near-term price appreciation.
Opportunities
- Growing premiumization and discretionary spending in India’s luxury market.
- Expansion of online and experiential retail formats can enhance sales.
- Increasing institutional ownership supports liquidity and governance.
- Potential for new product launches in emerging lifestyle segments.
Threats
- Intense competition in the luxury goods and fashion accessories sector.
- Macroeconomic factors such as inflation and interest rate hikes.
- Regulatory changes impacting consumer goods and retail operations.
- Supply chain disruptions affecting inventory and cost structures.
Company Description
Titan Company Limited is an Indian lifestyle company specializing in fashion accessories, primarily manufacturing and retailing jewellery, watches, eyewear, wearables, fragrances, women's bags, and Indian dresswear. It holds leading positions in the jewellery, watches, and eyecare categories through trusted brands such as Tanishq for jewellery, Titan for watches, Fastrack for fashion accessories, Titan Eyeplus for eyewear, CaratLane for online jewellery, and Taneira for Indian ethnic wear. The company operates an extensive network of retail stores, delivering differentiated customer experiences via experiential retail formats that have shaped India's lifestyle market. Titan Company Limited focuses on the consumer cyclical sector, particularly luxury goods, catering to diverse customer segments with products that blend sophistication, style, and quality. Founded in 1984 and headquartered in Bangalore, Karnataka, it continues to drive innovation in these categories underpinned by deep customer insights.