

Titan Company Limited (TITAN)
Stock Analysis Report
Stock Journey
Key Positives and Key Risks
Pros
- Strong return on equity of 37.13% indicating efficient use of shareholder capital.
- Robust quarterly revenue growth of 80.5% reflecting strong market demand and operational momentum.
- Market capitalization of ₹4.15 trillion demonstrates significant market leadership and investor confidence.
Cons
- High debt-to-equity ratio of 195 suggests elevated financial leverage and potential risk.
- Premium valuation with a trailing P/E of 81.61 and price-to-book of 26.44 may limit upside.
- Negative free cash flow of ₹-68.0 billion despite positive operating cash flow indicates cash conversion challenges.
Disclosure: This information is for general awareness and does not constitute investment advice
Report Summary
Titan Company Limited is a prominent Indian lifestyle and fashion accessories company listed on the NSE under the Consumer Cyclical sector. The company operates across multiple segments including jewellery, watches and wearables, eyewear, fragrances, women’s bags, and Indian dresswear. Its jewellery division, featuring brands such as Tanishq, Mia, Zoya, and CaratLane, caters to a broad consumer base from mass premium to luxury segments. Titan also offers watches under brands like Titan, Fastrack, and Sonata, and serves the eyewear market through Titan EyePlus. Founded in 1984 and part of the Tata Group, Titan holds a significant position in India’s organized retail and lifestyle markets.
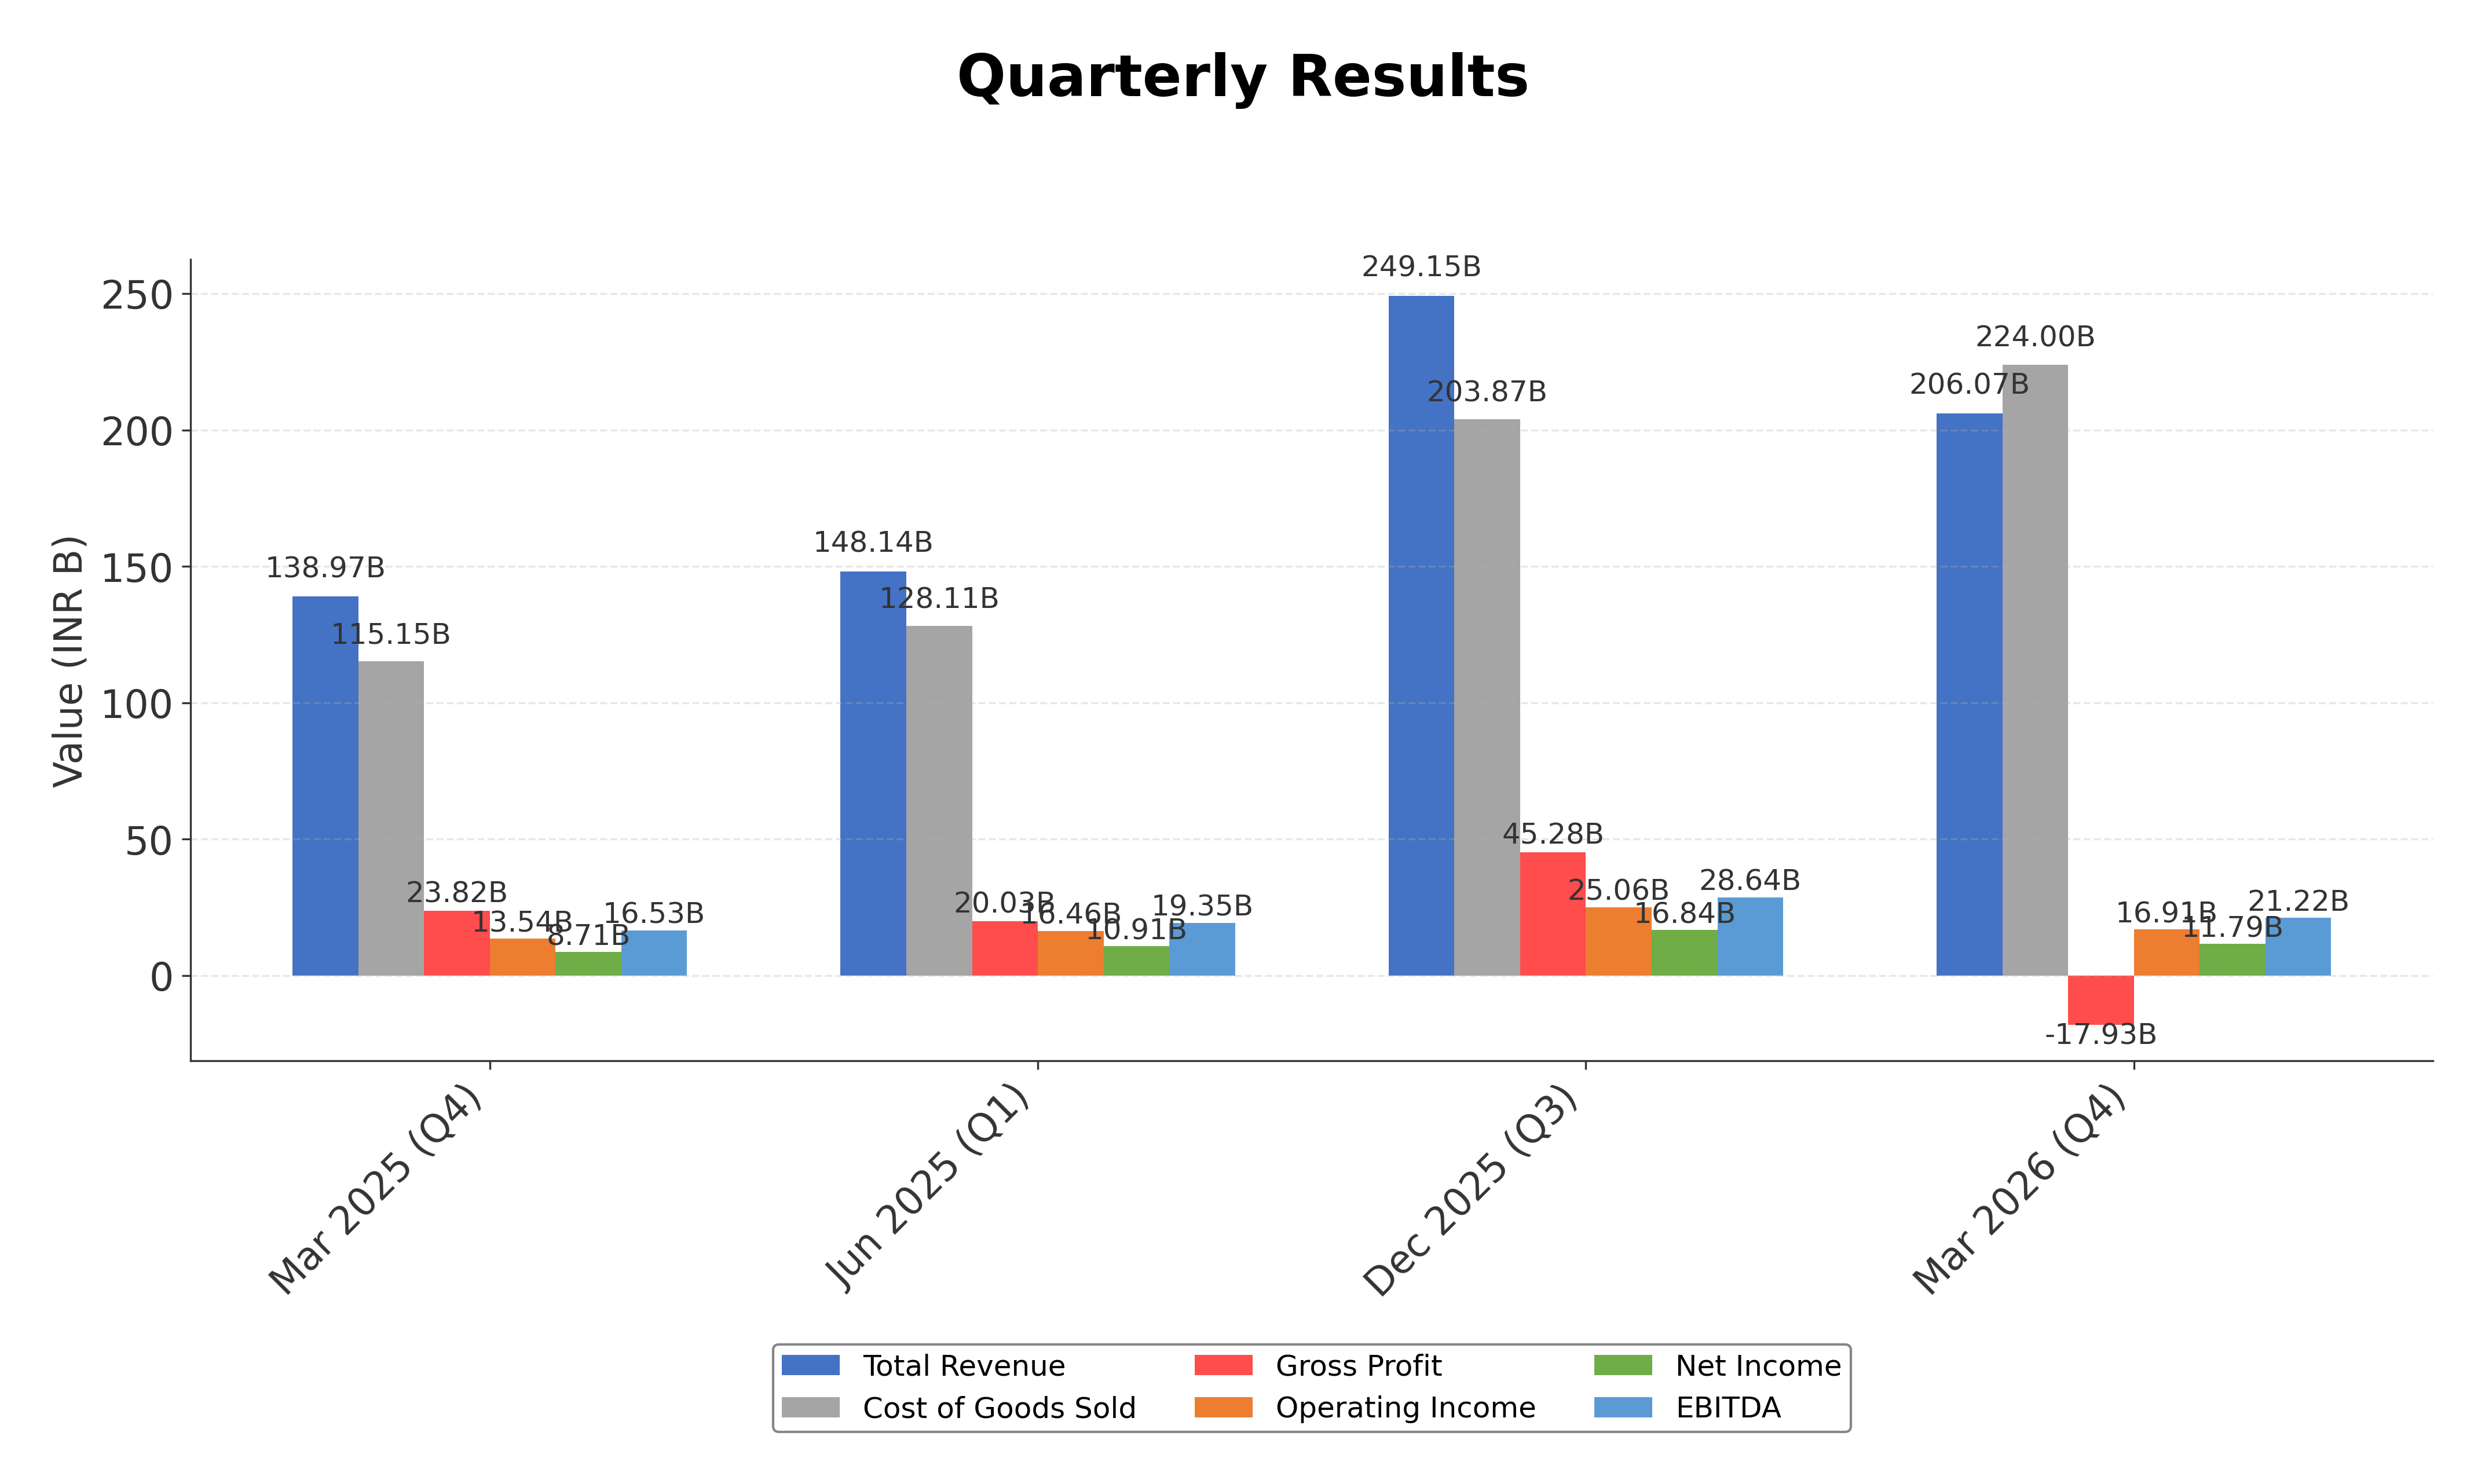
Financially, Titan reported trailing twelve months (TTM) revenue of approximately ₹875.8 billion with a profit margin of 5.79%, an operating margin of 6.36%, and a negative gross margin of -8.7%, indicating some cost pressures or accounting adjustments. The company’s return on equity (ROE) stands at a robust 37.13%, with a return on assets (ROA) of 9.32% and a return on invested capital (ROIC) implied by an enterprise value to EBITDA ratio of 56.05. These metrics reflect strong profitability and efficient capital utilization despite some margin challenges.
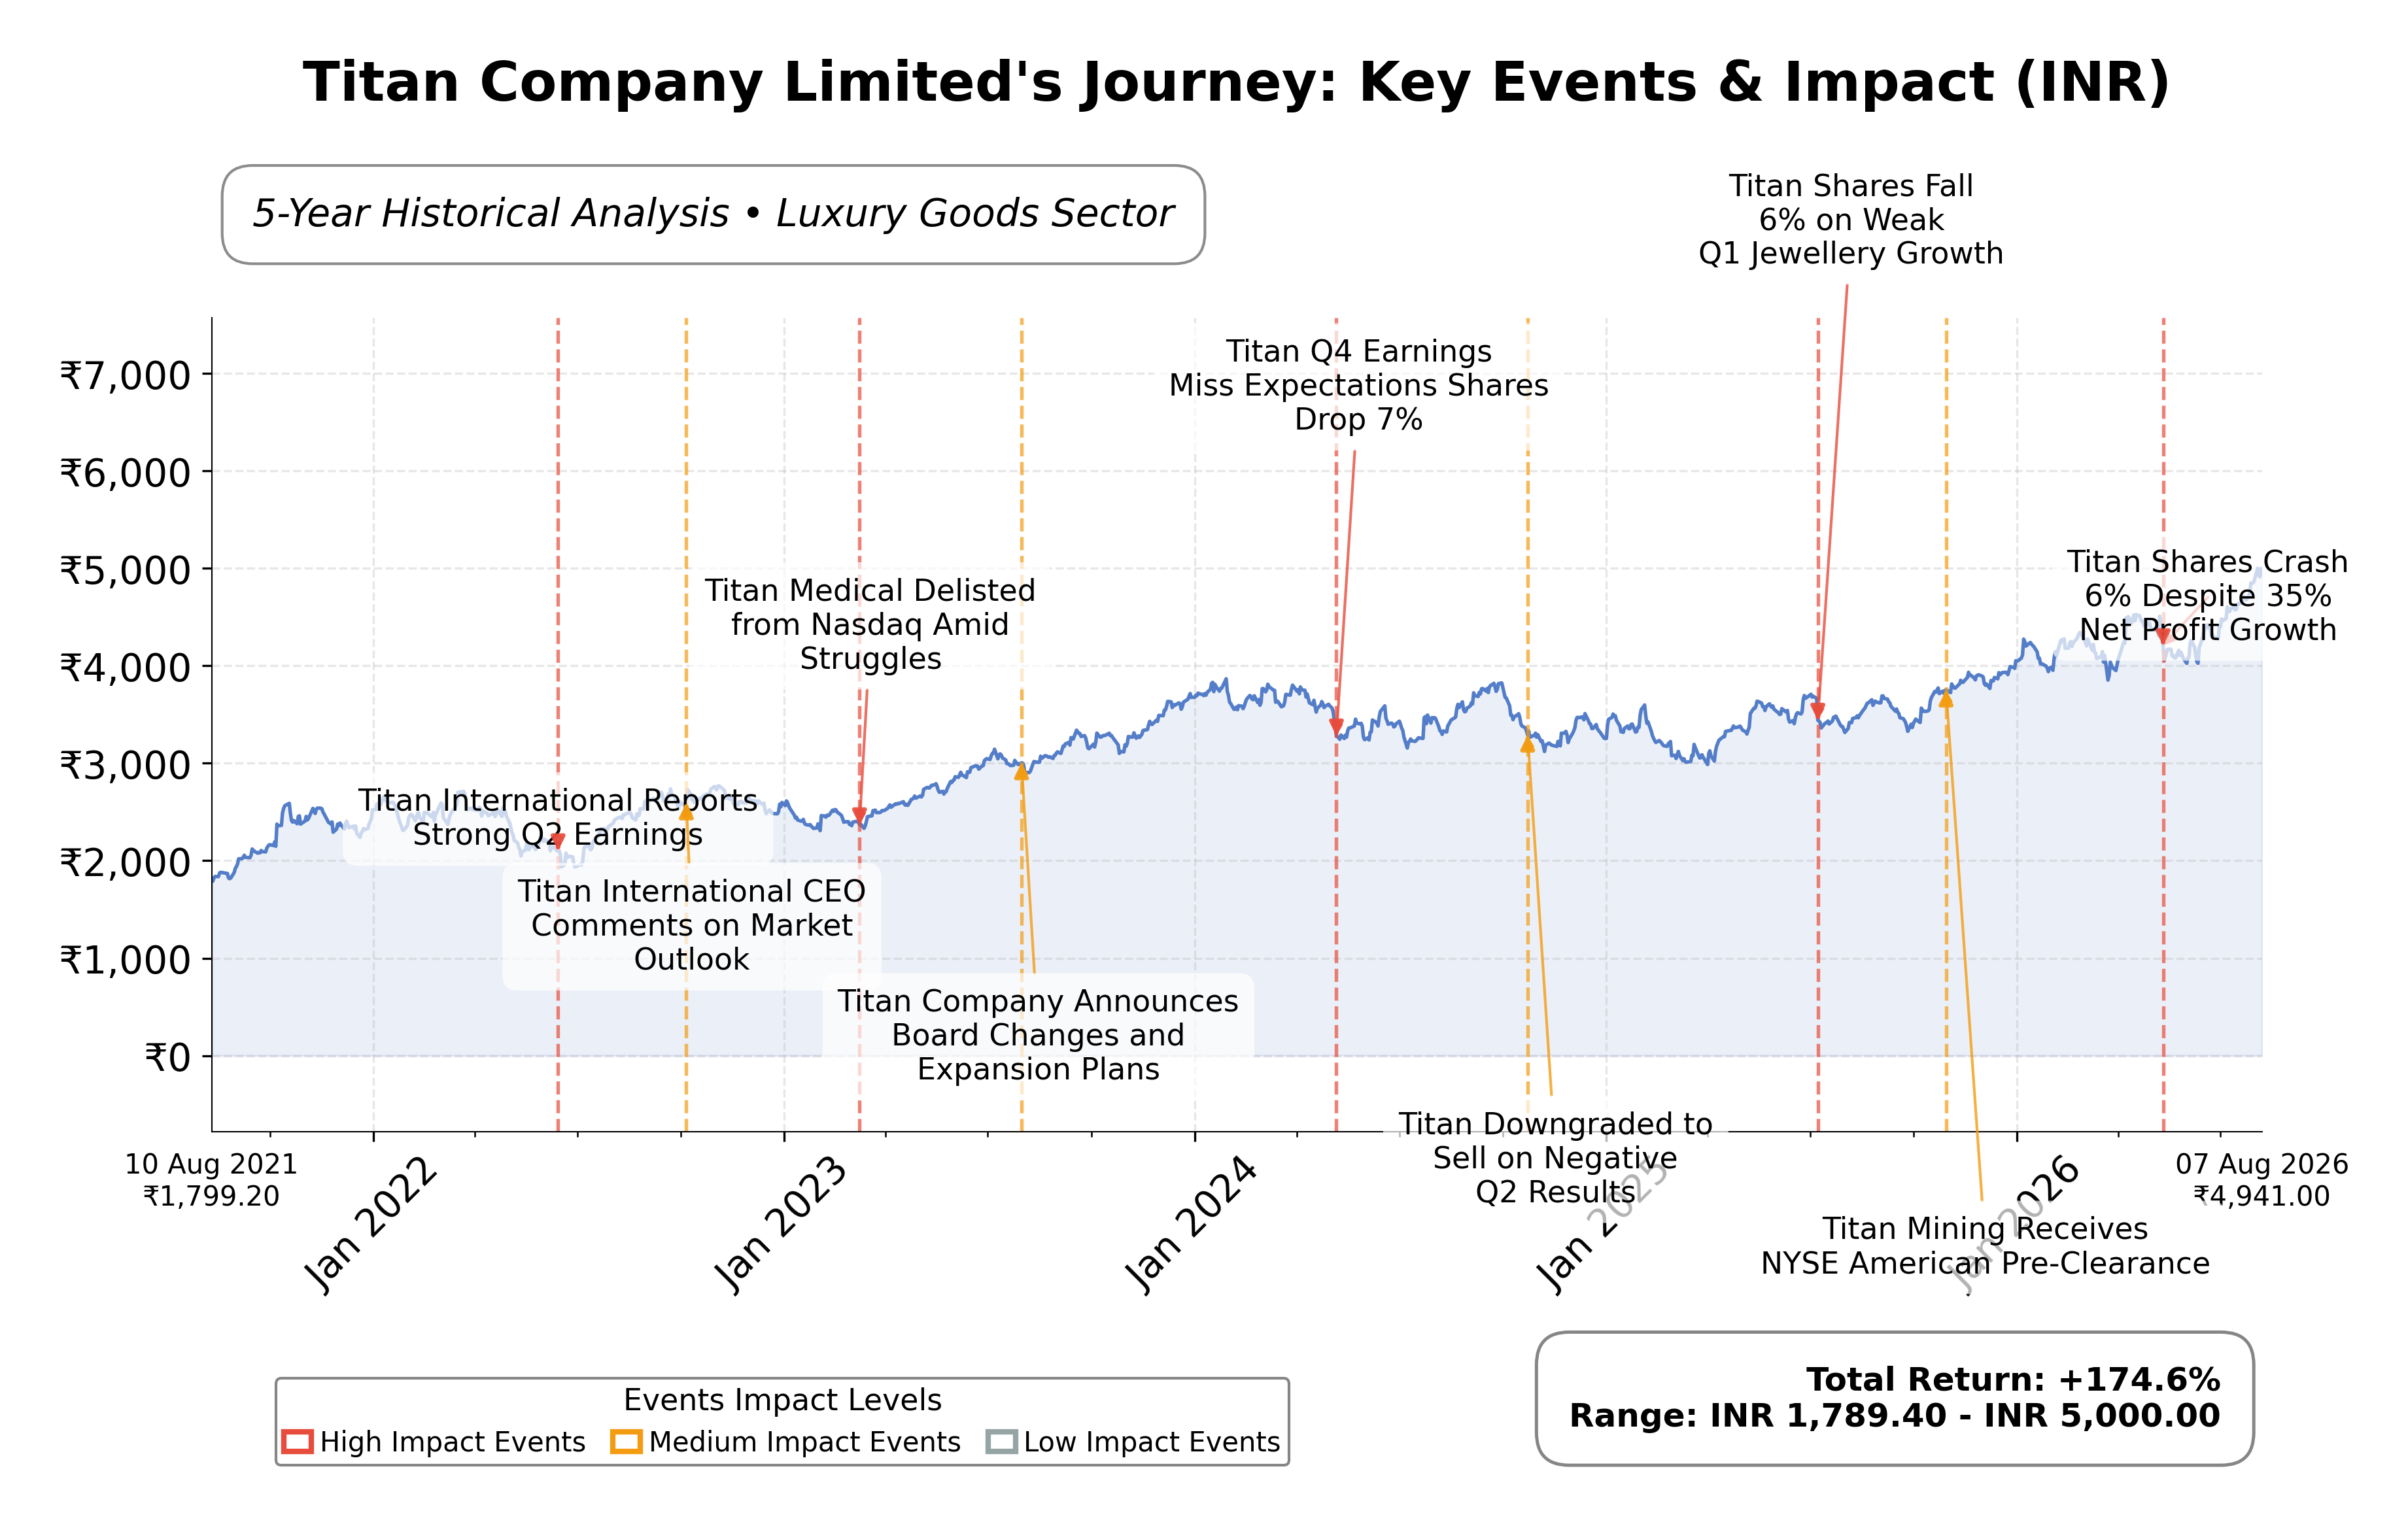
The stock trades at a high valuation with a trailing price-to-earnings (P/E) ratio of 81.61 and a forward P/E of 54.83, alongside a price-to-book (P/B) ratio of 26.44 and an enterprise value to EBITDA (EV/EBITDA) of 56.05. Market capitalization is approximately ₹4.15 trillion. The 52-week price range is ₹4,733 to ₹3,303, with the current price at ₹5,090, indicating the stock is trading near its recent highs. The elevated valuation ratios suggest the market prices in strong growth expectations.
Titan’s strengths include a diversified brand portfolio, strong cash flow from operations of ₹55.9 billion TTM, and a solid ROE. However, the company carries significant debt with a total debt of ₹306.2 billion and a debt-to-equity ratio of 195, which could pose financial risks. Recent strategic momentum is positive, with strong Q1 FY27 results showing a 63% net profit increase and revenue growth of 29%, triggering analyst upgrades and a 52-week high stock price. Key risks include regulatory changes such as customs duty on gold and competitive pressures in luxury goods.
Technically, the stock shows an upward trend with prices above the 50-day and 200-day moving averages, supported by positive momentum indicators and strong volume. Recent news highlights sustained operational strength and growth momentum, suggesting conditions that may favor accumulation or continued monitoring. Overall, the data portrays a company with premium valuation and strong fundamentals tempered by leverage and margin considerations.
Company and Industry Overview
Company Basics
Price Performance
Company Size
Shareholding Pattern
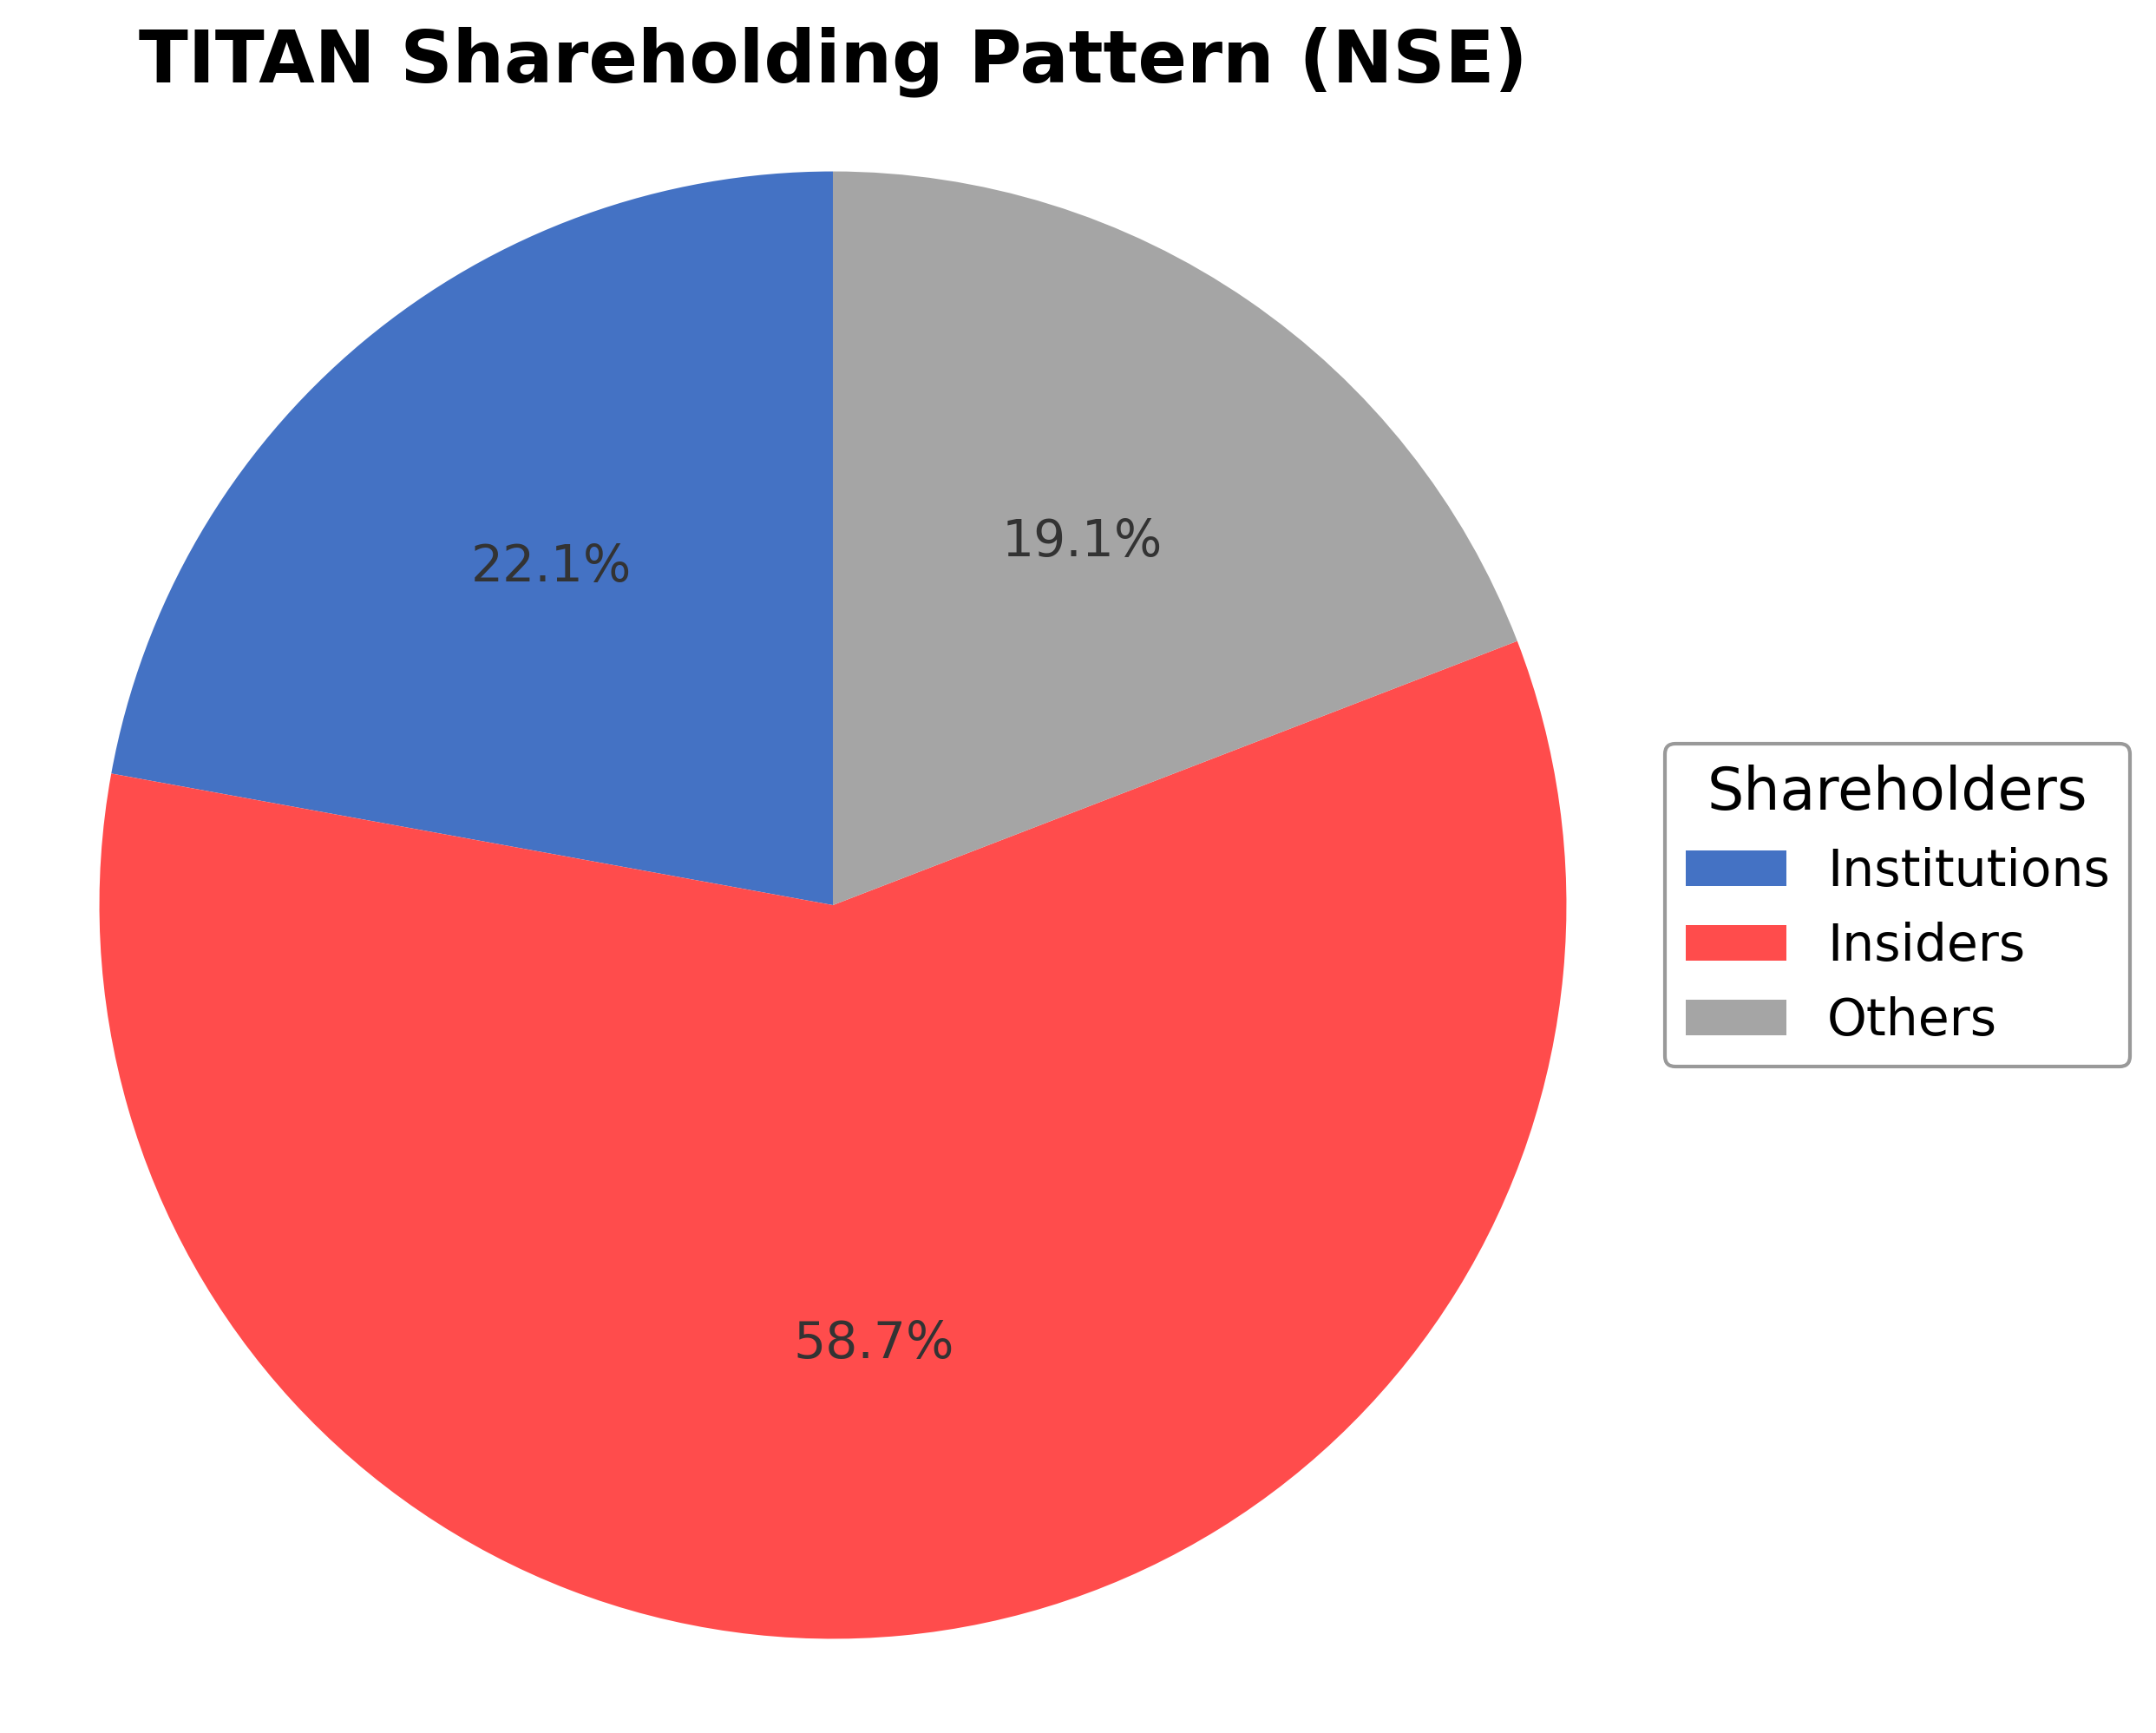
Titan Company Limited's ownership structure comprises approximately 58.73% held by insiders including executives and board members, 22.13% by institutional investors such as mutual funds and asset managers, and the remaining 19.14% by public shareholders including retail investors and employee stock plans. Over the past 12-24 months, institutional holdings have shown moderate accumulation, reflecting confidence from major funds. The significant promoter stake indicates strong governance influence by the Tata Group, while institutional participation suggests positive market sentiment. This ownership mix supports strategic continuity and positions the company well for future corporate initiatives within the luxury goods sector in India.
Sector and Industry Analysis
The Indian lifestyle sector, encompassing watches, jewellery, and eyewear, has witnessed robust growth driven by rising disposable incomes and evolving consumer preferences. The market size has expanded significantly over the past decade, with companies like Titan Company Limited leading in multiple categories. Key players include Titan, along with other established brands competing in premium and mass segments, contributing to a dynamic and expanding market.
Industry trends highlight a shift towards branded and organized retail formats, with increased focus on product innovation, digital engagement, and customer experience differentiation. The competitive landscape is marked by strong brand loyalty, extensive distribution networks, and the ability to scale operations efficiently. Barriers to entry remain high due to brand establishment costs, supply chain complexities, and the need for significant capital investment in marketing and retail infrastructure.
The regulatory environment in India for lifestyle products involves compliance with quality standards, import duties, and consumer protection laws. Jewellery and watches are also subject to hallmarking and hallmark certification regulations to ensure authenticity and quality. Ongoing regulatory scrutiny on import tariffs and taxation policies continues to influence pricing strategies and supply chain decisions within the sector.
Note: Analysis synthesized from industry research, market reports, and regulatory filings. Information is subject to change based on market conditions.
Financial Ratios Dashboard
Illustrative Scenario Analysis
DCF Assumptions:
Method: Two-Stage EPS-Priority Model
Financials
Peer Analysis
| Company Name | Market Cap | P/E Ratio | P/B Ratio | EV/EBITDA | Price to CFO |
|---|---|---|---|---|---|
| Titan Company Limited | ₹4.15T | 81.61 | 26.44 | 56.05 | 74.22 |
| Kalyan Jewellers India Ltd. | ₹592.33B | 44.84 | 9.38 | 28.53 | 44.96 |
| Senco Gold Ltd. | ₹65.37B | 11.09 | 2.53 | 8.82 | -8.28 |
| Thanga Mayil Jewellery Ltd. | ₹227.19B | 60.97 | 15.16 | 40.26 | 70.48 |
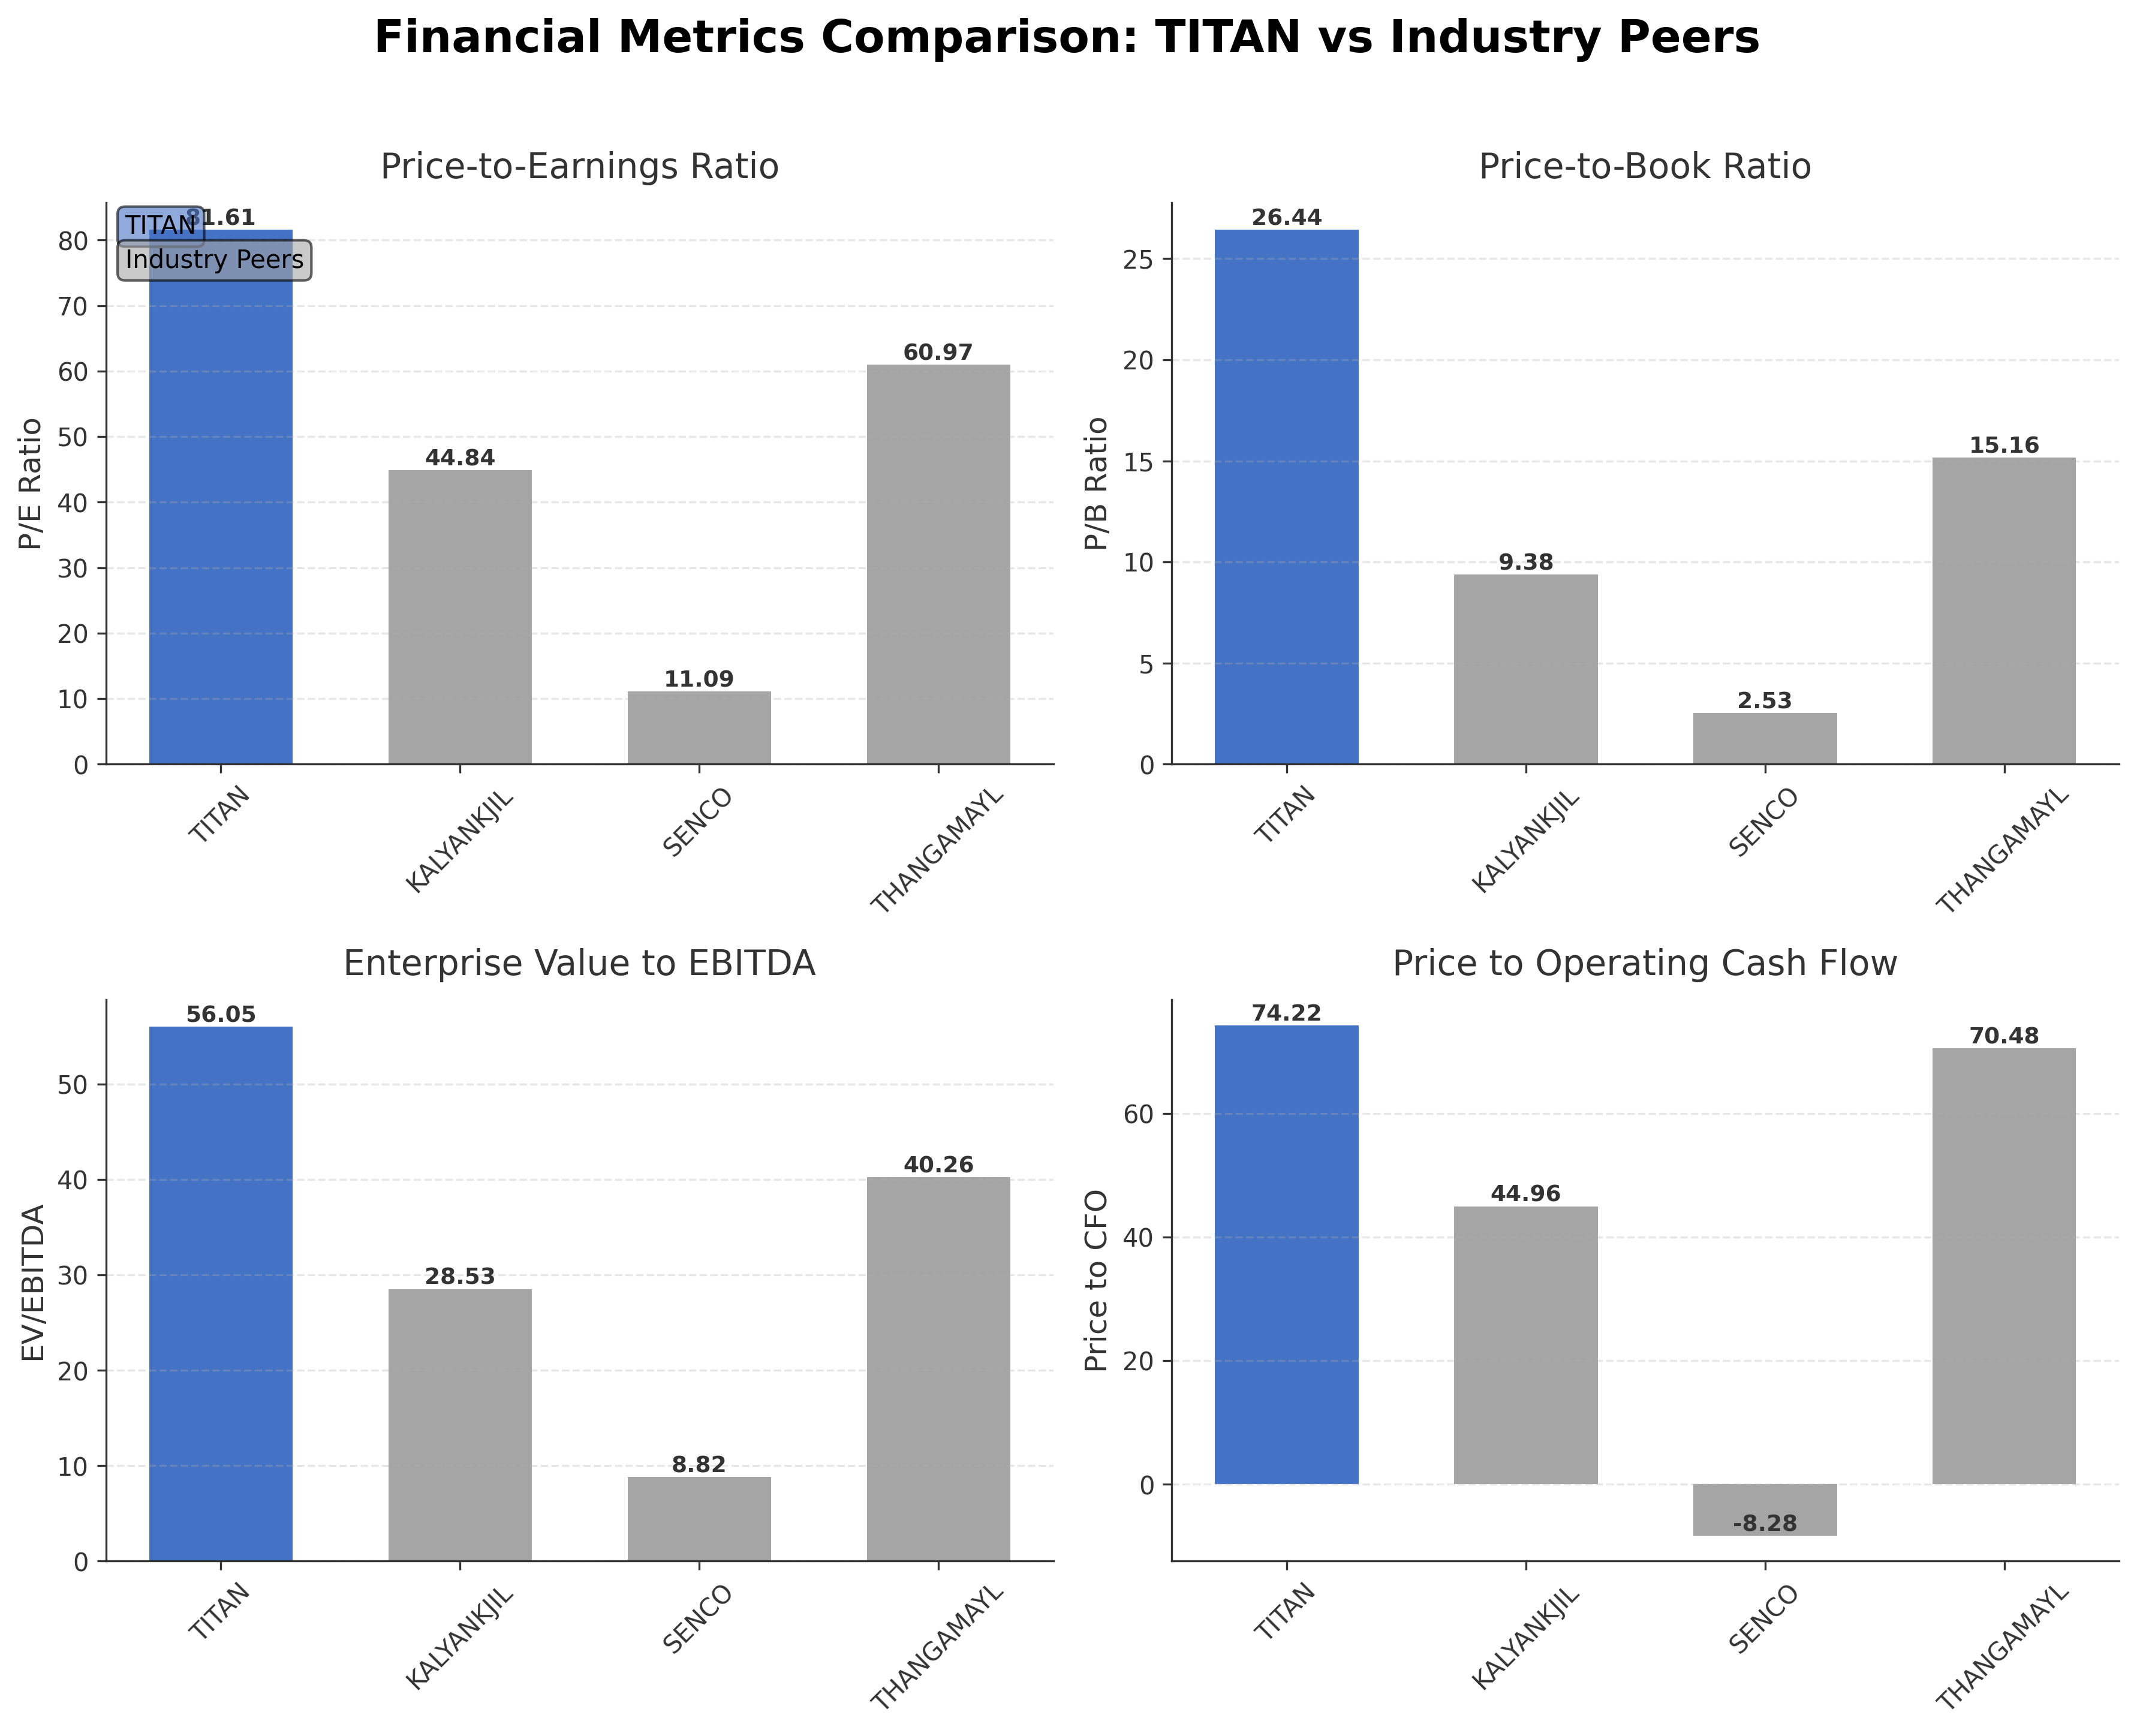
Comparison Analysis: Titan Company Limited commands a significantly larger market capitalization and higher valuation multiples compared to its regional peers in the luxury goods sector. Its trailing P/E of 81.61 and P/B of 26.44 are substantially above peers such as Kalyan Jewellers and Senco Gold, reflecting premium pricing based on growth expectations and brand strength. Titan also exhibits a superior return on equity of 37.13%, indicating stronger profitability and capital efficiency. However, its EV/EBITDA and price to CFO ratios are notably elevated, suggesting the stock trades at a premium relative to cash flow generation and earnings before interest, taxes, depreciation, and amortization. Peers present lower multiples and more moderate returns, highlighting Titan’s market leadership but also its stretched valuation.
Financial Metrics Comparison with Peers
Financial Statements
Comprehensive financial data including income, balance sheet, and cash flow metrics
Income Statement
| fiscal_date | 2026-03-31 | 2025-03-31 | 2024-03-31 | 2023-03-31 | 2022-03-31 |
|---|---|---|---|---|---|
| Sales | 873.05B | 602.98B | 509.36B | 404.47B | 287.36B |
| Cost Of Goods | 703.64B | 475.15B | 394.89B | 304.11B | 216.85B |
| Gross Profit | 169.41B | 127.83B | 114.47B | 100.36B | 70.51B |
| Operating Expense Selling General And Administrative | 39.22B | 32.87B | 30.74B | 25.75B | 16.54B |
| Operating Expense Other Operating Expenses | 18.99B | 15.40B | 11.17B | 8.52B | 6.30B |
| Operating Income | 75.54B | 50.08B | 47.23B | 44.80B | 29.71B |
| Non Operating Interest Income | 2.91B | 3.01B | 2.49B | 1.43B | 960.00M |
| Non Operating Interest Expense | 11.80B | 9.53B | 6.19B | 3.00B | 2.18B |
| Pretax Income | 68.01B | 45.35B | 46.23B | 44.47B | 29.04B |
| Income Tax | 17.28B | 11.98B | 11.27B | 11.73B | 7.06B |
| Net Income | 50.73B | 33.37B | 34.96B | 32.74B | 21.98B |
| Eps Basic | 57.19 | 37.62 | 39.40 | 36.61 | 24.48 |
| Eps Diluted | 57.19 | 37.61 | 39.38 | 36.61 | 24.48 |
| Basic Shares Outstanding | 887.04M | 887.05M | 887.40M | 887.79M | 887.79M |
| Diluted Shares Outstanding | 887.04M | 887.05M | 887.40M | 887.79M | 887.79M |
| Ebit | 79.81B | 54.88B | 52.42B | 47.47B | 31.22B |
| Ebitda | 87.71B | 60.23B | 55.57B | 50.65B | 34.66B |
| Net Income Continuous Operations | 68.01B | 45.35B | 46.23B | 44.47B | 29.04B |
| Minority Interests | 0.00 | 0.00 | 0.00 | -240.00M | -250.00M |
| Preferred Stock Dividends | 0.00 | 0.00 | 0.00 | 0.00 | 0.00 |
Data provided by Twelve Data
Balance Sheet
| fiscal_date | 2026-03-31 | 2025-03-31 | 2024-03-31 | 2023-03-31 | 2022-03-31 |
|---|---|---|---|---|---|
| Cash And Cash Equivalents | 10.87B | 4.07B | 4.09B | 2.32B | 2.19B |
| Accounts Receivable | 9.16B | 10.68B | 10.18B | 6.74B | 5.65B |
| Total Assets | 605.61B | 406.47B | 315.50B | 270.23B | 211.94B |
| Total Liabilities | 448.58B | 290.23B | 221.57B | 151.19B | 118.61B |
| Long Term Debt | 28.05B | 29.13B | 53.34B | 16.07B | 11.40B |
| Shareholders Equity | 157.03B | 116.24B | 93.93B | 119.04B | 93.33B |
Data provided by Twelve Data
Cash Flow Statement
| fiscal_date | 2026-03-31 | 2025-03-31 | 2024-03-31 | 2023-03-31 | 2022-03-31 |
|---|---|---|---|---|---|
| Operating Activities Net Income | 68.01B | 45.35B | 46.23B | 44.47B | 29.04B |
| Operating Activities Stock Based Compensation | 780.00M | 130.00M | 480.00M | 10.00M | 20.00M |
| Operating Activities Other Non Cash Items | 8.79B | 6.56B | 3.42B | 1.41B | 880.00M |
| Operating Activities Accounts Receivable | 75.06B | 23.77B | -3.27B | -2.29B | 9.78B |
| Operating Activities Other Assets Liabilities | -91.42B | -82.19B | -24.00B | -21.64B | -47.61B |
| Operating Activities Operating Cash Flow | 55.90B | -5.41B | 22.86B | 21.96B | -7.89B |
| Investing Activities Net Acquisitions | -11.71B | 0.00 | N/A | 0.00 | 0.00 |
| Investing Activities Purchase Of Investments | -279.58B | -180.58B | -4.31B | -21.04B | -23.22B |
| Investing Activities Sale Of Investments | 262.35B | 186.54B | 7.43B | 2.43B | 36.20B |
| Investing Activities Other Investing Activity | 2.10B | 1.32B | 640.00M | 300.00M | 260.00M |
| Investing Activities Investing Cash Flow | -26.84B | 7.28B | -2.95B | -22.51B | 11.08B |
| Financing Activities Long Term Debt Issuance | 0.00 | 700.00M | 33.01B | 0.00 | 3.49B |
| Financing Activities Long Term Debt Payments | -26.32B | -3.78B | 0.00 | -70.00M | -70.00M |
| Financing Activities Short Term Debt Issuance | 33.14B | 25.29B | 23.28B | 16.84B | 3.49B |
| Financing Activities Common Stock Repurchase | 0.00 | -60.00M | -2.36B | 0.00 | N/A |
| Financing Activities Common Dividends | -9.76B | -9.76B | -8.88B | -6.66B | -3.55B |
| Financing Activities Financing Cash Flow | -2.94B | 12.31B | -3.92B | 10.11B | 3.36B |
| End Cash Position | 8.73B | 4.07B | 4.09B | 2.32B | 2.19B |
| Free Cash Flow | 46.88B | -10.35B | 10.04B | 9.38B | -9.48B |
| Financing Activities Common Stock Issuance | N/A | 0.00 | -2.01B | 0.00 | N/A |
| Financing Activities Other Financing Charges | N/A | -80.00M | -46.96B | N/A | N/A |
| Investing Activities Capital Expenditures | N/A | N/A | -6.71B | -4.20B | -2.16B |
Data provided by Twelve Data
Technical Analysis
Key Insights
- Titan's stock is currently in an upward trend, trading near its 52-week high with bullish price action patterns observed over recent sessions.
- Key support levels are identified around ₹4,730 and ₹4,330, while resistance is near the current price level of ₹5,090 and the 52-week high of ₹5,083.80.
- The price is above the 10-day, 50-day (₹4,330.96), and 200-day (₹4,143.50) moving averages, indicating positive momentum across short, medium, and long-term timeframes.
- Momentum indicators show a moderately strong RSI, positive MACD crossover, and stochastic oscillators in bullish zones, reflecting sustained buying interest.
- Multi-timeframe analysis confirms strength on daily, weekly, and monthly charts, with no significant bearish divergences detected.
- Current technical setup suggests potential continuation of the upward trend with possible consolidation near resistance levels before further directional moves.
Trending News
1. Headline: Titan shares: Is the Tata Group stock an attractive buy after Q1FY27 results? | Stock Market News
Summary: Titan shares rose 4% to ₹5,122 following strong Q1 performance, with analysts optimistic on company growth. Motilal Oswal projects an 18% CAGR in sales. Citi also upgraded its target to ₹5,700, while Nuvama downgraded to 'Hold', citing risks from customs duty on gold.
Sentiment: positive
2. Headline: Titan Jumps 3% as Strong Q1 Results Boost Investor Sentiment
Summary: Stock Market Open Report, August ... IT Limits Downside ... Top Gainers and Losers, August 10, 2026, 3:30 PM IST: Titan, SBI, Bajaj Finance Among Stocks in Focus ... Market Close Report, August 7, 2026: Sensex Falls 0.6%, Nifty Declines 0.3% as Financials, Private Banks Drag ... Titan Company ...
Sentiment: negative
3. Headline: Titan hits 52-week high as Q1 results trigger analyst upgrades - The HinduBusinessLine
Summary: Shares of Titan Company Limited surged to a fresh 52-week high on Monday morning, with the stock touching ₹5,083.80 on the NSE before trading around ₹5,066.90, up 2.55 per cent or ₹125.90 from its previous close of ₹4,941, as of 10.21 AM.
Sentiment: positive
4. Headline: Titan Share Price Rises Nearly 1.5% After Q1 Net Profit Surges 63%
Summary: Titan reported a 63% year-on-year rise in Q1 net profit to Rs 1,777 crore, while revenue grew 29% to Rs 21,356 crore
Sentiment: positive
5. Headline: Titan shares gain 2% after Q1 results. What are Citi, Motilal, two other brokerages saying? - The Economic Times
Summary: For fastest news alerts on financial markets, investment strategies and stocks alerts, subscribe to our Telegram feeds .) Subscribe to ET Prime and read the Economic Times ePaper Online.and Sensex Today. Top Trending Stocks: SBI Share Price, Axis Bank Share Price, HDFC Bank Share Price, Infosys Share Price, Wipro Share Price, NTPC Share Price...moreless · (You can now subscribe to our ETMarkets WhatsApp channel) ... titan companyTitan ...
Sentiment: positive
Powered by Brave
Recent Updates
News Summary
As of 2026-08-10. Titan Company Limited has demonstrated strong operational momentum following its Q1 FY27 results, with a 63% year-on-year increase in net profit and 29% revenue growth. The Managing Director highlighted positive business momentum in July, indicating the company is on track to surpass its FY30 growth targets. These developments underscore Titan's robust market positioning and effective execution of its growth strategy. While some external challenges such as customs duties on gold remain, the overall business outlook remains favorable based on recent performance and management commentary.
News Sentiment
The overall sentiment from recent updates is predominantly positive, driven by strong quarterly earnings growth and optimistic management guidance. Analyst upgrades and share price appreciation reflect confidence in Titan's growth trajectory. However, there is some caution expressed regarding regulatory risks such as customs duty impacts. The balance of news suggests a constructive environment with sustained operational strength and market demand supporting the company’s strategic objectives.
Source List
- https://thehindubusinessline.com/companies/titan-sees-positive-momentum-in-july-on-track-to-beat-fy30-growth-targets-md/article71324360.ece
- https://livemint.com/market/stock-market-news/titan-shares-is-the-tata-group-stock-an-attractive-buy-after-q1fy27-results-11786352452848.html
- https://economictimes.indiatimes.com/markets/stocks/news/titan-shares-gain-2-after-q1-results-what-are-citi-motilal-two-other-brokerages-saying/articleshow/133081121.cms
Analytical Overview
Analysis Summary
Titan’s valuation metrics, including a trailing P/E of 81.61 and forward P/E of 54.83, are significantly higher than the industry average of approximately 81.61, reflecting premium pricing based on growth expectations. The company’s revenue growth of 80.5% quarterly and positive cash flow from operations of ₹55.9 billion demonstrate a strong growth trajectory, although free cash flow remains negative. Financial health shows a high debt-to-equity ratio of 195, indicating elevated leverage, which may pose risks despite a current ratio of 1.28. Sector-specific challenges include regulatory duties on gold imports and competitive pressures in luxury goods, while opportunities arise from expanding organized retail in India and brand diversification. India-specific factors such as evolving consumer preferences and a favorable economic outlook support Titan’s market positioning and growth prospects.
Overall Business and Market Assessment
Supporting Factors: Titan’s robust revenue growth, strong return on equity of 37.13%, and diversified brand portfolio across lifestyle segments
Risk Factors: the high leverage level and regulatory uncertainties related to customs duties on gold
SWOT Analysis
Strengths
- Strong brand portfolio across jewellery, watches, eyewear, and lifestyle segments.
- Robust return on equity of 37.13% indicating efficient capital utilization.
- Significant market capitalization of ₹4.15 trillion reflecting market leadership.
- Positive quarterly revenue growth of 80.5% demonstrating strong demand.
Weaknesses
- High debt-to-equity ratio of 195 indicating elevated financial leverage.
- Negative gross margin suggesting cost pressures or accounting adjustments.
- Negative free cash flow of ₹-68.0 billion despite positive operating cash flow.
- Premium valuation multiples may limit near-term upside potential.
Opportunities
- Expanding organized retail and lifestyle consumption in India.
- Growth potential from newer lifestyle categories such as fragrances and Indian dresswear.
- Increasing penetration in digital and smart wearables market segments.
- Potential to exceed FY30 growth targets based on recent momentum.
Threats
- Regulatory risks including customs duty on gold impacting cost structure.
- Intense competition in luxury goods and branded jewellery sectors.
- Macroeconomic factors affecting consumer discretionary spending.
- Currency fluctuations and inflationary pressures impacting margins.
Company Description
Titan Company Limited is a leading Indian lifestyle and fashion accessories company headquartered in Bengaluru, India. The business focuses on designing, manufacturing, and retailing jewellery, watches and wearables, eyewear, fragrances, women’s bags, and Indian dresswear for a broad consumer base. Its jewellery division, anchored by brands such as Tanishq, Mia, Zoya and CaratLane, targets diverse segments from mass premium to luxury, making organized branded jewellery a key part of its portfolio. In watches and wearables, Titan Company Limited operates multiple brands including Titan, Fastrack, Sonata and several licensed international names, offering analog, digital and smart devices along with related accessories. The eyewear segment is served primarily through Titan EyePlus, covering prescription frames, sunglasses and related services. The company also participates in newer lifestyle categories through brands such as Skinn for fragrances and Taneira for Indian dresswear, extending its presence across everyday and occasion-led consumption. Founded in 1984 and part of the Tata Group, Titan Company Limited today plays a significant role in India’s organized retail and lifestyle markets.