
Tesla, Inc (TSLA)
Stock Analysis Report
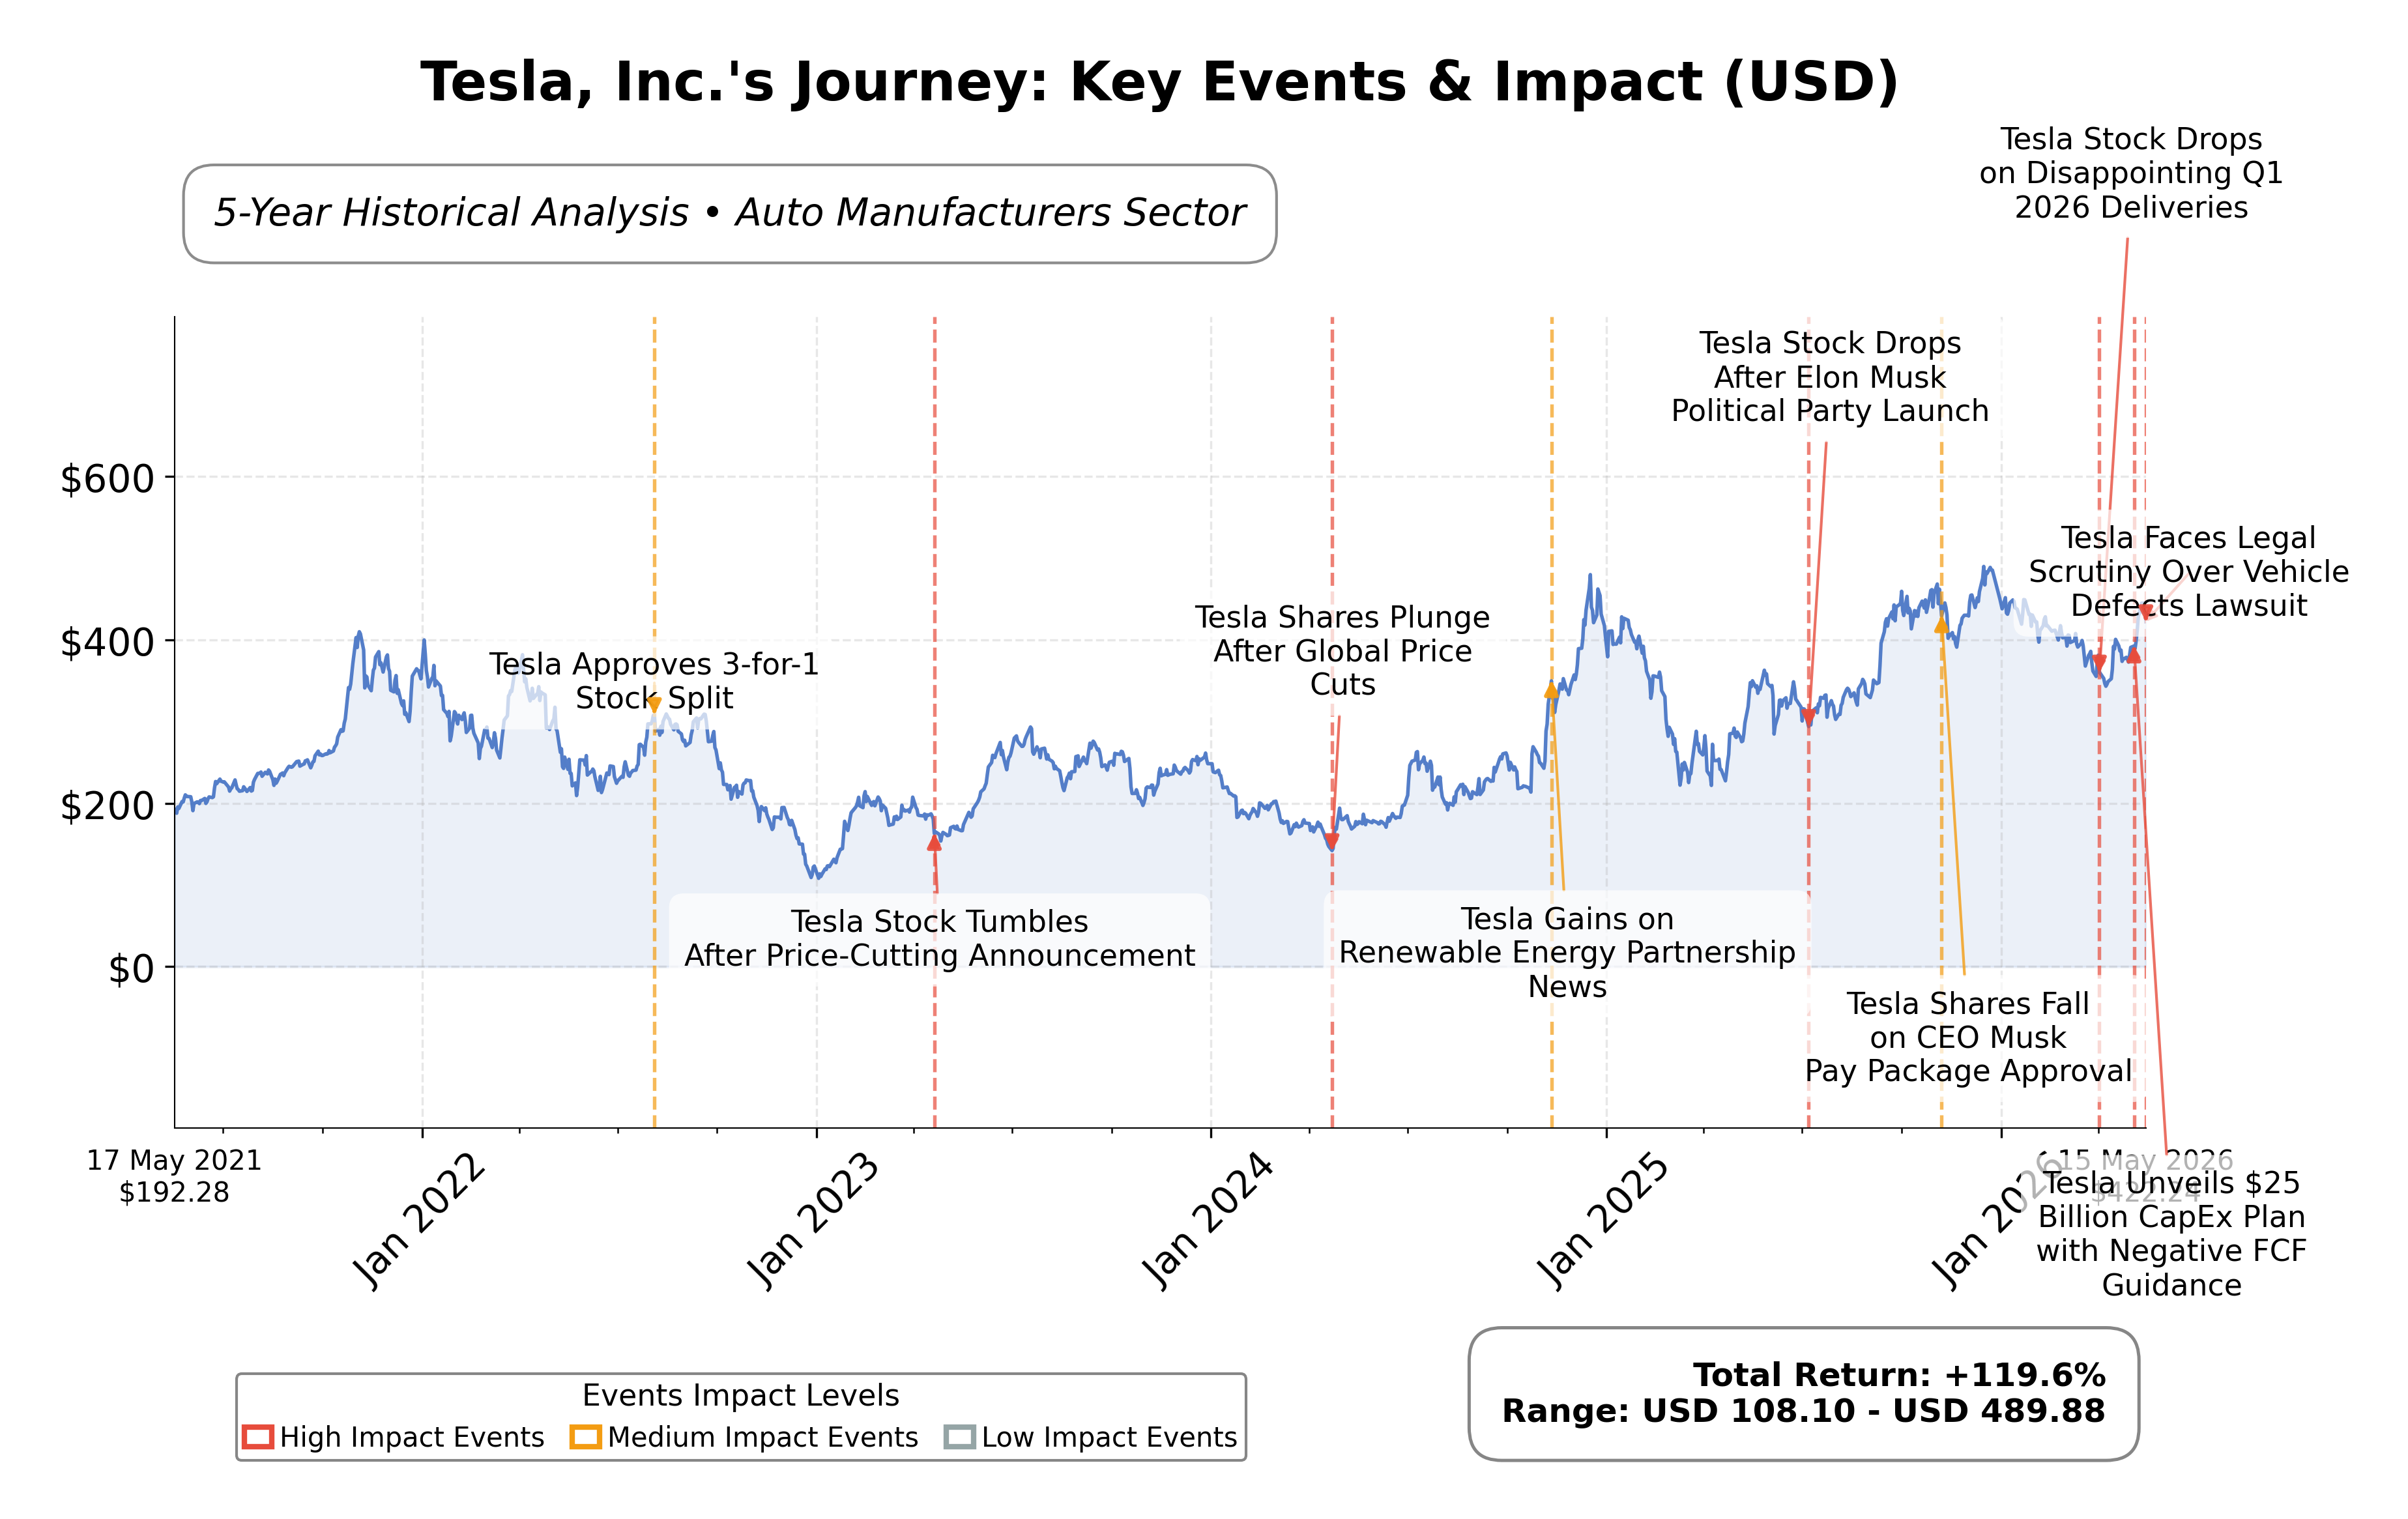
Stock Journey
Key Positives and Key Risks
Pros
- Robust revenue growth of 15.8% year-over-year demonstrates strong market demand and operational expansion.
- Substantial cash reserves totaling $44.7 billion provide financial flexibility and support for strategic investments.
- Leading market capitalization of approximately $1.59 trillion reflects significant investor confidence and scale.
Cons
- Extremely high trailing P/E ratio of 383.85 and forward P/E of 167.95 indicate premium valuation with limited margin for error.
- Modest return on equity at 4.90% suggests room for improvement in profitability relative to capital employed.
- Regulatory challenges, particularly related to Full Self-Driving technology in China, pose operational and reputational risks.
Disclosure: This information is for general awareness and does not constitute investment advice
Report Summary
Tesla, Inc. operates as a leading manufacturer in the electric vehicle and renewable energy sectors, listed on NASDAQ under the symbol TSLA. The company’s core business encompasses the design and production of electric vehicles including the Model S, Model 3, Model X, Model Y, and Cybertruck, alongside energy storage solutions and solar products. Tesla’s operations span globally with Gigafactories producing batteries and components, positioning it prominently within the Consumer Cyclical sector and the Auto Manufacturers industry. Its market presence is supported by direct-to-consumer sales and strategic partnerships, emphasizing innovation in sustainable transportation and energy infrastructure.
Financially, Tesla reported trailing twelve months (TTM) revenue of approximately $97.88 billion with a gross margin of 21.08%, operating margin of 4.20%, and a net profit margin of 3.95%. The company’s return on equity (ROE) stands at 4.90%, return on assets (ROA) at 2.23%, and return on invested capital (ROIC) reflects efficient capital use despite high valuation multiples. These metrics indicate moderate profitability and operational efficiency amid rapid growth and capital investment phases. Tesla’s quarterly revenue growth is robust at 15.8%, and quarterly earnings growth year-over-year is 16.6%, underscoring consistent expansion.
Tesla’s valuation ratios are notably elevated, with a trailing price-to-earnings (P/E) ratio of 383.85, forward P/E of 167.95, price-to-book (P/B) ratio of 19.28, and enterprise value to EBITDA (EV/EBITDA) of 140.41. The market capitalization is approximately $1.59 trillion, reflecting its status as a mega-cap growth stock. The current share price of $422.13 sits well below the 52-week high of $498.83 but significantly above the 52-week low of $273.21, indicating recent price volatility within a broad trading range. These valuation levels suggest the market prices in substantial growth expectations and innovation potential.
Tesla’s strengths include strong cash reserves of $44.7 billion, a low debt-to-equity ratio of 18.7%, and leadership in electric vehicle technology and energy solutions. Key risks involve regulatory scrutiny, competitive pressures from traditional automakers and new entrants, and geopolitical challenges impacting supply chains, particularly in China. Recent strategic actions include price adjustments for Model Y vehicles in the U.S., leadership stock transactions, and increased institutional holdings, reflecting dynamic market engagement and evolving corporate governance.
Technically, Tesla’s stock shows mixed signals with price action near key moving averages and momentum indicators reflecting moderate volatility. The stock’s trajectory is influenced by recent earnings reports, regulatory developments, and competitive dynamics. Current conditions suggest a nuanced environment where accumulation, profit realization, or cautious monitoring may be appropriate depending on individual risk tolerance and market outlook, consistent with regulatory standards for impartial financial reporting.
Company and Industry Overview
Company Basics
Price Performance
Company Size
Shareholding Pattern
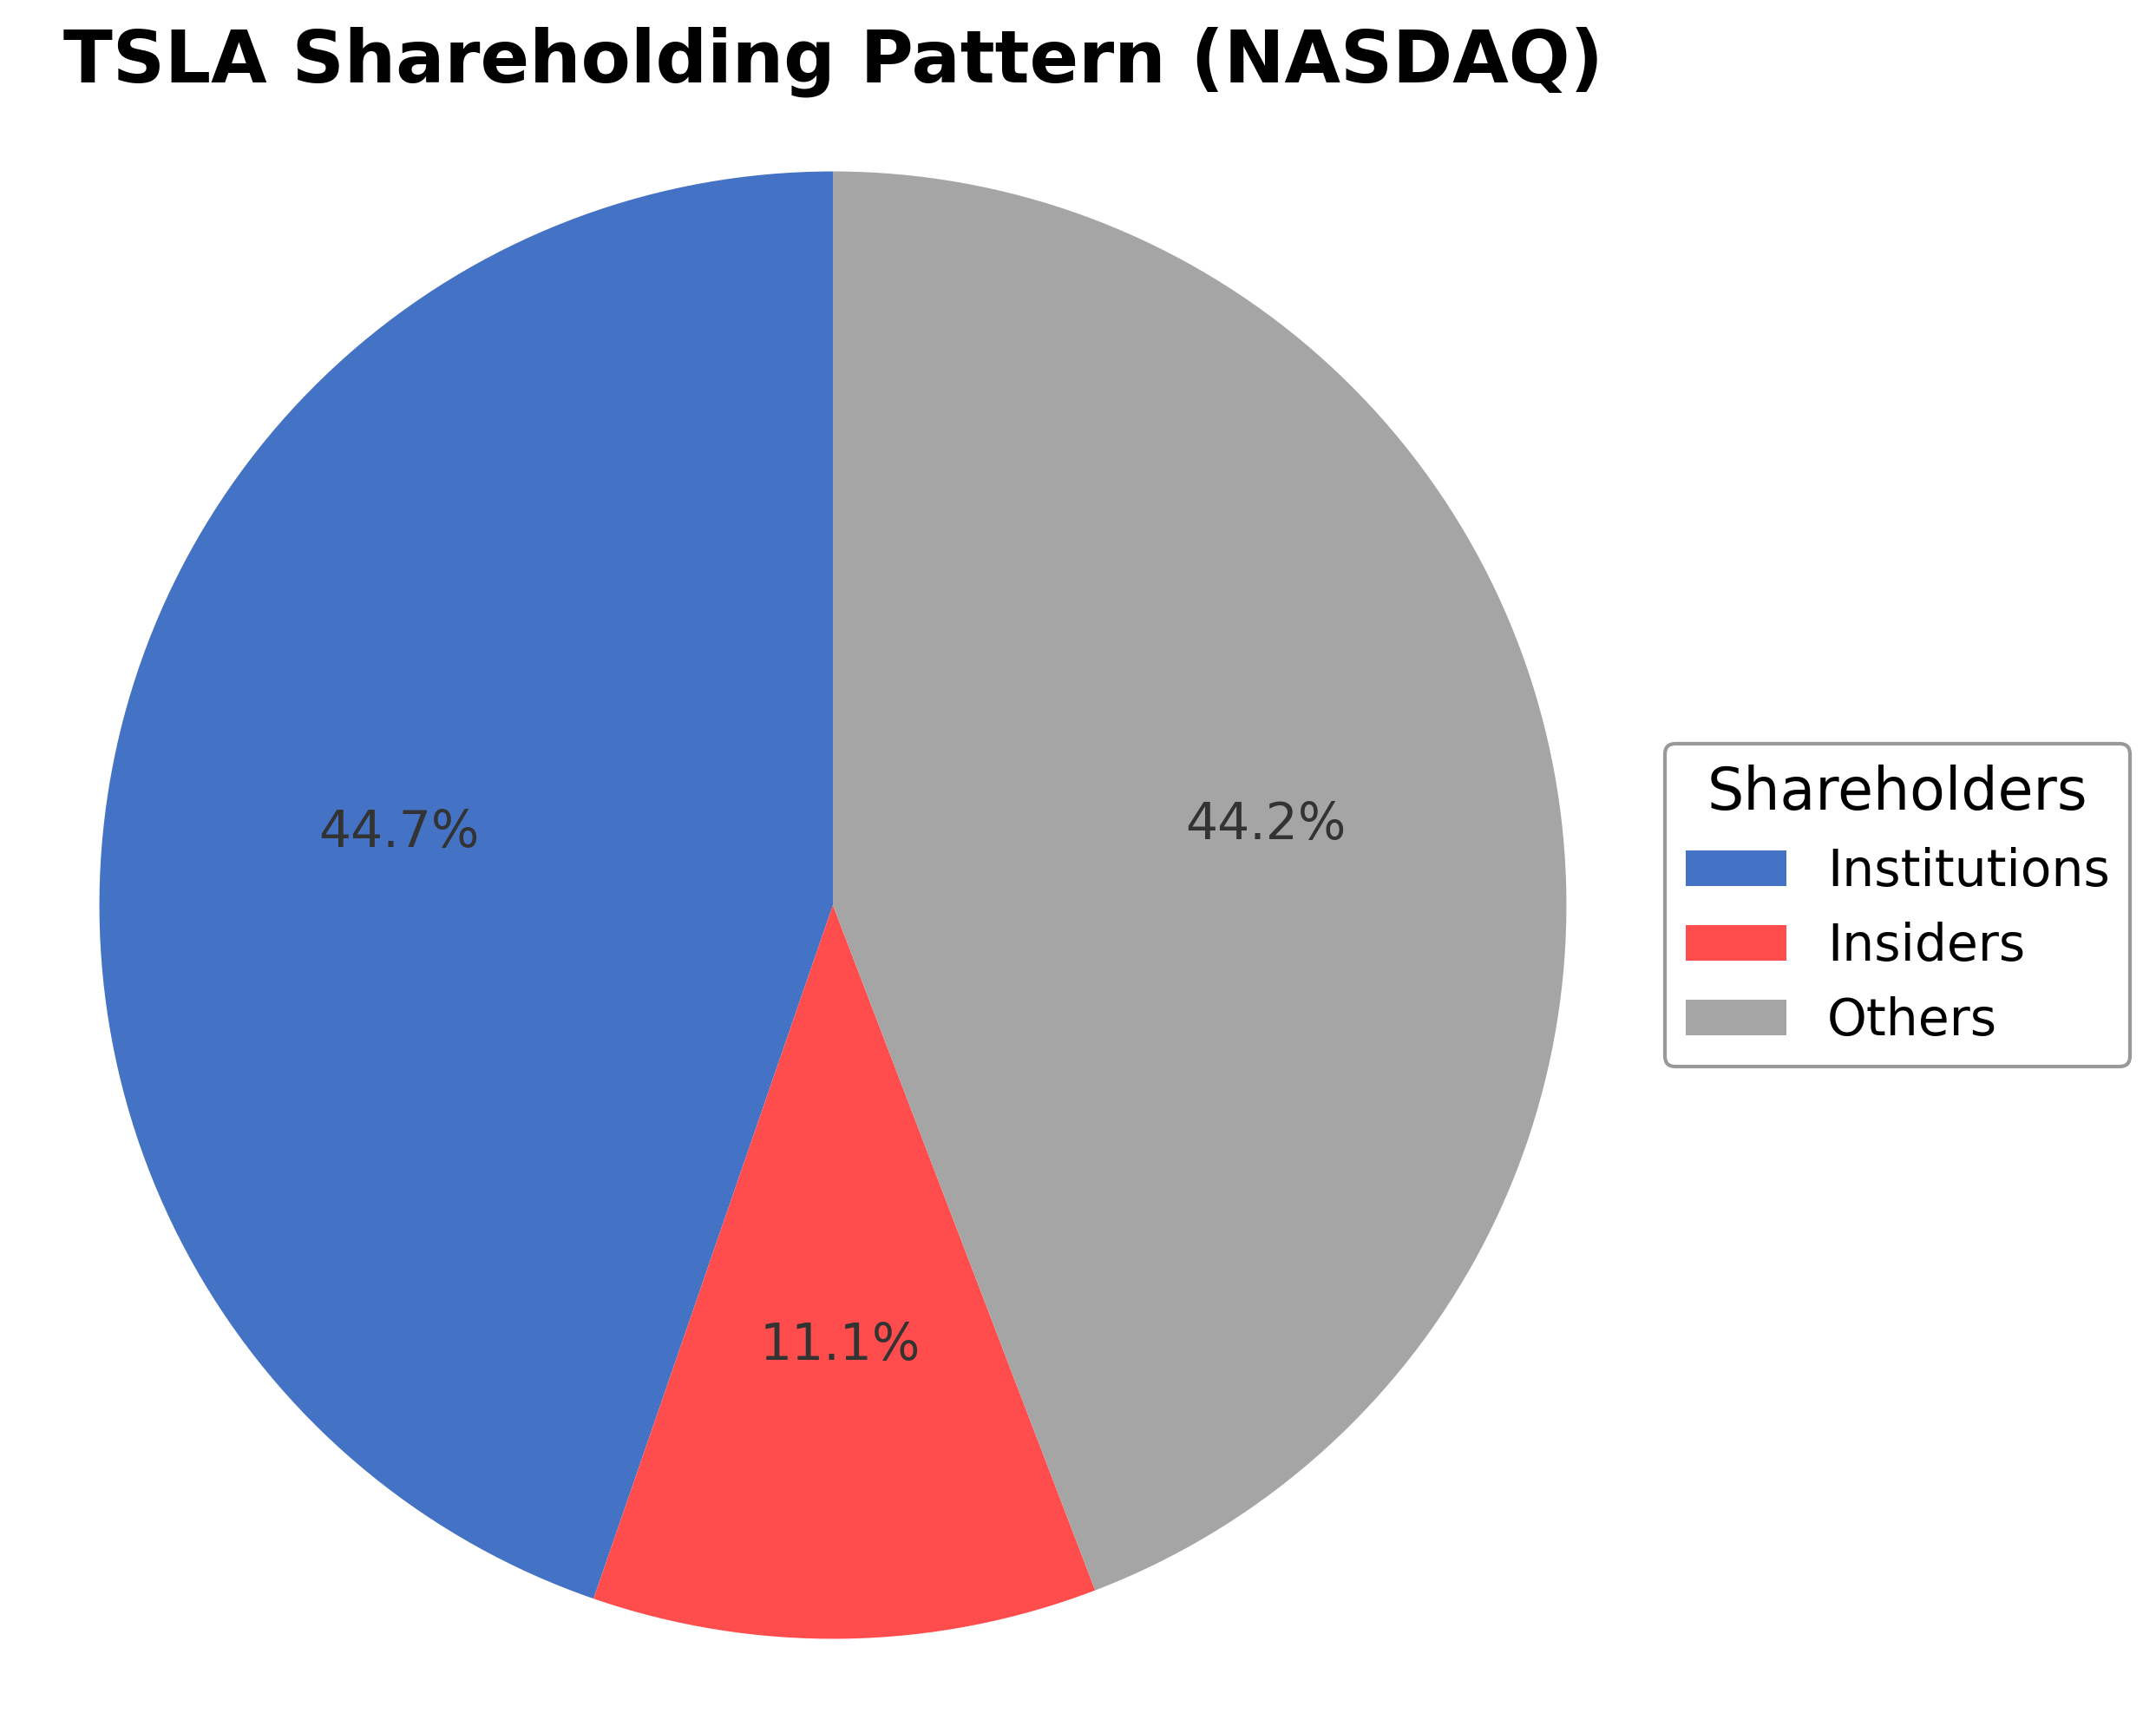
Tesla, Inc.'s ownership structure comprises approximately 11.11% held by insiders including executives and board members, 44.71% by institutional investors such as mutual funds and pension funds, and the remaining 44.18% by public shareholders including retail investors and employee stock plans. Over the past 12 to 24 months, institutional ownership has shown moderate accumulation, with notable increases from firms like DNB Asset Management AS, which recently raised its stake by 2.6%. This distribution reflects a balanced market sentiment with significant institutional confidence supporting governance and strategic initiatives. The ownership pattern suggests a stable governance framework with active institutional participation influencing Tesla's long-term corporate direction.
Sector and Industry Analysis
The electric vehicle (EV) sector is experiencing rapid expansion, with the global market valued at $468.69 billion in 2025 and projected to reach $1,224.70 billion by 2034, growing at a CAGR of 13.4%. Sales are expected to increase to 23.7 million units in 2025, representing 25.5% of the total vehicle market, with Battery Electric Vehicles (BEVs) dominating the installed base. Major players include Tesla, BYD, Volkswagen Group, and emerging startups like NIO and Rivian, while Chinese manufacturers are expanding globally through competitive pricing and localized production.
Industry trends highlight advancements in battery technology, such as lithium-ion improvements and emerging solid-state batteries, which are enhancing EV performance and reducing costs. Competition intensifies around charging infrastructure integration, software capabilities, and product affordability, with European brands focusing on cost efficiency to counter Chinese entrants. Barriers include supply chain constraints for critical materials like lithium and cobalt, as well as consumer concerns over charging availability and range anxiety, which continue to influence market dynamics.
The regulatory environment strongly supports EV adoption through government incentives, tax credits, and subsidies worldwide, accelerating market growth. Policies aimed at reducing carbon emissions and promoting sustainable transportation are driving demand, particularly in China, which is projected to hold 61% of the EV installed base by 2026. Future outlooks emphasize the importance of infrastructure development and emerging technologies like vehicle-to-grid systems, which could create new revenue streams and further integrate EVs into energy ecosystems.
Note: Analysis synthesized from industry research, market reports, and regulatory filings. Information is subject to change based on market conditions.
Financial Ratios Dashboard
Illustrative Scenario Analysis
DCF Assumptions:
Method: Two-Stage EPS-Priority Model
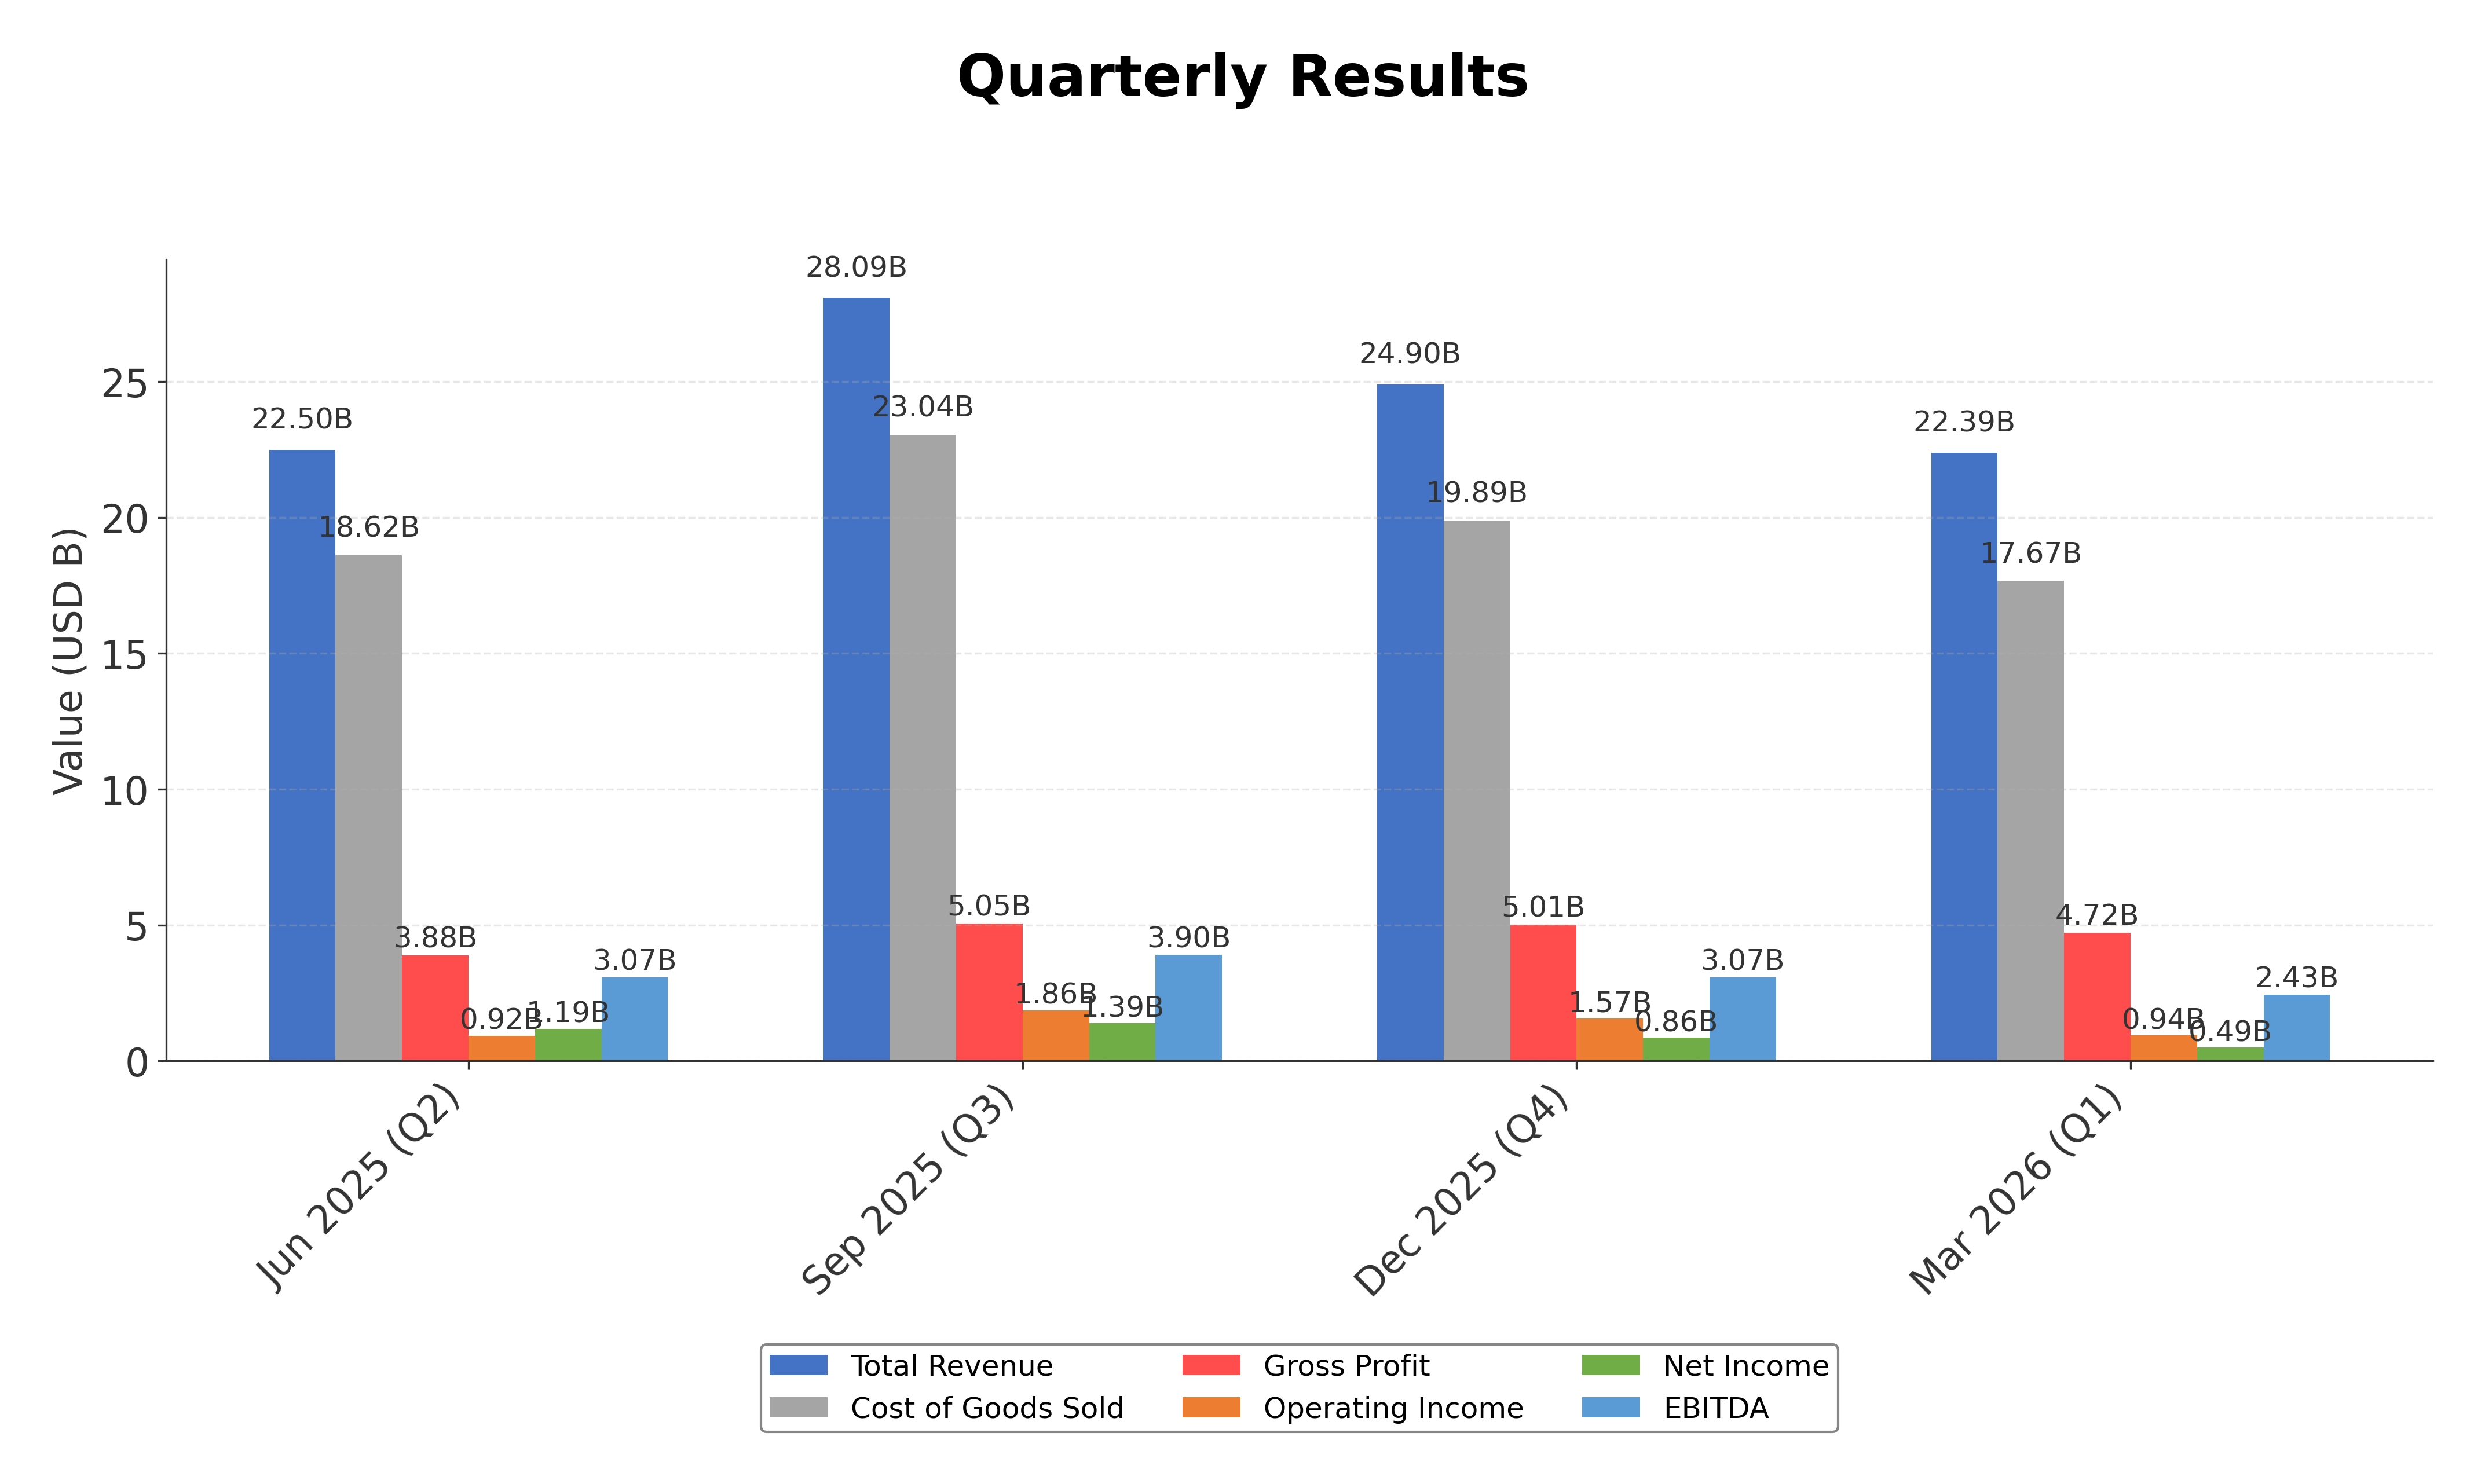
Financials
Peer Analysis
| Company Name | Market Cap | P/E Ratio | P/B Ratio | EV/EBITDA | Price to CFO |
|---|---|---|---|---|---|
| Tesla, Inc. | $1.59T | 383.85 | 19.28 | 140.41 | 95.95 |
| General Motors Company | $67.50B | 28.38 | 1.13 | 9.55 | 2.84 |
| Toyota Motor Corporation | $248.52B | 10.19 | 16.26 | 5.34 | 7.21 |
| Ferrari N.V. | $56.62B | 31.46 | 12.36 | 24.71 | 20.43 |
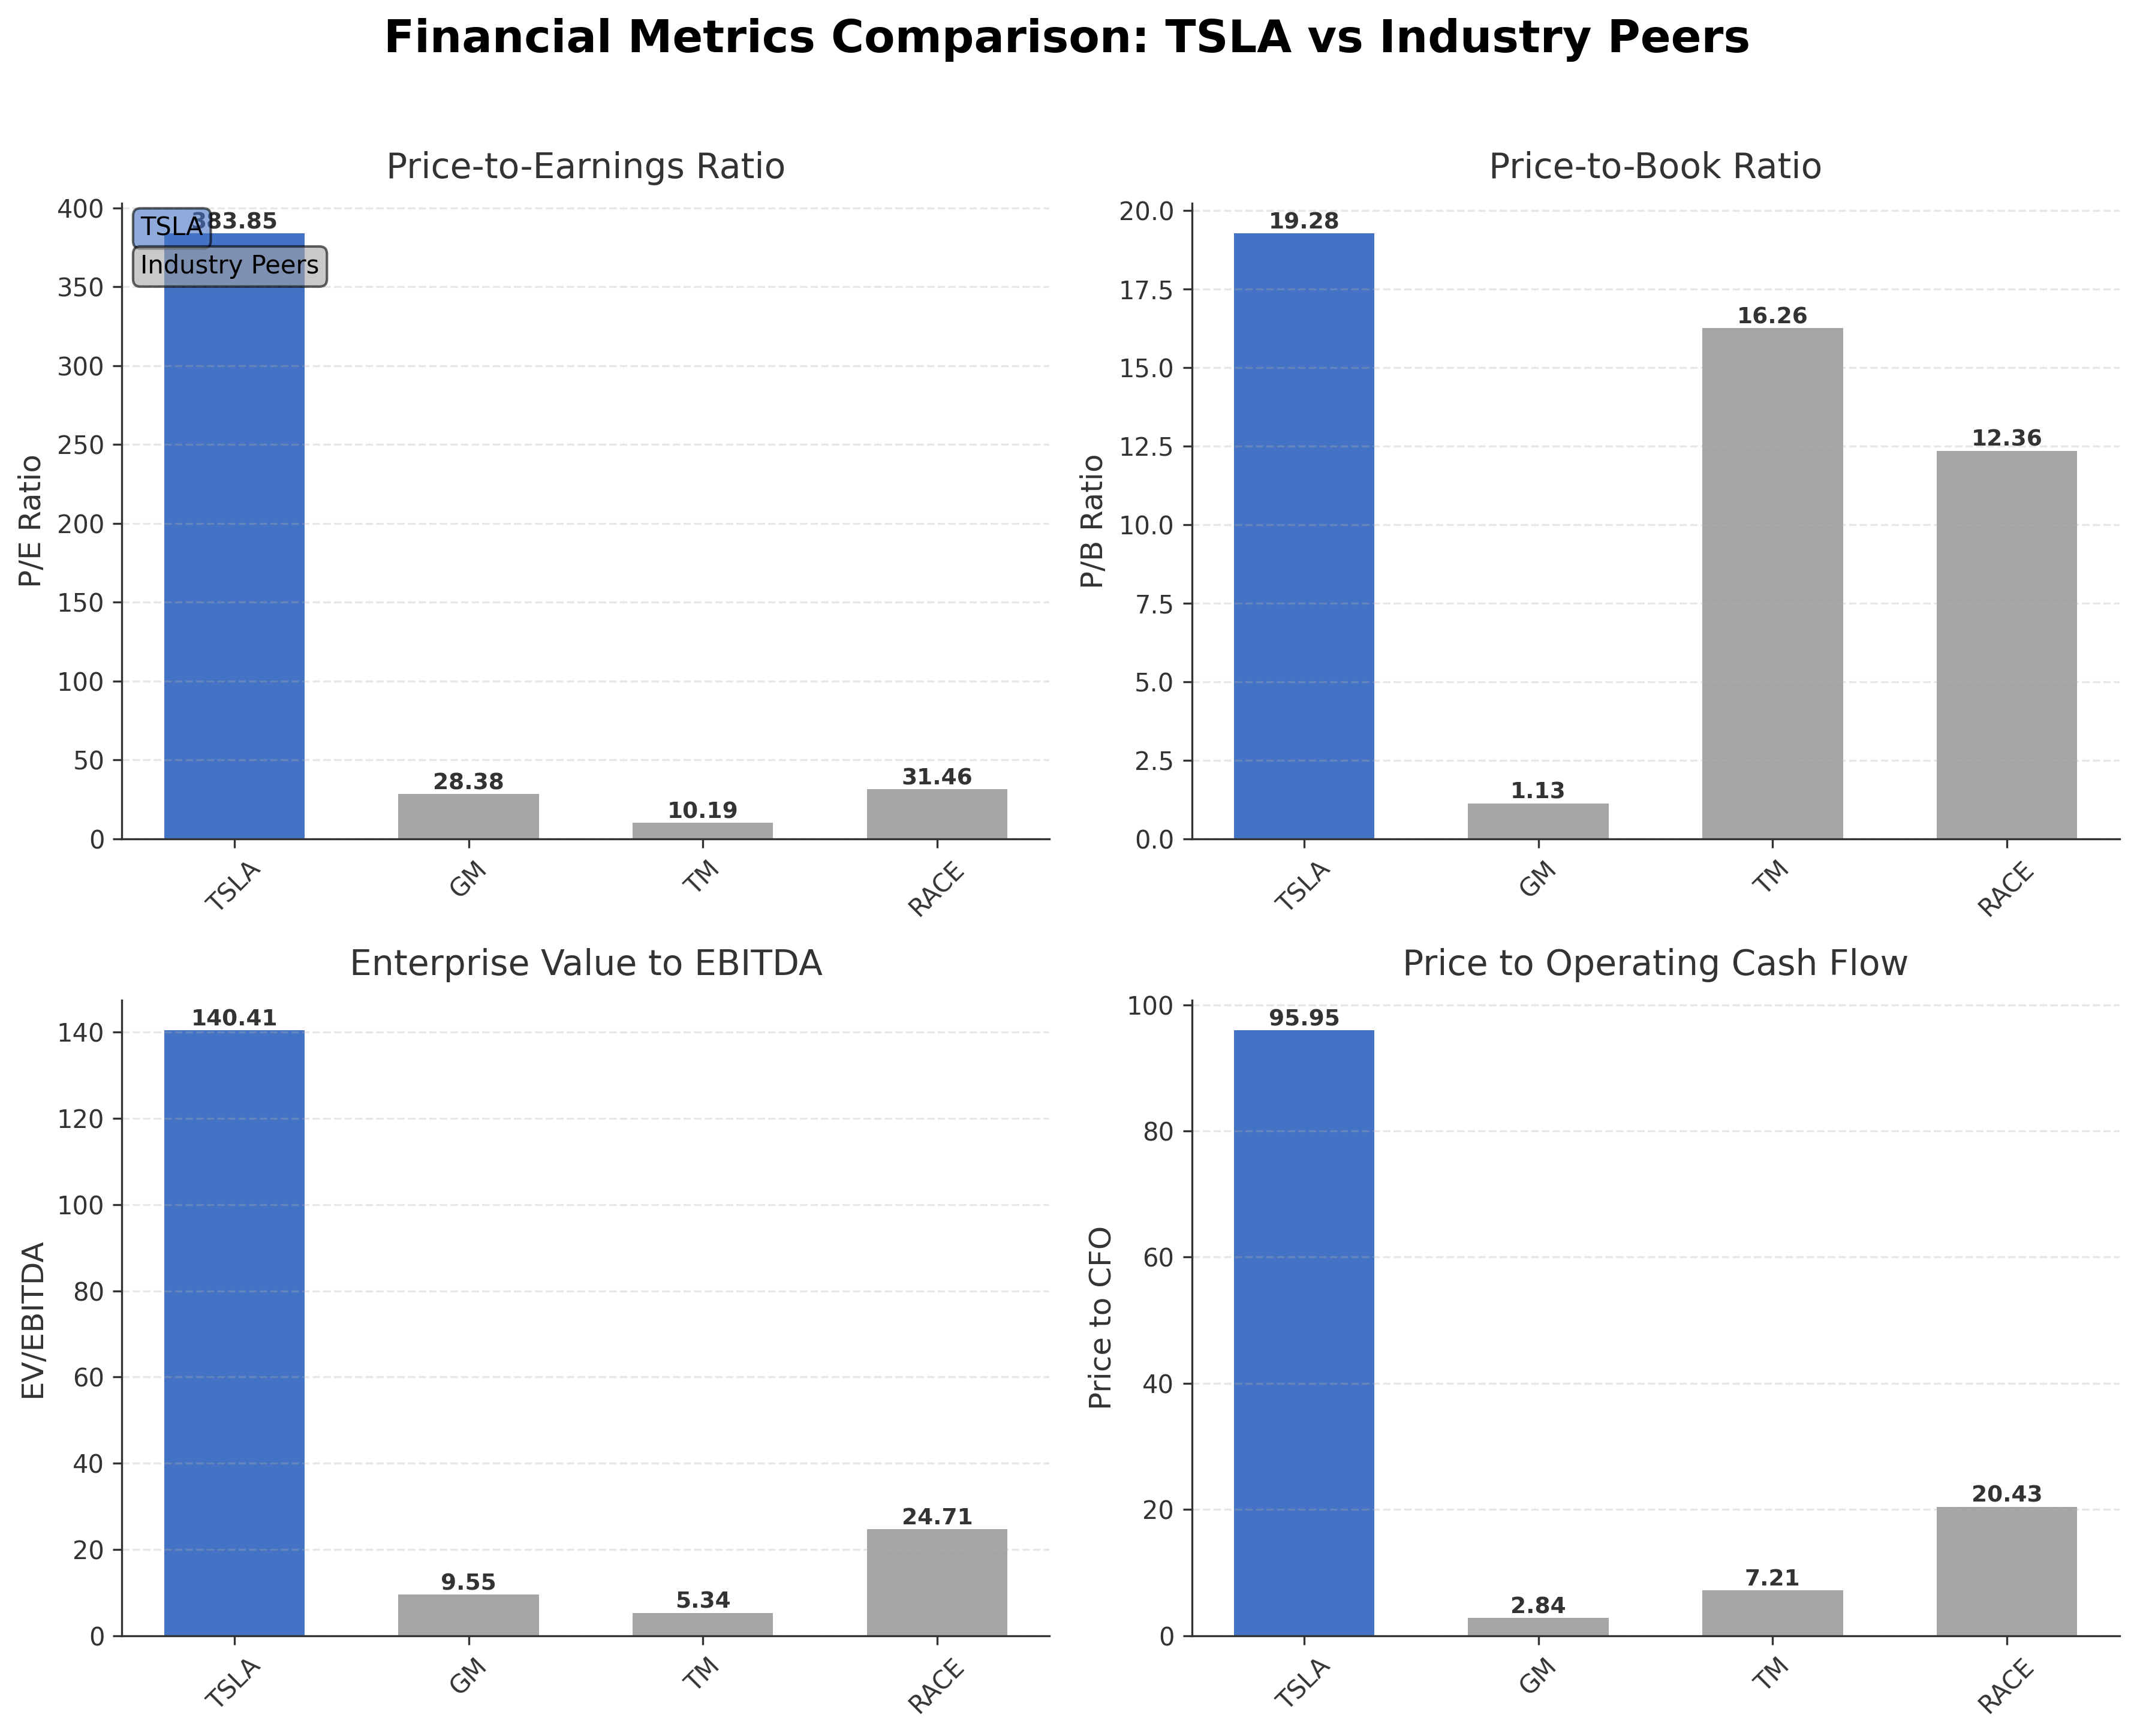
Comparison Analysis: Tesla, Inc. exhibits significantly higher valuation multiples compared to its industry peers, with a trailing P/E ratio of 383.85 versus General Motors at 28.38 and Toyota at 10.19, reflecting elevated market expectations for growth. Its price-to-book ratio of 19.28 also exceeds peers, indicating premium pricing relative to book value. Tesla's EV/EBITDA ratio of 140.41 is substantially above the peer range, highlighting a stretched valuation. Return on equity is modest at 0.05 compared to Ferrari's 0.42 and Toyota's 0.10, suggesting room for improvement in profitability metrics. Overall, Tesla stands out for its market capitalization and growth orientation but trades at a premium relative to traditional auto manufacturers.
Financial Metrics Comparison with Peers
Financial Statements
Comprehensive financial data including income, balance sheet, and cash flow metrics
Income Statement
| fiscal_date | 2025-12-31 | 2024-12-31 | 2023-12-31 | 2022-12-31 | 2021-12-31 |
|---|---|---|---|---|---|
| Sales | 94.83B | 97.69B | 96.77B | 81.46B | 53.82B |
| Cost Of Goods | 77.73B | 80.24B | 79.11B | 60.61B | 40.22B |
| Gross Profit | 17.09B | 17.45B | 17.66B | 20.85B | 13.61B |
| Operating Expense Research And Development | 6.41B | 4.54B | 3.97B | 3.08B | 2.59B |
| Operating Expense Selling General And Administrative | 5.83B | 5.15B | 4.80B | 3.95B | 4.52B |
| Operating Income | 4.85B | 7.76B | 8.89B | 13.83B | 6.50B |
| Non Operating Interest Income | 1.68B | 1.57B | 1.07B | 297.00M | 56.00M |
| Non Operating Interest Expense | 338.00M | 350.00M | 156.00M | 191.00M | 371.00M |
| Other Income Expense | -913.00M | 11.00M | 172.00M | -219.00M | 162.00M |
| Pretax Income | 5.28B | 8.99B | 9.97B | 13.72B | 6.34B |
| Income Tax | 1.42B | 1.84B | -5.00B | 1.13B | 699.00M |
| Net Income | 3.85B | 7.15B | 14.97B | 12.59B | 5.64B |
| Eps Basic | 1.18 | 2.23 | 4.73 | 4.02 | 1.87 |
| Eps Diluted | 1.08 | 2.04 | 4.31 | 3.62 | 1.63 |
| Basic Shares Outstanding | 3.22B | 3.22B | 3.17B | 3.13B | 2.96B |
| Diluted Shares Outstanding | 3.22B | 3.22B | 3.17B | 3.13B | 2.96B |
| Ebit | 5.62B | 9.34B | 10.13B | 13.91B | 6.71B |
| Ebitda | 12.26B | 15.39B | 14.80B | 17.83B | 9.60B |
| Net Income Continuous Operations | 3.85B | 7.15B | 14.97B | 12.59B | 5.64B |
| Minority Interests | -61.00M | -23.00M | 25.00M | -4.00M | -120.00M |
| Preferred Stock Dividends | N/A | N/A | N/A | N/A | -5.00M |
Source: Financial statements and regulatory filings
Balance Sheet
| fiscal_date | 2025-12-31 | 2024-12-31 | 2023-12-31 | 2022-12-31 | 2021-12-31 |
|---|---|---|---|---|---|
| Cash And Cash Equivalents | 16.51B | 16.14B | 16.40B | 16.25B | 17.58B |
| Accounts Receivable | 4.58B | 4.42B | 3.51B | 2.95B | 1.91B |
| Total Assets | 137.80B | 122.08B | 106.62B | 82.34B | 62.13B |
| Total Liabilities | 54.94B | 48.39B | 43.01B | 36.44B | 30.55B |
| Long Term Debt | 12.12B | 10.36B | 6.53B | 3.76B | 6.92B |
| Shareholders Equity | 82.86B | 73.68B | 63.61B | 45.90B | 31.58B |
Source: Financial statements and regulatory filings
Cash Flow Statement
| fiscal_date | 2025-12-31 | 2024-12-31 | 2023-12-31 | 2022-12-31 | 2021-12-31 |
|---|---|---|---|---|---|
| Operating Activities Net Income | 3.85B | 7.15B | 14.97B | 12.59B | 5.64B |
| Operating Activities Depreciation | 6.15B | 5.37B | 4.67B | 3.75B | 2.91B |
| Operating Activities Deferred Taxes | 123.00M | 477.00M | -6.35B | -196.00M | -149.00M |
| Operating Activities Stock Based Compensation | 2.83B | 2.00B | 1.81B | 1.56B | 2.12B |
| Operating Activities Other Non Cash Items | 272.00M | 172.00M | 81.00M | 340.00M | 245.00M |
| Operating Activities Accounts Receivable | -261.00M | -1.08B | -586.00M | -1.12B | -130.00M |
| Operating Activities Accounts Payable | 4.38B | 3.59B | 2.60B | 8.03B | 5.37B |
| Operating Activities Other Assets Liabilities | -292.00M | 849.00M | -1.61B | -5.00B | -2.55B |
| Operating Activities Operating Cash Flow | 17.05B | 18.52B | 15.59B | 19.94B | 13.46B |
| Investing Activities Capital Expenditures | -8.53B | -11.34B | -8.90B | -7.16B | -6.51B |
| Investing Activities Net Acquisitions | 0.00 | 0.00 | -64.00M | 0.00 | 0.00 |
| Investing Activities Purchase Of Investments | -37.11B | -35.95B | -19.11B | -5.83B | -132.00M |
| Investing Activities Sale Of Investments | 30.16B | 28.51B | 12.49B | 22.00M | 0.00 |
| Investing Activities Investing Cash Flow | -15.48B | -18.79B | -15.58B | -12.90B | -6.64B |
| Financing Activities Long Term Debt Issuance | 5.59B | 5.74B | 3.93B | 0.00 | 8.88B |
| Financing Activities Long Term Debt Payments | -5.65B | -2.88B | -1.81B | -3.87B | -14.62B |
| Financing Activities Other Financing Charges | 17.00M | -251.00M | -227.00M | -202.00M | -178.00M |
| Financing Activities Financing Cash Flow | -47.00M | 2.61B | 1.89B | -4.07B | -5.91B |
| End Cash Position | 17.62B | 17.04B | 17.19B | 16.92B | 18.14B |
| Interest Paid | 292.00M | 277.00M | 126.00M | 152.00M | 266.00M |
| Free Cash Flow | 6.22B | 3.58B | 4.36B | 7.55B | 3.48B |
| Investing Activities Net Intangibles | N/A | 0.00 | 0.00 | 927.00M | -1.23B |
| Income Tax Paid | N/A | 1.33B | 1.12B | 1.20B | 561.00M |
| Investing Activities Other Investing Activity | N/A | N/A | N/A | 76.00M | 6.00M |
| Financing Activities Common Stock Issuance | N/A | N/A | N/A | 0.00 | 0.00 |
Source: Financial statements and regulatory filings
Technical Analysis
Key Insights
- The current trend shows Tesla's price consolidating near the $420 level with recent volatility reflecting mixed investor sentiment.
- Key support levels are identified near $386 (50-day moving average) and $273 (52-week low), while resistance is observed around $498 (52-week high).
- The stock price is currently below the 200-day moving average of $407.40 but above the 50-day moving average of $386.78, indicating short-term strength amid longer-term caution.
- Momentum indicators show the Relative Strength Index (RSI) in a neutral range, MACD signals a potential weakening of upward momentum, and Stochastic oscillators suggest possible consolidation.
- Across daily, weekly, and monthly timeframes, Tesla exhibits mixed signals with short-term consolidation and longer-term trend uncertainty.
- Potential market scenarios include a continuation of sideways movement within the established trading range or a breakout/breakdown depending on upcoming earnings and regulatory news.
Trending News
1. Headline: The Semi May Be a Huge Deal for Trucking, Tesla Stock (NASDAQ:TSLA) Plunges - TipRanks.com
Summary: Electric vehicle giant Tesla ($TSLA) did not have a great day yesterday. In fact, Tesla stock was down nearly 4.5% in Friday’s trading. But there may be a silver li...
Sentiment: negative
2. Headline: Tesla raises prices of Model Y cars in the US for the first time in two years | Reuters
Summary: The company did not offer a reason for the increase.
Sentiment: positive
3. Headline: Assessing Whether Tesla (TSLA) Still Looks Undervalued After Recent Share Price Pullback - Simply Wall St News
Summary: If Tesla is only one piece of your watchlist, you may want to broaden your scope with a few focused stock ideas that could help sharpen your overall portfolio. Target potential mispricings by reviewing 50 high quality undervalued stocks that combine solid fundamentals with room for the market to reassess them. Strengthen your income ...
Sentiment: negative
4. Headline: Tesla, Inc. $TSLA Shares Acquired by DNB Asset Management AS
Summary: DNB Asset Management AS lifted its position in shares of Tesla, Inc. (NASDAQ:TSLA - Free Report) by 2.6% during the fourth quarter, according to the company in its most recent Form 13F filing with the Securities & Exchange Commission. The firm owned 828,629 shares of the electric vehicle produc
Sentiment: positive
5. Headline: Tesla CFO Vaibhav Taneja sells $1.35m in stock By Investing.com
Summary: This indirect ownership includes 55,500 shares held in Grantor Retained Annuity Trusts (GRATs) for which Mr. Taneja serves as a trustee, and another 55,500 shares held in GRATs for which his spouse is a trustee. For deeper insights into Tesla’s financial health and executive compensation trends, investors can access the comprehensive Pro Research Report available on InvestingPro. In other recent news...
Sentiment: neutral
Recent Updates
News Summary
As of 2026-05-16. Tesla is navigating a complex environment marked by mixed financial results and strategic developments. The company reported a 16% revenue increase in Q1 2026 compared to the prior year, with automotive segment revenue rising to $16.2 billion. Institutional investors like DNB Asset Management AS have increased their holdings, signaling confidence in Tesla's prospects. However, challenges persist in regulatory approvals for Full Self-Driving technology in China, contributing to stock price volatility. Leadership transactions, including stock sales by CFO Vaibhav Taneja, reflect routine portfolio adjustments. Overall, Tesla continues to balance growth initiatives with external pressures in a competitive and evolving market.
News Sentiment
The overall sentiment from recent updates is mixed, with positive indicators such as revenue growth and institutional accumulation tempered by regulatory challenges and stock price declines. Positive news includes price increases for Model Y and increased institutional ownership, while negative sentiment arises from stalled FSD progress in China and notable stock price drops. Insider stock sales contribute a neutral tone, reflecting standard executive activity rather than directional signals. This blend of factors results in a balanced outlook emphasizing both opportunity and caution.
Source List
- https://www.marketbeat.com/instant-alerts/filing-tesla-inc-tsla-shares-acquired-by-dnb-asset-management-as-2026-05-16/
- https://www.investing.com/news/insider-trading-news/tesla-cfo-vaibhav-taneja-sells-135m-in-stock-93CH-4694278
- https://ts2.tech/en/tesla-stock-drops-today-as-china-fsd-hopes-stall-after-trump-xi-summit/
- https://www.tipranks.com/news/the-semi-may-be-a-huge-deal-for-trucking-tesla-stock-nasdaqtsla-plunges
Analytical Overview
Analysis Summary
Tesla's valuation metrics, including a trailing P/E of 383.85 and forward P/E of 167.95, are significantly higher than industry averages, reflecting elevated growth expectations but also premium pricing. The company's revenue growth rate of 15.8% and positive cash flow trends demonstrate a strong growth trajectory supported by expanding sales and operational efficiency. Financial health appears solid with a manageable debt-to-equity ratio of 18.7% and substantial cash reserves exceeding $44 billion, providing liquidity for ongoing investments. Sector-specific challenges include regulatory scrutiny on autonomous driving technology and competitive pressures from legacy automakers and new entrants in the EV space. Given Tesla's U.S. market positioning and innovation leadership, competitive advantages remain, though regulatory and geopolitical risks require monitoring.
Overall Business and Market Assessment
Supporting Factors: No data
Risk Factors: high valuation multiples that may limit upside, regulatory uncertainties particularly related to Full Self-Driving technology, and competitive dynamics in the automotive sector
SWOT Analysis
Strengths
- Market leadership in electric vehicles and renewable energy solutions.
- Strong cash position with $44.7 billion in total cash and equivalents.
- Robust revenue growth of 15.8% year-over-year.
- Extensive global manufacturing footprint with multiple Gigafactories.
Weaknesses
- Extremely high valuation multiples indicating premium pricing.
- Modest net profit margin of 3.95% compared to industry peers.
- Dependence on regulatory approvals for Full Self-Driving technology.
- Relatively low return on equity at 4.90%.
Opportunities
- Expansion of energy storage and solar product markets.
- Growth potential in autonomous driving and robotaxi services.
- Increasing institutional investor interest and share accumulation.
- Potential new product launches such as the Cybertruck and Semi.
Threats
- Regulatory scrutiny and investigations impacting product deployment.
- Intensifying competition from established automakers and startups.
- Geopolitical risks affecting supply chains, especially in China.
- Market volatility influenced by macroeconomic conditions.
Company Description
Tesla, Inc. is a leading manufacturer of electric vehicles and energy storage solutions. The company designs and produces a diverse lineup of vehicles, including the Model S sedan, Model 3 compact car, Model X SUV, Model Y crossover, and the Cybertruck. Beyond automotive manufacturing, Tesla operates Gigafactories worldwide that produce batteries and components for its vehicles and energy products. The company also develops and deploys battery energy storage systems for residential, commercial, and utility-scale applications through Tesla Energy. Additionally, Tesla provides solar panel installation and related renewable energy services. The company serves individual consumers, commercial enterprises, and utility operators globally through direct-to-consumer sales channels and partnerships. Headquartered in Austin, Texas, Tesla has established itself as a prominent player in the transition toward sustainable transportation and renewable energy infrastructure.