
Tci Express Ltd (TCIEXP)
Stock Analysis Report
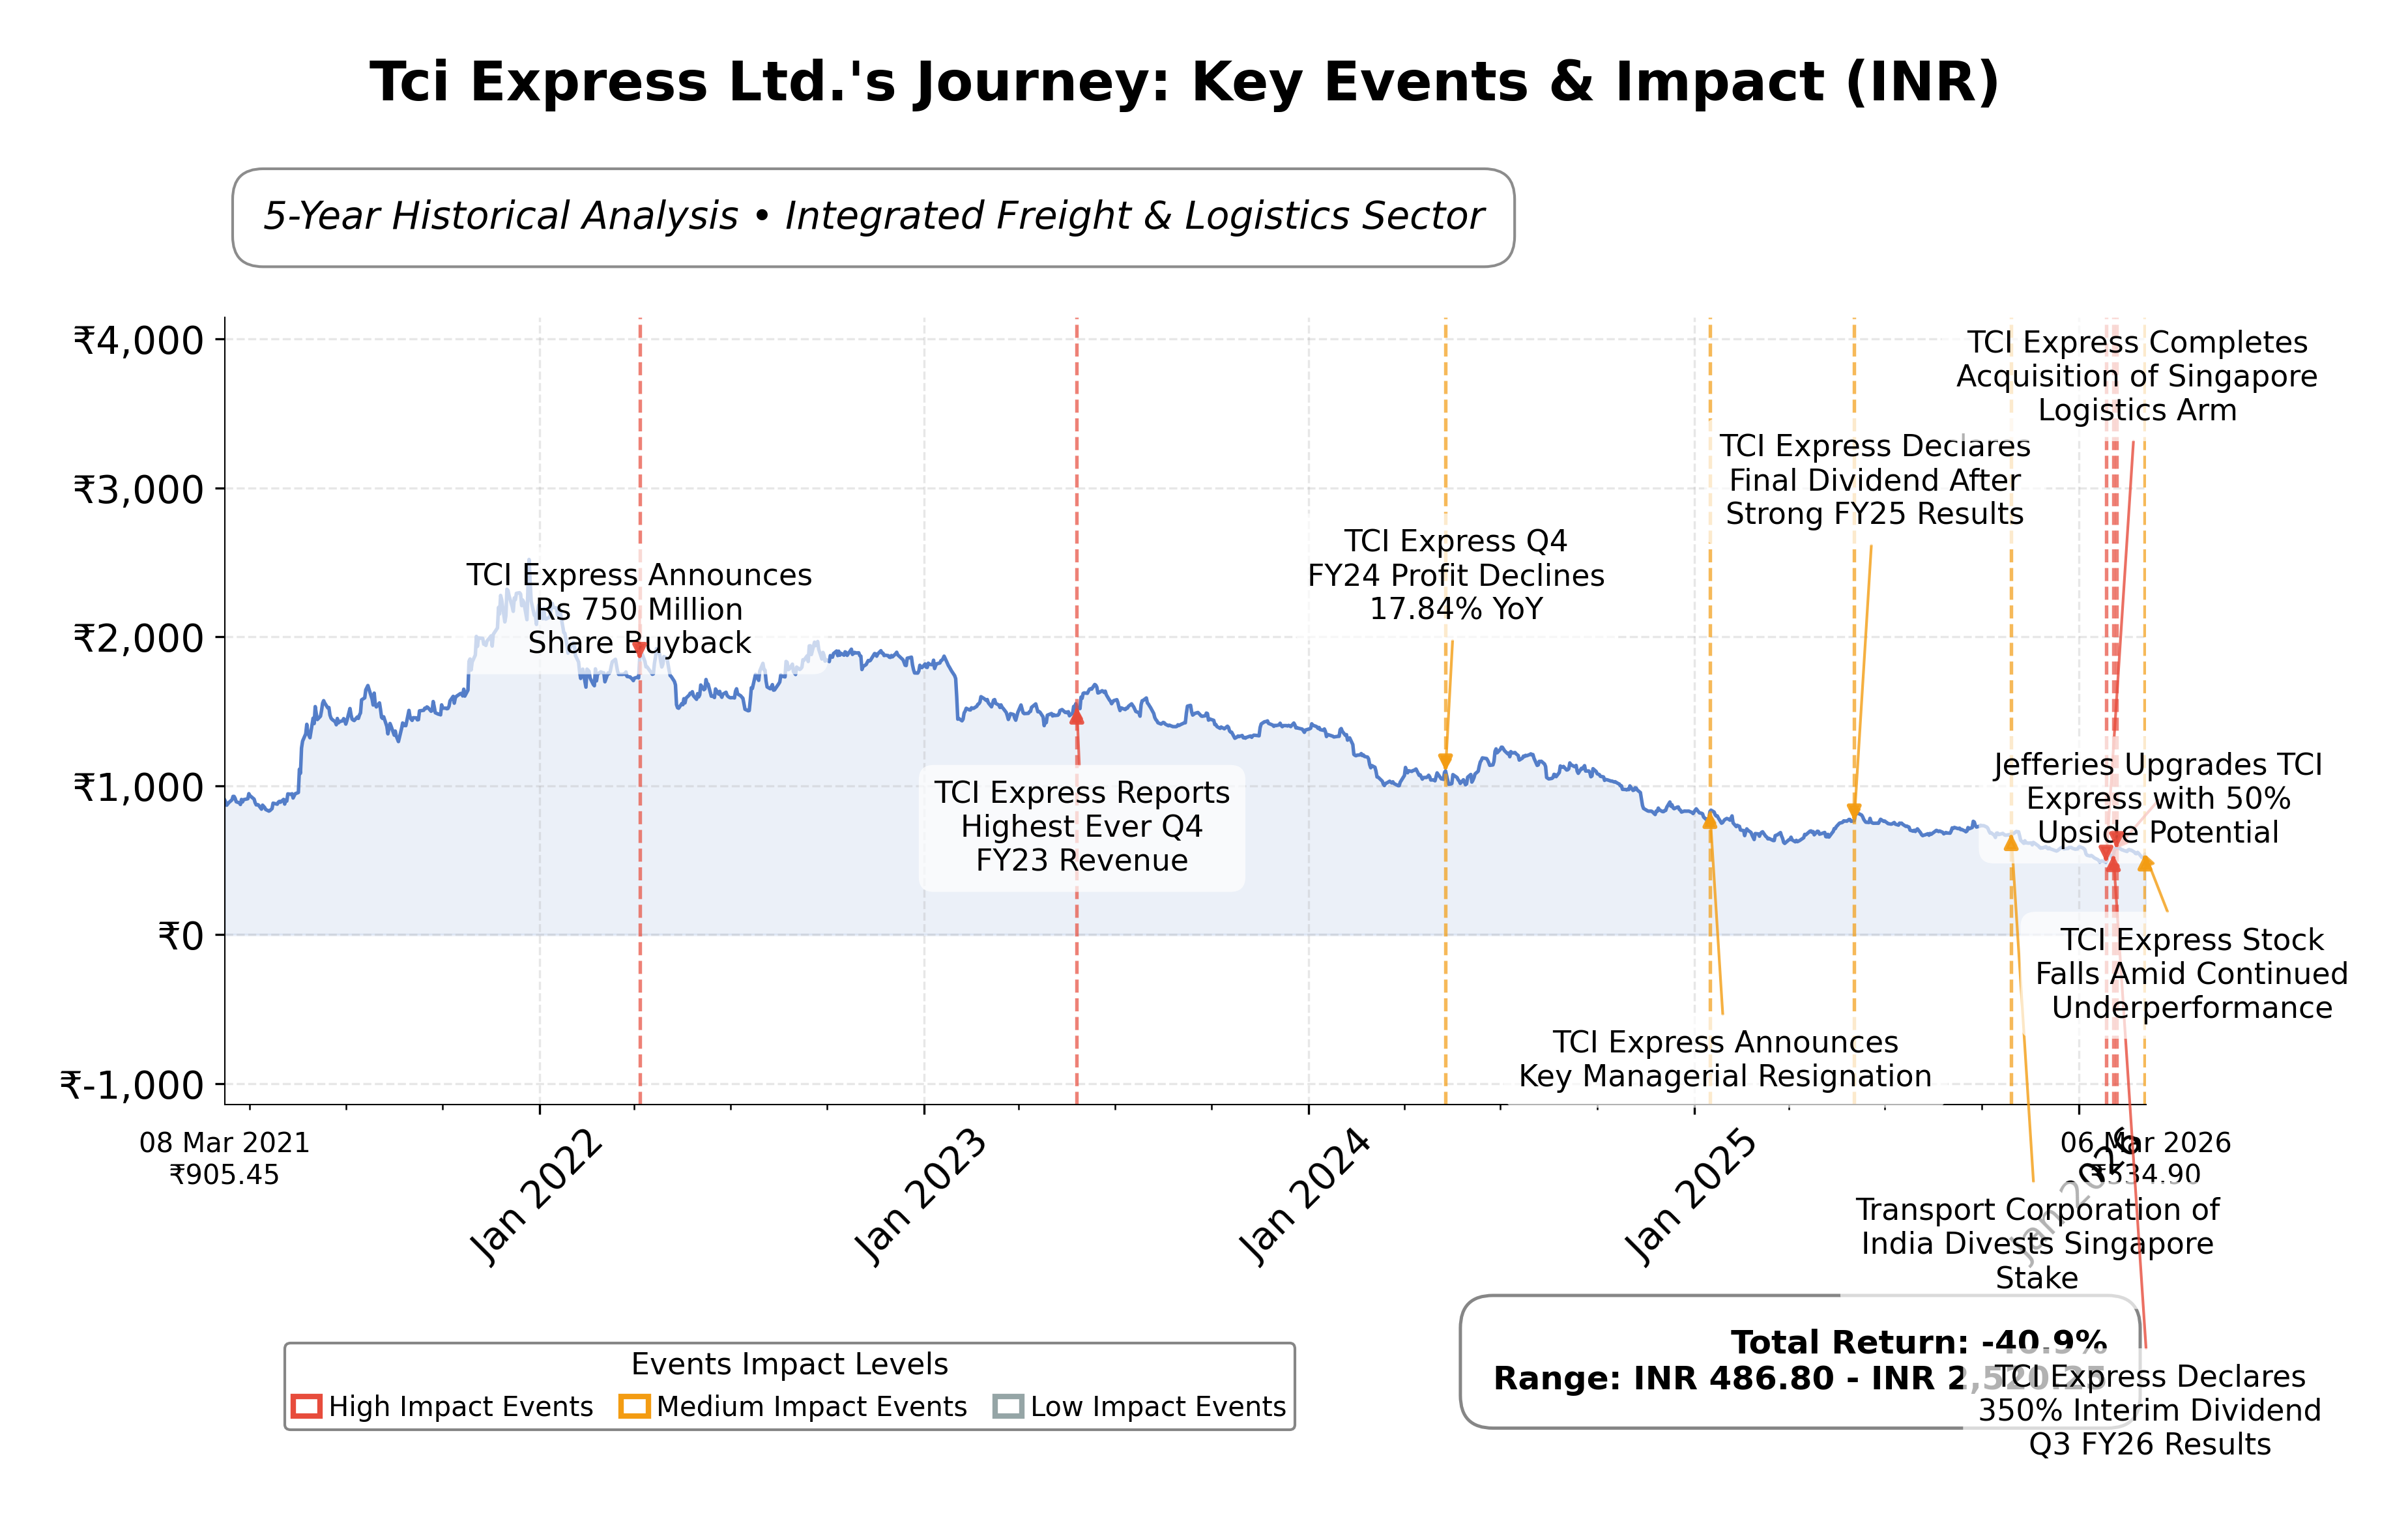
Stock Journey
Key Positives and Key Risks
Pros
- Revenue growth of 5.9% quarterly indicates stable business expansion.
- Strong liquidity with a current ratio of 3.38 and cash reserves of ₹1.62 billion supports operational flexibility.
- Forward P/E of 17.06 suggests market expectations of earnings improvement.
Cons
- Stock price shows a downside risk of 36.98% from its 52-week high, reflecting significant volatility.
- Negative PEG ratio (-2.12) indicates uncertain or negative earnings growth relative to price.
- Institutional ownership is relatively low at 9.9%, which may limit broader market support.
Disclosure: This information is for general awareness and does not constitute investment advice
Report Summary
Tci Express Ltd. operates as a key player in India's integrated freight and logistics industry, specializing in express delivery services. The company leverages an extensive network across urban and rural areas to serve sectors such as e-commerce, consumer goods, and pharmaceuticals. Its emphasis on technological integration enhances operational efficiency and customer transparency, positioning it as a vital logistics provider amid growing demand for rapid supply chain solutions.
Financially, Tci Express Ltd. reported a trailing twelve-month revenue of approximately â¹12.17 billion with a profit margin near 7%. The stock trades at a trailing P/E of 24.45 and a forward P/E of 17.06, indicating valuation compression relative to expected earnings growth. The company maintains a strong balance sheet with a current ratio above 3.3 and a low debt level relative to equity. Dividend yield stands at about 2.8%, supported by a payout ratio of 22.8%, reflecting prudent capital allocation.
From a strategic perspective, the company exhibits steady revenue growth of 5.9% quarterly and a return on equity of 11.2%. Recent market activity shows volatility with price fluctuations and shifts in valuation metrics. Insider ownership remains high at approximately 72%, while institutional holdings are modest near 9.9%. Key risks include sector headwinds and geopolitical uncertainties affecting logistics, while strengths lie in operational scale and cash flow generation.
Peer comparison within the Indian logistics sector reveals that Tci Express Ltd. is smaller in market capitalization relative to Blue Dart Express and Delhivery Ltd., with a more moderate P/E ratio and lower EV/EBITDA multiple. Its return on equity is competitive but slightly below some peers. These metrics suggest a relatively balanced valuation profile compared to larger, more richly valued competitors, reflecting its niche positioning and growth trajectory.
Navigating a dynamic logistics landscape, Tci Express Ltd. has achieved notable operational milestones and maintains a solid financial foundation. Challenges such as market volatility and competitive pressures persist, making strategic execution critical. The company stands at a pivotal juncture where its ability to capitalize on e-commerce growth and operational efficiencies will influence future performance. Evaluating the current data suggests a stance that may favor monitoring developments closely while considering the evolving market context.
Company and Industry Overview
Company Basics
Price Performance
Company Size
Shareholding Pattern
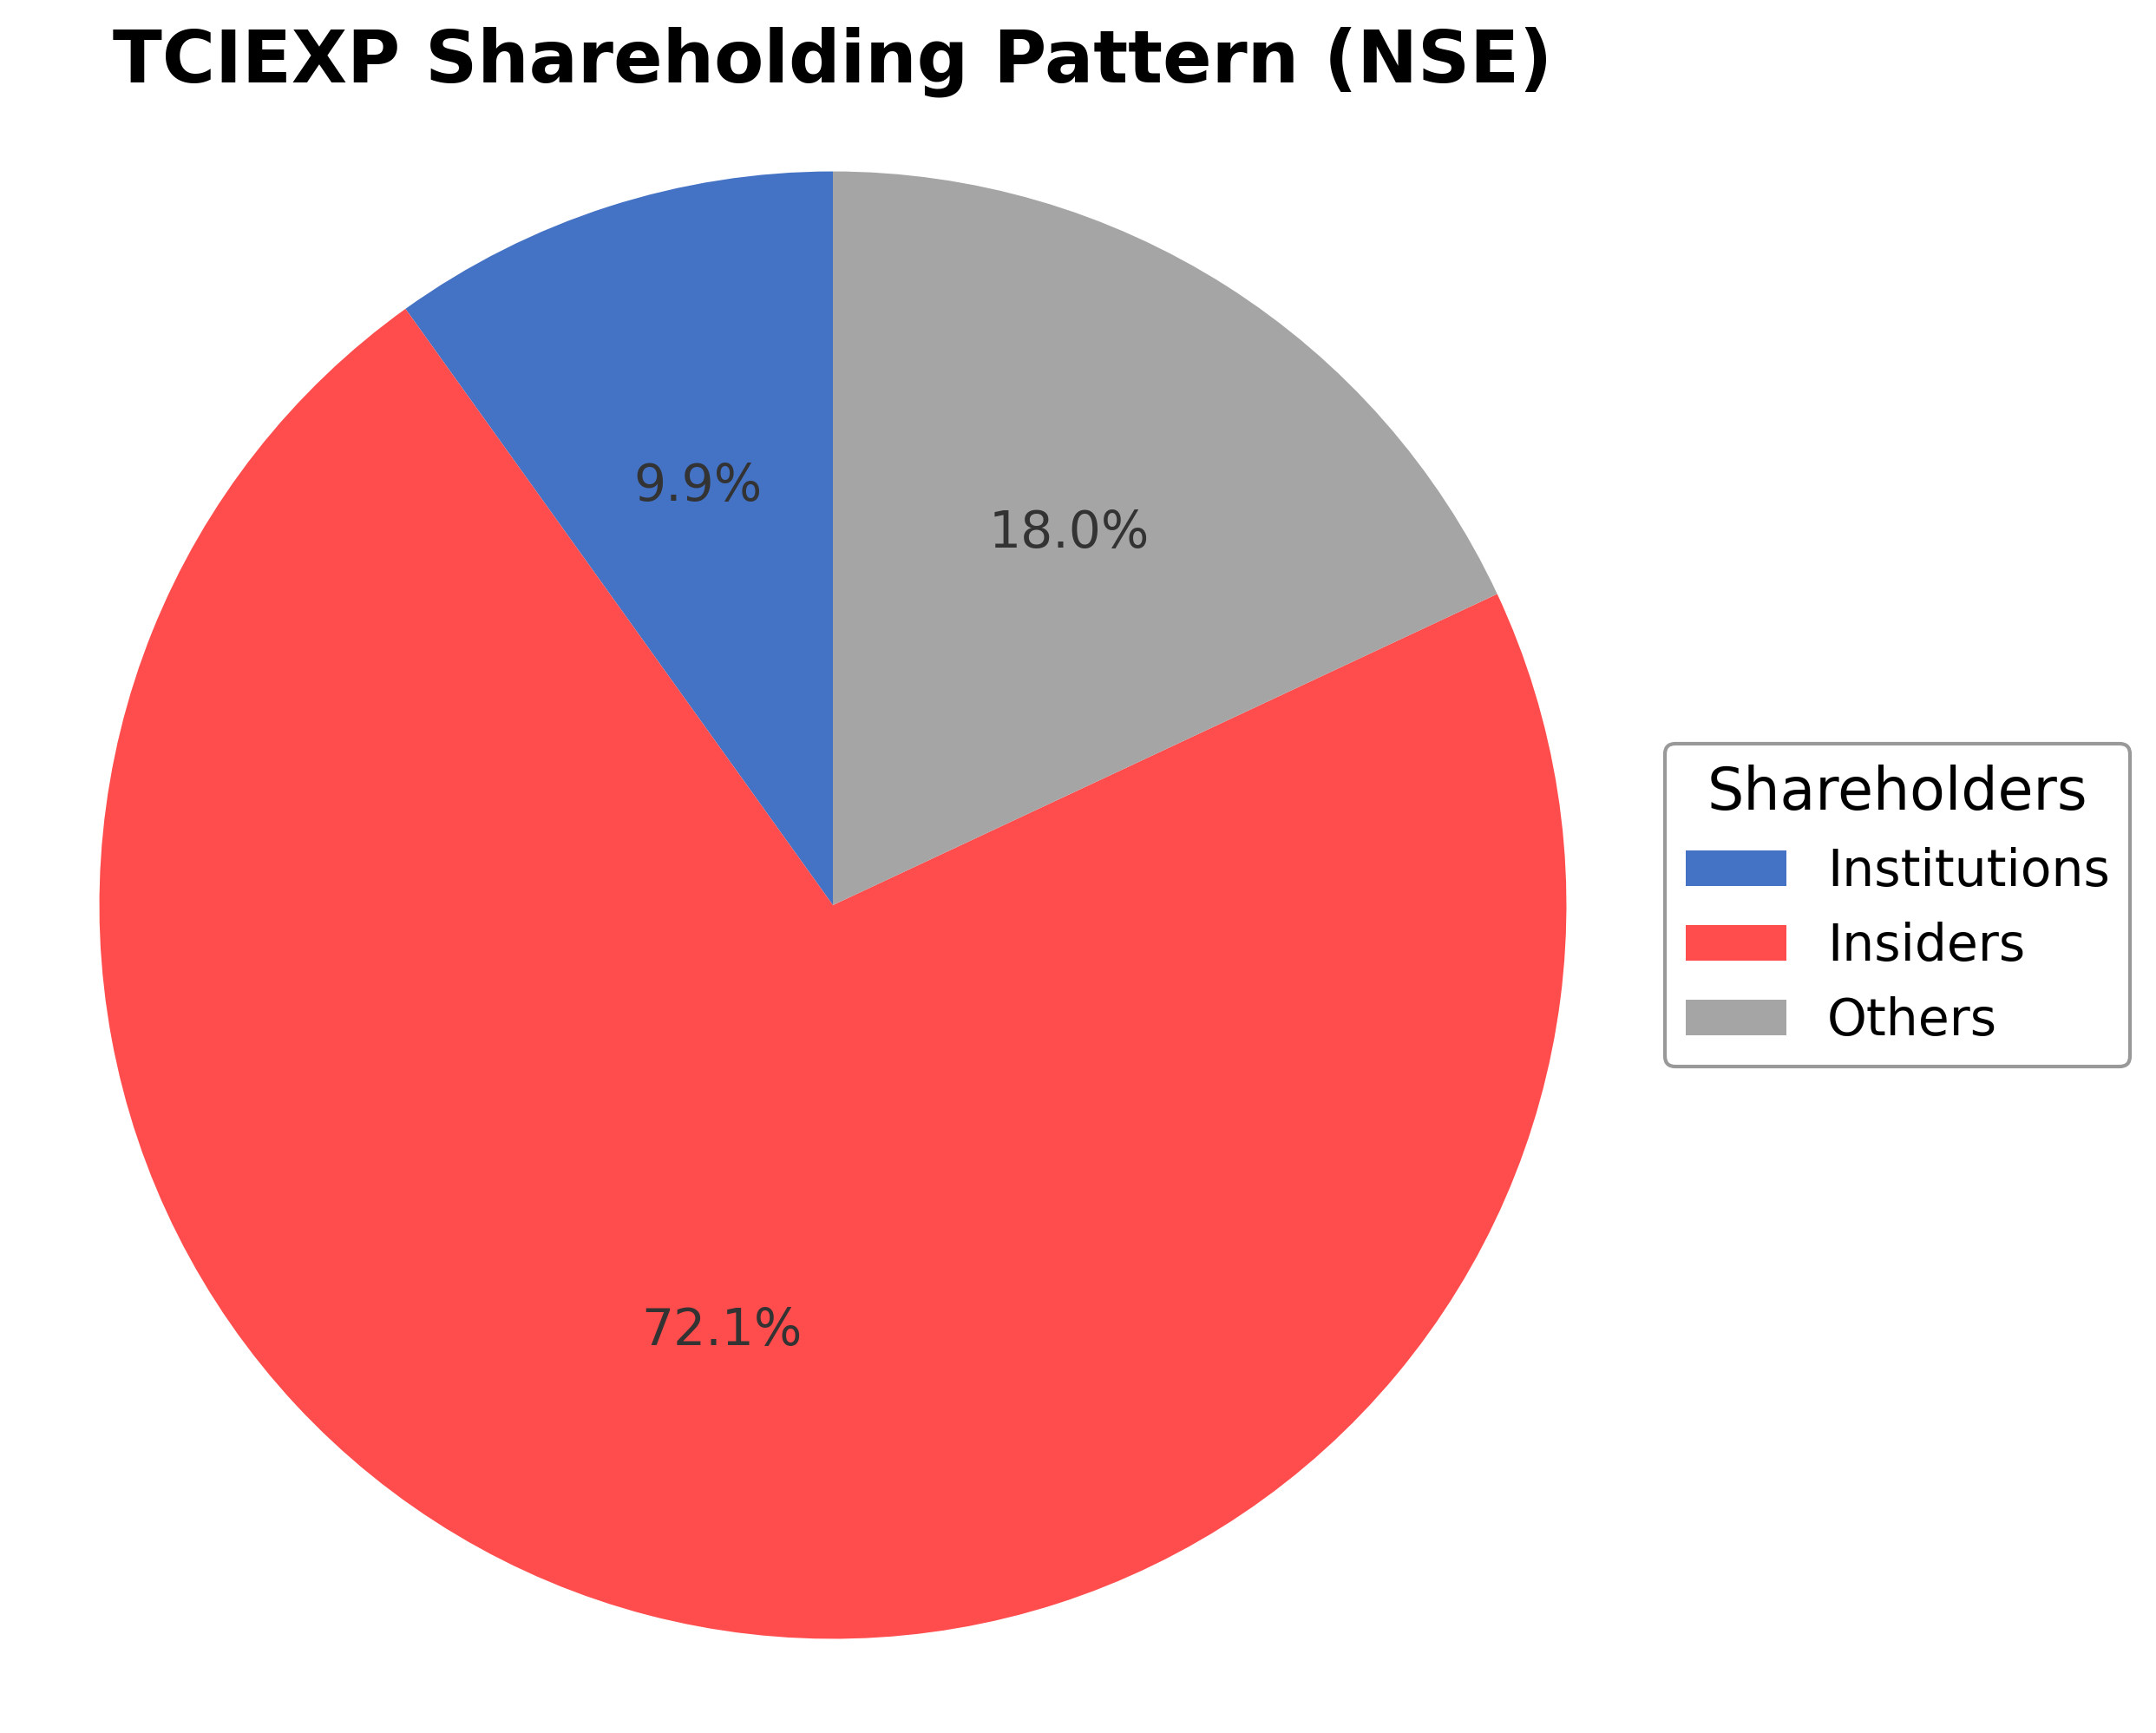
Tci Express Ltd.'s ownership structure is dominated by insiders, holding approximately 72.07% of shares, reflecting significant control by executives and board members. Institutional investors account for about 9.90%, indicating moderate participation by mutual funds and asset managers. The remaining 18.03% is held by public shareholders, including retail investors and employee stock plans. Over the past 12 to 24 months, insider ownership has remained stable with no significant dilution, while institutional holdings have shown modest fluctuations without major accumulation or distribution trends. This ownership pattern suggests a governance model with strong promoter influence and a stable institutional interest, which could impact strategic decisions and corporate actions in alignment with long-term operational goals.
Sector and Industry Analysis
TCI Express Ltd. (TCIEXP) operates within the logistics and express delivery sector, a critical component of the broader transportation and supply chain industry. This sector is characterized by its essential role in facilitating the movement of goods across domestic and international markets, supporting e-commerce growth, manufacturing, and retail distribution. Globally, the express logistics market has witnessed robust expansion driven by increasing demand for faster delivery services, with market size estimates running into hundreds of billions of dollars and projected compound annual growth rates (CAGR) typically in the 7-10% range over the next five years. Key players in this sector include multinational courier companies like FedEx, DHL, and UPS, alongside regional and domestic specialists such as TCI Express in India, which leverage localized networks and technology to cater to specific market needs.
Industry trends are heavily influenced by technological advancements and evolving consumer expectations. The rise of e-commerce has accelerated demand for last-mile delivery solutions, real-time tracking, and flexible delivery options. Automation, AI-driven route optimization, and IoT-enabled fleet management are transforming operational efficiencies and cost structures. Additionally, consumer behavior is shifting towards same-day or next-day delivery, pushing express logistics providers to innovate in warehousing, inventory management, and delivery mechanisms. Emerging opportunities lie in integrating green logistics practices to reduce carbon footprints, expanding into tier-2 and tier-3 cities, and leveraging data analytics for predictive demand and supply chain resilience.
The regulatory landscape in the logistics and express delivery sector is complex and varies by jurisdiction but generally focuses on safety, environmental compliance, labor laws, and customs regulations for cross-border shipments. In India, where TCI Express operates, regulatory frameworks include the Goods and Services Tax (GST) regime, which has streamlined interstate logistics, and policies promoting infrastructure development such as dedicated freight corridors and expressways. Compliance with vehicle emission standards and labor regulations also impacts operational costs and fleet management. Additionally, data privacy laws influence the handling of customer information in technology-driven logistics services.
Competitive dynamics in the express logistics industry are shaped by high capital intensity, network effects, and service differentiation. Barriers to entry include the need for extensive physical infrastructure, technology investment, and regulatory approvals. Market structure tends to be oligopolistic with a few dominant players controlling significant market share, though regional players like TCI Express carve niches through specialized services and localized expertise. Competitive positioning hinges on service reliability, delivery speed, geographic coverage, and technological integration. Strategic partnerships, acquisitions, and continuous innovation are common tactics to enhance market presence and operational scalability in this highly competitive environment.
Note: Analysis synthesized from industry research, market reports, and regulatory filings. Information is subject to change based on market conditions.
Illustrative Scenario Analysis
DCF Assumptions:
Method: Two-Stage EPS-Priority Model
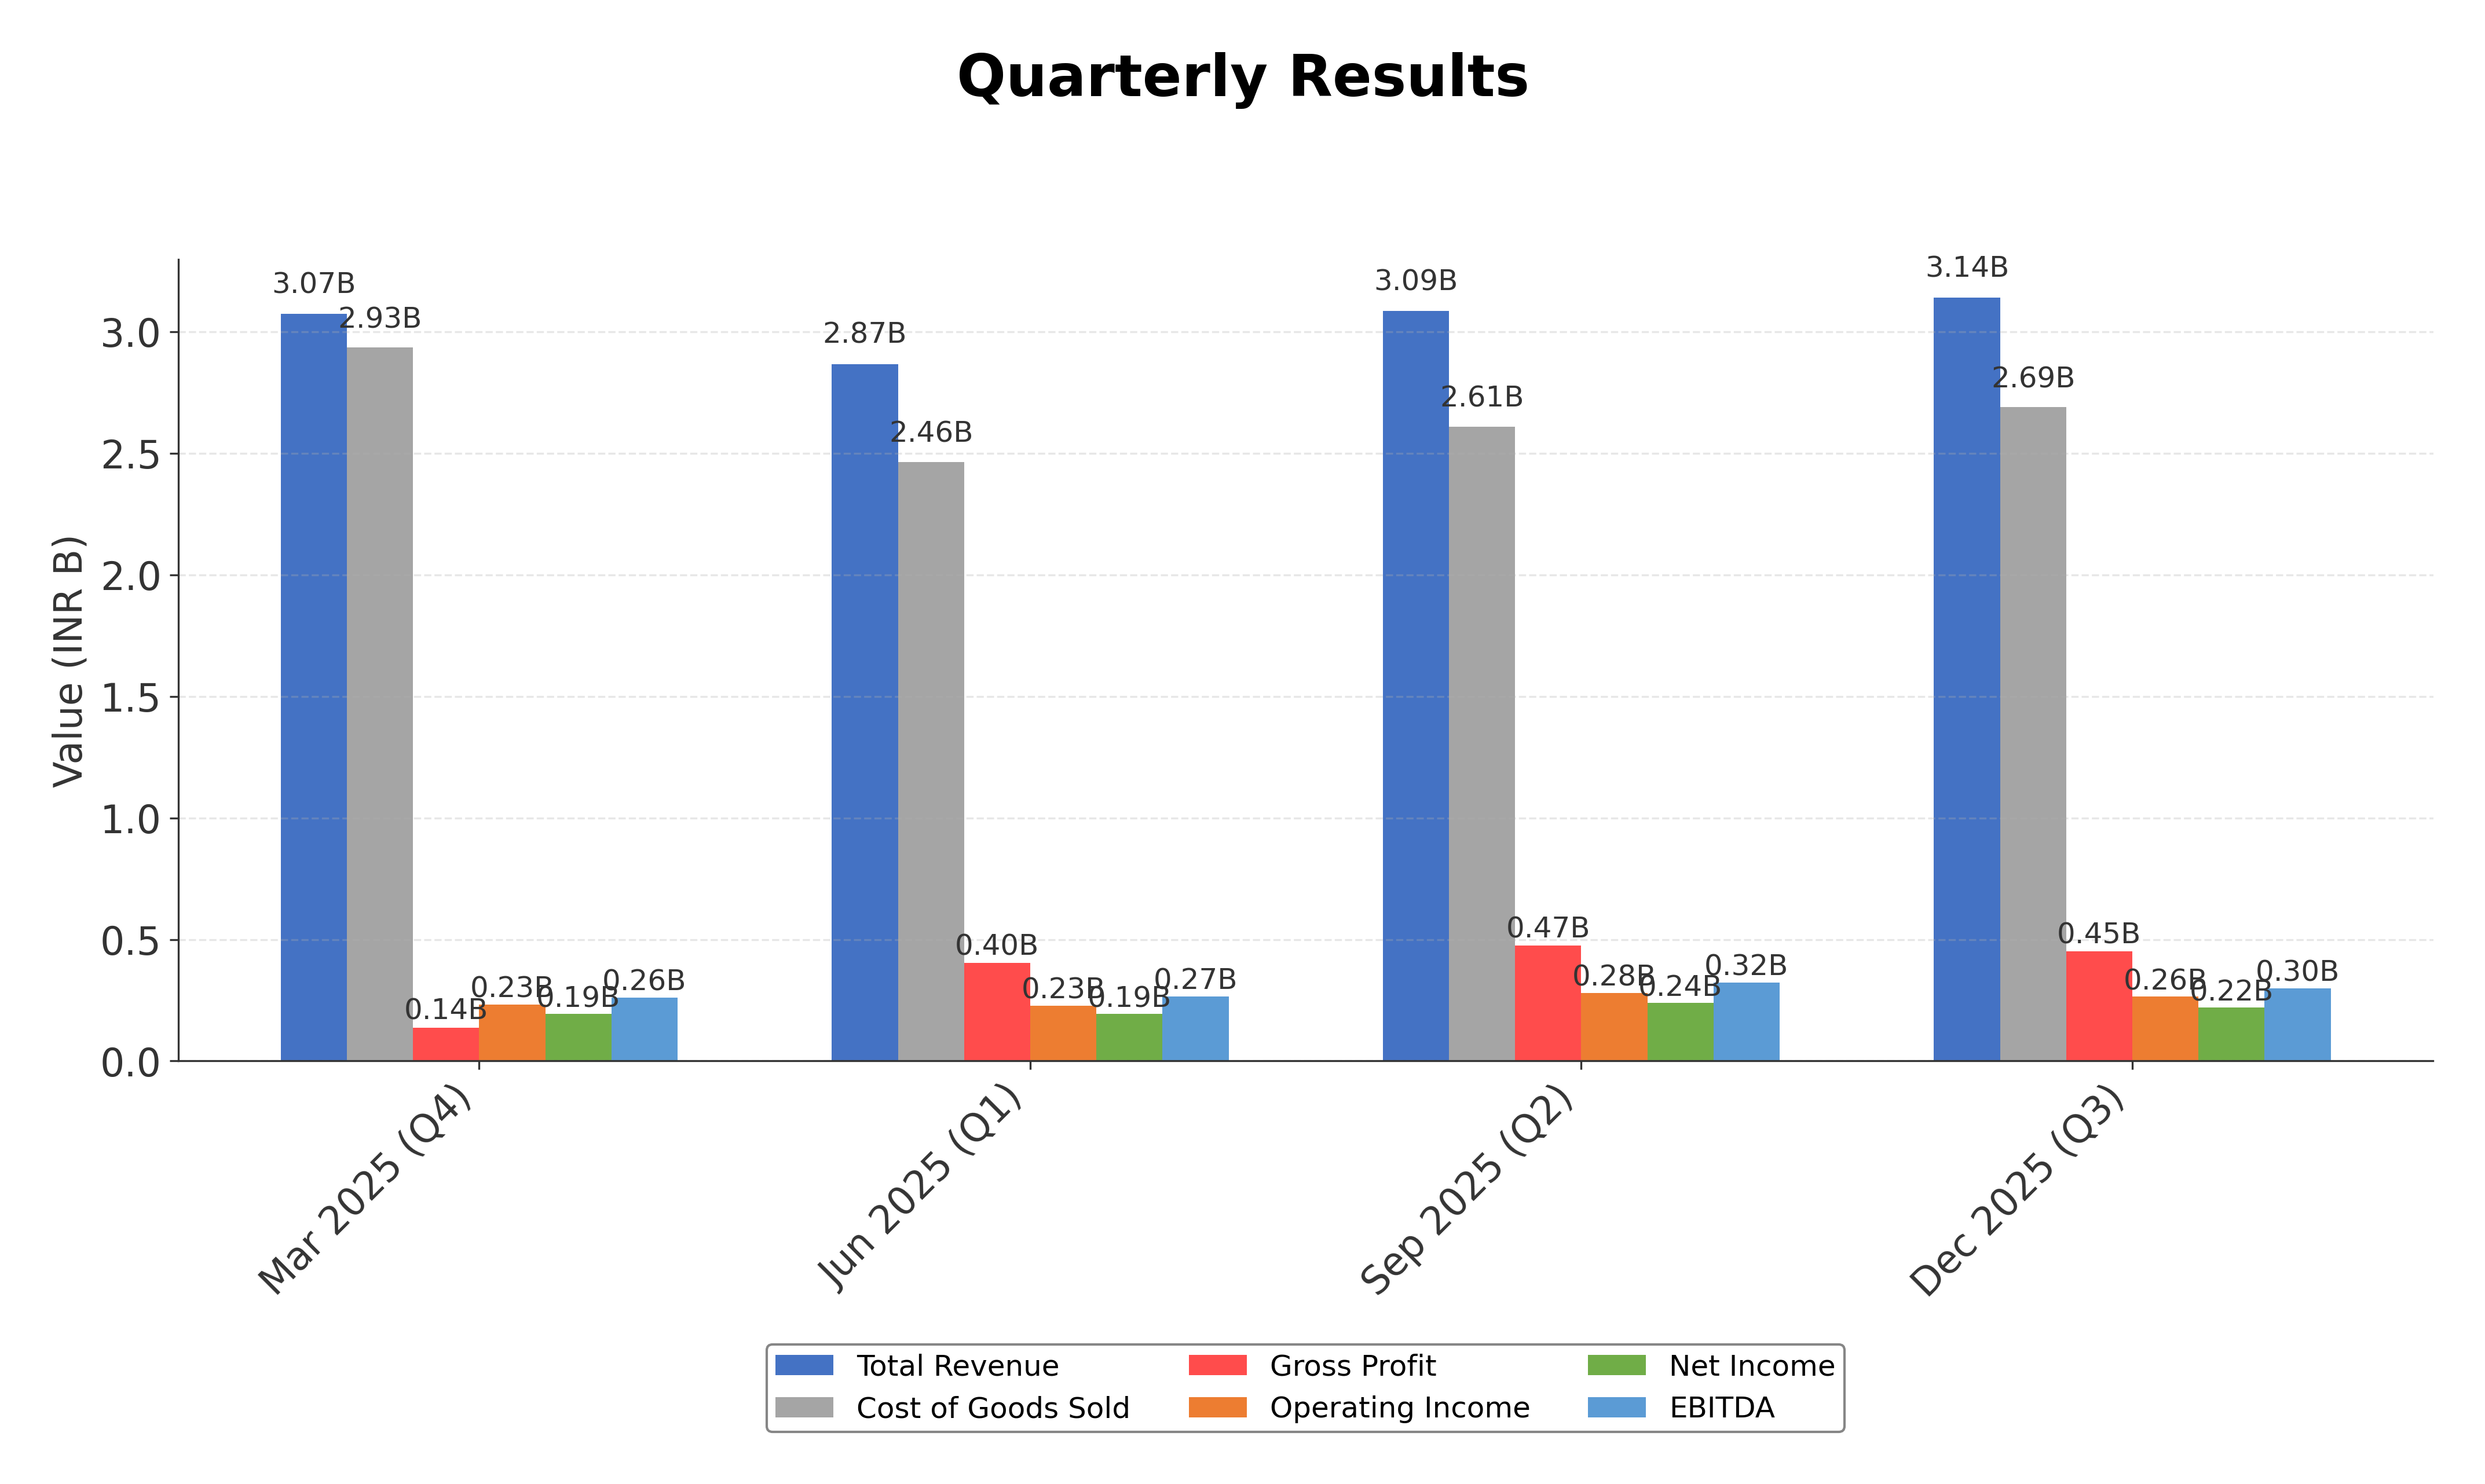
Financials
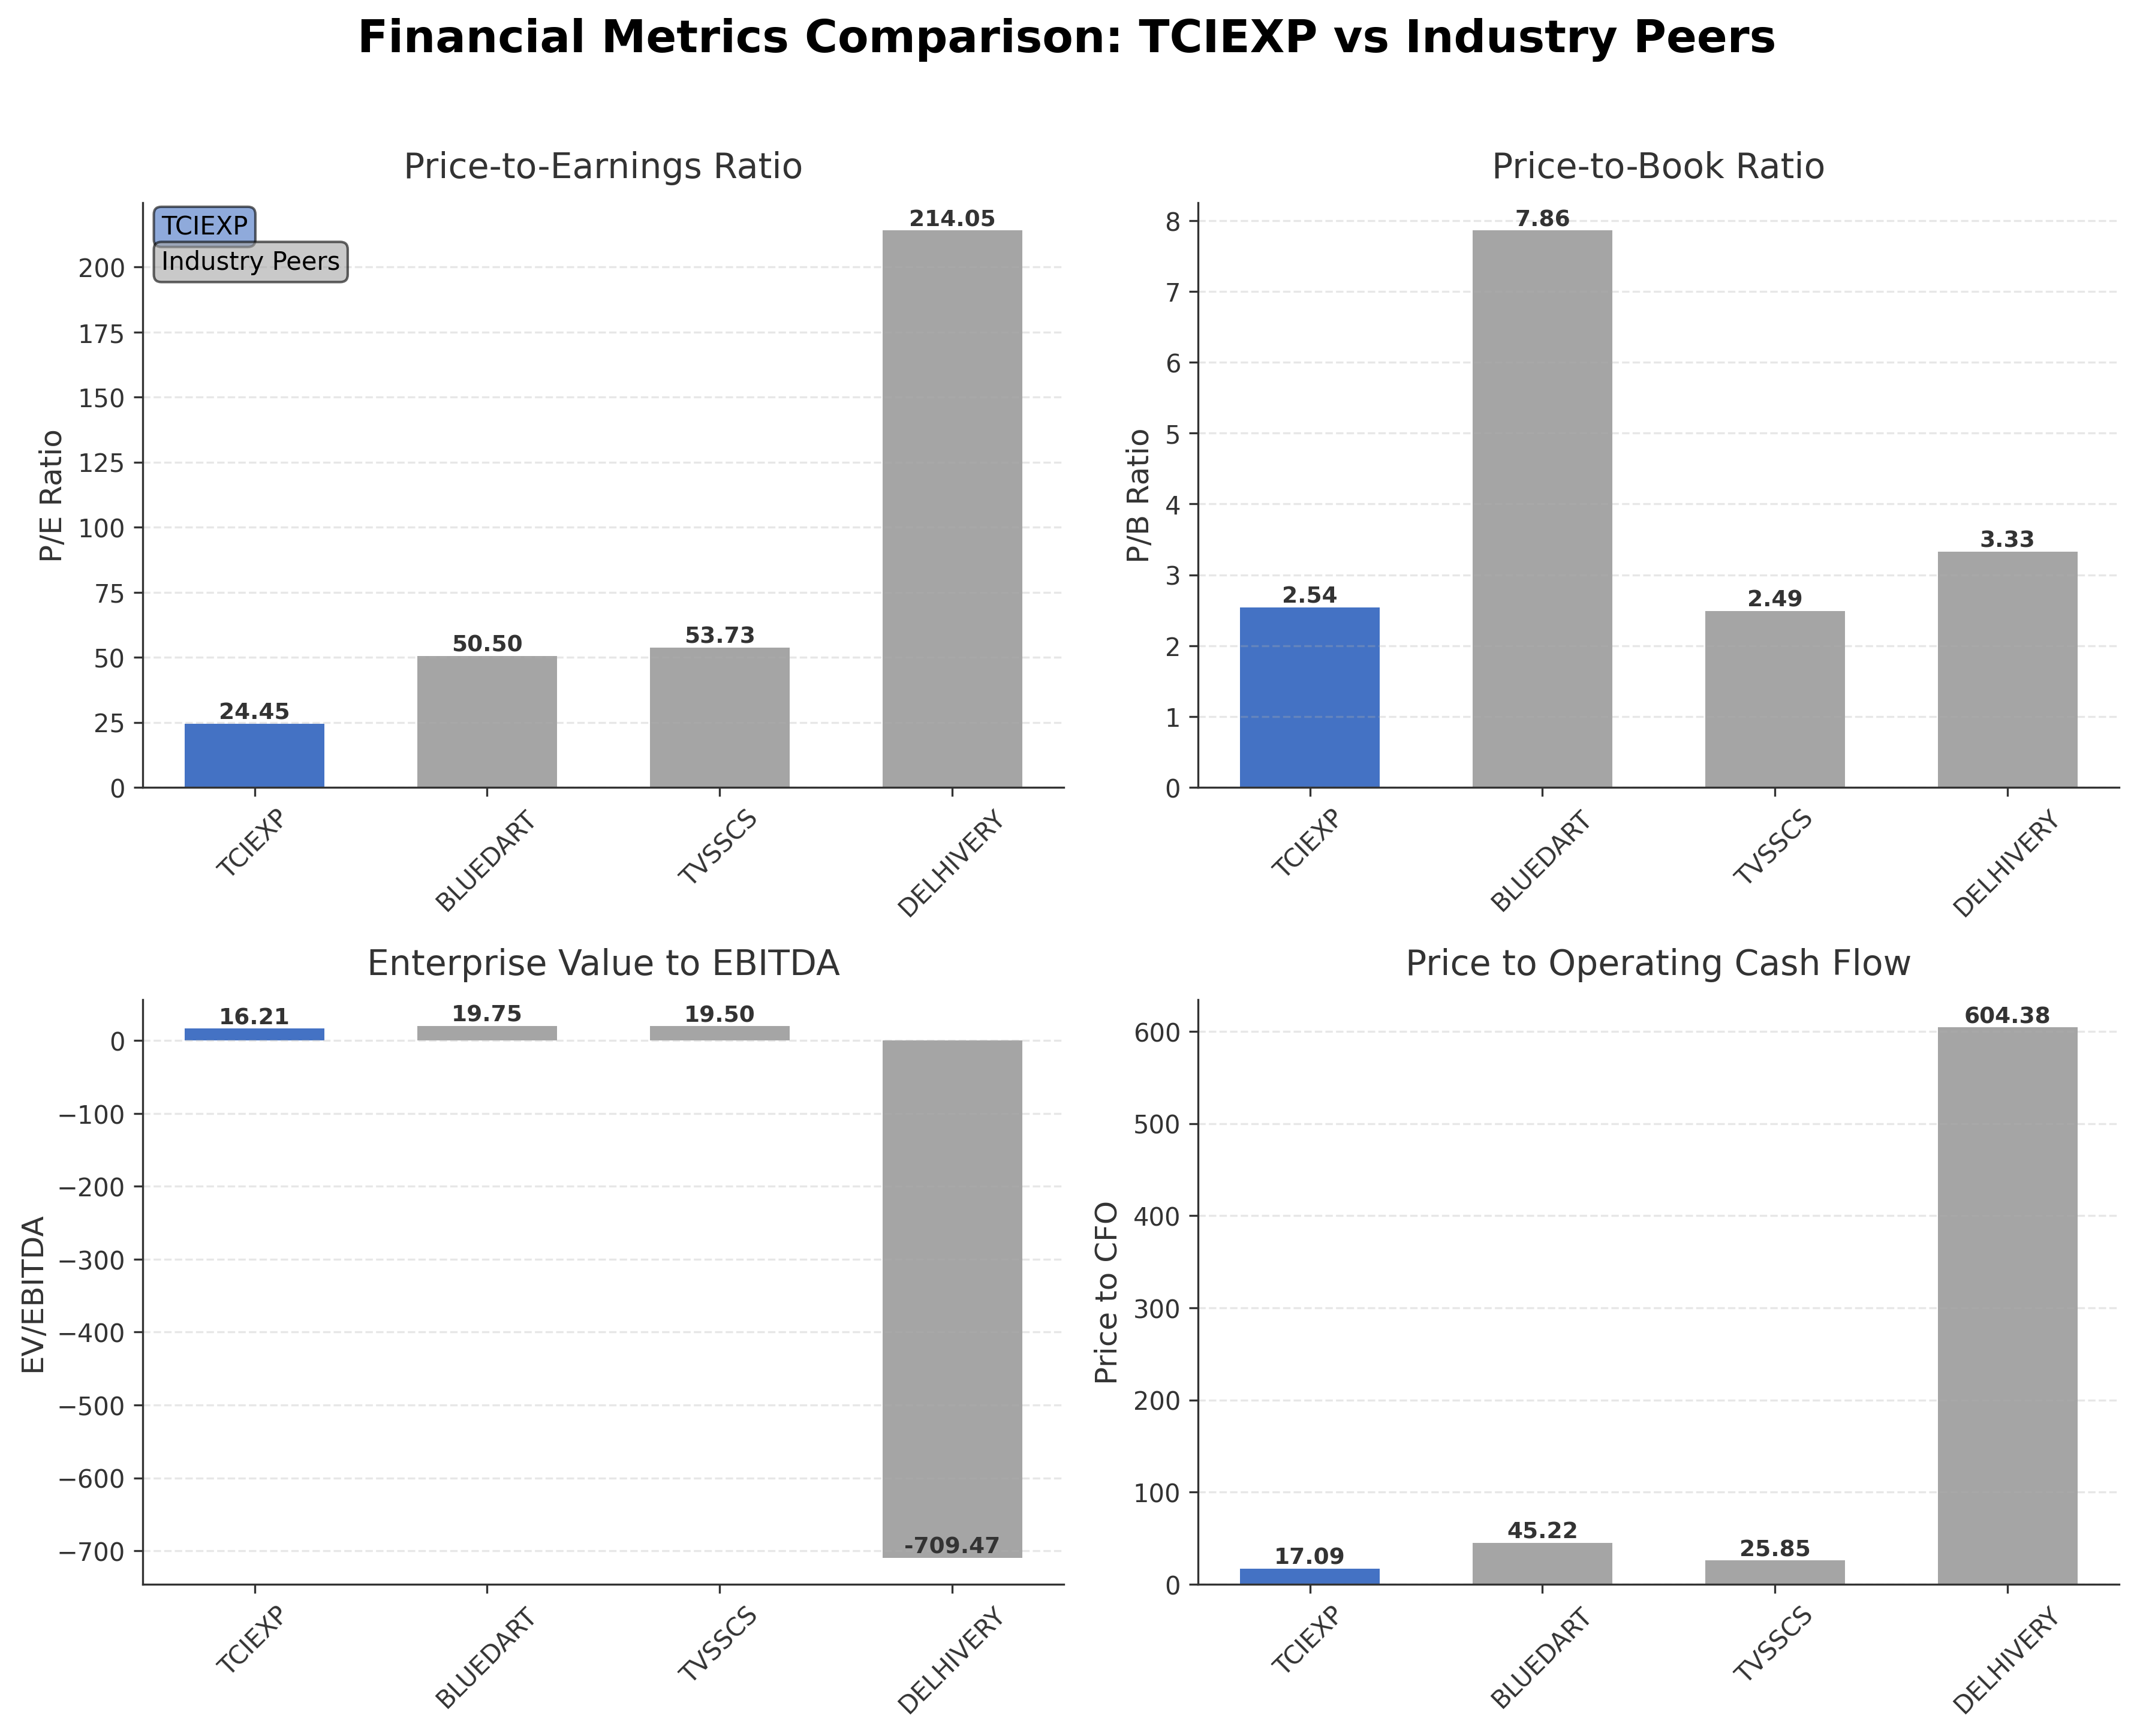
Peer Analysis
| Company Name | Market Cap | P/E Ratio | P/B Ratio | EV/EBITDA | Price to CFO |
|---|---|---|---|---|---|
| Tci Express Ltd. | ₹20.55B | 24.45 | 2.54 | 16.21 | 17.09 |
| Blue Dart Express Ltd. | ₹128.23B | 50.5 | 7.86 | 19.75 | 45.22 |
| TVS Supply Chain Solutions Limited | ₹49.31B | 53.73 | 2.49 | 19.5 | 25.85 |
| Delhivery Ltd. | ₹317.38B | 214.05 | 3.33 | -709.47 | 604.38 |
Comparison Analysis: Tci Express Ltd. exhibits a more moderate valuation compared to its larger Indian logistics peers such as Blue Dart Express and Delhivery Ltd., which trade at significantly higher P/E ratios and EV/EBITDA multiples. While Blue Dart and TVS Supply Chain Solutions show elevated valuation metrics, Tci Express maintains a balanced price-to-book ratio and a competitive return on equity of 11.2%, outperforming some peers in profitability. Delhivery's negative EV/EBITDA and high price-to-CFO ratio highlight its differing financial profile. Overall, Tci Express's valuation and profitability metrics suggest a relatively conservative market positioning within the regional logistics sector.
Financial Metrics Comparison with Peers
Financial Statements
Comprehensive financial data including income, balance sheet, and cash flow metrics
Income Statement
| fiscal_date | 2025-03-31 | 2024-03-31 | 2023-03-31 | 2022-03-31 | 2021-03-31 |
|---|---|---|---|---|---|
| Sales | 12.08B | 12.54B | 12.41B | 10.81B | 8.44B |
| Cost Of Goods | 10.56B | 10.39B | 10.20B | 8.82B | 6.90B |
| Gross Profit | 1.52B | 2.15B | 2.21B | 1.99B | 1.54B |
| Operating Expense Selling General And Administrative | 66.70M | 55.60M | 53.00M | 40.40M | 39.90M |
| Operating Expense Other Operating Expenses | 257.80M | 236.10M | 205.30M | 151.40M | 120.20M |
| Operating Income | 1.06B | 1.71B | 1.82B | 1.68B | 1.29B |
| Non Operating Interest Income | 12.20M | 41.10M | 48.30M | 44.30M | 6.10M |
| Non Operating Interest Expense | 9.80M | 11.90M | 15.30M | 4.90M | 3.00M |
| Pretax Income | 1.15B | 1.74B | 1.85B | 1.72B | 1.32B |
| Income Tax | 293.70M | 422.80M | 452.50M | 431.70M | 316.20M |
| Net Income | 858.10M | 1.32B | 1.39B | 1.29B | 1.01B |
| Eps Basic | 22.36 | 34.35 | 36.24 | 33.48 | 26.19 |
| Eps Diluted | 22.31 | 34.27 | 36.20 | 33.45 | 26.15 |
| Basic Shares Outstanding | 38.37M | 38.33M | 38.43M | 38.48M | 38.41M |
| Diluted Shares Outstanding | 38.37M | 38.33M | 38.43M | 38.48M | 38.41M |
| Ebit | 1.16B | 1.75B | 1.86B | 1.73B | 1.33B |
| Ebitda | 1.29B | 1.95B | 2.02B | 1.83B | 1.41B |
| Net Income Continuous Operations | 1.15B | 1.74B | 1.85B | 1.72B | 1.32B |
| Preferred Stock Dividends | 0.00 | 0.00 | 0.00 | 0.00 | 0.00 |
Source: Financial statements and regulatory filings
Balance Sheet
| fiscal_date | 2025-03-31 | 2024-03-31 | 2023-03-31 | 2022-03-31 | 2021-03-31 |
|---|---|---|---|---|---|
| Cash And Cash Equivalents | 117.50M | 170.10M | 138.00M | 157.40M | 91.60M |
| Accounts Receivable | 2.26B | 2.32B | 2.11B | 1.90B | 1.69B |
| Total Assets | 9.19B | 8.50B | 7.35B | 6.57B | 5.47B |
| Total Liabilities | 1.54B | 1.46B | 1.39B | 1.21B | 1.13B |
| Long Term Debt | 47.00M | 38.60M | 38.40M | 3.30M | 11.30M |
| Shareholders Equity | 7.64B | 7.04B | 5.96B | 5.36B | 4.34B |
Source: Financial statements and regulatory filings
Cash Flow Statement
| fiscal_date | 2025-03-31 | 2024-03-31 | 2023-03-31 | 2022-03-31 | 2021-03-31 |
|---|---|---|---|---|---|
| Operating Activities Net Income | 1.15B | 1.74B | 1.85B | 1.72B | 1.32B |
| Operating Activities Stock Based Compensation | 31.80M | 39.30M | 35.00M | 32.90M | 17.80M |
| Operating Activities Other Non Cash Items | -7.20M | -26.40M | -30.20M | -35.20M | -24.60M |
| Operating Activities Accounts Receivable | -22.60M | -206.90M | -249.00M | -173.00M | -239.40M |
| Operating Activities Other Assets Liabilities | 48.60M | 300.00K | -7.60M | 81.50M | 31.60M |
| Operating Activities Operating Cash Flow | 1.20B | 1.55B | 1.59B | 1.63B | 1.11B |
| Investing Activities Capital Expenditures | -299.10M | -518.90M | -1.25B | -800.20M | -553.70M |
| Investing Activities Purchase Of Investments | -4.54B | -1.05B | -155.80M | -146.80M | -438.80M |
| Investing Activities Sale Of Investments | 3.91B | 474.30M | 713.40M | N/A | N/A |
| Investing Activities Investing Cash Flow | -927.10M | -1.09B | -695.40M | -947.00M | -992.50M |
| Financing Activities Long Term Debt Payments | -29.60M | -2.00M | -7.80M | -10.00M | -20.90M |
| Financing Activities Short Term Debt Issuance | -29.60M | 18.30M | -2.60M | -1.90M | -9.10M |
| Financing Activities Common Stock Issuance | 27.90M | 21.50M | 20.00M | 19.90M | 21.70M |
| Financing Activities Common Dividends | -307.00M | -306.70M | -307.60M | -307.90M | -76.90M |
| Financing Activities Financing Cash Flow | -338.30M | -264.90M | -827.20M | -299.80M | -83.60M |
| End Cash Position | 117.50M | 170.10M | 138.00M | 157.40M | 91.60M |
| Free Cash Flow | 678.10M | 838.50M | 207.60M | 471.00M | 446.00M |
| Financing Activities Common Stock Repurchase | N/A | 0.00 | -424.80M | N/A | N/A |
| Financing Activities Other Financing Charges | N/A | 4.00M | -104.40M | 100.00K | N/A |
| Financing Activities Long Term Debt Issuance | N/A | N/A | N/A | 0.00 | 1.60M |
| Investing Activities Other Investing Activity | N/A | N/A | N/A | N/A | N/A |
Source: Financial statements and regulatory filings
Technical Analysis
Key Insights
- The current trend shows a downward price movement with recent volatility, reflecting a retracement from the 52-week high of ₹848 to the current price near ₹535.
- Key support levels are observed around ₹478, the 52-week low, while resistance is noted near ₹548 and the 200-day moving average at ₹653.
- The stock price is trading below the 200-day moving average (₹653) and slightly below the 50-day moving average (₹546), indicating potential bearish momentum.
- Momentum indicators show RSI near neutral levels, MACD signaling a possible bearish crossover, and stochastic oscillators reflecting oversold conditions in the short term.
- Multi-timeframe analysis reveals consistent weakness on daily and weekly charts, while monthly charts suggest consolidation phases.
- Current technical setup indicates potential for continued consolidation or further downside if support levels fail, with possible recovery if momentum indicators improve and price crosses above key moving averages.
Trending News
1. Headline: TCI Express Ltd is Rated Sell by MarketsMOJO
Summary: TCI Express Ltd is rated 'Sell' by MarketsMOJO, a rating that was last updated on 30 January 2023. However, the analysis and financial metrics discussed here reflect the stock's current position as of 07 March 2026, providing investors with an up-to-date perspective on its performance and outlook.
Sentiment: neutral
2. Headline: Why is TCI Express Ltd falling/rising?
Summary: As of 04-Mar, TCI Express Ltd’s stock price has continued its downward trajectory, closing at ₹512.00 with a decline of 0.65% on the day. This movement reflects ongoing challenges faced by the company, including sustained underperformance relative to benchmarks and subdued financial growth ...
Sentiment: negative
Summary: US-Iran war: Experts believe disruption in the Strait of Hormuz due to the outbreak of the US-Israel-Iran war will not remain limited to oil and energy
Sentiment: negative
4. Headline: TCI Express Ltd is Rated Sell
Summary: TCI Express Ltd is rated Sell by MarketsMOJO, with this rating last updated on 30 January 2023. However, the analysis and financial metrics discussed here reflect the stock’s current position as of 24 February 2026, providing investors with an up-to-date view of its performance and outlook.
Sentiment: neutral
5. Headline: Tesco sets out Express-led growth drive; acquires former Amazon Fresh sites
Summary: Exciting news from Tesco as they announce ambitious store growth plans for 2026, focusing on convenience and sustainability. With new Express stores opening across the UK and a commitment to serving local communities, Tesco is leading the way in the grocery sector.
Sentiment: positive
6. Headline: TCI Express Ltd Gains 7.31%: 5 Key Factors Driving This Week’s Volatility
Summary: TCI Express Ltd delivered a notable weekly gain of 7.31%, significantly outperforming the Sensex’s 1.51% rise during the week ending 6 February 2026. The stock’s price action was marked by volatile swings, technical shifts, and valuation recalibrations amid mixed operational results and ...
Sentiment: positive
7. Headline: TCI Express Ltd Valuation Shifts Signal Renewed Price Attractiveness Amid Sector Challenges
Summary: TCI Express Ltd has witnessed a notable shift in its valuation parameters, moving from a very attractive to an attractive rating, reflecting a nuanced change in price attractiveness despite ongoing sector headwinds. This article delves into the evolving price-to-earnings (P/E) and price-to-book ...
Sentiment: positive
Summary: Transport Corporation Of India Ltd is India`s leading integrated supply chain and logistics solutions provider and a pioneer in the sphere of cargo transportation in India.TCI`s range of services encompasses the entire gamut of supply chain services from the point of origin to the final end customer. TCI has been continuously introducing new and innovative services. From multi-modal transportation (road, rail, air, sea) to express ...
Sentiment: neutral
9. Headline: Has TCI Express Ltd declared dividend?
Summary: Yes, TCI Express Ltd has declared a dividend of 350%, amounting to ₹2 per share, with an ex-date of February 6, 2026. Despite the dividend, the company has experienced significant price declines over various periods, resulting in negative total returns.
Sentiment: negative
10. Headline: TCI Express Ltd (NSE:TCIEXP) Q3 2026 Earnings Call Highlights: Steady Growth Amidst Market Challenges
Summary: TCI Express Ltd (NSE:TCIEXP) reports a 6% revenue growth and robust segment performance, maintaining a strong cash position and shareholder returns.
Sentiment: positive
Recent Updates
News Summary
Recent news highlights TCI Express Ltd's intraday price surge of 8.66% on 5 March 2026, reflecting short-term market enthusiasm. The company scheduled a board meeting to review Q3 results and consider an interim dividend, signaling ongoing focus on shareholder returns. Analyst commentary suggests the shares may have experienced rapid appreciation relative to earnings outlook, while Jefferies noted optimism about the company's positioning as a beneficiary in the road logistics sector. Despite a 'Sell' rating by MarketsMOJO from early 2023, recent developments indicate active market interest and strategic review. These updates collectively underscore a dynamic environment with mixed sentiments, balancing operational performance with valuation considerations.
News Sentiment
Sentiment across recent news is moderately positive, with emphasis on price gains, dividend considerations, and strategic outlook, tempered by cautious analyst views and prior sell ratings. The overall tone reflects a nuanced market perception, combining optimism about growth prospects with awareness of valuation and sector challenges.
Analytical Overview
Analysis Summary
Tci Express Ltd.'s trailing P/E of 24.45 is aligned with the industry average, while the forward P/E of 17.06 suggests anticipated earnings growth. The PEG ratio is negative, indicating earnings growth expectations may be uncertain or volatile relative to price.
Revenue growth at 5.9% quarterly and positive cash flow trends demonstrate a stable growth trajectory, supported by operating cash flow of ₹1.2 billion and free cash flow of ₹858 million over the trailing twelve months.
The company maintains a strong financial position with a current ratio above 3.3 and low total debt of ₹140 million against ₹1.62 billion cash, reflecting prudent leverage and liquidity management.
Sector-specific challenges include geopolitical risks and competitive pressures in logistics, while opportunities arise from expanding e-commerce and technological integration enhancing operational efficiency.
Considering India-specific factors, regulatory frameworks and growing consumer demand for fast delivery services underpin the company's market positioning, although macroeconomic uncertainties may influence future performance.
Investment Conclusion
Supporting Factors: Primary supporting factors include solid revenue growth, strong liquidity, and a balanced valuation relative to peers.
Risk Factors: Key risks involve sector headwinds, valuation volatility, and geopolitical disruptions impacting logistics operations.
SWOT Analysis
Strengths
- Extensive logistics network covering urban and rural markets.
- Strong cash position with low debt levels.
- High insider ownership ensuring aligned governance.
- Consistent revenue growth supported by diversified sectors.
Weaknesses
- Negative PEG ratio indicating uncertain earnings growth expectations.
- Stock price volatility with significant downside risk from 52-week high.
- Moderate institutional investor participation limiting broader market support.
- Relatively lower market capitalization compared to major peers.
Opportunities
- Expansion driven by growing e-commerce demand in India.
- Technological integration enhancing operational efficiency and customer experience.
- Potential to capture market share amid sector consolidation.
- Increasing focus on express delivery services across industries.
Threats
- Geopolitical risks affecting supply chain and logistics operations.
- Intense competition from larger and well-capitalized logistics firms.
- Regulatory changes impacting operational costs and compliance.
- Macroeconomic uncertainties influencing consumer spending and freight volumes.
Company Description
Tci Express Ltd. is a prominent player in the logistics industry, operating as an express delivery service provider. The company focuses on providing fast and efficient logistics solutions, catering especially to businesses needing quick supply chain movement. A vital aspect of Tci Express Ltd.'s services is its extensive network across urban and rural areas, allowing for a wide reach and the ability to serve diverse market requirements effectively. The logistics firm is heavily involved in sectors such as e-commerce, consumer goods, and pharmaceuticals, where timely delivery is of utmost importance. Tci Express Ltd. emphasizes technological integration, utilizing digital tools to enhance tracking and operational efficiency, thereby increasing transparency and customer satisfaction. In the financial market, the company represents a key component of the growing logistics and transportation sector, reflecting shifts in commerce trends and consumer demands for speed and reliability in goods delivery. Its role is further underscored by the ongoing expansion of e-commerce, where logistics services are crucial for meeting the surge in online shopping demand.