


Tata Steel Ltd (TATASTEEL)
Stock Analysis Report
Stock Journey
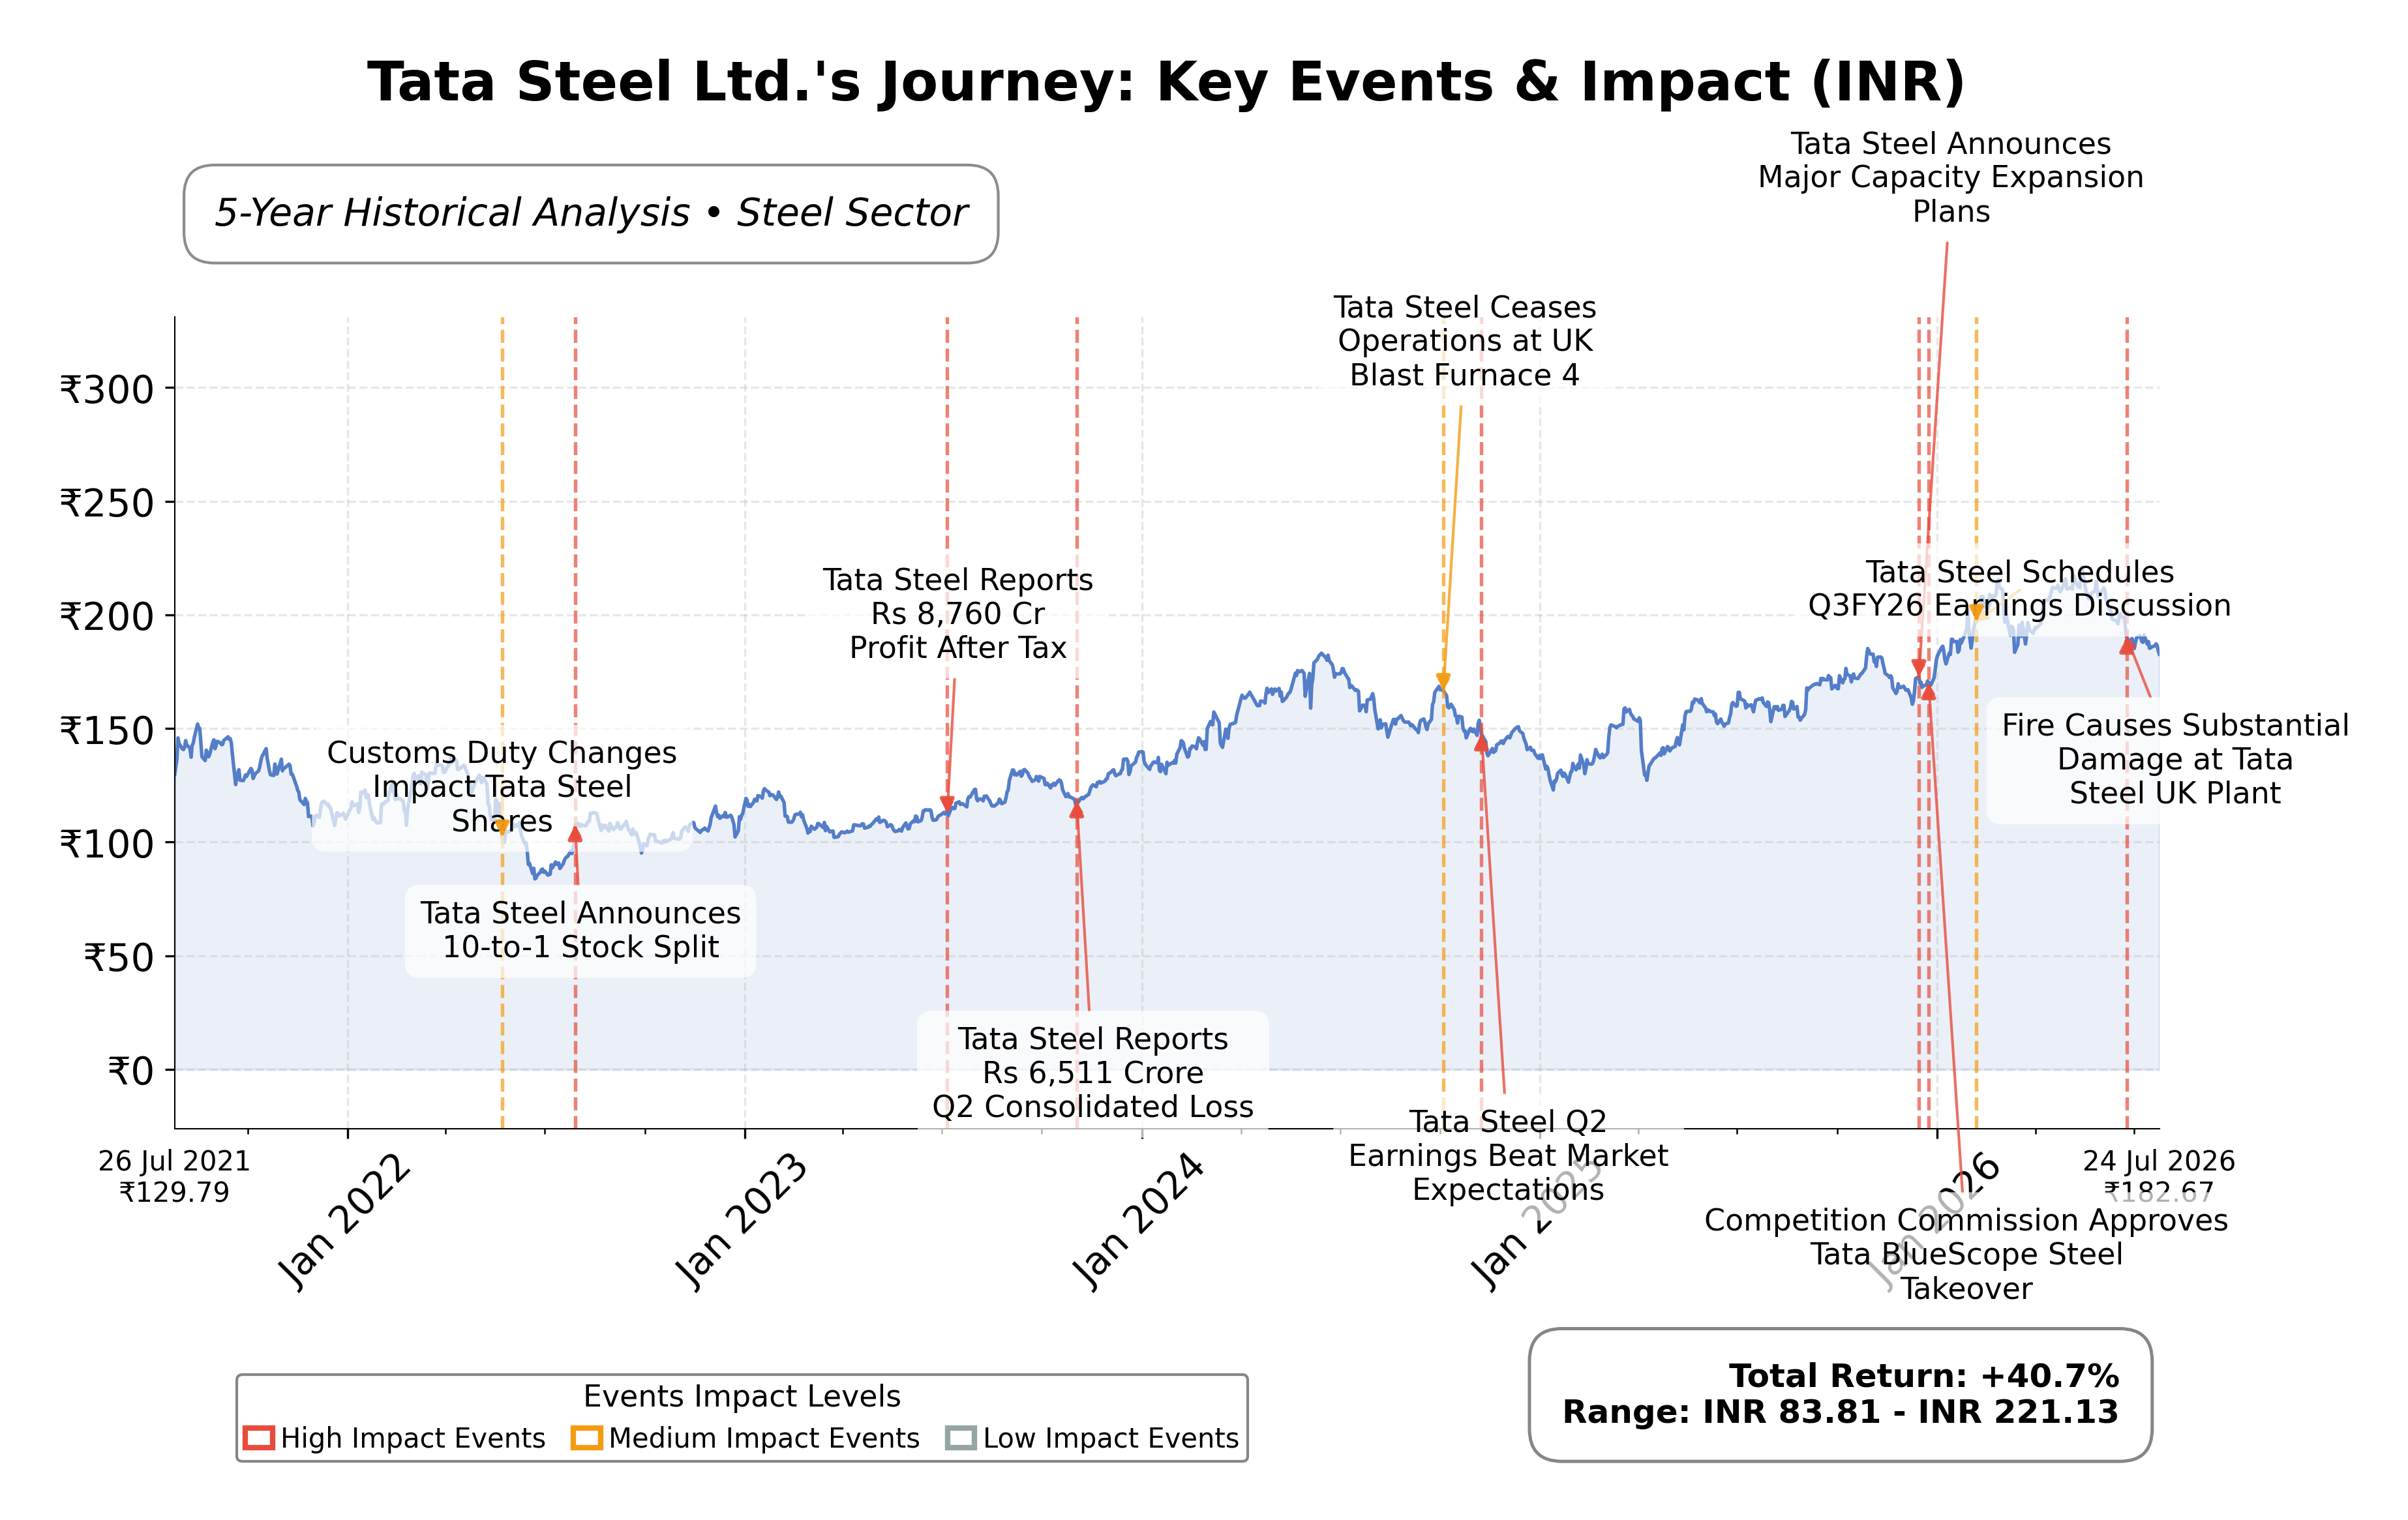
Key Positives and Key Risks
Pros
- Revenue growth of 12.5% year-over-year demonstrates strong top-line momentum supporting expansion.
- Operating cash flow of INR 350.6 billion provides solid liquidity for capital projects and debt servicing.
- Forward P/E of 9.72 indicates market expectations of improved earnings relative to current valuation.
Cons
- Current ratio of 0.75 suggests limited short-term liquidity, posing potential operational constraints.
- Debt-to-equity ratio of 0.89 reflects moderate leverage, increasing financial risk amid market volatility.
- Net profit margin of 4.65% is modest, indicating limited profitability buffer against industry cyclicality.
Disclosure: This information is for general awareness and does not constitute investment advice
Report Summary
Tata Steel Ltd. is a leading integrated steel manufacturing company headquartered in Mumbai, India, operating primarily on the NSE exchange within the Basic Materials sector. The company produces a diverse range of steel products including automotive steel, construction steel, and specialty steel for industrial applications. It holds a significant market position in the steel industry across Asia and Europe, benefiting from its longstanding heritage as part of the Tata Group conglomerate. Tata Steel’s operations span multiple geographies, contributing to its influence in global steel markets.
Financially, Tata Steel reported trailing twelve-month revenue of approximately INR 2.32 trillion with a gross margin of 58.25%, indicating strong production efficiency. The operating margin stands at 9.7%, and the net profit margin is 4.65%, reflecting moderate profitability amid industry cyclicality. The company’s return on equity (ROE) is 11.16%, and return on assets (ROA) is 4.73%, suggesting reasonable capital utilization and asset efficiency. Return on invested capital (ROIC) metrics are consistent with these figures, supporting operational effectiveness.
Valuation metrics show a trailing price-to-earnings (P/E) ratio of 21.09 and a forward P/E of 9.72, indicating the market is pricing in expected earnings growth. The price-to-book (P/B) ratio is 2.23, and the enterprise value to EBITDA (EV/EBITDA) multiple is 9.59, which are within industry norms. The market capitalization is approximately INR 2.28 trillion, with the stock trading at INR 182.70, positioned between its 52-week low of INR 152.51 and high of INR 224.40. This pricing reflects a moderate premium relative to book value and earnings.
Tata Steel’s strengths include robust cash flow generation with operating cash flow of INR 350.6 billion and levered free cash flow of INR 123 billion, alongside a manageable debt level with a debt-to-equity ratio of 0.89. The company is advancing its ₹27,000 crore Kalinganagar Phase II expansion to increase domestic capacity, and has strategic initiatives such as renewable energy sourcing agreements. Key risks involve steel cycle volatility, regulatory challenges, and competitive pressures from peers like JSW Steel and SAIL. Recent leadership and investor communications indicate a focus on balancing growth with financial discipline.
Technically, the stock is trading above its 50-day and 200-day moving averages, with momentum indicators suggesting a positive trend across multiple timeframes. Recent news highlights steady earnings recovery and strategic capacity expansion. Overall, the data suggests a market environment where accumulation and monitoring of operational execution are prudent, with attention to sector dynamics and upcoming quarterly results.
Company and Industry Overview
Company Basics
Price Performance
Company Size
Shareholding Pattern
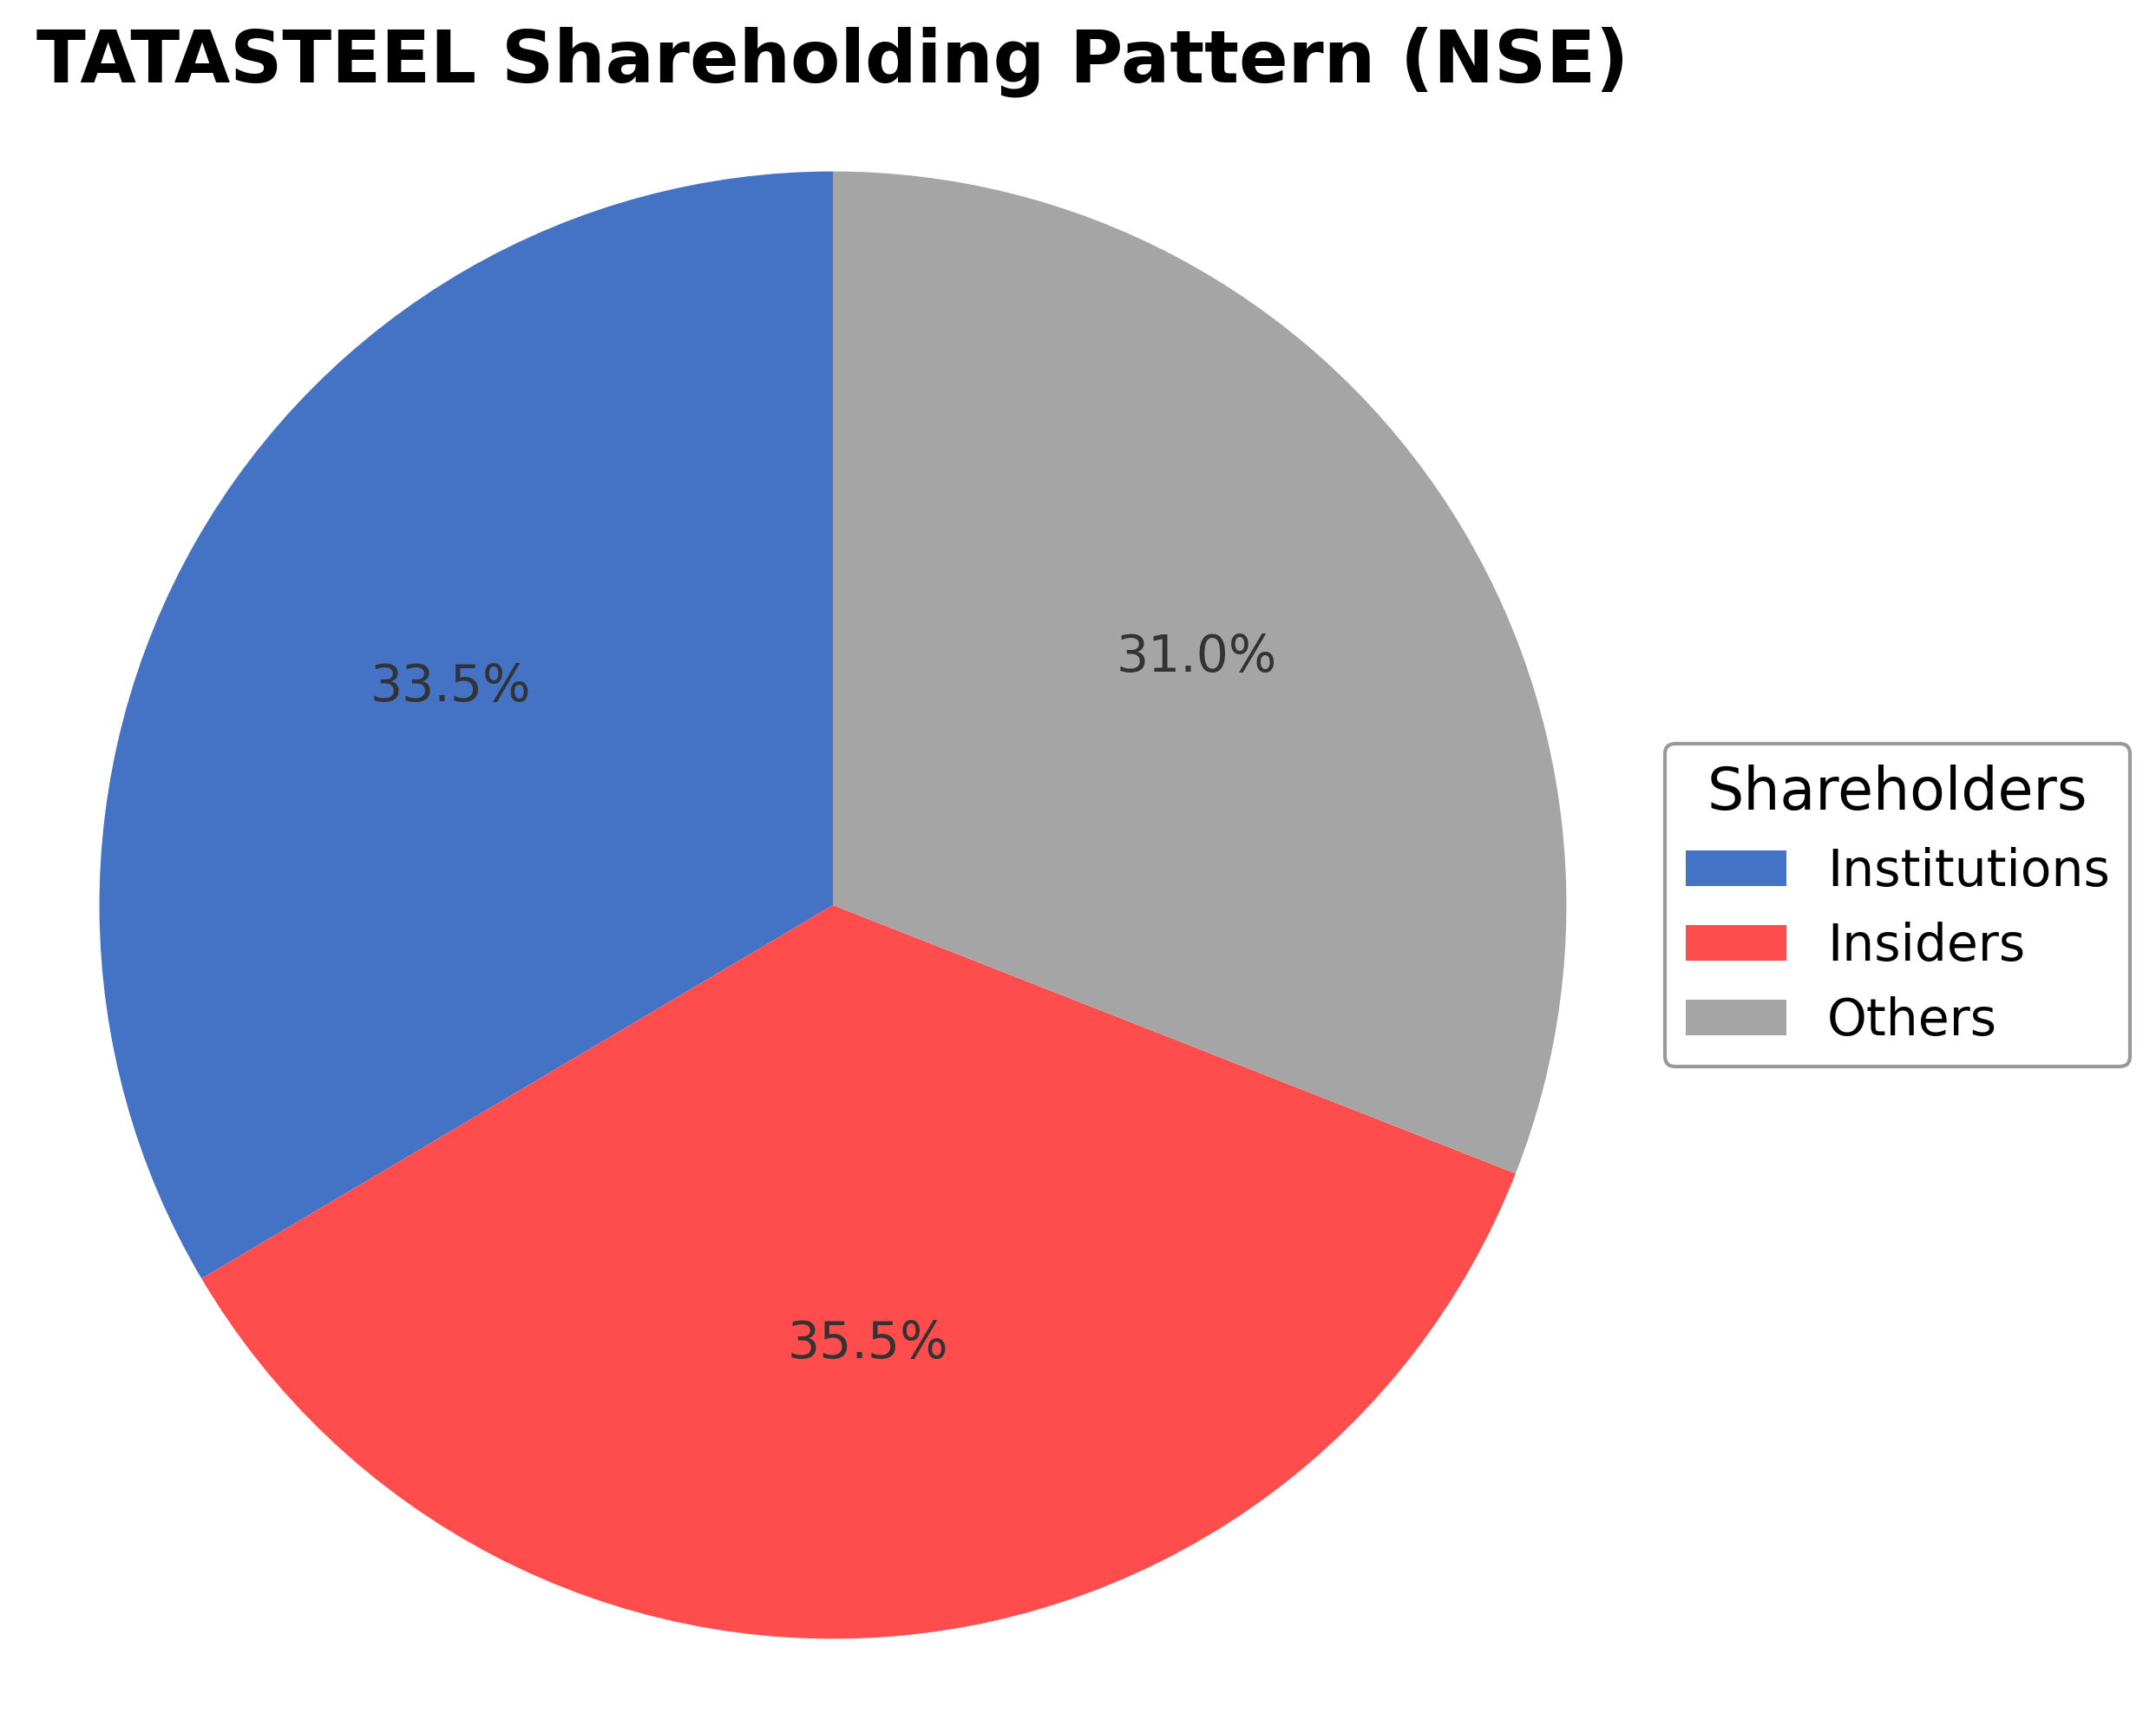
Sector and Industry Analysis
The global steel sector remains a critical component of industrial economies, underpinning infrastructure, transportation, and manufacturing. Demand is closely tied to economic growth, urbanization, and government infrastructure spending, with emerging markets like India driving significant expansion. Major players include Chinese producers dominating output, alongside established multinational firms such as Tata Steel, ArcelorMittal, and Nippon Steel, which compete across diverse geographic regions.
Industry trends emphasize operational efficiency, product differentiation, and sustainability amid volatile raw material costs and fluctuating global demand. Barriers to entry are high due to capital intensity, complex supply chains, and technological requirements. Companies like Tata Steel leverage vertical integration, advanced manufacturing technologies, and value-added steel products to maintain competitiveness, while also adapting to rising energy costs and shifting trade policies.
Regulatory frameworks increasingly focus on environmental impact, with carbon emissions and energy consumption under scrutiny. Governments and investors are pressuring steelmakers to adopt cleaner production methods, including hydrogen-based processes and renewable energy integration. Compliance with evolving environmental standards and participation in ESG initiatives are becoming essential for market access and long-term viability in the steel industry.
Note: Analysis synthesized from industry research, market reports, and regulatory filings. Information is subject to change based on market conditions.
Financial Ratios Dashboard
Illustrative Scenario Analysis
DCF Assumptions:
Method: Two-Stage EPS-Priority Model
Financials
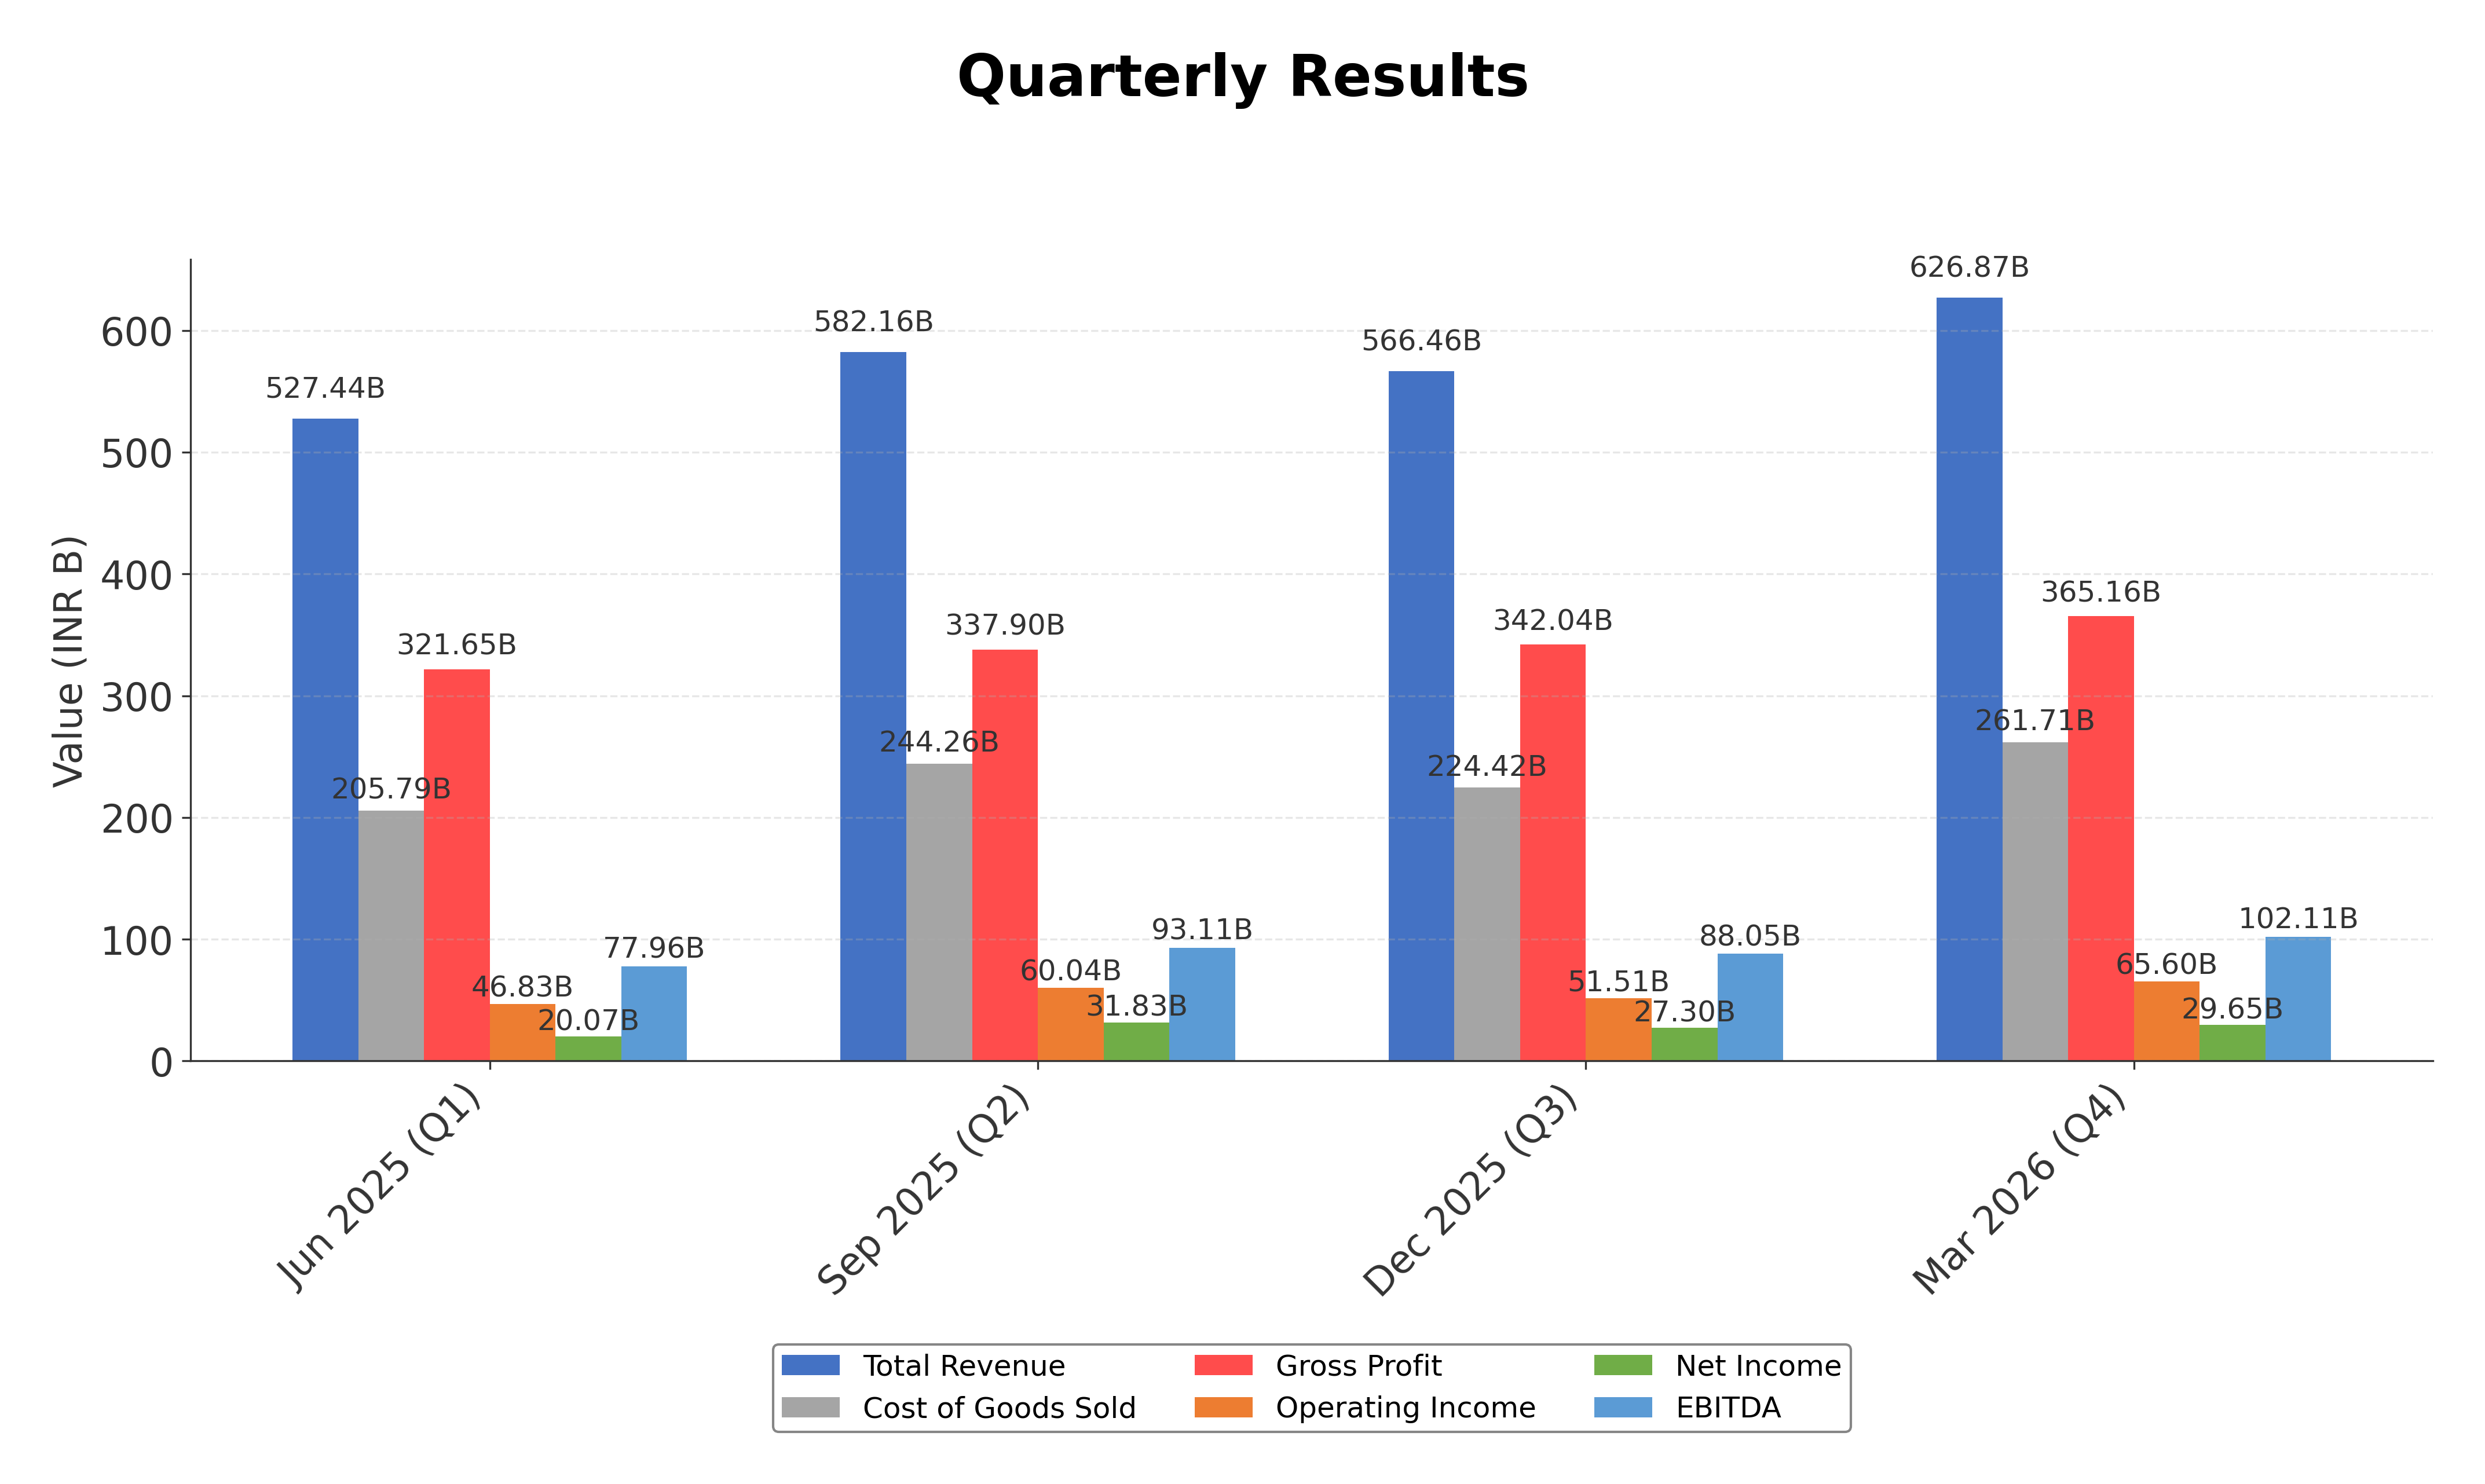
Peer Analysis
| Company Name | Market Cap | P/E Ratio | P/B Ratio | EV/EBITDA | Price to CFO |
|---|---|---|---|---|---|
| Tata Steel Ltd. | ₹2.28T | 21.09 | 2.23 | 9.59 | 6.50 |
| JSW Steel Ltd. | ₹3.03T | 12.24 | 3.03 | 10.38 | 25.20 |
| Jindal Steel & Power Ltd. | ₹1.05T | 31.45 | 2.08 | 12.76 | 14.63 |
| Steel Authority of India Limited | ₹666.87B | 19.72 | 1.10 | 8.14 | 3.50 |
| Jindal Stainless Ltd. | ₹588.51B | 18.45 | 13.08 | 6.63 | 17.33 |
| Nmdc Limited | ₹734.64B | 9.87 | 2.15 | 7.38 | 14.70 |
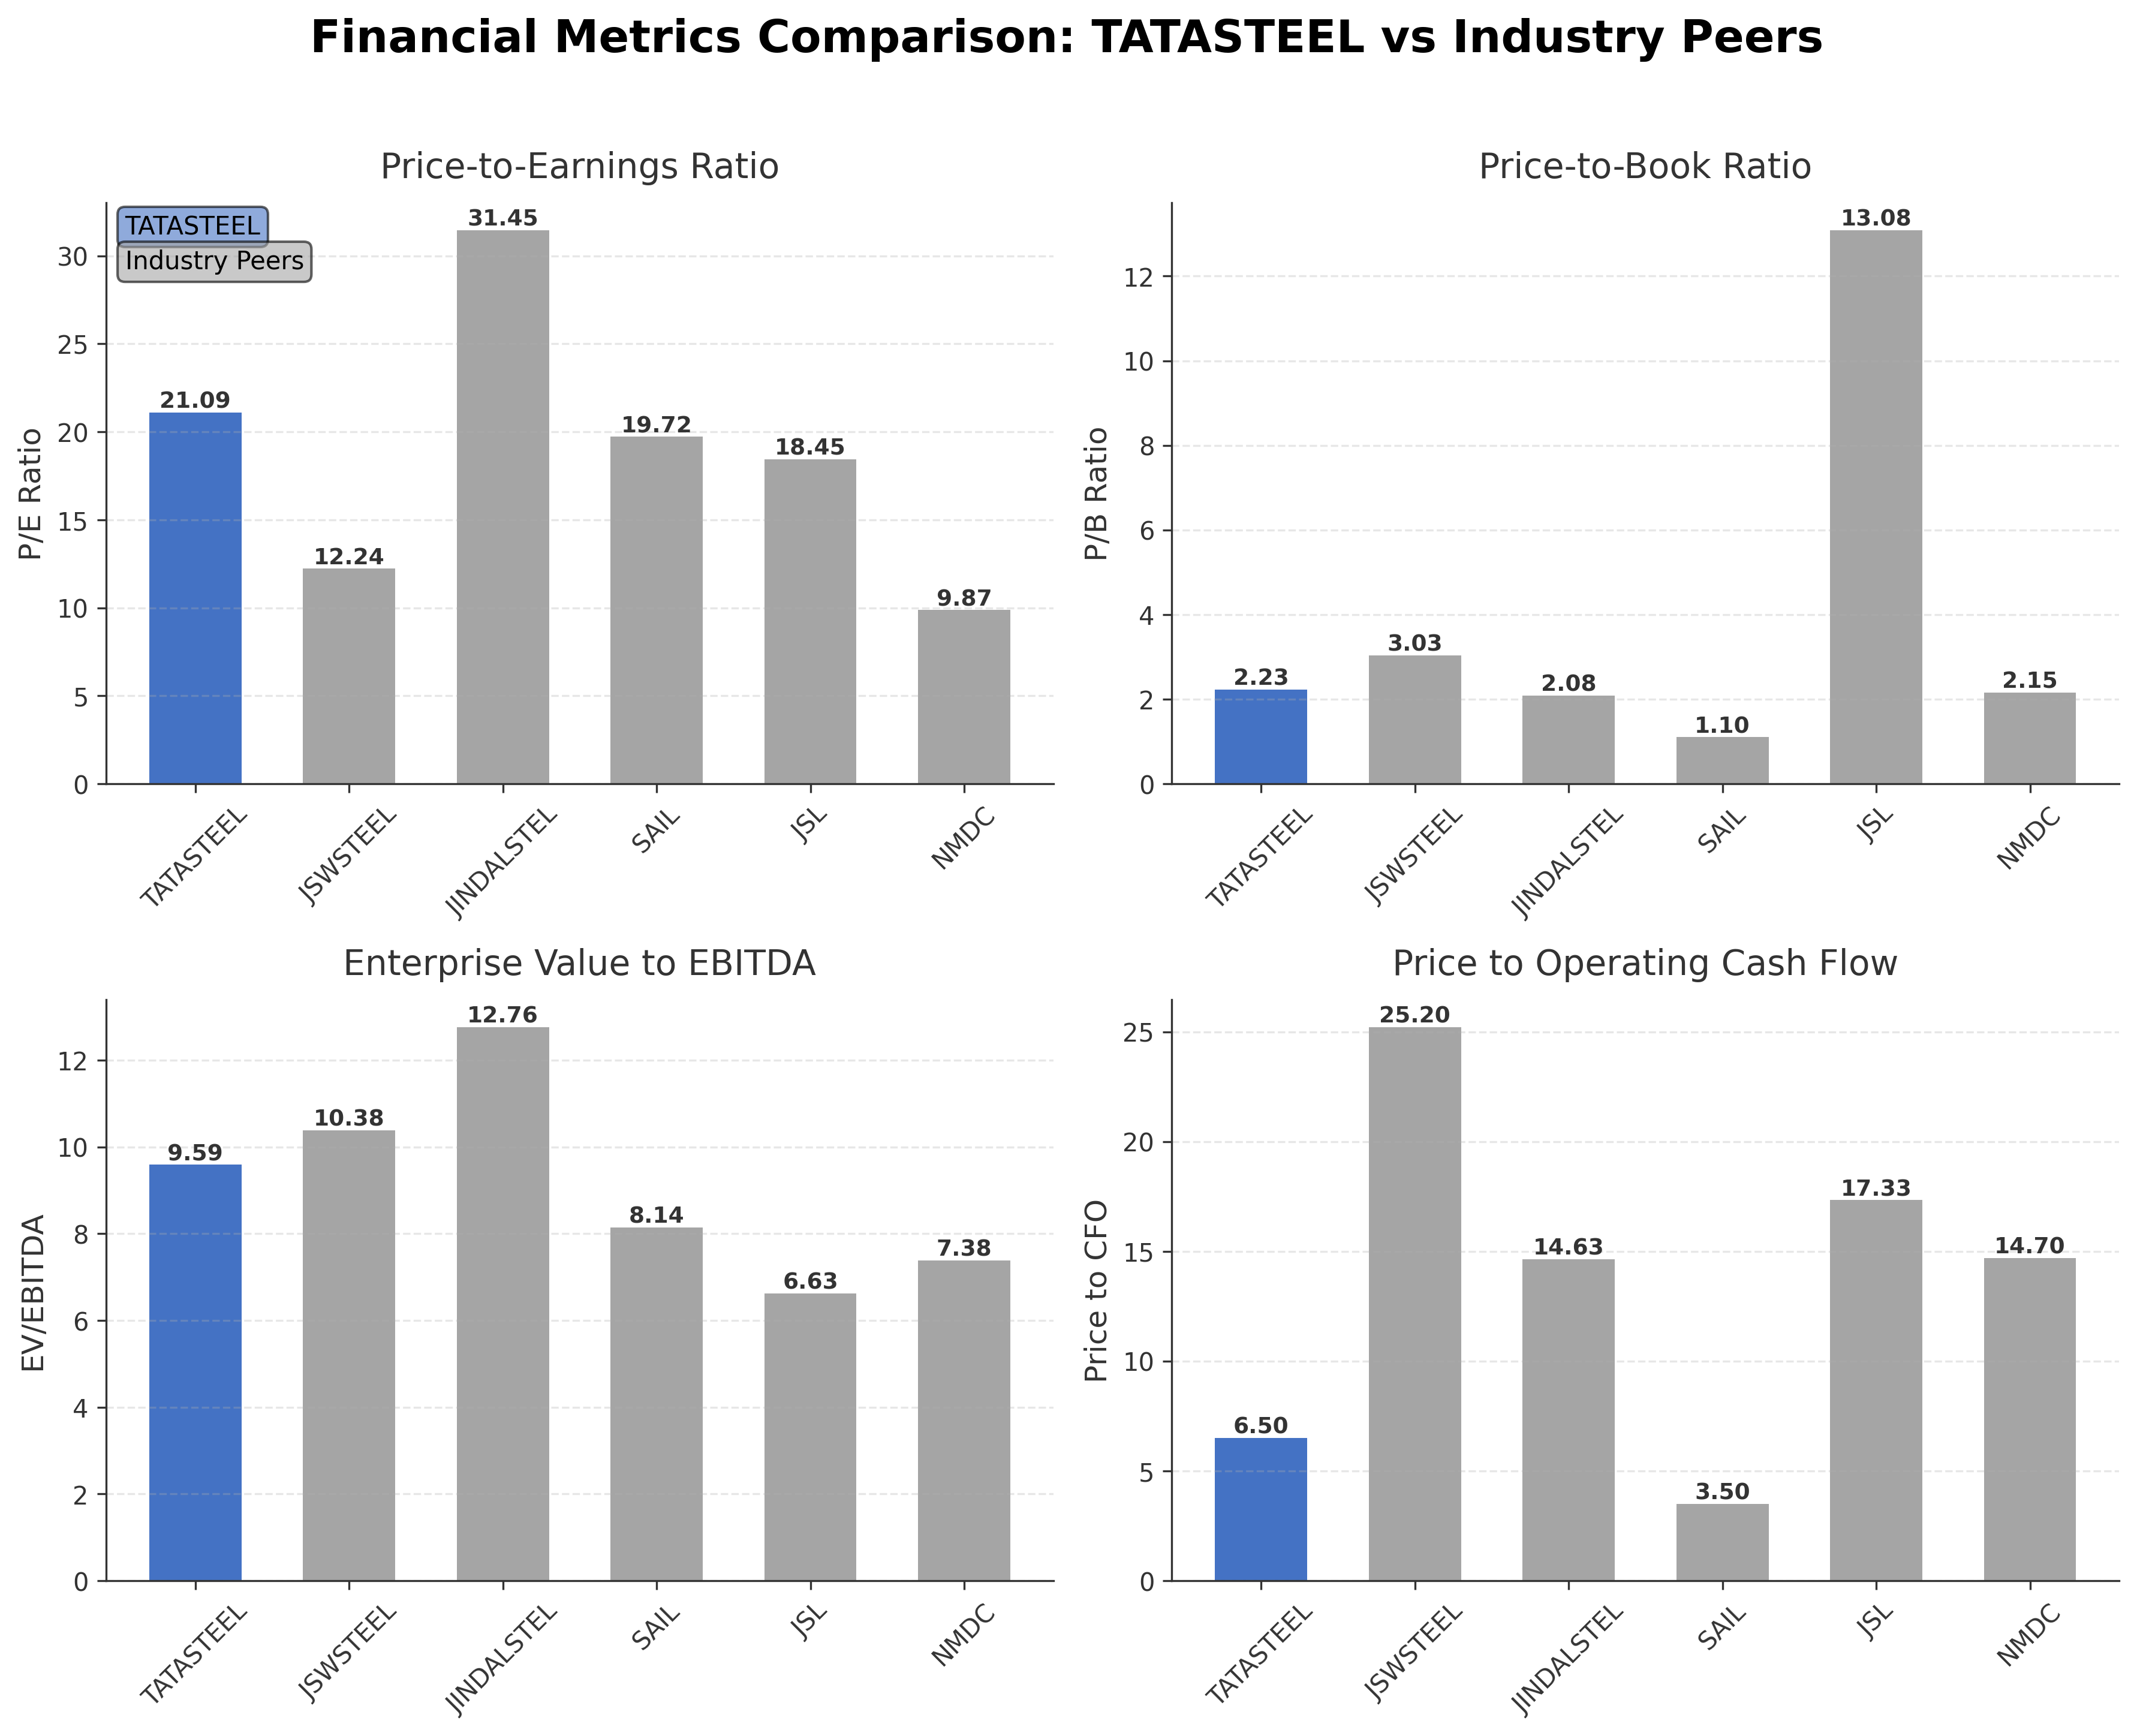
Comparison Analysis: Tata Steel Ltd. exhibits a moderate valuation profile compared to its Indian steel industry peers, with a trailing P/E of 21.09 higher than JSW Steel's 12.24 but lower than Jindal Steel & Power's 31.45. Its P/B ratio of 2.23 is below Jindal Stainless's elevated 13.08 but above SAIL's 1.10, indicating a balanced market valuation. The EV/EBITDA multiple of 9.59 is competitive within the peer group, reflecting operational efficiency. Tata Steel’s return on equity of 11.16% is moderate, trailing leaders like NMDC (23.36%) and JSW Steel (21.16%), but ahead of SAIL and Jindal Steel & Power. The price to cash flow ratio of 6.50 suggests relatively attractive cash flow valuation compared to peers with higher multiples.
Financial Metrics Comparison with Peers
Financial Statements
Comprehensive financial data including income, balance sheet, and cash flow metrics
Income Statement
| fiscal_date | 2026-03-31 | 2025-03-31 | 2024-03-31 | 2023-03-31 | 2022-03-31 |
|---|---|---|---|---|---|
| Sales | 2302.93B | 2168.40B | 2272.96B | 2416.36B | 2423.27B |
| Cost Of Goods | 1230.92B | 1230.99B | 1374.93B | 1477.30B | 1167.77B |
| Gross Profit | 1072.01B | 937.41B | 898.04B | 939.06B | 1255.50B |
| Operating Expense Selling General And Administrative | 147.02B | 143.27B | 136.42B | 133.44B | 126.19B |
| Operating Expense Other Operating Expenses | 308.95B | 278.87B | 294.78B | 279.83B | 266.95B |
| Operating Income | 223.98B | 144.58B | 104.66B | 196.17B | 528.31B |
| Non Operating Interest Income | 7.27B | 7.95B | 4.71B | 3.46B | 2.44B |
| Non Operating Interest Expense | 71.67B | 73.41B | 75.08B | 62.99B | 54.62B |
| Pretax Income | 159.69B | 84.13B | -11.47B | 182.35B | 502.27B |
| Income Tax | 50.83B | 52.39B | 37.63B | 101.60B | 84.78B |
| Net Income | 108.86B | 31.74B | -49.10B | 80.75B | 417.49B |
| Eps Basic | 8.65 | 2.74 | -3.62 | 7.17 | 33.24 |
| Eps Diluted | 8.65 | 2.74 | -3.62 | 7.17 | 33.21 |
| Basic Shares Outstanding | 12.47B | 12.47B | 12.27B | 12.21B | 12.21B |
| Diluted Shares Outstanding | 12.47B | 12.47B | 12.27B | 12.21B | 12.21B |
| Ebit | 231.36B | 157.54B | 63.61B | 245.34B | 556.89B |
| Ebitda | 357.75B | 264.96B | 228.88B | 332.49B | 646.01B |
| Net Income Continuous Operations | 159.69B | 84.13B | -11.47B | 182.35B | 502.27B |
| Minority Interests | -919.50M | 2.47B | 4.72B | 6.85B | -15.95B |
| Preferred Stock Dividends | 0.00 | 0.00 | 0.00 | 0.00 | 10.90M |
Data provided by Twelve Data
Balance Sheet
| fiscal_date | 2026-03-31 | 2025-03-31 | 2024-03-31 | 2023-03-31 | 2022-03-31 |
|---|---|---|---|---|---|
| Cash And Cash Equivalents | 88.85B | 96.05B | 70.81B | 121.30B | 156.05B |
| Accounts Receivable | 49.17B | 52.60B | 62.64B | 82.57B | 122.46B |
| Total Assets | 3012.54B | 2793.95B | 2734.24B | 2880.22B | 2854.46B |
| Total Liabilities | 1974.74B | 1880.42B | 1809.91B | 1828.47B | 1683.47B |
| Long Term Debt | 699.87B | 733.85B | 561.15B | 572.57B | 504.61B |
| Shareholders Equity | 1037.80B | 913.53B | 924.33B | 1051.75B | 1170.98B |
Data provided by Twelve Data
Cash Flow Statement
| fiscal_date | 2026-03-31 | 2025-03-31 | 2024-03-31 | 2023-03-31 | 2022-03-31 |
|---|---|---|---|---|---|
| Operating Activities Net Income | 159.69B | 84.13B | -11.47B | 182.35B | 502.27B |
| Operating Activities Other Non Cash Items | 79.54B | 48.55B | 112.04B | 56.55B | 59.27B |
| Operating Activities Other Assets Liabilities | 54.42B | 22.07B | 33.84B | -37.06B | -96.18B |
| Operating Activities Operating Cash Flow | 293.65B | 154.74B | 134.40B | 201.83B | 465.36B |
| Investing Activities Capital Expenditures | -131.58B | -144.07B | -177.31B | -138.15B | -99.53B |
| Investing Activities Net Acquisitions | -22.35B | 221.00M | 1.23B | -104.03B | -556.50M |
| Investing Activities Purchase Of Investments | -17.00B | -8.77B | -4.78B | -3.26B | -11.71B |
| Investing Activities Sale Of Investments | 11.09B | 5.54B | 31.71B | 52.14B | 625.60M |
| Investing Activities Other Investing Activity | 105.70M | 19.70M | 19.20M | 29.50M | 176.80M |
| Investing Activities Investing Cash Flow | -159.74B | -147.06B | -149.14B | -193.26B | -110.99B |
| Financing Activities Long Term Debt Issuance | 120.92B | 238.93B | 133.29B | 167.69B | 9.07B |
| Financing Activities Long Term Debt Payments | -238.97B | -160.79B | -117.51B | -46.06B | -263.60B |
| Financing Activities Short Term Debt Issuance | 38.61B | -15.18B | 7.91B | -56.20B | 115.32B |
| Financing Activities Common Dividends | -44.90B | -44.90B | -44.29B | -62.93B | -30.20B |
| Financing Activities Other Financing Charges | 2.74B | 2.82B | 2.47B | 21.60M | -7.89B |
| Financing Activities Financing Cash Flow | -121.59B | 20.88B | -18.13B | 2.53B | -174.04B |
| End Cash Position | 88.85B | 96.05B | 70.81B | 121.30B | 156.07B |
| Free Cash Flow | 205.05B | 78.41B | 20.94B | 75.41B | 338.59B |
| Financing Activities Common Stock Issuance | N/A | N/A | 0.00 | 13.70M | 3.26B |
Data provided by Twelve Data
Technical Analysis
Key Insights
- The stock is currently in an upward trend, trading above its 10-day, 50-day (₹197.73), and 200-day (₹192.09) moving averages, indicating bullish momentum.
- Key support levels are identified near ₹152.51 (52-week low) and ₹180, while resistance is observed around ₹224.40 (52-week high).
- The price remains above the 50-day and 200-day moving averages, suggesting sustained medium- and long-term strength.
- Momentum indicators show RSI in a neutral to slightly bullish range, MACD trending positively, and stochastic oscillators indicating potential continuation of upward momentum.
- Daily and weekly charts confirm a steady uptrend, while monthly charts reflect consolidation with a positive bias.
- Current technical setup supports scenarios of continued price appreciation with potential pullbacks near resistance, emphasizing the importance of monitoring volume and momentum shifts.
Trending News
1. Headline: Tata Steel Share Price Highlights: Tata Steel Stock Price History - The Economic Times
Summary: Discover the Tata Steel Stock Liveblog, your go-to destination for real-time updates and comprehensive analysis of a top-performing stock. Keep track of Tata Steel's latest details, including: Last traded price 182.67, Market capitalization: 228036.67, Volume: 16117953, Price-to-earnings ratio ...
Sentiment: neutral
Summary: Tata Steel Share Price: Find the latest news on Tata Steel Stock Price. Get all the information on Tata Steel with historic price charts for NSE / BSE. Experts & Broker view also get the Tata Steel Ltd. buy/sell tips detailed news, announcements, Forecasts, Analysts, Valuation, Earning forecasts, ...
Sentiment: neutral
3. Headline: Tata Steel stock holds steady on long-term earnings recovery
Summary: Tata Steel stock tracks a recovery story built on FY2025 revenue of INR 2.18 trillion, net profit of INR 3,173 crore, and EBITDA of INR 25,802 crore. The latest investor context on 23 July 2026 still centers on margins, debt, and steel-cycle sensitivity.
Sentiment: positive
Summary: JSW Steel’s consolidated steel volumes in the June 2026 quarter were the best ever for the first quarter of a financial year, coupled with a 4.0% y-o-y rise in steel volumes in the quarter. The company will add incremental steel volumes in the September 2026 helped by the ramp up in its steel ...
Sentiment: positive
5. Headline: Tata Steel Q1 Results: Date, Time, Dividend News, Earnings Call Schedule And More
Summary: Shares of Tata Steel closed 0.22% higher at Rs 185.49 apiece on the NSE, as against the benchmark Nifty settling over 1% higher on Friday.
Sentiment: positive
Powered by Brave
Recent Updates
News Summary
As of July 30, 2026. Tata Steel Ltd. is set to announce its Q1 FY27 financial results, which will provide insights into the impact of its ₹27,000 crore Kalinganagar Phase II expansion on domestic steel production capacity. The company has also approved the merger of NINL and a $2 billion investment in T Steel Holdings Pte. Ltd., signaling strategic growth initiatives. Tata Steel continues to engage in renewable energy sourcing agreements, such as with Tata Power Renewable Energy Ltd., aiming to support sustainability goals. Management has emphasized a balanced capital allocation strategy focused on sustaining projects and value-added downstream investments. These developments collectively indicate ongoing efforts to enhance operational scale and financial resilience.
News Sentiment
The overall sentiment from recent updates is neutral to positive, driven by strategic capacity expansions and investment approvals that underscore growth ambitions. The upcoming Q1 results are anticipated as a key event to assess financial performance amid these initiatives. Renewable energy agreements contribute positively to the company’s sustainability profile, while management’s balanced capital allocation approach reflects prudent financial governance. No significant negative news or regulatory challenges were reported in the recent updates, maintaining a stable outlook.
Source List
- https://www.tatasteel.com/investors/financial-performance/earnings-release/
- https://www.tatasteel.com/investors/financial-performance/financial-results/
- https://www.tatasteel.com/investors/
- https://trendlyne.com/latest-news/1366/TATASTEEL/tata-steel-ltd/
Analytical Overview
Analysis Summary
Tata Steel’s valuation metrics show a trailing P/E of 21.09 and a forward P/E of 9.72, which are in line with or slightly below the industry average P/E of 21.09, indicating a reasonable valuation relative to peers. The company’s revenue growth of 12.5% year-over-year and positive quarterly earnings growth of 124.9% reflect a strong growth trajectory supported by capacity expansions and operational improvements. Financial health is balanced with a total debt to equity ratio of 0.89 and robust operating cash flow of INR 350.6 billion, although the current ratio of 0.75 suggests moderate short-term liquidity constraints. Sector-specific challenges include steel cycle volatility and regulatory pressures, while opportunities arise from infrastructure demand and sustainability initiatives in India’s evolving market environment.
Overall Business and Market Assessment
Supporting Factors: strong revenue growth of 12.5%, improving profitability with a net margin of 4.65%, and strategic capacity expansion projects
Risk Factors: steel price volatility, debt levels, and competitive pressures from larger peers like JSW Steel
SWOT Analysis
Strengths
- Strong integrated steel manufacturing capabilities with diversified product offerings.
- Robust revenue growth of 12.5% year-over-year and improving profit margins.
- Significant market presence in India and international steel markets.
- Substantial operating cash flow supporting capital expenditures and expansions.
Weaknesses
- Moderate short-term liquidity with a current ratio below 1 at 0.75.
- Relatively high debt-to-equity ratio of 0.89 indicating leverage risks.
- Profit margin of 4.65% is modest compared to industry leaders.
- Dependence on cyclical steel market conditions impacting earnings stability.
Opportunities
- Expansion of domestic capacity through ₹27,000 crore Kalinganagar Phase II project.
- Growing demand in automotive, construction, and infrastructure sectors in India.
- Strategic investments in renewable energy to enhance sustainability profile.
- Potential benefits from mergers and acquisitions such as NINL integration.
Threats
- Volatility in global steel prices and raw material costs.
- Regulatory and environmental compliance challenges in multiple jurisdictions.
- Intense competition from domestic and international steel producers.
- Macroeconomic uncertainties affecting infrastructure and industrial demand.
Company Description
Tata Steel Ltd. is a notable entity in the global steel industry, recognized for its comprehensive production and distribution of various steel products. As an integrated steel manufacturing company, its primary function is the production of a wide range of steel products, including automotive steel, construction steel, and specialty products for various industrial applications. With a focus on innovation and sustainability, Tata Steel influences major sectors such as automotive, construction, and infrastructure, contributing to the development of durable and environmentally responsible materials. Headquartered in Mumbai, India, Tata Steel holds significant market importance due to its widespread operations and influence in steel markets across Asia, Europe, and beyond. Established in 1907, the company is part of the Tata Group, which is one of India's largest and oldest industrial conglomerates, underscoring its longstanding contribution to both national and international markets.