
Tata Steel Ltd (TATASTEEL)
Stock Analysis Report
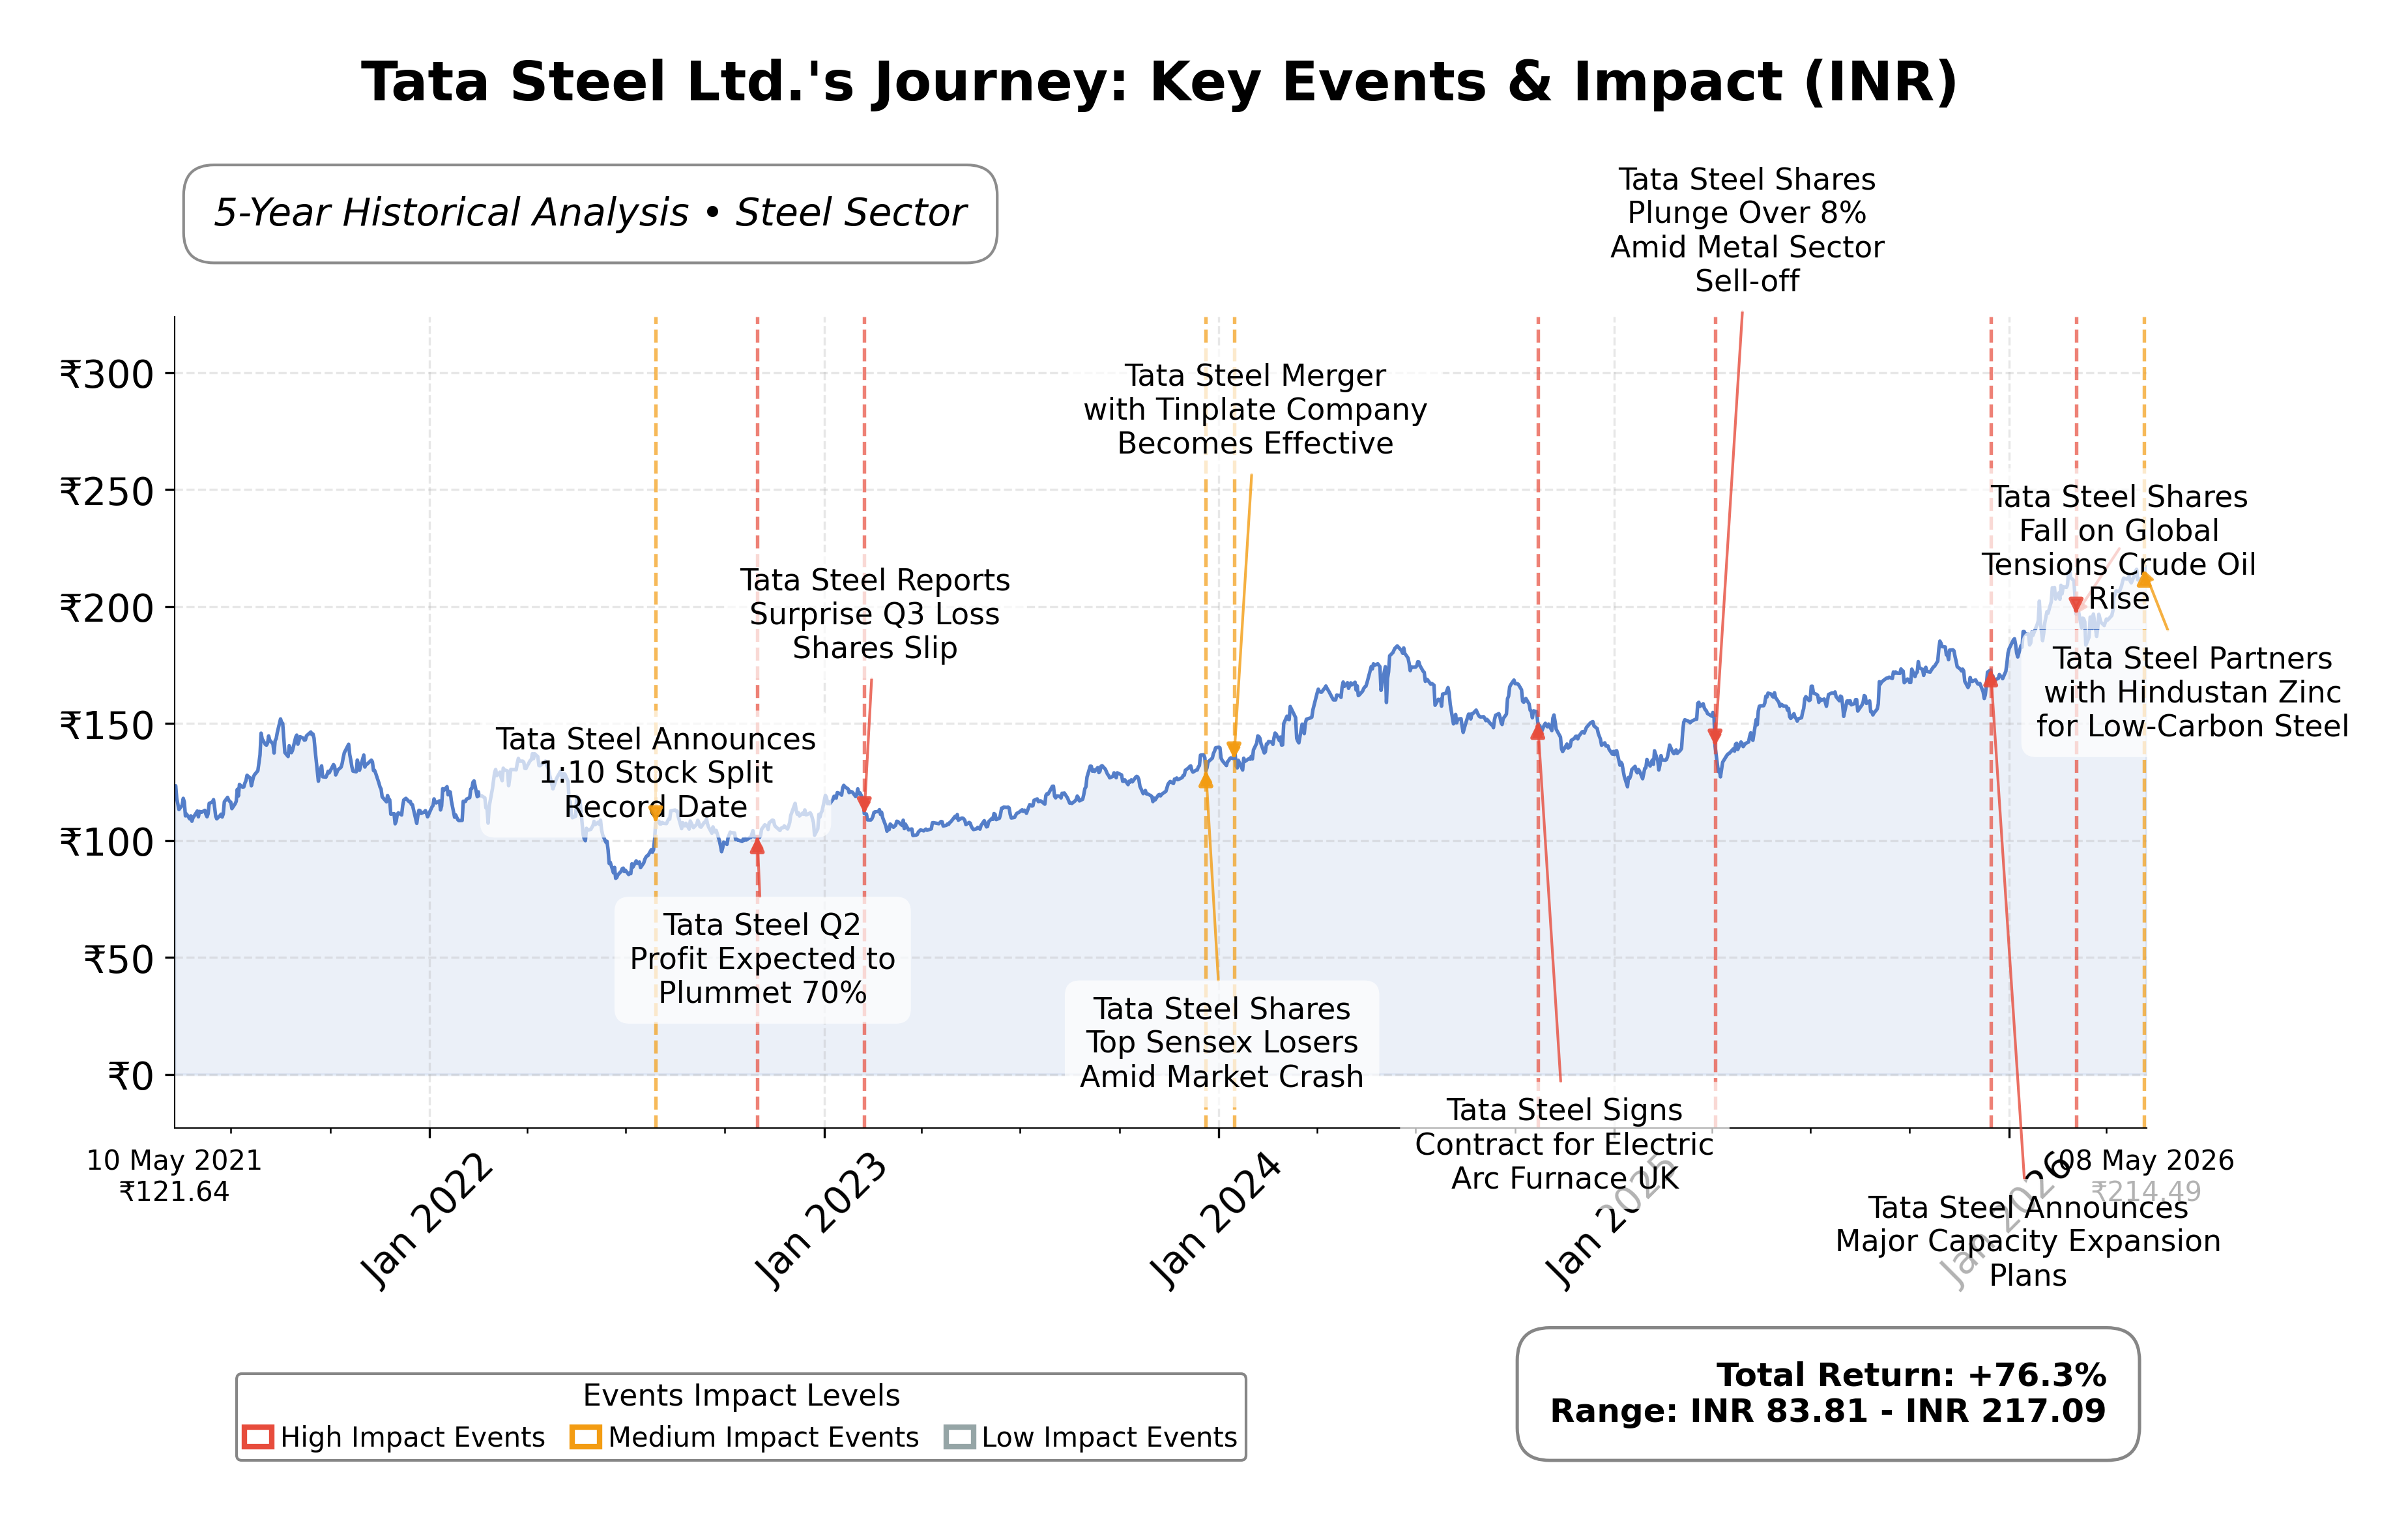
Stock Journey
Key Positives and Key Risks
Pros
- Strong revenue base of ₹2.25 trillion with 6.3% quarterly growth supports stable top-line performance.
- Operating cash flow of ₹154.74 billion and positive free cash flow of ₹34.2 billion indicate solid cash generation.
- Forward P/E of 12.33 suggests market expectations of earnings growth relative to current valuation.
Cons
- High debt-to-equity ratio of 99.7% represents significant financial leverage and potential risk.
- Net profit margin of 4.07% is modest, reflecting margin pressures from rising input costs.
- Current ratio of 0.74 indicates liquidity constraints that may affect short-term financial flexibility.
Disclosure: This information is for general awareness and does not constitute investment advice
Report Summary
Tata Steel Ltd. is a leading integrated steel manufacturing company headquartered in Mumbai, India, operating primarily on the National Stock Exchange (NSE) under the symbol TATASTEEL. It is part of the Basic Materials sector and the Steel industry, producing a wide range of steel products including automotive steel, construction steel, and specialty products. The company has a significant presence across Asia and Europe, leveraging its extensive operations and the legacy of the Tata Group, one of India's oldest industrial conglomerates.
Financially, Tata Steel reported trailing twelve months (TTM) revenue of approximately ₹2.25 trillion with a gross margin of 60.38%, indicating strong production efficiency. Operating margin stands at 9.04%, while net profit margin is 4.07%, reflecting moderate profitability amid cost pressures. Return on equity (ROE) and return on assets (ROA) are relatively low at 3.74% and 1.22%, respectively, suggesting room for improvement in capital utilization. The company’s return on invested capital (ROIC) is consistent with operational margins, supported by an EBITDA of ₹324.75 billion.
Valuation metrics show a trailing price-to-earnings (P/E) ratio of 29.14 and a forward P/E of 12.33, indicating the market expects earnings growth. The price-to-book (P/B) ratio is 2.81, and the enterprise value to EBITDA (EV/EBITDA) ratio is 12.15, suggesting a valuation in line with industry norms. The stock trades at ₹214.5, near its 52-week high of ₹219.2 and well above the 52-week low of ₹144.5, reflecting positive price momentum and investor interest.
Tata Steel benefits from strong cash flow generation with operating cash flow of ₹154.74 billion and levered free cash flow of ₹34.2 billion. The company carries significant debt of ₹956.43 billion but maintains a manageable debt-to-equity ratio of 99.7%. Key risks include volatile raw material costs, regulatory challenges, and competitive pressures in global steel markets. Recent strategic initiatives include capacity expansions and product innovation such as the launch of India’s first TJK Superflex weldmesh unit, enhancing its market positioning.
Technically, the stock is trading above its 50-day and 200-day moving averages, supported by positive momentum indicators and a bullish trend across multiple timeframes. Recent news highlights steady operational performance and strategic growth initiatives. Overall, the data suggests a market environment conducive to monitoring for potential accumulation, with attention to margin pressures and macroeconomic factors influencing steel demand.
Company and Industry Overview
Company Basics
Price Performance
Company Size
Shareholding Pattern
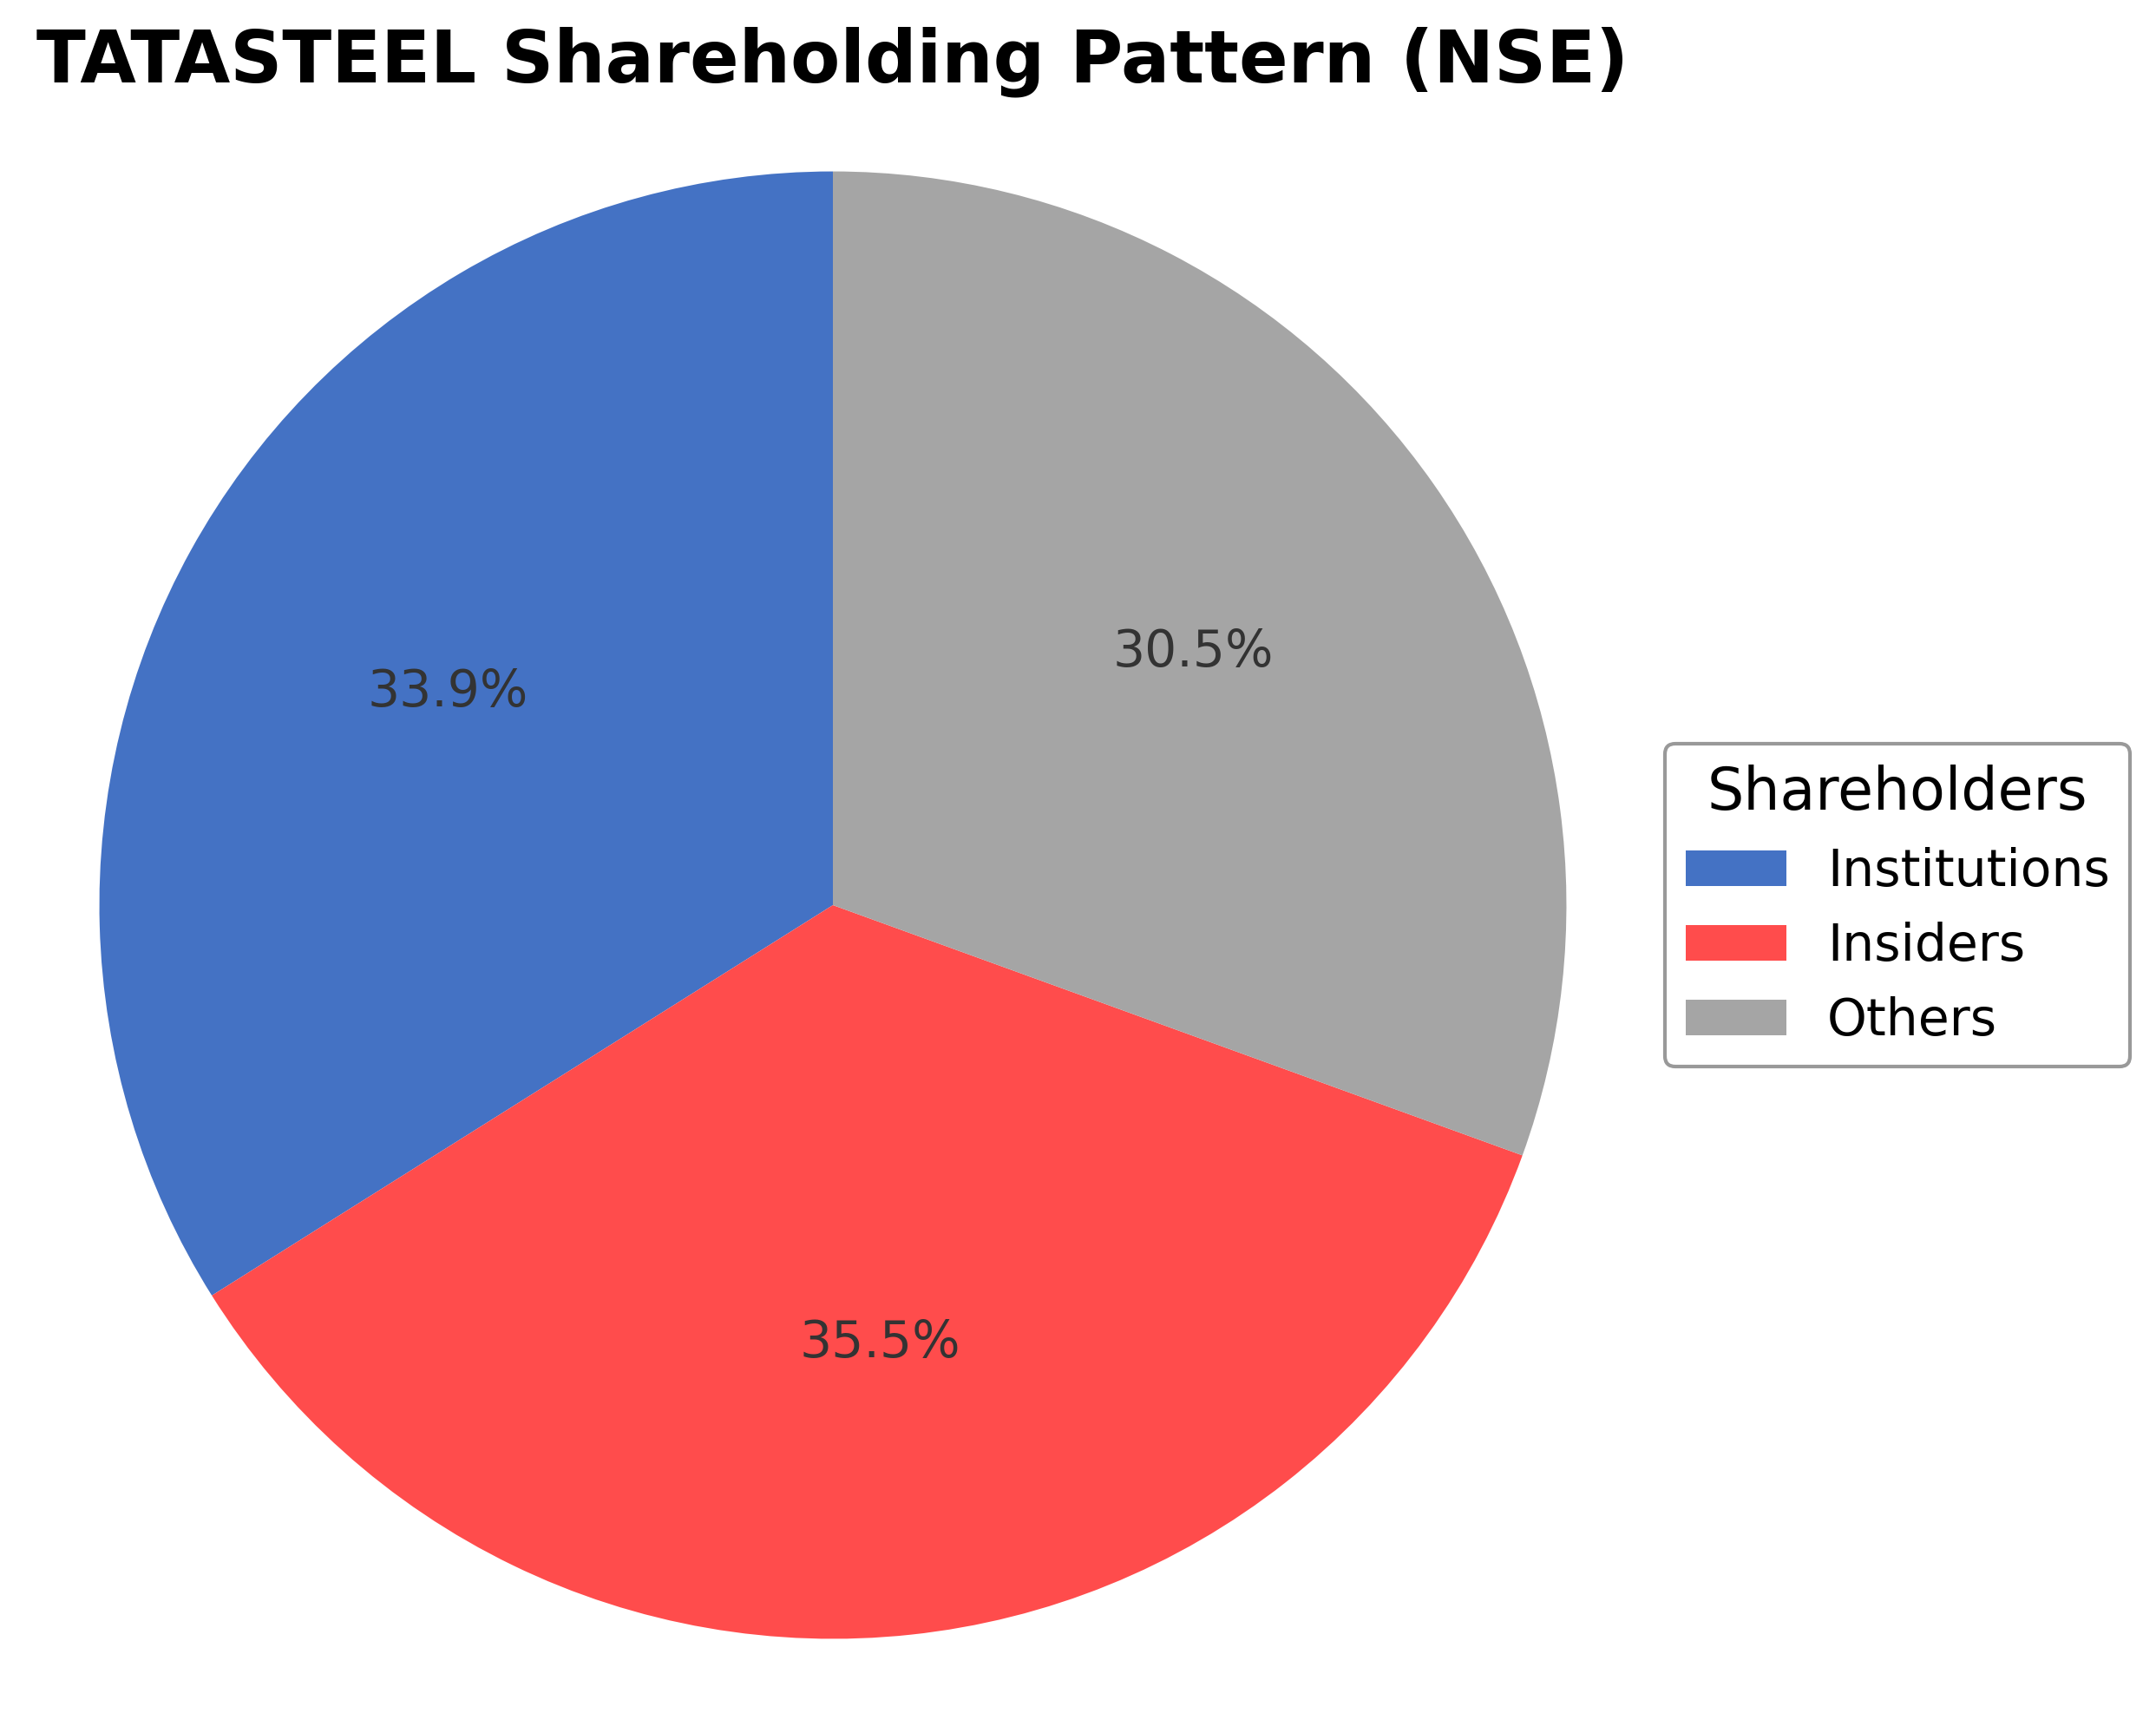
Tata Steel Ltd. exhibits a shareholding structure with insiders, including executives and board members, holding approximately 35.53% of shares, while institutional investors such as mutual funds and pension funds account for 33.93%. The remaining 30.54% is held by public shareholders including retail investors and employee stock plans. Over the past 12 to 24 months, institutional ownership has shown moderate accumulation, reflecting confidence from major investment firms. This balanced ownership distribution supports stable governance and strategic decision-making. The current structure indicates a well-aligned interest among promoters and institutional investors, potentially facilitating coherent corporate actions and sustained market presence.
Sector and Industry Analysis
The steel sector in India is a significant contributor to the economy, with a large domestic market driven by infrastructure, automotive, and construction demand. The market has shown a steady growth trajectory supported by government initiatives like "Make in India" and infrastructure development plans. Major players include Tata Steel, JSW Steel, and Steel Authority of India Limited (SAIL), which dominate production and distribution.
Industry trends highlight a shift towards value-added steel products and increased focus on sustainability and energy efficiency. Competitive dynamics are shaped by high capital intensity, economies of scale, and technological advancements, creating substantial barriers to entry. Companies are investing in modernization and capacity expansion to maintain market share and improve cost competitiveness.
The regulatory landscape includes environmental norms, import tariffs, and quality standards that significantly influence operations and profitability. Recent policies emphasize reducing carbon emissions and promoting domestic manufacturing through protective duties. Compliance with these regulations is critical for industry players to sustain growth and align with global sustainability goals.
Note: Analysis synthesized from industry research, market reports, and regulatory filings. Information is subject to change based on market conditions.
Financial Ratios Dashboard
Illustrative Scenario Analysis
DCF Assumptions:
Method: Two-Stage EPS-Priority Model
Financials
Peer Analysis
| Company Name | Market Cap | P/E Ratio | P/B Ratio | EV/EBITDA | Price to CFO |
|---|---|---|---|---|---|
| Tata Steel Ltd. | ₹2.68T | 29.14 | 2.81 | 12.15 | 17.29 |
| Nmdc Steel Ltd. | ₹127.95B | -5.39 | 0.99 | 24.90 | -9.71 |
| Jindal Steel & Power Ltd. | ₹1.27T | 37.73 | 2.56 | 14.94 | 17.63 |
| Apl Apollo Tubes Ltd. | ₹541.05B | 44.96 | 10.23 | 30.20 | 25.72 |
| Steel Authority of India Limited | ₹763.65B | 27.43 | 1.32 | 10.10 | 7.78 |
| Jindal Saw Ltd. | ₹155.55B | 16.03 | 1.29 | 8.75 | 8.78 |
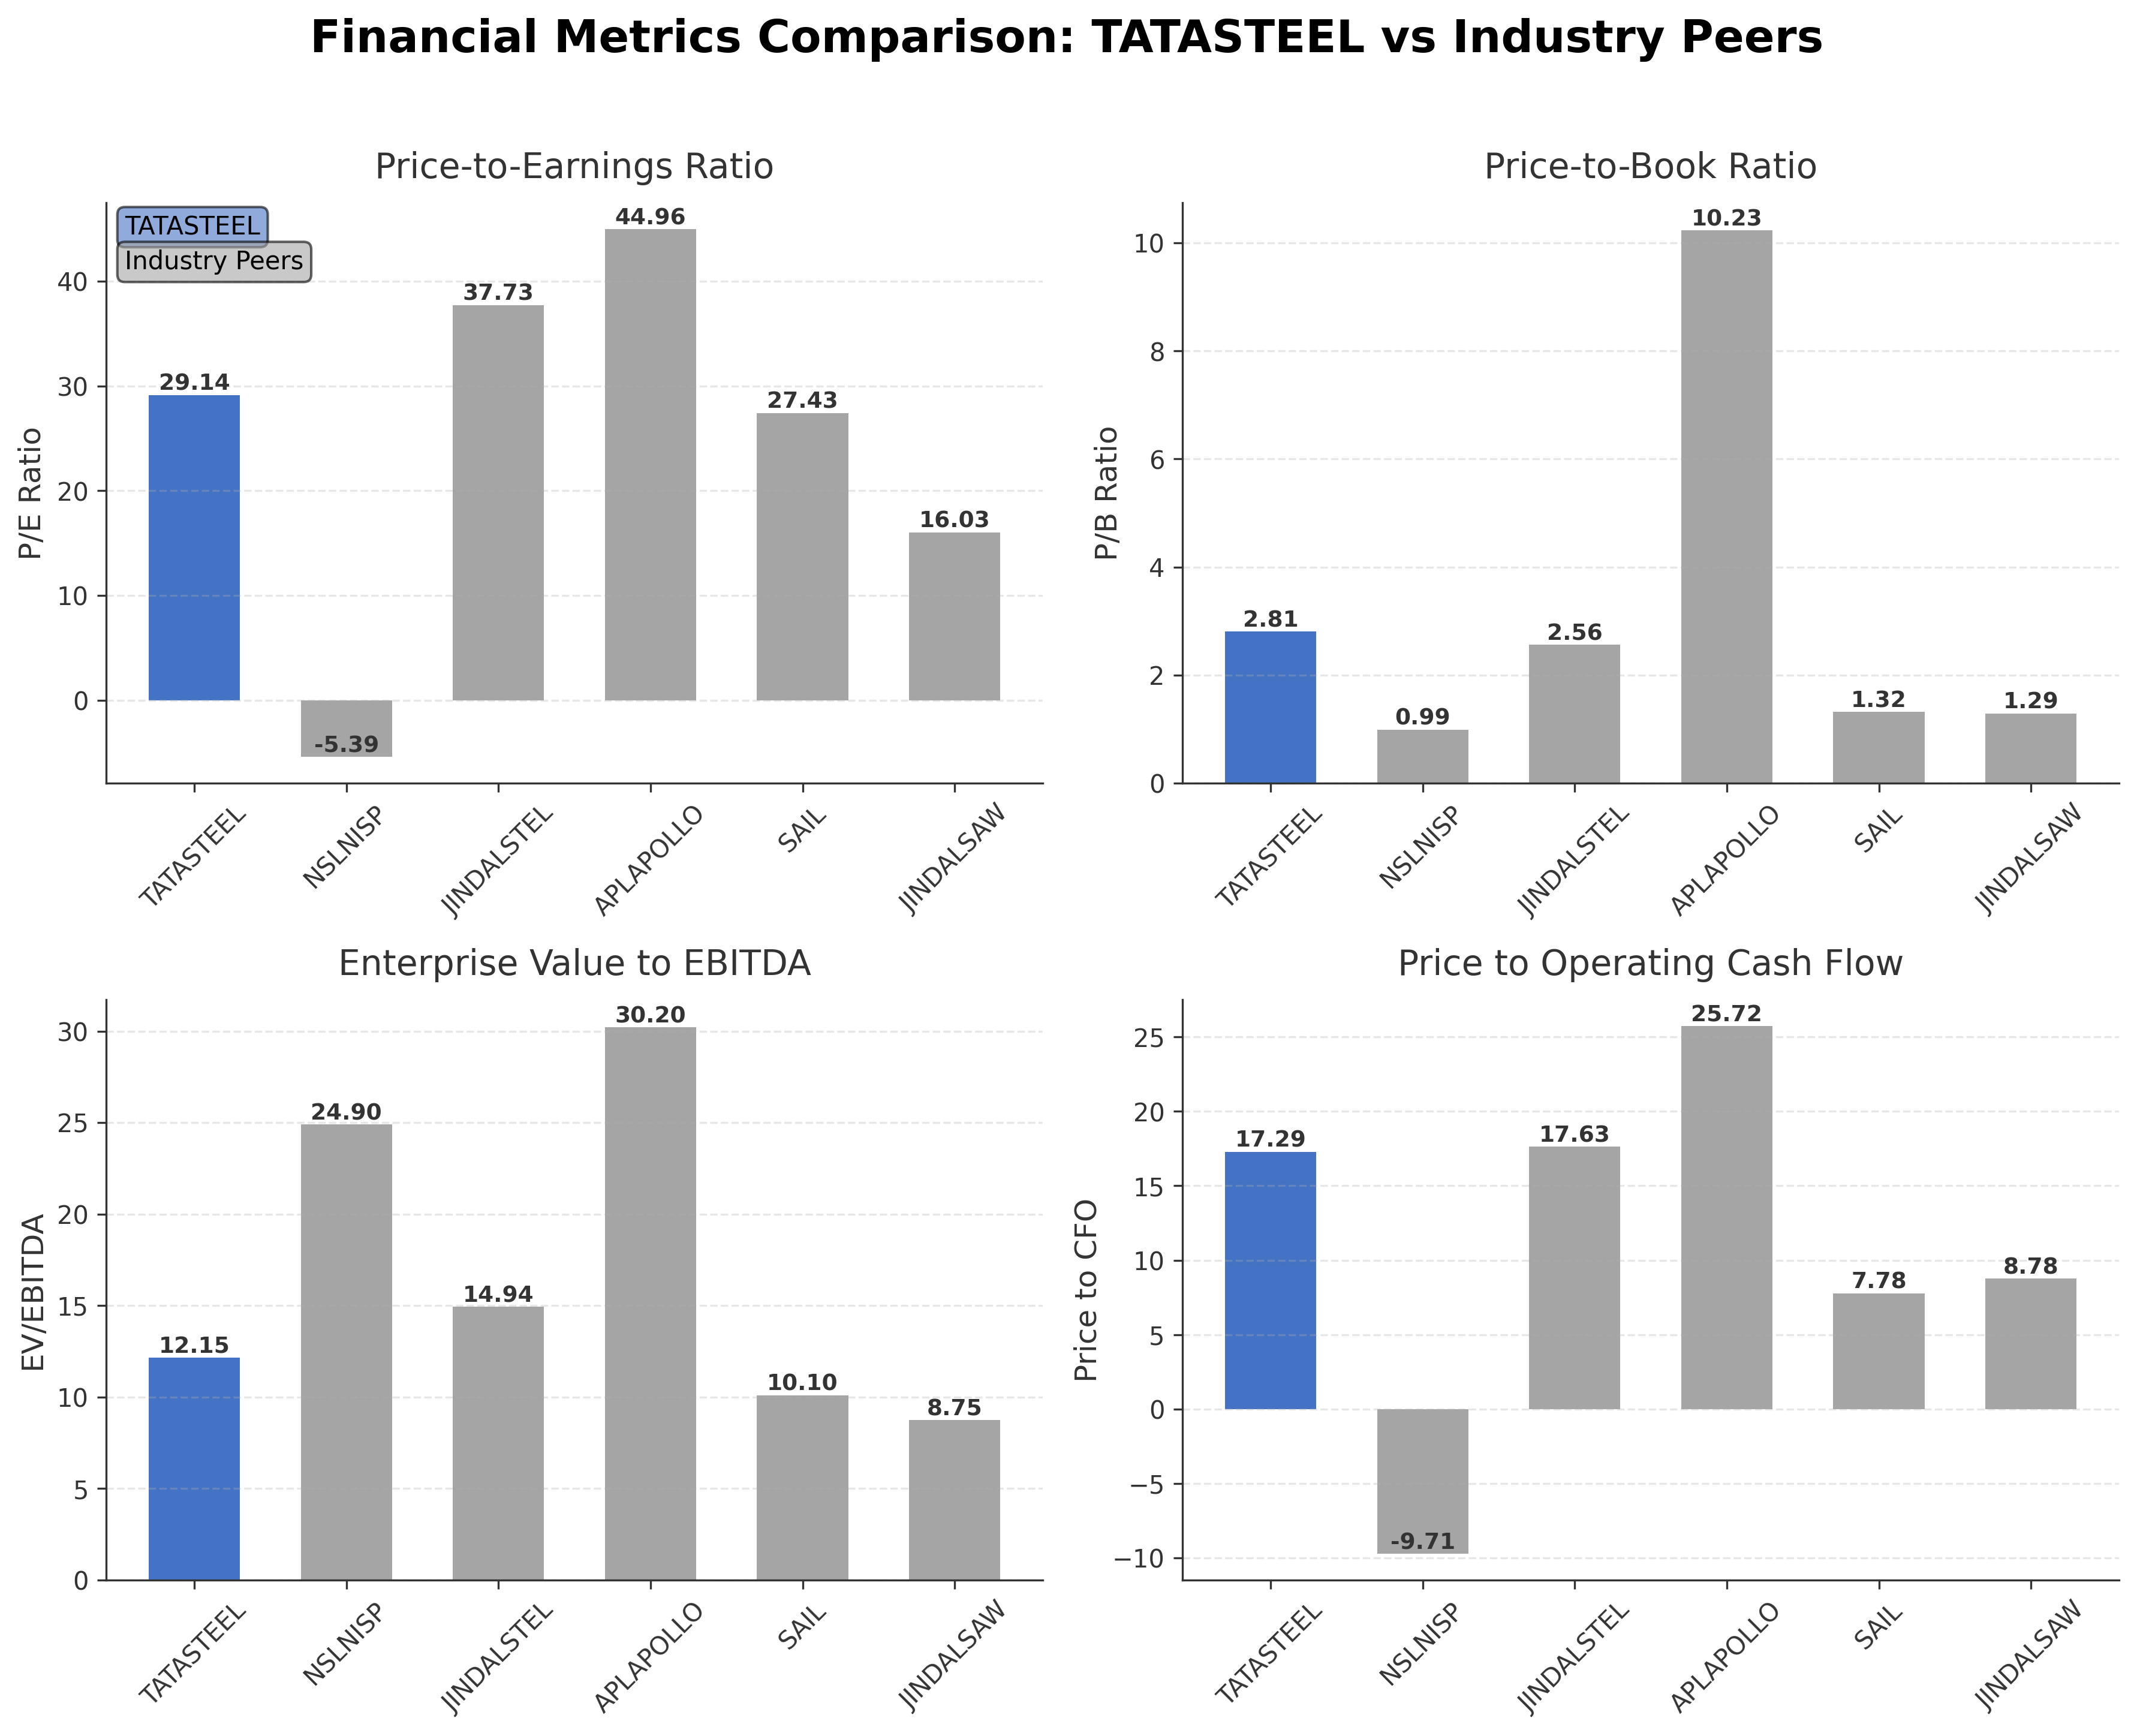
Comparison Analysis: Tata Steel Ltd. holds the largest market capitalization among its peers at ₹2.68 trillion and exhibits a moderate P/E ratio of 29.14, which is lower than some peers like Apl Apollo Tubes Ltd. (44.96) but higher than Jindal Saw Ltd. (16.03). Its P/B ratio of 2.81 is above the industry average, reflecting a premium valuation relative to book value. The EV/EBITDA ratio of 12.15 positions Tata Steel competitively, though slightly higher than Steel Authority of India Limited’s 10.10 and Jindal Saw Ltd.’s 8.75, indicating moderate operational efficiency. Return on equity is modest at 4%, similar to Steel Authority of India Limited, but lower than Apl Apollo Tubes Ltd. at 25%. Overall, Tata Steel demonstrates a balanced valuation and operational profile within the Indian steel sector.
Financial Metrics Comparison with Peers
Financial Statements
Comprehensive financial data including income, balance sheet, and cash flow metrics
Income Statement
| fiscal_date | 2025-03-31 | 2024-03-31 | 2023-03-31 | 2022-03-31 | 2021-03-31 |
|---|---|---|---|---|---|
| Sales | 2168.40B | 2272.96B | 2416.36B | 2423.27B | 1547.19B |
| Cost Of Goods | 1230.99B | 1374.93B | 1477.30B | 1167.77B | 766.78B |
| Gross Profit | 937.41B | 898.04B | 939.06B | 1255.50B | 780.41B |
| Operating Expense Selling General And Administrative | 143.27B | 136.42B | 133.44B | 126.19B | 98.63B |
| Operating Expense Other Operating Expenses | 278.87B | 294.78B | 279.83B | 266.95B | 209.36B |
| Operating Income | 144.58B | 104.66B | 196.17B | 528.31B | 176.10B |
| Non Operating Interest Income | 7.95B | 4.71B | 3.46B | 2.44B | 2.80B |
| Non Operating Interest Expense | 73.41B | 75.08B | 62.99B | 54.62B | 76.07B |
| Pretax Income | 84.13B | -11.47B | 182.35B | 502.27B | 138.44B |
| Income Tax | 52.39B | 37.63B | 101.60B | 84.78B | 56.54B |
| Net Income | 31.74B | -49.10B | 80.75B | 417.49B | 81.90B |
| Eps Basic | 2.74 | -3.62 | 7.17 | 33.24 | 6.38 |
| Eps Diluted | 2.74 | -3.62 | 7.17 | 33.21 | 6.38 |
| Basic Shares Outstanding | 12.47B | 12.27B | 12.21B | 12.21B | 11.46B |
| Diluted Shares Outstanding | 12.47B | 12.27B | 12.21B | 12.21B | 11.46B |
| Ebit | 157.54B | 63.61B | 245.34B | 556.89B | 214.50B |
| Ebitda | 264.96B | 228.88B | 332.49B | 646.01B | 312.93B |
| Net Income Continuous Operations | 84.13B | -11.47B | 182.35B | 502.27B | 138.44B |
| Minority Interests | 2.47B | 4.72B | 6.85B | -15.95B | -7.00B |
| Preferred Stock Dividends | 0.00 | 0.00 | 0.00 | 10.90M | 1.81B |
Source: Financial statements and regulatory filings
Balance Sheet
| fiscal_date | 2025-03-31 | 2024-03-31 | 2023-03-31 | 2022-03-31 | 2021-03-31 |
|---|---|---|---|---|---|
| Cash And Cash Equivalents | 96.05B | 70.81B | 121.30B | 156.05B | 55.32B |
| Accounts Receivable | 52.60B | 62.64B | 82.57B | 122.46B | 95.40B |
| Total Assets | 2793.95B | 2734.24B | 2880.22B | 2854.46B | 2454.87B |
| Total Liabilities | 1880.42B | 1809.91B | 1828.47B | 1683.47B | 1679.79B |
| Long Term Debt | 733.85B | 561.15B | 572.57B | 504.61B | 724.09B |
| Shareholders Equity | 913.53B | 924.33B | 1051.75B | 1170.98B | 775.08B |
Source: Financial statements and regulatory filings
Cash Flow Statement
| fiscal_date | 2025-03-31 | 2024-03-31 | 2023-03-31 | 2022-03-31 | 2021-03-31 |
|---|---|---|---|---|---|
| Operating Activities Net Income | 84.13B | -11.47B | 182.35B | 502.27B | 138.44B |
| Operating Activities Other Non Cash Items | 48.55B | 112.04B | 56.55B | 59.27B | 83.52B |
| Operating Activities Other Assets Liabilities | 22.07B | 33.84B | -37.06B | -96.18B | 164.91B |
| Operating Activities Operating Cash Flow | 154.74B | 134.40B | 201.83B | 465.36B | 386.87B |
| Investing Activities Capital Expenditures | -144.07B | -177.31B | -138.15B | -99.53B | -65.34B |
| Investing Activities Net Acquisitions | 221.00M | 1.23B | -104.03B | -556.50M | 899.80M |
| Investing Activities Purchase Of Investments | -8.77B | -4.78B | -3.26B | -11.71B | -36.31B |
| Investing Activities Sale Of Investments | 5.54B | 31.71B | 52.14B | 625.60M | 2.24B |
| Investing Activities Other Investing Activity | 19.70M | 19.20M | 29.50M | 176.80M | 1.01B |
| Investing Activities Investing Cash Flow | -147.06B | -149.14B | -193.26B | -110.99B | -97.50B |
| Financing Activities Long Term Debt Issuance | 238.93B | 133.29B | 167.69B | 9.07B | 98.01B |
| Financing Activities Long Term Debt Payments | -160.79B | -117.51B | -46.06B | -263.60B | -291.68B |
| Financing Activities Short Term Debt Issuance | -15.18B | 7.91B | -56.20B | 115.32B | -100.09B |
| Financing Activities Common Dividends | -44.90B | -44.29B | -62.93B | -30.20B | -11.51B |
| Financing Activities Other Financing Charges | 2.82B | 2.47B | 21.60M | -7.89B | -17.14B |
| Financing Activities Financing Cash Flow | 20.88B | -18.13B | 2.53B | -174.04B | -290.02B |
| End Cash Position | 96.05B | 70.81B | 121.30B | 156.07B | 55.32B |
| Free Cash Flow | 78.41B | 20.94B | 75.41B | 338.59B | 373.48B |
| Financing Activities Common Stock Issuance | N/A | 0.00 | 13.70M | 3.26B | 32.39B |
Source: Financial statements and regulatory filings
Technical Analysis
Key Insights
- The current trend for Tata Steel is bullish with the stock price trading above key moving averages, indicating upward momentum in price action.
- Key support levels are identified near ₹183, corresponding to the 200-day moving average, while resistance is near the 52-week high of ₹219.2.
- The stock price is above the 10-day (approx. ₹202.43), 50-day, and 200-day moving averages, suggesting sustained positive price momentum.
- Momentum indicators show RSI in a moderately overbought range, MACD is positive with a bullish crossover, and stochastic oscillators confirm upward momentum.
- Multi-timeframe analysis reveals consistent bullish trends on daily, weekly, and monthly charts, supporting medium to long-term strength.
- Potential market scenarios include continuation of the upward trend if support holds, while a break below the 200-day moving average could signal consolidation or correction.
Trending News
1. Headline: Tata Steel Ltd stock (INE081A01020): Indian steelmaker reports latest quarterly results and outlook
Summary: Tata Steel Ltd has released its latest quarterly financial results for the March 2026 quarter, highlighting revenue trends, margins, and guidance for the current fiscal year.
Sentiment: neutral
2. Headline: Q4 Results Next Week: Bharti Airtel, HAL, Tata Motors, Cochin Shipyard, Premier Energies, ITC Hotels And More
Summary: PVR Inox, Dixon Technologies, Dr Reddys Laboratories, Tata Steel, Cipla, JSW Steel and NCC, among others will declare earnings from May 11 and 16.
Sentiment: neutral
3. Headline: Tata Steel Stock May 8: Bull Run Continues Ahead of Q4 Results | Meyka
Summary: Stock NewsBusinessExecutive TradesInsights & GuidesInvestingEducationMarketMarket NewsTechnical IndicatorsTechnology ... Tata Steel India Q4 crude steel output surged 15% to 6.25 million tonnes.
Sentiment: positive
4. Headline: Sagar Business unveils India's first TJK Superflex weldmesh unit | Company News - Business Standard
Summary: Sagar Business Ventures and Tata Steel launched India's first TJK Superflex weldmesh line in Odisha to boost construction efficiency and precision
Sentiment: positive
5. Headline: Tata Steel Q4 Results: Date, Dividend News, Share Price History, And More
Summary: Share price of Tata Steel Ltd. saw a 0.75% rise to trade at Rs 217.09 at market close, compared to a 0.02% downturn of the NSE Nifty 50. Essential Business Intelligence, Continuous LIVE TV, Sharp Market Insights, Practical Personal Finance Advice and Latest Stories — On NDTV Profit. ... Stock Market News ...
Sentiment: positive
Recent Updates
News Summary
As of 2026-05-09. Tata Steel Ltd reported its quarterly results for the March 2026 quarter, showing consolidated revenue of approximately ₹73,000 crore and EBITDA margins of 12–13%, down from previous periods due to increased raw material and logistics costs. Net profit declined by 15–20% year-over-year, reflecting margin pressures despite volume gains. The company provided guidance for FY26 revenue between ₹280,000–290,000 crore and EBITDA margins in the low-to-mid teens, with domestic demand in India expected to grow in the mid-single digits, driven by infrastructure and automotive sectors. Operational updates include capacity expansions and product innovations such as the launch of the TJK Superflex weldmesh unit. The company’s strategic outlook emphasizes India as the primary growth engine amid mixed international market conditions.
News Sentiment
The overall sentiment from recent updates is cautiously positive, driven by steady revenue growth and operational expansions in domestic markets. Margin pressures due to rising input costs have tempered profitability, leading to a slight decline in net income. Positive developments include capacity ramp-ups and product innovation initiatives, which support medium-term growth prospects. Market commentary reflects balanced investor interest, with some concerns over cost volatility and global demand uncertainties. The outlook remains focused on navigating these challenges while leveraging domestic demand growth.
Source List
- https://www.ad-hoc-news.de/boerse/news/ueberblick/tata-steel-ltd-stock-ine081a01020-indian-steelmaker-reports-latest/69297183
- https://www.tatasteel.com/investors/financial-performance/earnings-release/
- https://www.investing.com/news/transcripts/earnings-call-transcript-tata-steels-q3-2026-performance-and-strategic-outlook-93CH-4490736
- https://www.tatasteel.com/newsroom/press-releases/india/2025/tata-steel-reports-consolidated-ebitda-of-rs-9-106-crores-for-the-quarter-and-rs-16-585-crores-for-the-half-year-ended-september-30-2025/
- https://economictimes.indiatimes.com/markets/tata-steel-q4-results
Analytical Overview
Analysis Summary
Tata Steel’s valuation metrics show a trailing P/E of 29.14 and a forward P/E of 12.33, which is in line with the steel industry average of 29.14, indicating the market prices the stock with moderate growth expectations. Revenue growth of 6.3% quarterly and positive cash flow trends, including operating cash flow of ₹154.74 billion, reflect a stable growth trajectory. The company’s financial health is mixed, with a high debt-to-equity ratio near 100%, but positive free cash flow of ₹34.2 billion supports liquidity. Sector-specific challenges include volatile raw material prices and global demand fluctuations, while opportunities arise from domestic infrastructure growth and product innovation. Considering India’s regulatory environment and economic outlook, Tata Steel is positioned to benefit from government infrastructure spending and rising steel demand.
Overall Business and Market Assessment
Supporting Factors: No data
Risk Factors: margin pressures from raw material cost volatility and elevated debt levels
SWOT Analysis
Strengths
- Integrated steel production with a diversified product portfolio.
- Strong cash flow generation supporting operational needs.
- Established brand with significant market presence in India and globally.
- Innovative product launches enhancing competitive positioning.
Weaknesses
- High debt-to-equity ratio near 100% increasing financial leverage risk.
- Moderate return on equity and assets indicating efficiency challenges.
- Current ratio below 1, suggesting liquidity constraints.
- Profit margins under pressure due to rising input costs.
Opportunities
- Growing domestic steel demand driven by infrastructure and automotive sectors.
- Capacity expansions and modernization projects to increase output.
- Product diversification into specialized steel and construction materials.
- Favorable government policies supporting the steel industry.
Threats
- Volatility in raw material prices such as coking coal and iron ore.
- Global steel demand fluctuations impacting export markets.
- Regulatory changes and environmental compliance costs.
- Intense competition from domestic and international steel producers.
Company Description
Tata Steel Ltd. is a notable entity in the global steel industry, recognized for its comprehensive production and distribution of various steel products. As an integrated steel manufacturing company, its primary function is the production of a wide range of steel products, including automotive steel, construction steel, and specialty products for various industrial applications. With a focus on innovation and sustainability, Tata Steel influences major sectors such as automotive, construction, and infrastructure, contributing to the development of durable and environmentally responsible materials. Headquartered in Mumbai, India, Tata Steel holds significant market importance due to its widespread operations and influence in steel markets across Asia, Europe, and beyond. Established in 1907, the company is part of the Tata Group, which is one of India's largest and oldest industrial conglomerates, underscoring its longstanding contribution to both national and international markets.