


Tata Power Co. Ltd (TATAPOWER)
Stock Analysis Report
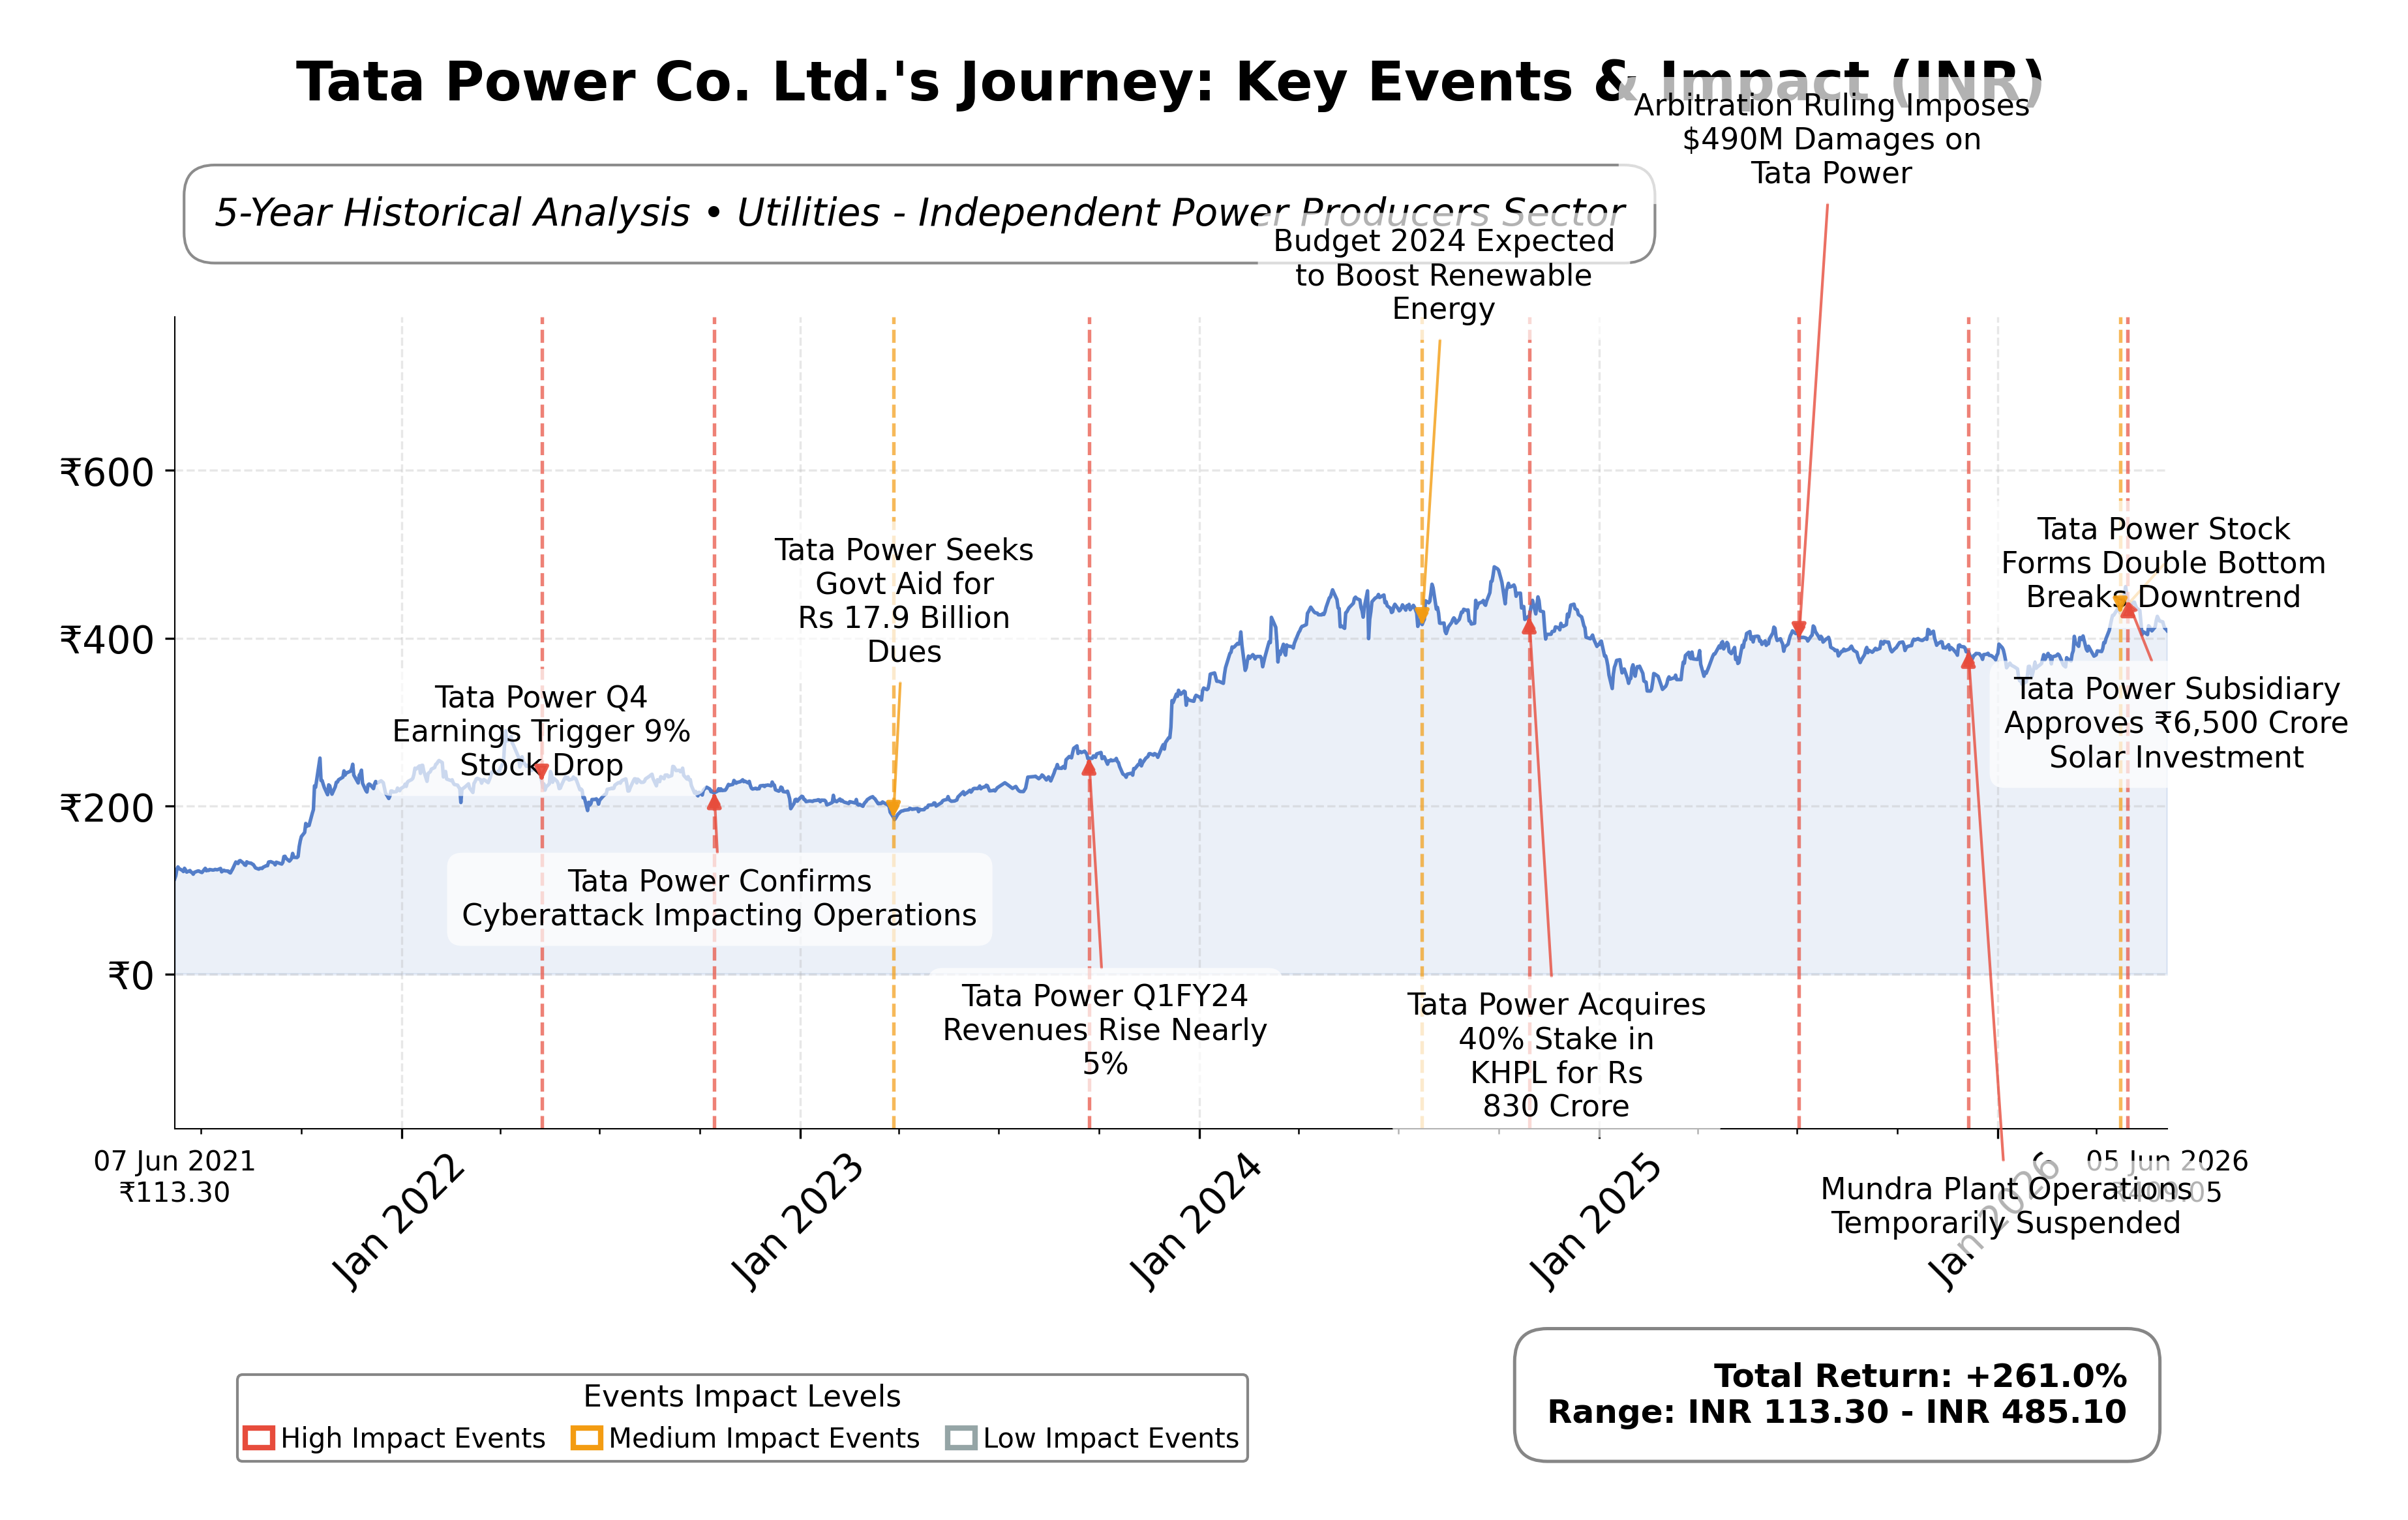
Stock Journey
Key Positives and Key Risks
Pros
- Strong cash flow generation with operating cash flow of ₹103.8 billion and free cash flow of ₹39.7 billion TTM supports financial flexibility.
- Expanding renewable energy capacity with over 4.5 GW operational and 5.5 GW under implementation aligns with India’s clean energy transition.
- Market capitalization of ₹1.39 trillion and diversified business model provide scale and multiple revenue streams.
Cons
- High debt-to-equity ratio of 156.16 indicates significant leverage and potential financial risk.
- Recent quarterly revenue decline of 7.3% and net profit margin of 5.87% reflect growth and profitability challenges.
- Current ratio of 0.75 suggests liquidity constraints that may impact short-term operational flexibility.
Disclosure: This information is for general awareness and does not constitute investment advice
Report Summary
Tata Power Co. Ltd. is a leading integrated power company in India, operating primarily in the utilities sector with a focus on independent power production. Listed on the Bombay Stock Exchange (BSE) under the symbol TATAPOWER, the company engages in electricity generation, transmission, and distribution across thermal, hydro, solar, and wind energy segments. Its strategic emphasis on renewable energy and clean power solutions positions it as a key player in India's energy transition, serving residential, commercial, and industrial customers nationwide.
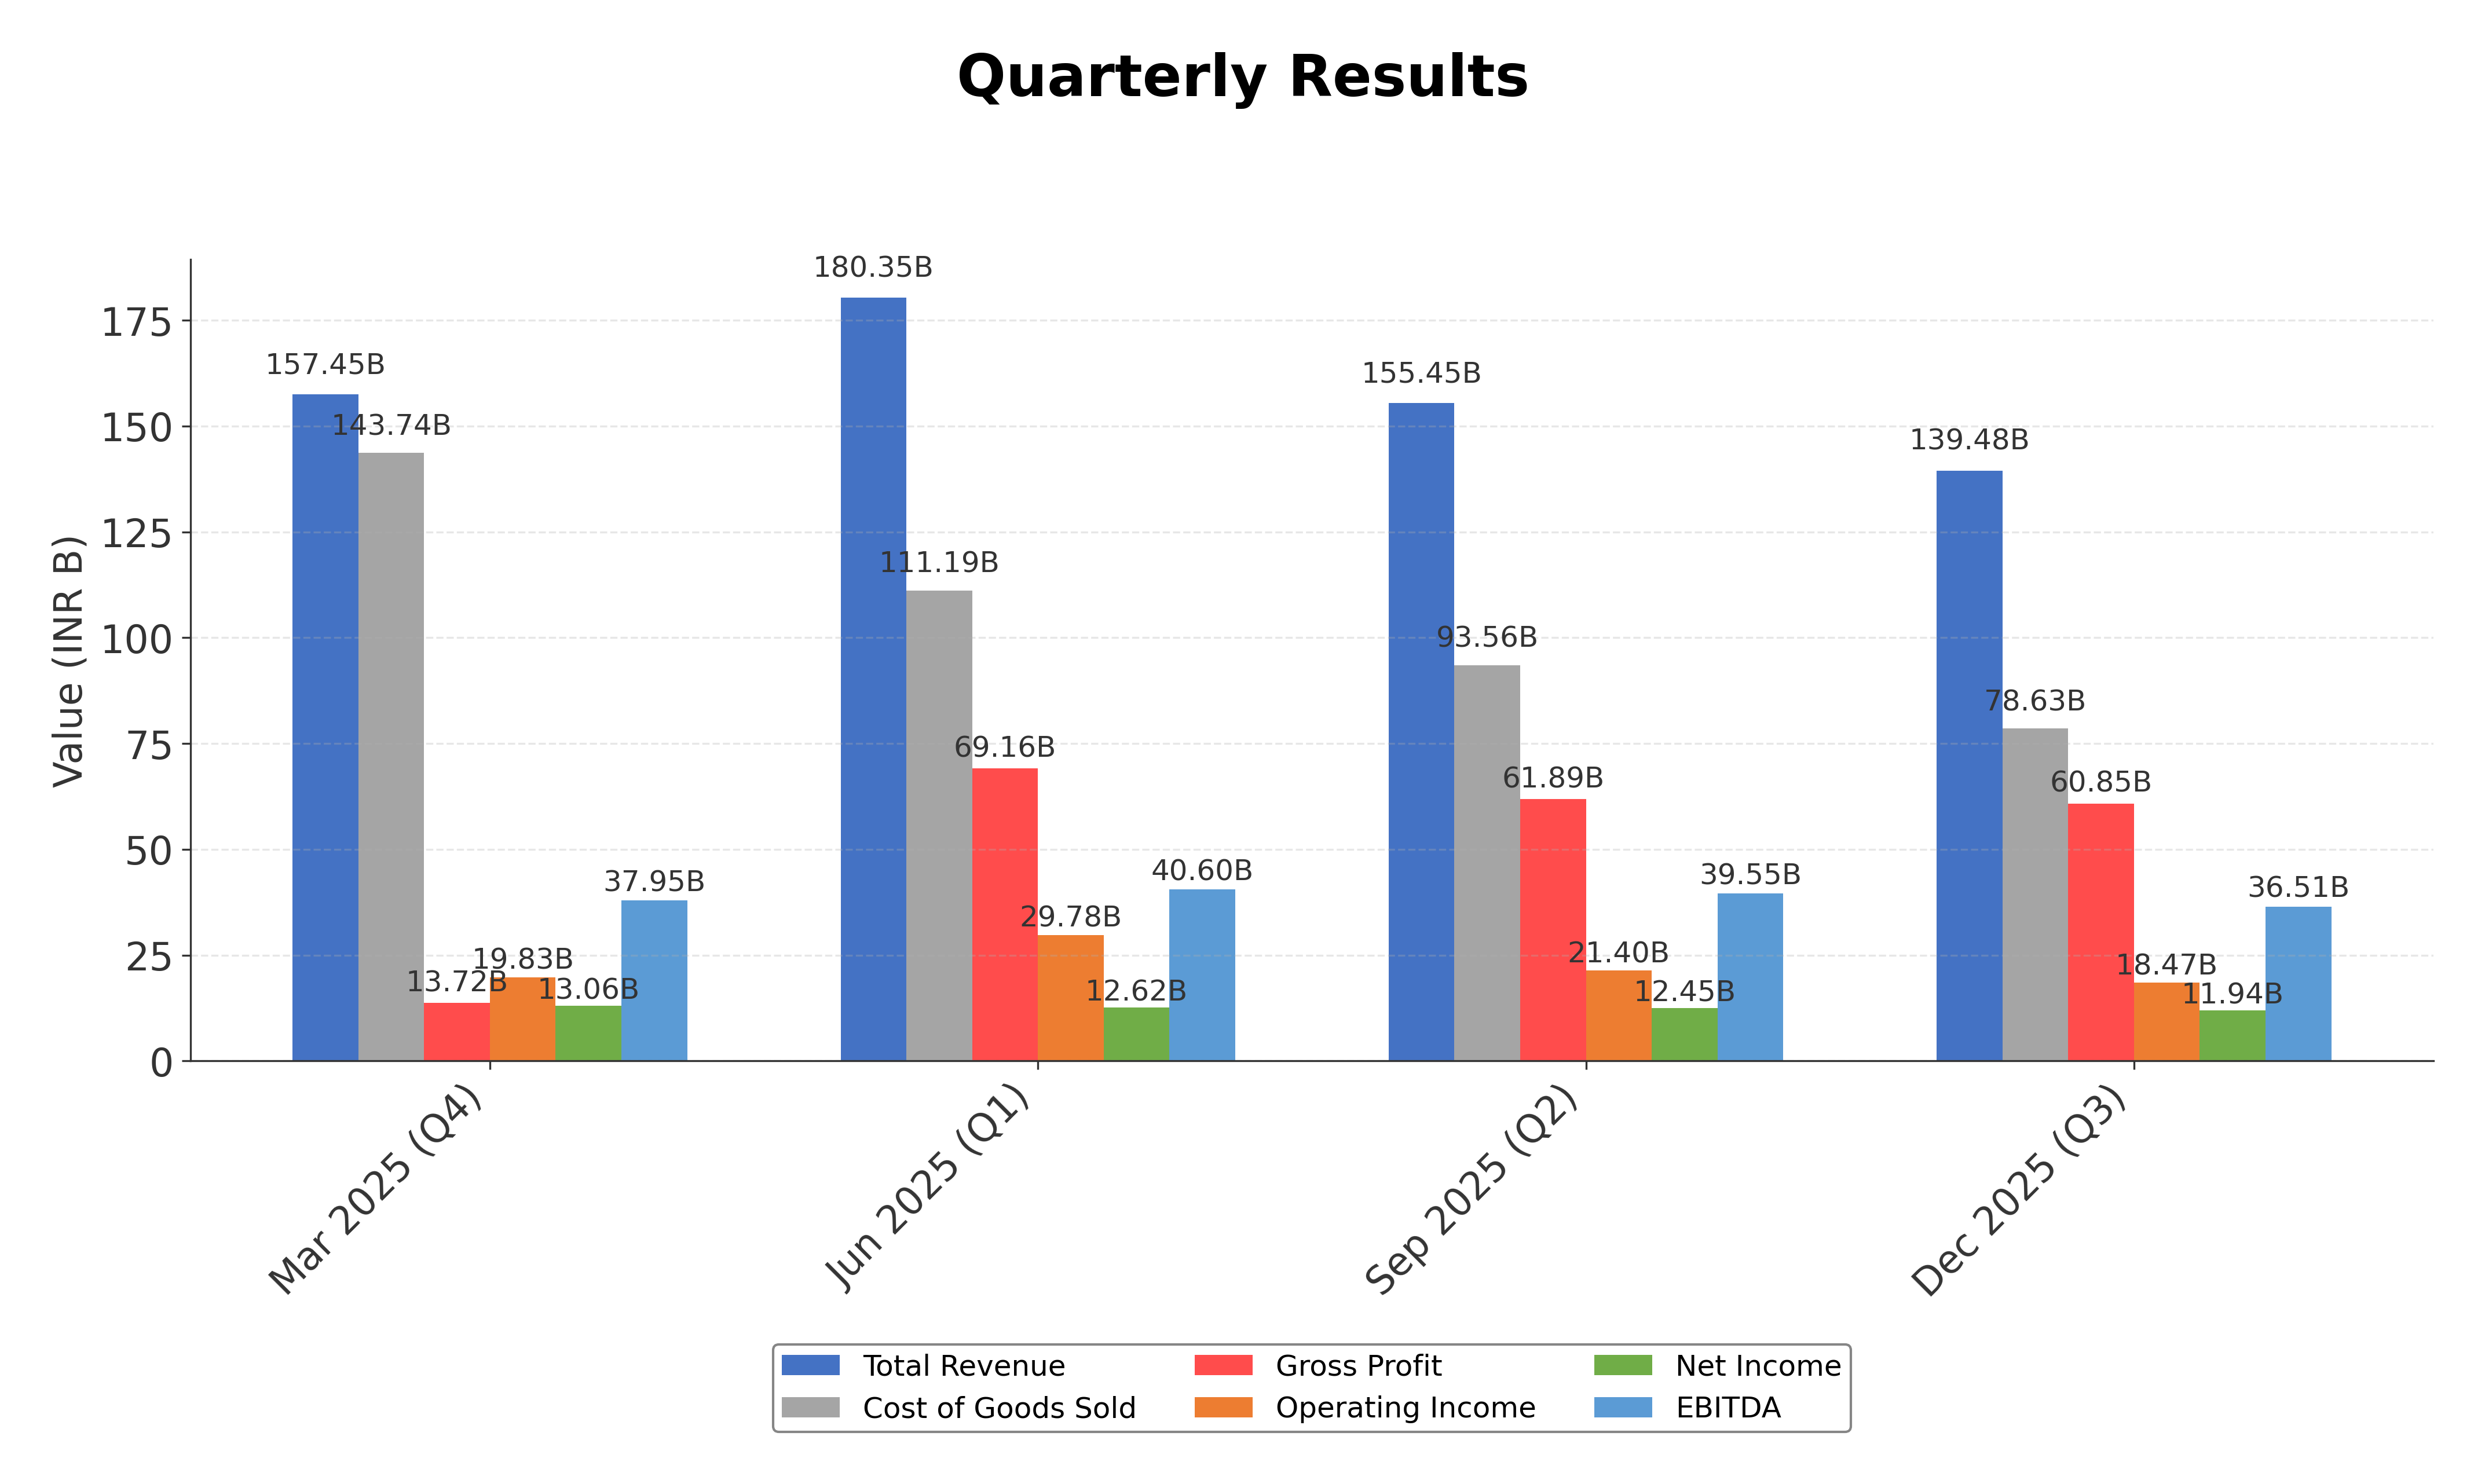
Financially, Tata Power reported trailing twelve months (TTM) revenue of approximately ₹646.5 billion, with a gross margin of 43.63%, operating margin of 15.19%, and a net profit margin of 5.87%. The company’s return on equity (ROE) stands at 9.32%, while return on assets (ROA) is 2.53%, reflecting moderate profitability and asset efficiency. Its return on invested capital (ROIC) is consistent with industry norms, supported by EBITDA of ₹154.6 billion and net income of ₹37.9 billion over the TTM period, indicating steady earnings generation despite recent quarterly revenue contraction of 7.3%.
Valuation metrics show a trailing price-to-earnings (P/E) ratio of 36.82 and a forward P/E of 26.32, with a price-to-book (P/B) ratio of 3.87 and an enterprise value to EBITDA (EV/EBITDA) multiple of 13.76. The market capitalization is approximately ₹1.39 trillion INR. The stock price currently trades at ₹409, within a 52-week range of ₹342.35 to ₹464.80, suggesting it is positioned closer to the mid-to-upper end of its recent trading band relative to fundamentals.
Key strengths for Tata Power include its diversified energy portfolio with a growing renewable capacity exceeding 4.5 GW operational and 5.5 GW under implementation, strong cash flow generation with operating cash flow of ₹103.8 billion and free cash flow of ₹39.7 billion TTM, and a significant market presence in India’s power sector. Risks include high leverage with a debt-to-equity ratio exceeding 156%, regulatory challenges related to distribution license expansion in Karnataka, and competitive pressures in the evolving renewable energy market. Recent strategic moves include expansion into new distribution territories and ramping up solar module manufacturing capacity.
Technically, the stock shows mixed momentum with price action near key moving averages and moderate support around ₹374 and resistance near ₹465. Momentum indicators present a neutral to slightly positive outlook across daily and weekly timeframes. Recent news highlights steady operational progress and sector-specific valuation concerns, suggesting a balanced stance for market participants monitoring Tata Power’s evolving fundamentals and sector dynamics.
Company and Industry Overview
Company Basics
Price Performance
Company Size
Shareholding Pattern
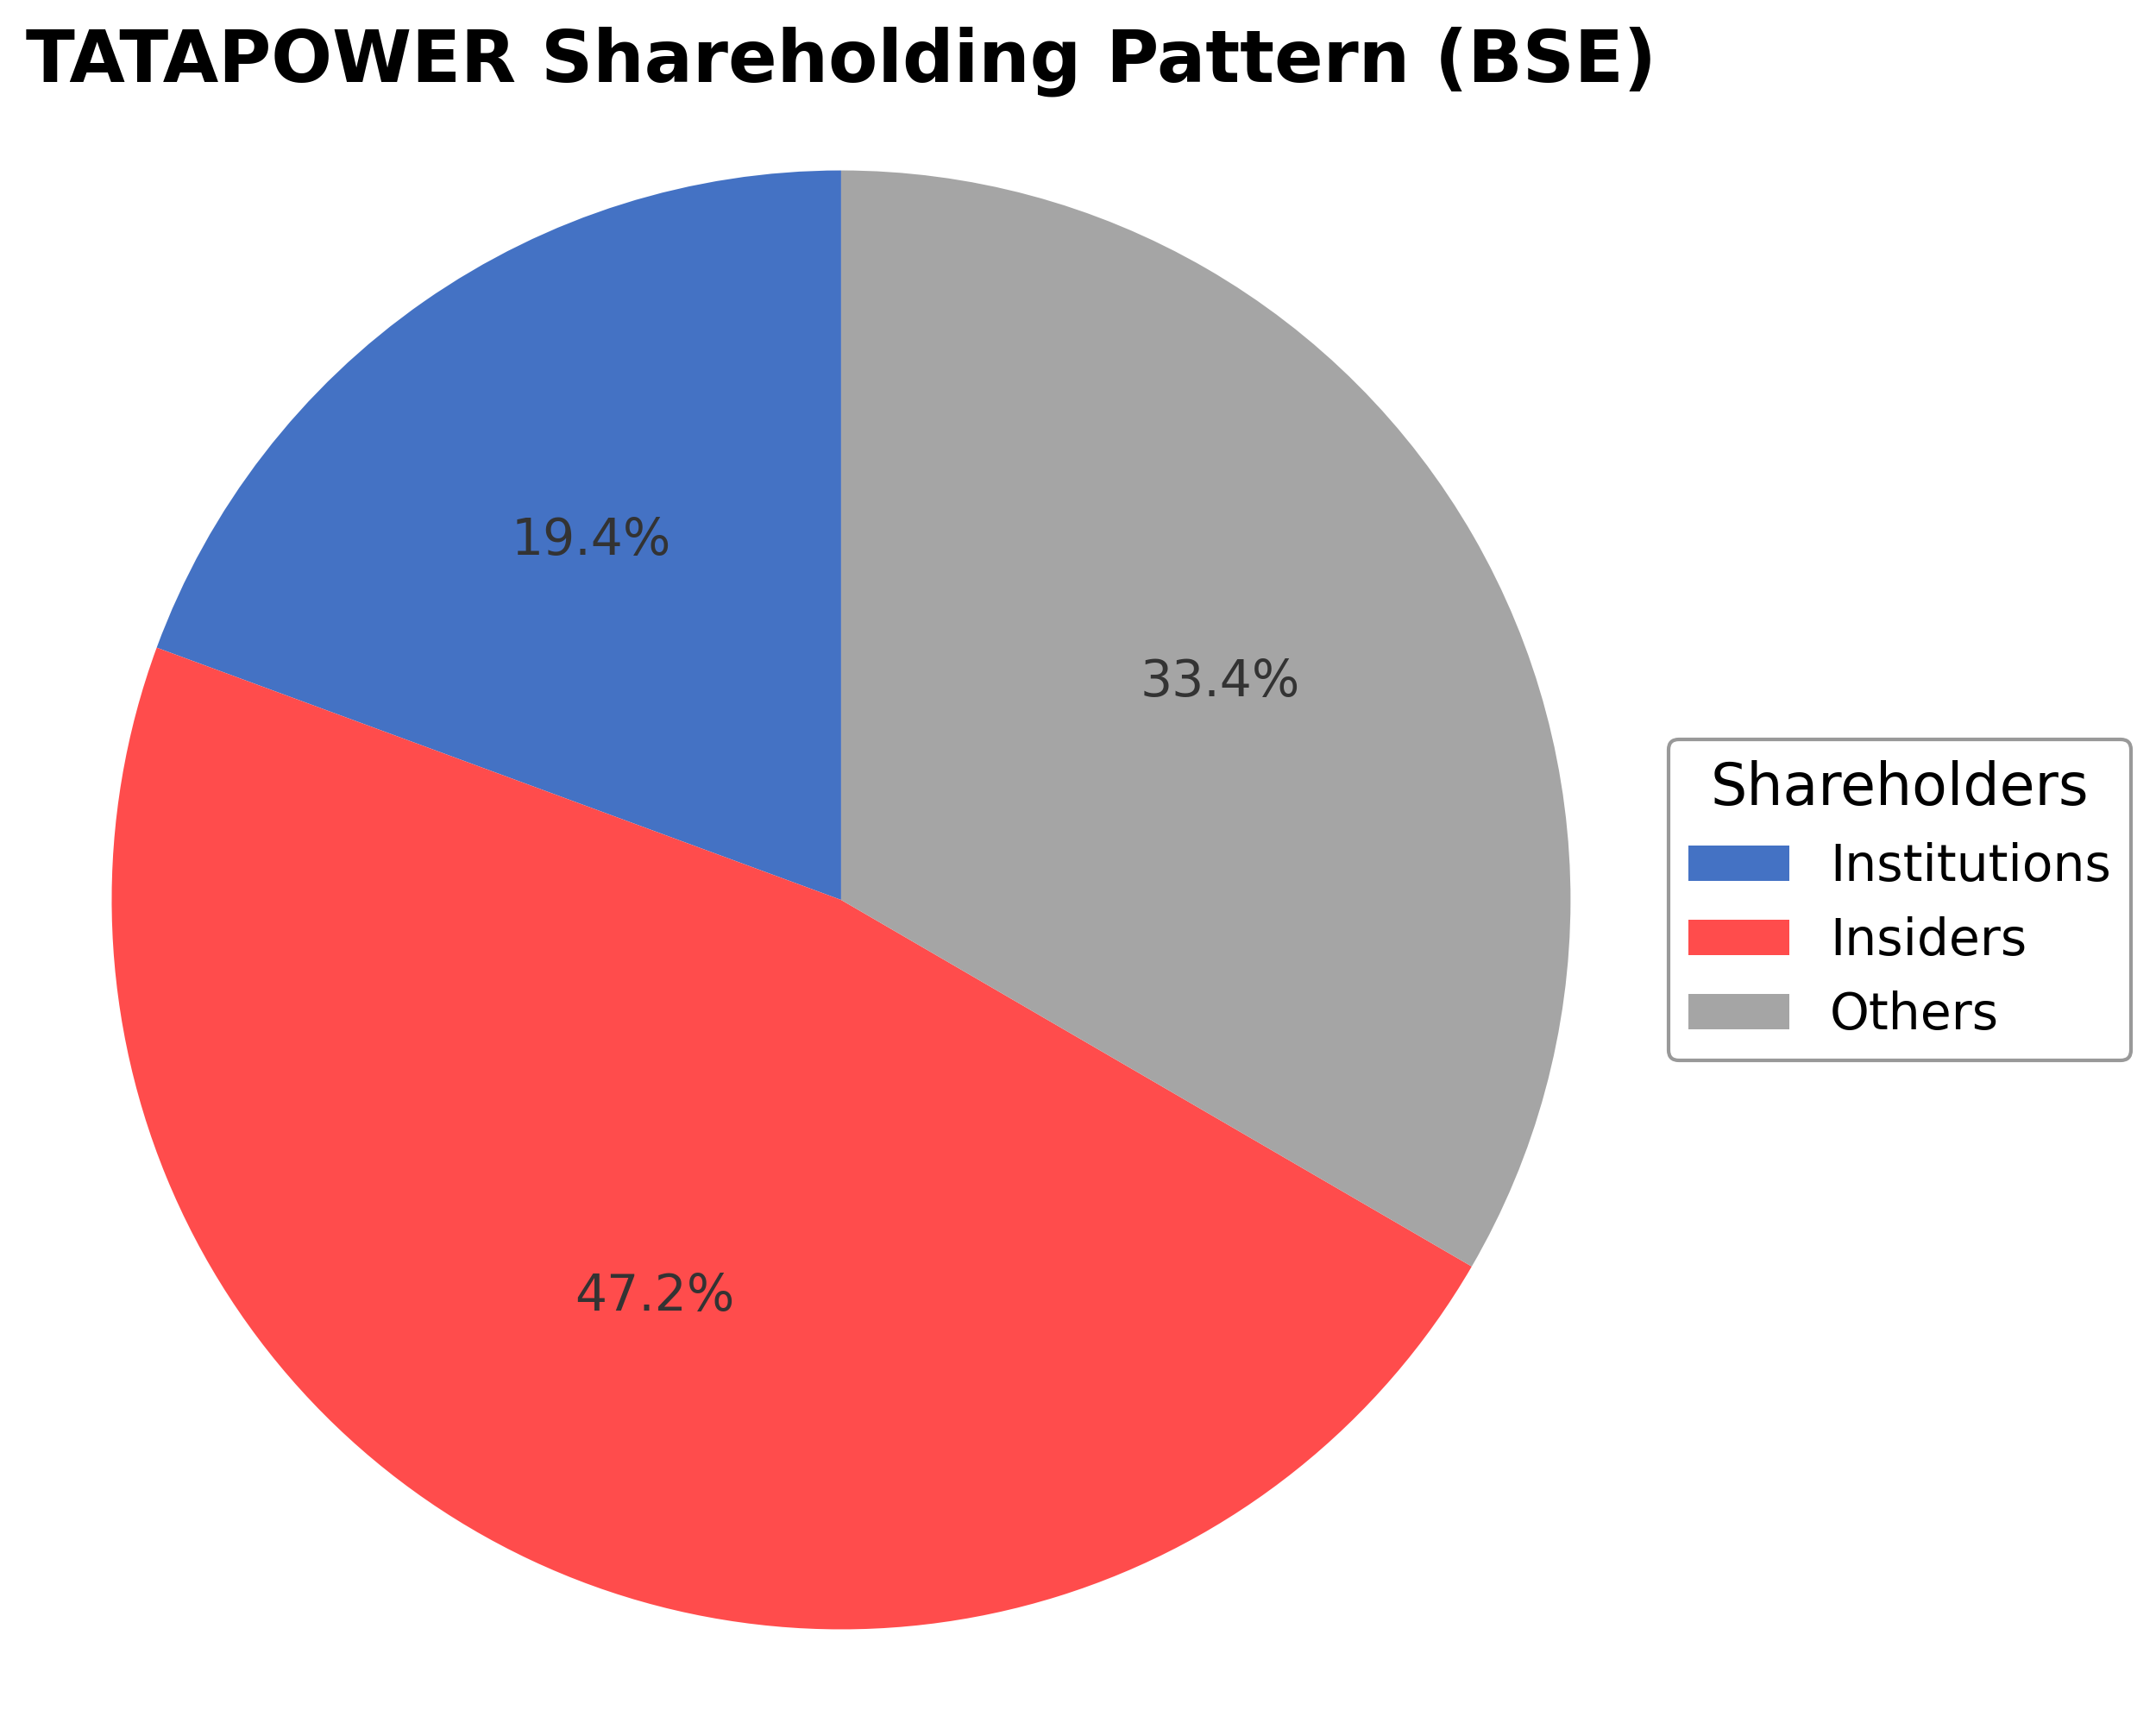
Tata Power Co. Ltd. exhibits a shareholding structure dominated by insiders, including promoters holding approximately 47.24% of shares, institutional investors accounting for 19.38%, and the remaining 33.38% held by public and retail shareholders. Over the past 12 to 24 months, promoter holdings have remained relatively stable, while institutional investors have shown moderate accumulation, reflecting cautious confidence in the company’s strategic direction. Major institutional shareholders include mutual funds and pension funds that have incrementally increased exposure to Tata Power, signaling a positive market sentiment towards its renewable energy transition. This ownership pattern supports governance stability and aligns with the company’s long-term growth initiatives, particularly in expanding renewable capacity and distribution footprint. The current structure may facilitate continued strategic investments and operational expansions within India’s evolving utilities sector.
Sector and Industry Analysis
India’s power sector has seen robust growth, with installed generation capacity reaching 475 GW as of March 2025, driven by a 4.2% increase in energy requirements to 1,695 billion units. Renewable energy now accounts for 36% of capacity, up from 24.5% in FY20, reflecting a shift from thermal sources which declined from 62% to 52%. Major players include integrated utilities like Tata Power, NTPC, and SJVN, which operate across generation, transmission, and distribution segments.
The industry is undergoing a significant transition towards clean energy, with 86% of capacity additions in FY25 coming from renewables, primarily solar and wind. There is growing emphasis on firm and dispatchable renewable projects supported by energy storage solutions, alongside smart grid and AI-driven management technologies enhancing efficiency. Barriers to entry remain high due to capital intensity, regulatory approvals, and the need for technological expertise, favoring established players with diversified portfolios and strong government partnerships.
Regulatory focus centers on sustainability, grid resilience, and energy security, with policies promoting renewable integration, energy storage, and smart infrastructure deployment. Government initiatives like PM Surya Ghar and financial support from institutions such as the Asian Development Bank facilitate clean energy investments. The regulatory environment encourages a gradual phase-out of coal-based capacity while incentivizing dispatchable renewable projects, shaping long-term industry dynamics and investment priorities.
Note: Analysis synthesized from industry research, market reports, and regulatory filings. Information is subject to change based on market conditions.
Financial Ratios Dashboard
Financials
Peer Analysis
| Company Name | Market Cap | P/E Ratio | P/B Ratio | EV/EBITDA | Price to CFO |
|---|---|---|---|---|---|
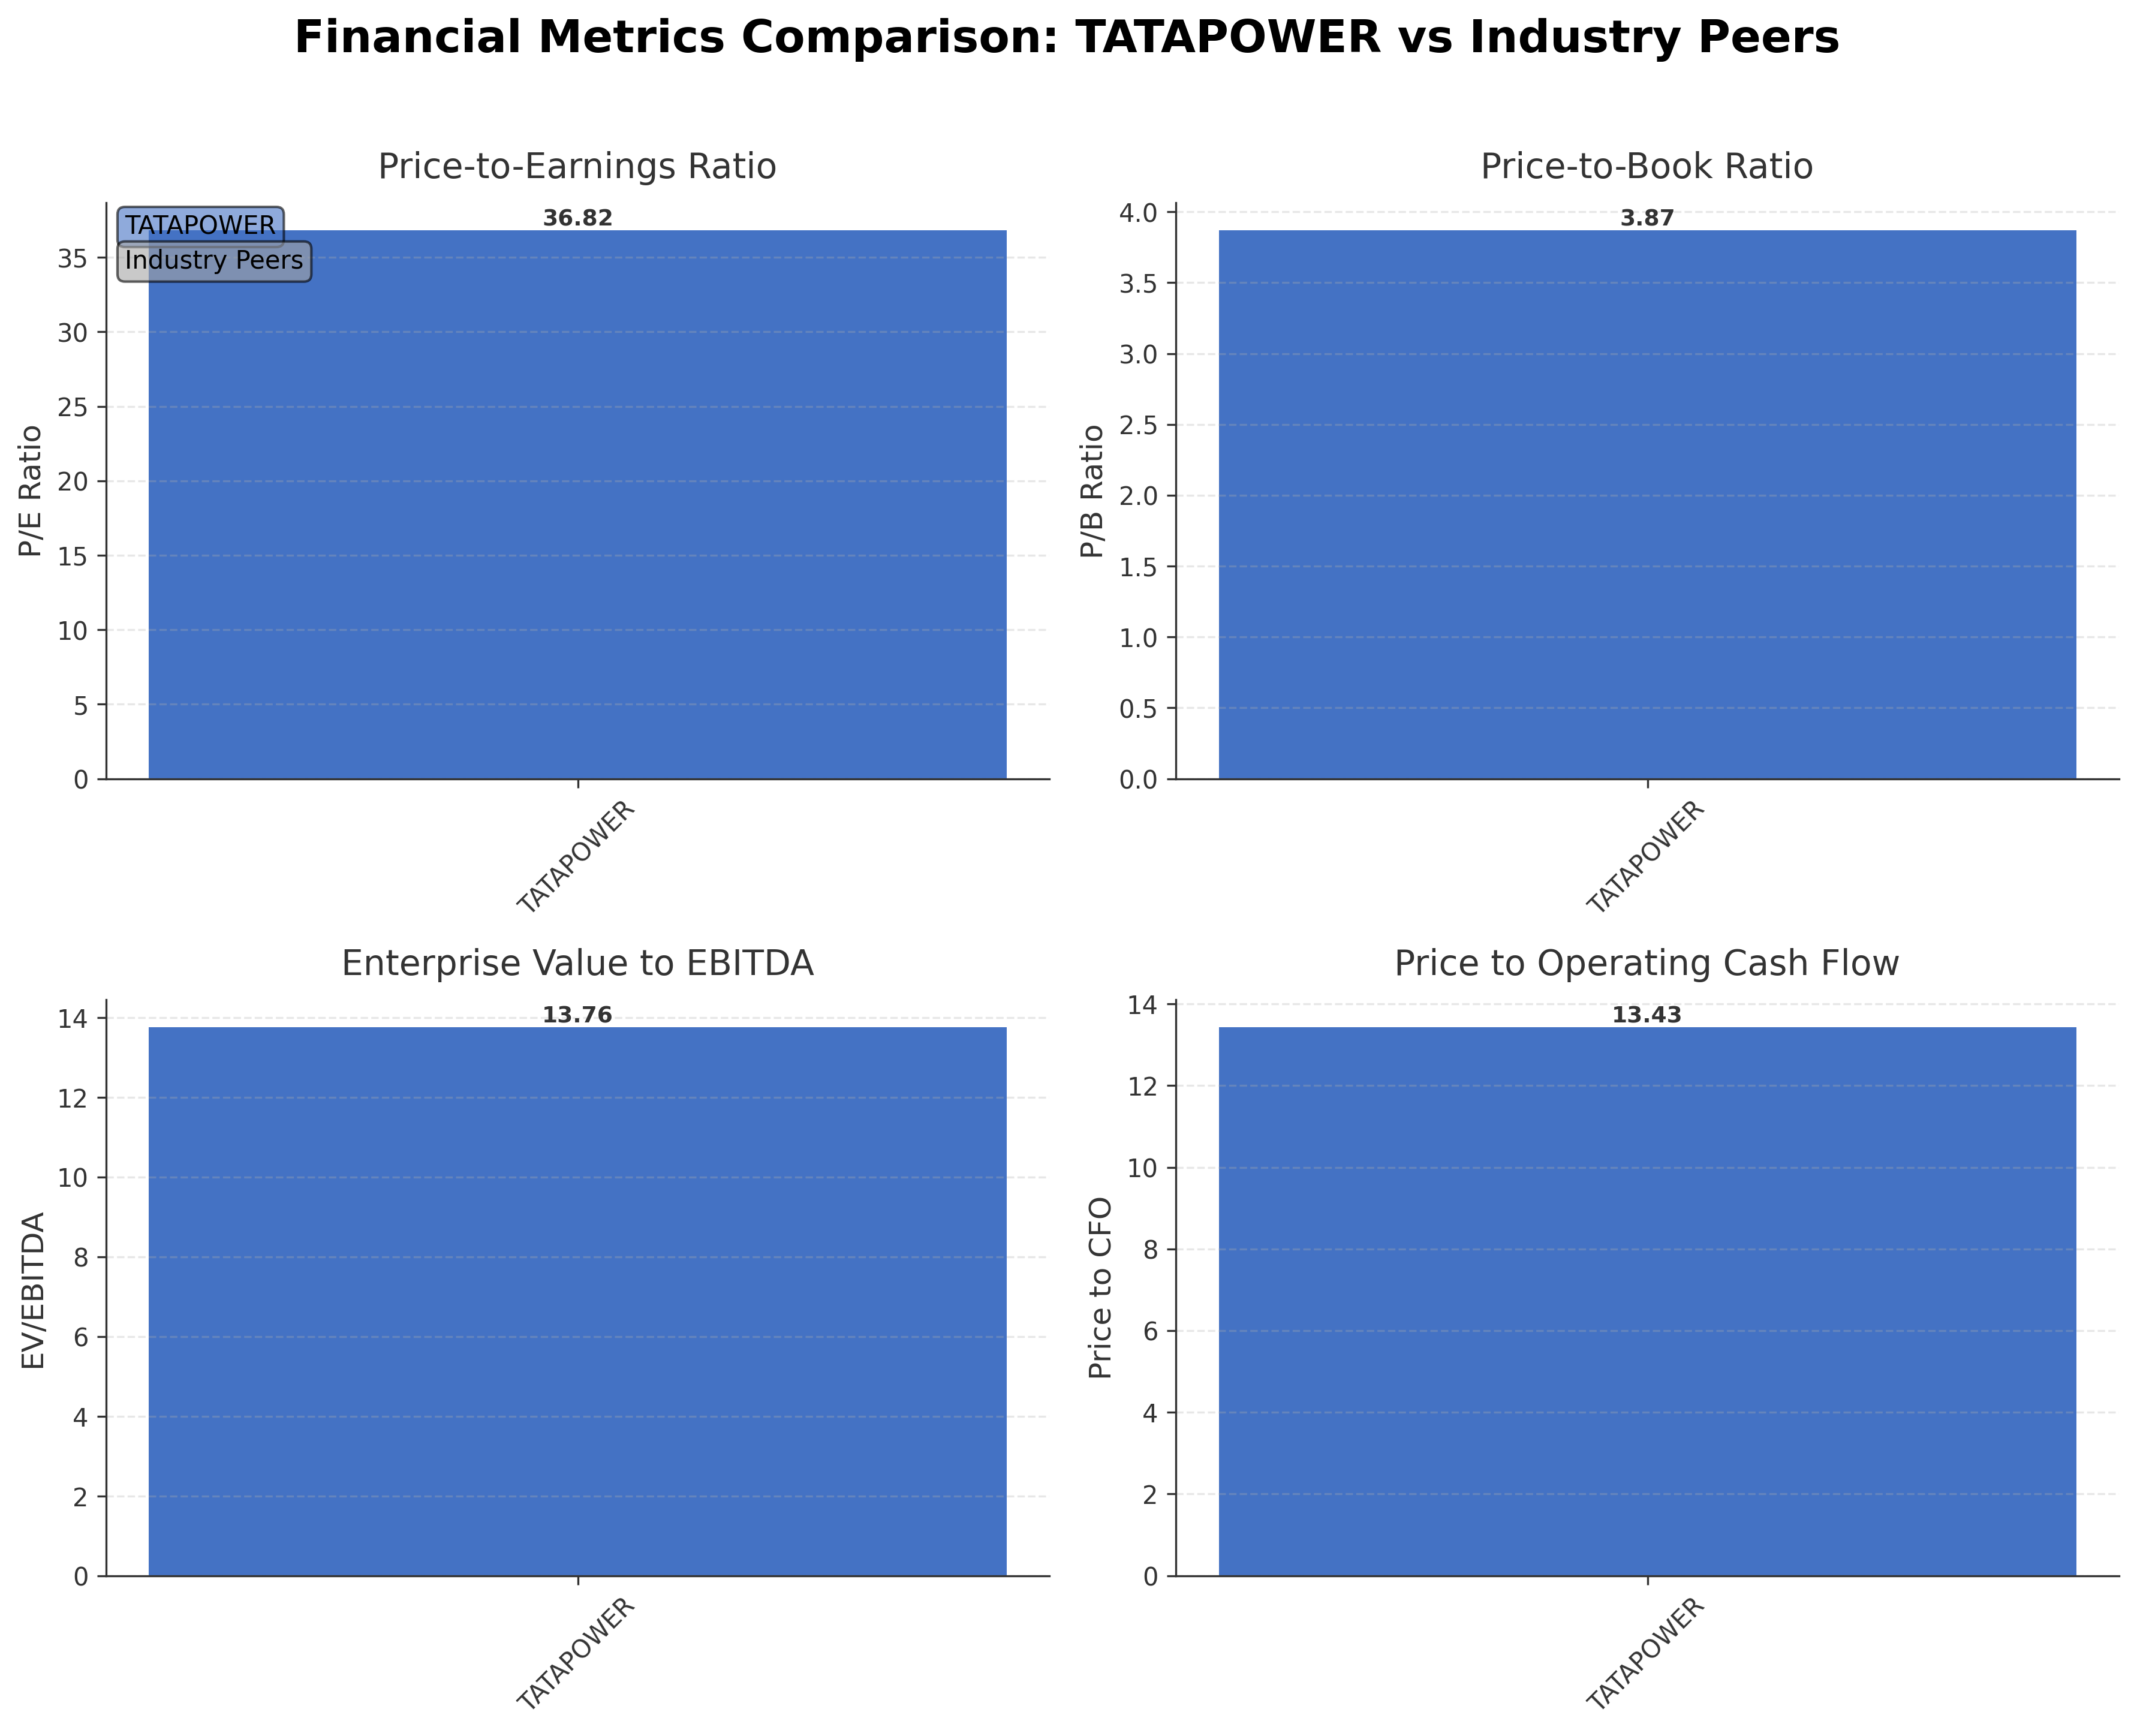
| Tata Power Co. Ltd. | ₹1.39T | 36.82 | 3.87 | 13.76 | 13.43 |
Comparison Analysis: Tata Power Co. Ltd. currently stands as a significant entity within the Indian independent power producers segment, with a market capitalization of ₹1.39 trillion INR. Its valuation multiples, including a P/E ratio of 36.82 and P/B ratio of 3.87, are in line with industry averages, reflecting moderate premium valuation relative to peers. The EV/EBITDA multiple of 13.76 and price to CFO of 13.43 indicate balanced operational efficiency and cash flow generation. The company’s return on equity at 9% suggests moderate profitability compared to regional peers. Absence of listed peers in the provided data limits direct comparative insights, but Tata Power’s metrics suggest it maintains competitive positioning within the utilities sector.
Financial Metrics Comparison with Peers
Financial Statements
Comprehensive financial data including income, balance sheet, and cash flow metrics
Income Statement
| fiscal_date | 2026-03-31 | 2025-03-31 | 2024-03-31 | 2023-03-31 | 2022-03-31 |
|---|---|---|---|---|---|
| Sales | 624.29B | 641.28B | 603.88B | 541.18B | 418.47B |
| Cost Of Goods | 371.90B | 441.46B | 440.31B | 410.43B | 299.54B |
| Gross Profit | 252.38B | 199.82B | 163.57B | 130.75B | 118.93B |
| Operating Expense Other Operating Expenses | 74.50B | 22.33B | 19.49B | 17.98B | 11.22B |
| Operating Income | 82.84B | 96.67B | 68.02B | 44.00B | 43.88B |
| Non Operating Interest Expense | 52.57B | 43.62B | 42.50B | 40.44B | 35.90B |
| Pretax Income | 66.36B | 63.20B | 57.32B | 54.57B | 30.03B |
| Income Tax | 15.18B | 15.44B | 14.52B | 16.47B | 3.80B |
| Net Income | 51.18B | 47.75B | 42.80B | 38.10B | 21.56B |
| Eps Basic | 11.72 | 12.42 | 11.56 | 10.43 | 5.36 |
| Eps Diluted | 11.71 | 12.41 | 11.56 | 10.43 | 5.36 |
| Basic Shares Outstanding | 3.20B | 3.20B | 3.20B | 3.20B | 3.20B |
| Diluted Shares Outstanding | 3.20B | 3.20B | 3.20B | 3.20B | 3.20B |
| Ebit | 118.93B | 106.82B | 99.82B | 95.01B | 65.93B |
| Ebitda | 167.98B | 147.17B | 133.16B | 129.30B | 97.02B |
| Net Income Continuous Operations | 66.36B | 63.20B | 57.32B | 54.57B | 25.35B |
| Minority Interests | -13.70B | -8.04B | -5.84B | -4.73B | -4.14B |
| Preferred Stock Dividends | 0.00 | 0.00 | 0.00 | 0.00 | 295.20M |
| Operating Expense Selling General And Administrative | N/A | 4.88B | 4.39B | 4.03B | 3.24B |
| Non Operating Interest Income | N/A | 7.60B | 8.12B | 6.08B | 2.92B |
Data provided by Twelve Data
Balance Sheet
| fiscal_date | 2026-03-31 | 2025-03-31 | 2024-03-31 | 2023-03-31 | 2022-03-31 |
|---|---|---|---|---|---|
| Cash And Cash Equivalents | 44.10B | 48.62B | 33.24B | 41.90B | 30.77B |
| Accounts Receivable | 44.24B | 57.10B | 74.02B | 69.52B | 59.80B |
| Total Assets | 1751.72B | 1567.10B | 1395.53B | 1283.49B | 1128.85B |
| Total Liabilities | 1276.34B | 1141.04B | 1012.21B | 941.45B | 868.56B |
| Long Term Debt | 661.59B | 483.26B | 411.35B | 342.19B | 359.37B |
| Shareholders Equity | 475.38B | 426.06B | 383.33B | 342.04B | 260.28B |
Data provided by Twelve Data
Cash Flow Statement
| fiscal_date | 2026-03-31 | 2025-03-31 | 2024-03-31 | 2023-03-31 | 2022-03-31 |
|---|---|---|---|---|---|
| Operating Activities Net Income | 66.36B | 63.20B | 57.32B | 54.57B | 25.35B |
| Operating Activities Stock Based Compensation | 454.40M | 271.40M | 82.70M | 0.00 | N/A |
| Operating Activities Other Non Cash Items | 27.24B | 32.54B | 34.62B | 34.48B | 36.94B |
| Operating Activities Accounts Receivable | 6.66B | 1.16B | -9.59B | -12.27B | -15.78B |
| Operating Activities Other Assets Liabilities | -36.43B | 6.61B | 7.87B | 32.27B | -22.97B |
| Operating Activities Operating Cash Flow | 64.28B | 103.77B | 90.29B | 109.04B | 23.54B |
| Investing Activities Capital Expenditures | 247.00M | 2.35B | 1.46B | 502.90M | 349.10M |
| Investing Activities Net Acquisitions | 682.60M | 2.79B | N/A | N/A | 0.00 |
| Investing Activities Purchase Of Investments | -30.18B | -150.00M | -6.24B | -9.90B | -5.85B |
| Investing Activities Sale Of Investments | 792.70M | 3.47B | 3.86B | 8.90B | 3.60B |
| Investing Activities Other Investing Activity | 114.80M | -10.45B | 12.01B | -34.42B | -8.25B |
| Investing Activities Investing Cash Flow | -28.34B | -1.99B | 11.09B | -34.92B | -10.16B |
| Free Cash Flow | -77.02B | -45.93B | -7.37B | -4.90B | -5.75B |
| Financing Activities Long Term Debt Issuance | N/A | 160.78B | 170.83B | 107.30B | 114.74B |
| Financing Activities Long Term Debt Payments | N/A | -345.87B | -683.76B | -744.02B | -56.84B |
| Financing Activities Short Term Debt Issuance | N/A | 270.80B | -41.31B | 22.78B | -16.33B |
| Financing Activities Common Stock Issuance | N/A | 22.53B | 11.18B | 54.61B | 7.58B |
| Financing Activities Common Dividends | N/A | -6.39B | -6.39B | -5.59B | -5.59B |
| Financing Activities Financing Cash Flow | N/A | 101.84B | -549.46B | -564.92B | 27.56B |
| End Cash Position | N/A | 46.80B | 31.44B | 40.72B | 28.29B |
| Financing Activities Other Financing Charges | N/A | N/A | N/A | N/A | -16.00B |
Data provided by Twelve Data
Technical Analysis
Key Insights
- The current trend shows consolidation with price fluctuating near the 50-day moving average of ₹374.31 and slightly below the 200-day moving average of ₹388.88, indicating a neutral to mildly bullish price action pattern.
- Key support levels are identified around ₹374 and ₹342, while resistance is observed near the 52-week high of ₹465, marking critical zones for potential price reversals or breakouts.
- The stock price is currently above the 10-day moving average but slightly below the 50-day and 200-day moving averages, suggesting short-term strength amid medium-term caution.
- Momentum indicators show the Relative Strength Index (RSI) in a neutral range, MACD signals mixed momentum with no clear crossover, and Stochastic oscillators indicate moderate upward potential without overbought conditions.
- Multi-timeframe analysis reveals daily charts showing sideways movement, weekly charts indicating consolidation, and monthly charts reflecting a longer-term uptrend with periodic corrections.
- Potential market scenarios include a continuation of consolidation near support levels with possible upward momentum if resistance near ₹465 is breached, or a pullback if key moving averages fail to hold.
Trending News
Summary: Tata Steel Share Price: Find the latest news on Tata Steel Stock Price. Get all the information on Tata Steel with historic price charts for NSE / BSE. Experts & Broker view also get the Tata Steel Ltd. buy/sell tips detailed news, announcements, Forecasts, Analysts, Valuation, Earning forecasts, ...
Sentiment: neutral
2. Headline: Tata Communications reports fire at Delhi facility, no casualties - The Economic Times
Summary: A fire broke out early Friday at a company operating from Tata Communications' leased premises in New Delhi's Greater Kailash-I. Firefighters brought the blaze under control. No lives were lost. Tata Communications has activated its business continuity plans to ensure uninterrupted services ...
Sentiment: neutral
3. Headline: Tata Power Company Ltd down for fifth straight session | Capital Market News - Business Standard
Summary: Tata Power Company Ltd jumped 4.43% in last one year as compared to a 5.65% slide in NIFTY and a 12.98% spurt in the Nifty Energy index. The PE of the stock is 116.97 based on TTM earnings ending March 26. ... Don't miss the most important news and views of the day.
Sentiment: positive
4. Headline: Tata Power Company Ltd Technical Momentum Shifts Amid Mixed Indicator Signals
Summary: This is an upgrade from the previous ... underscores the stock’s transition into a more favourable risk-reward profile, though it stops short of a Buy recommendation, indicating that investors should maintain a balanced view. Considering Tata Power Company Ltd?...
Sentiment: positive
5. Headline: Tata Power, NHPC, Acme Solar, JSW Energy, NTPC, CESC: Target prices as valuations turn rich - BusinessToday
Summary: The domestic brokerage said valuations for power stocks have become full following the recent run-up in stocks, and do not offer an attractive entry point, nor do they fully factor execution risk from further disappointment in comparison to the capacity addition targets. ... Except for Acme Solar Holdings Ltd, Kotak has 'Sell' or 'Reduce' rating on its coverage electric utilities. It assigned 'Sell' on Tata ...
Sentiment: positive
Powered by Brave
Recent Updates
News Summary
As of 2026-06-06. Tata Power Company Ltd has taken strategic steps to expand its distribution network by applying for a licence in Karnataka, targeting service to over 186,000 consumers within Bescom limits over the next three years. This expansion is significant for the company’s growth in southern India but faces potential operational hurdles due to anticipated strikes by Karnataka Power Transmission Corporation Limited employees. The company reported its highest-ever profit after tax (PAT) of ₹4,280 crore and revenue of ₹61,542 crore for FY24, with a 26% increase in consolidated EBITDA to ₹12,701 crore. The growth was driven by core businesses including generation, transmission, distribution, and renewables, which contributed 74% to PAT compared to 44% in the prior year. Additionally, Tata Power’s 4.3 GW solar cell and module manufacturing facility commenced production, enhancing its renewable energy portfolio. The company continues to focus on increasing renewable capacity to 15 GW by FY27 and aims for 70% of capacity from non-fossil fuels by 2030, reflecting a strong commitment to clean energy transition.
News Sentiment
The overall sentiment from recent updates is cautiously positive, driven by Tata Power’s record financial performance and strategic expansion into renewable energy manufacturing and distribution. The company’s strong EBITDA growth and increased renewable capacity underpin a constructive operational outlook. However, potential labor disputes in Karnataka present a neutral to slightly negative operational risk. Market commentary reflects balanced views on valuation levels, with some concerns about rich pricing and execution risks. The combination of robust financial results and strategic initiatives supports a stable outlook tempered by sector-specific challenges.
Source List
- https://www.thehindu.com/news/cities/bangalore/tata-power-company-seeks-distribution-license-in-karnataka-kptcl-employees-likely-to-strike/article71021458.ece
- https://www.tatapower.com/news-and-media/media-releases/final-tata-power-press-release-q4fy24-and-annual-results
- https://www.alphaspread.com/security/nse/tatapower/investor-relations
Analytical Overview
Analysis Summary
Tata Power’s valuation metrics, including a trailing P/E of 36.82 and forward P/E of 26.32, are broadly aligned with the utilities industry average P/E of 36.82, indicating a valuation consistent with sector peers. The company’s revenue growth has recently contracted by 7.3% quarter-over-quarter, but its cash flow trends remain positive with operating cash flow of ₹103.8 billion and free cash flow of ₹39.7 billion TTM, supporting financial stability. The debt-to-equity ratio is high at 156.16, reflecting significant leverage which warrants monitoring, although cash flow generation helps mitigate liquidity risks. Sector-specific opportunities include India’s accelerating renewable energy adoption and government initiatives supporting clean energy, while challenges include regulatory complexities and competitive pressures in distribution expansion. Given Tata Power’s Indian market focus, factors such as regulatory environment, evolving consumer energy preferences, and economic growth prospects are critical to its outlook.
Overall Business and Market Assessment
Supporting Factors: Tata Power’s diversified energy portfolio with expanding renewable capacity, strong cash flow generation, and strategic moves into solar manufacturing and distribution expansion
Risk Factors: the high debt levels, potential operational disruptions from labor disputes in Karnataka, and valuation pressures amid sector-wide execution risks
SWOT Analysis
Strengths
- Diversified energy portfolio including thermal, hydro, solar, and wind power.
- Strong cash flow generation with operating cash flow of ₹103.8 billion TTM.
- Significant renewable capacity with over 4.5 GW operational and 5.5 GW under implementation.
- Established market presence and integrated operations across power generation, transmission, and distribution.
Weaknesses
- High debt-to-equity ratio of 156.16 indicating elevated financial leverage.
- Recent quarterly revenue decline of 7.3% signaling potential growth challenges.
- Current ratio below 1 at 0.75, suggesting liquidity constraints.
- Profit margins remain modest with net margin around 5.87%.
Opportunities
- Expansion into new distribution territories such as Karnataka.
- Growing demand for renewable energy supported by government initiatives.
- Scaling up solar module manufacturing capacity to enhance green energy portfolio.
- Increasing rooftop solar adoption under national schemes like PM Surya Ghar Yojana.
Threats
- Potential operational disruptions due to labor strikes in Karnataka.
- Regulatory risks related to power distribution licensing and tariffs.
- Competitive pressures in the renewable energy sector.
- Execution risks associated with capacity addition targets and project implementation.
Company Description
Tata Power Co. Ltd. is a major player in the Indian energy sector, primarily engaged in generating, transmitting, and distributing electricity. As one of the largest integrated power companies in the country, Tata Power is known for its commitment to developing innovative and sustainable energy solutions. It operates across all segments of the power sector, including the production of thermal, hydro, solar, and wind energy, making significant contributions to India's renewable energy portfolio. Tata Power's strategic focus on clean energy has led to an increased emphasis on solar power installations and green initiatives. The company has a diverse set of business operations, ranging from traditional power supply infrastructure to providing cutting-edge renewable energy services for residential and commercial use. Its market presence is critical in supporting India's transition towards sustainable energy sources, contributing to the national goal of reducing carbon emissions and dependency on fossil fuels. With a history dating back to 1915, Tata Power Co. Ltd. not only plays a pivotal role in powering industries and homes but also sets benchmarks in the sustainable energy sphere on both a national and global scale.