
Tata Consultancy Services Ltd (TCS)
Stock Analysis Report
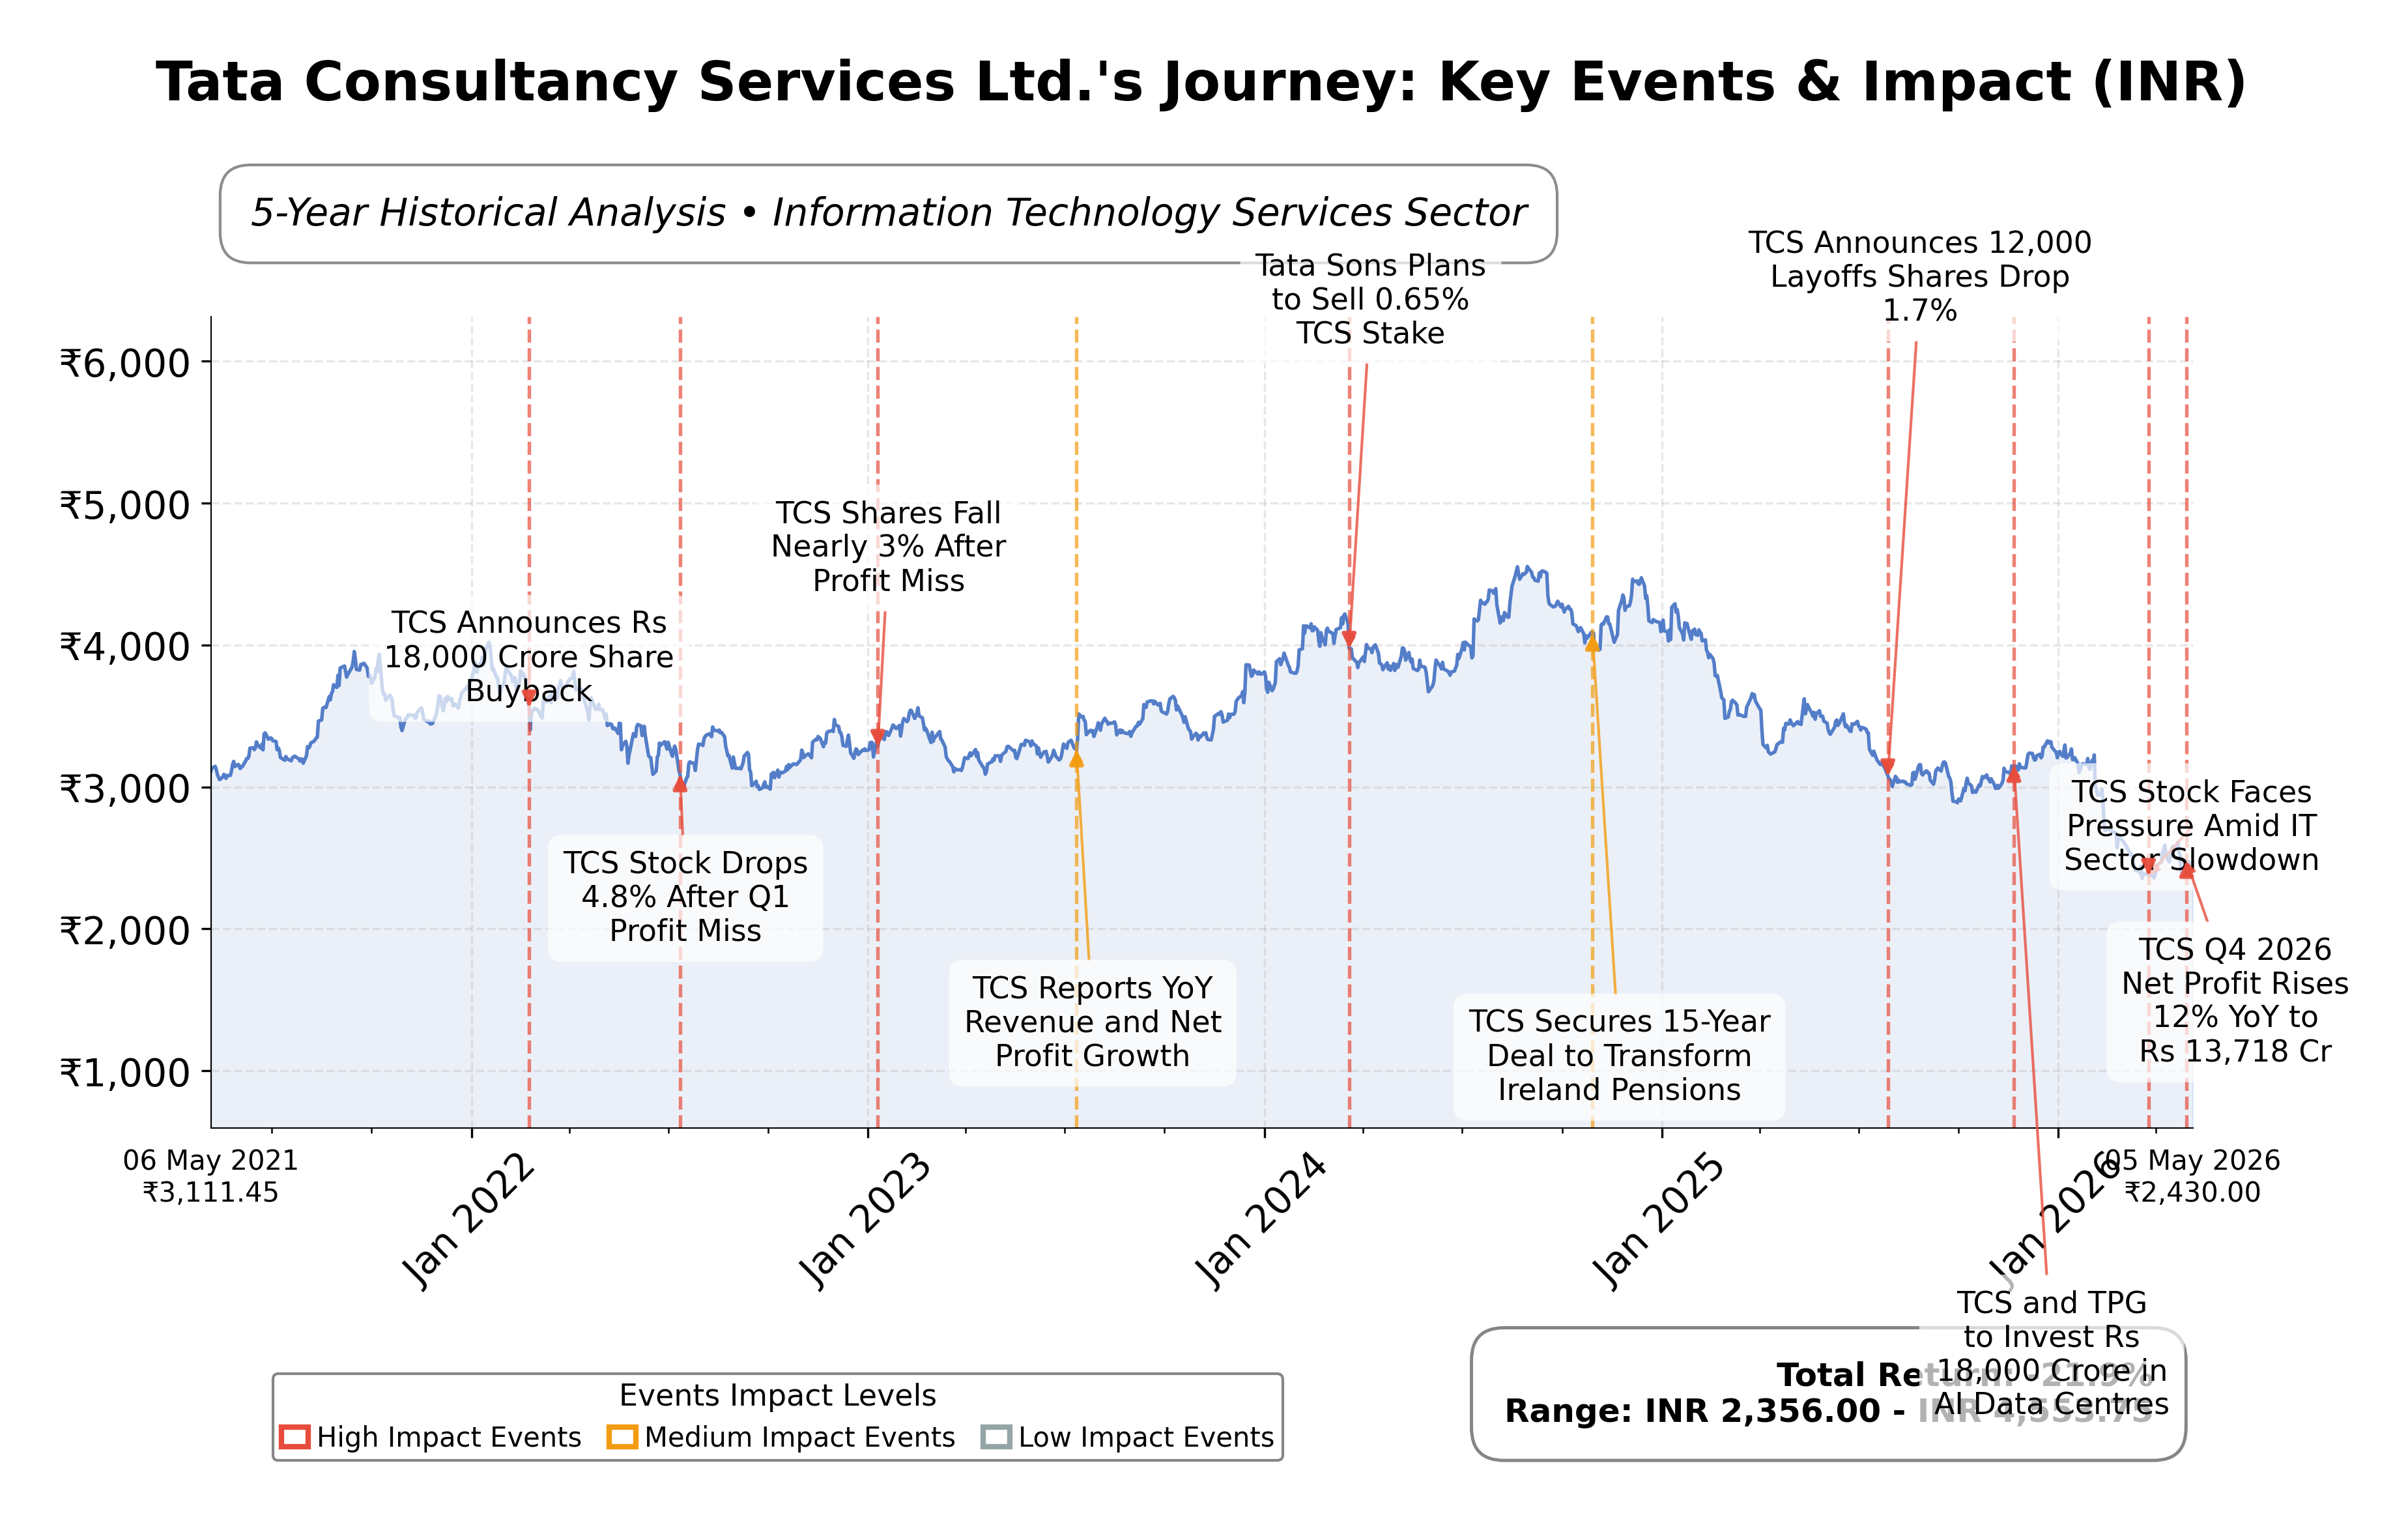
Stock Journey
Key Positives and Key Risks
Pros
- TCS’s return on equity (ROE) of 48.4% demonstrates strong profitability and efficient capital use.
- The company’s free cash flow of ₹427.2 billion supports financial flexibility and strategic investments.
- TCS trades at a forward P/E of 14.94, which is moderate relative to its industry average, indicating reasonable valuation.
Cons
- The stock has declined approximately 39.63% from its 52-week high, reflecting recent price weakness.
- Currency fluctuations have caused a 0.5% decline in USD revenue despite INR growth, posing forex risk.
Disclosure: This information is for general awareness and does not constitute investment advice
Report Summary
Tata Consultancy Services Ltd. (TCS) is a leading global information technology services and consulting company headquartered in Mumbai, India. Listed on the NSE under the technology sector, TCS offers a broad portfolio of IT services including consulting, software development, infrastructure support, and business process outsourcing. The company serves diverse industries such as banking, telecommunications, retail, and healthcare, leveraging advanced digital technologies like cloud computing, analytics, and artificial intelligence to drive business transformation worldwide.
Financially, TCS reported trailing twelve months (TTM) revenue of approximately ₹2.67 trillion with a gross margin of 41.18%, operating margin of 25.28%, and net profit margin of 18.43%. The company exhibits strong profitability and operational efficiency, reflected in a return on equity (ROE) of 48.40%, return on assets (ROA) of 24.43%, and return on invested capital (ROIC) consistent with its robust margins. These metrics indicate effective capital utilization and sustained earnings generation.
Valuation metrics show a trailing price-to-earnings (P/E) ratio of 18.19, forward P/E of 14.94, and an enterprise value to EBITDA (EV/EBITDA) multiple of 11.89, suggesting the stock is moderately priced relative to earnings and cash flow. The market capitalization stands at approximately ₹8.95 trillion. The stock trades near ₹2,421, within a 52-week range of ₹2,346 to ₹3,630, reflecting a downside of about 39.63% from the high, indicating recent price consolidation.
TCS’s strengths include strong cash flow generation with operating cash flow of ₹520.9 billion and free cash flow of ₹427.2 billion, low debt levels with a debt-to-equity ratio of 0.10, and market leadership in the Indian IT services sector. Risks include regulatory changes, currency fluctuations, competitive pressures, and macroeconomic uncertainties. Recent strategic actions include investments in AI capabilities, strategic acquisitions in Salesforce and cloud consulting, and a stable leadership team supporting growth initiatives.
Technically, the stock shows consolidation below its 200-day moving average of ₹2,940 and 50-day average of ₹2,498, with momentum indicators reflecting neutral to mildly positive signals. Recent news highlights steady earnings growth and dividend payouts, suggesting a stable outlook. Overall, the data points to a measured stance with potential for accumulation under favorable conditions, balanced by caution due to valuation and macro factors.
Company and Industry Overview
Company Basics
Price Performance
Company Size
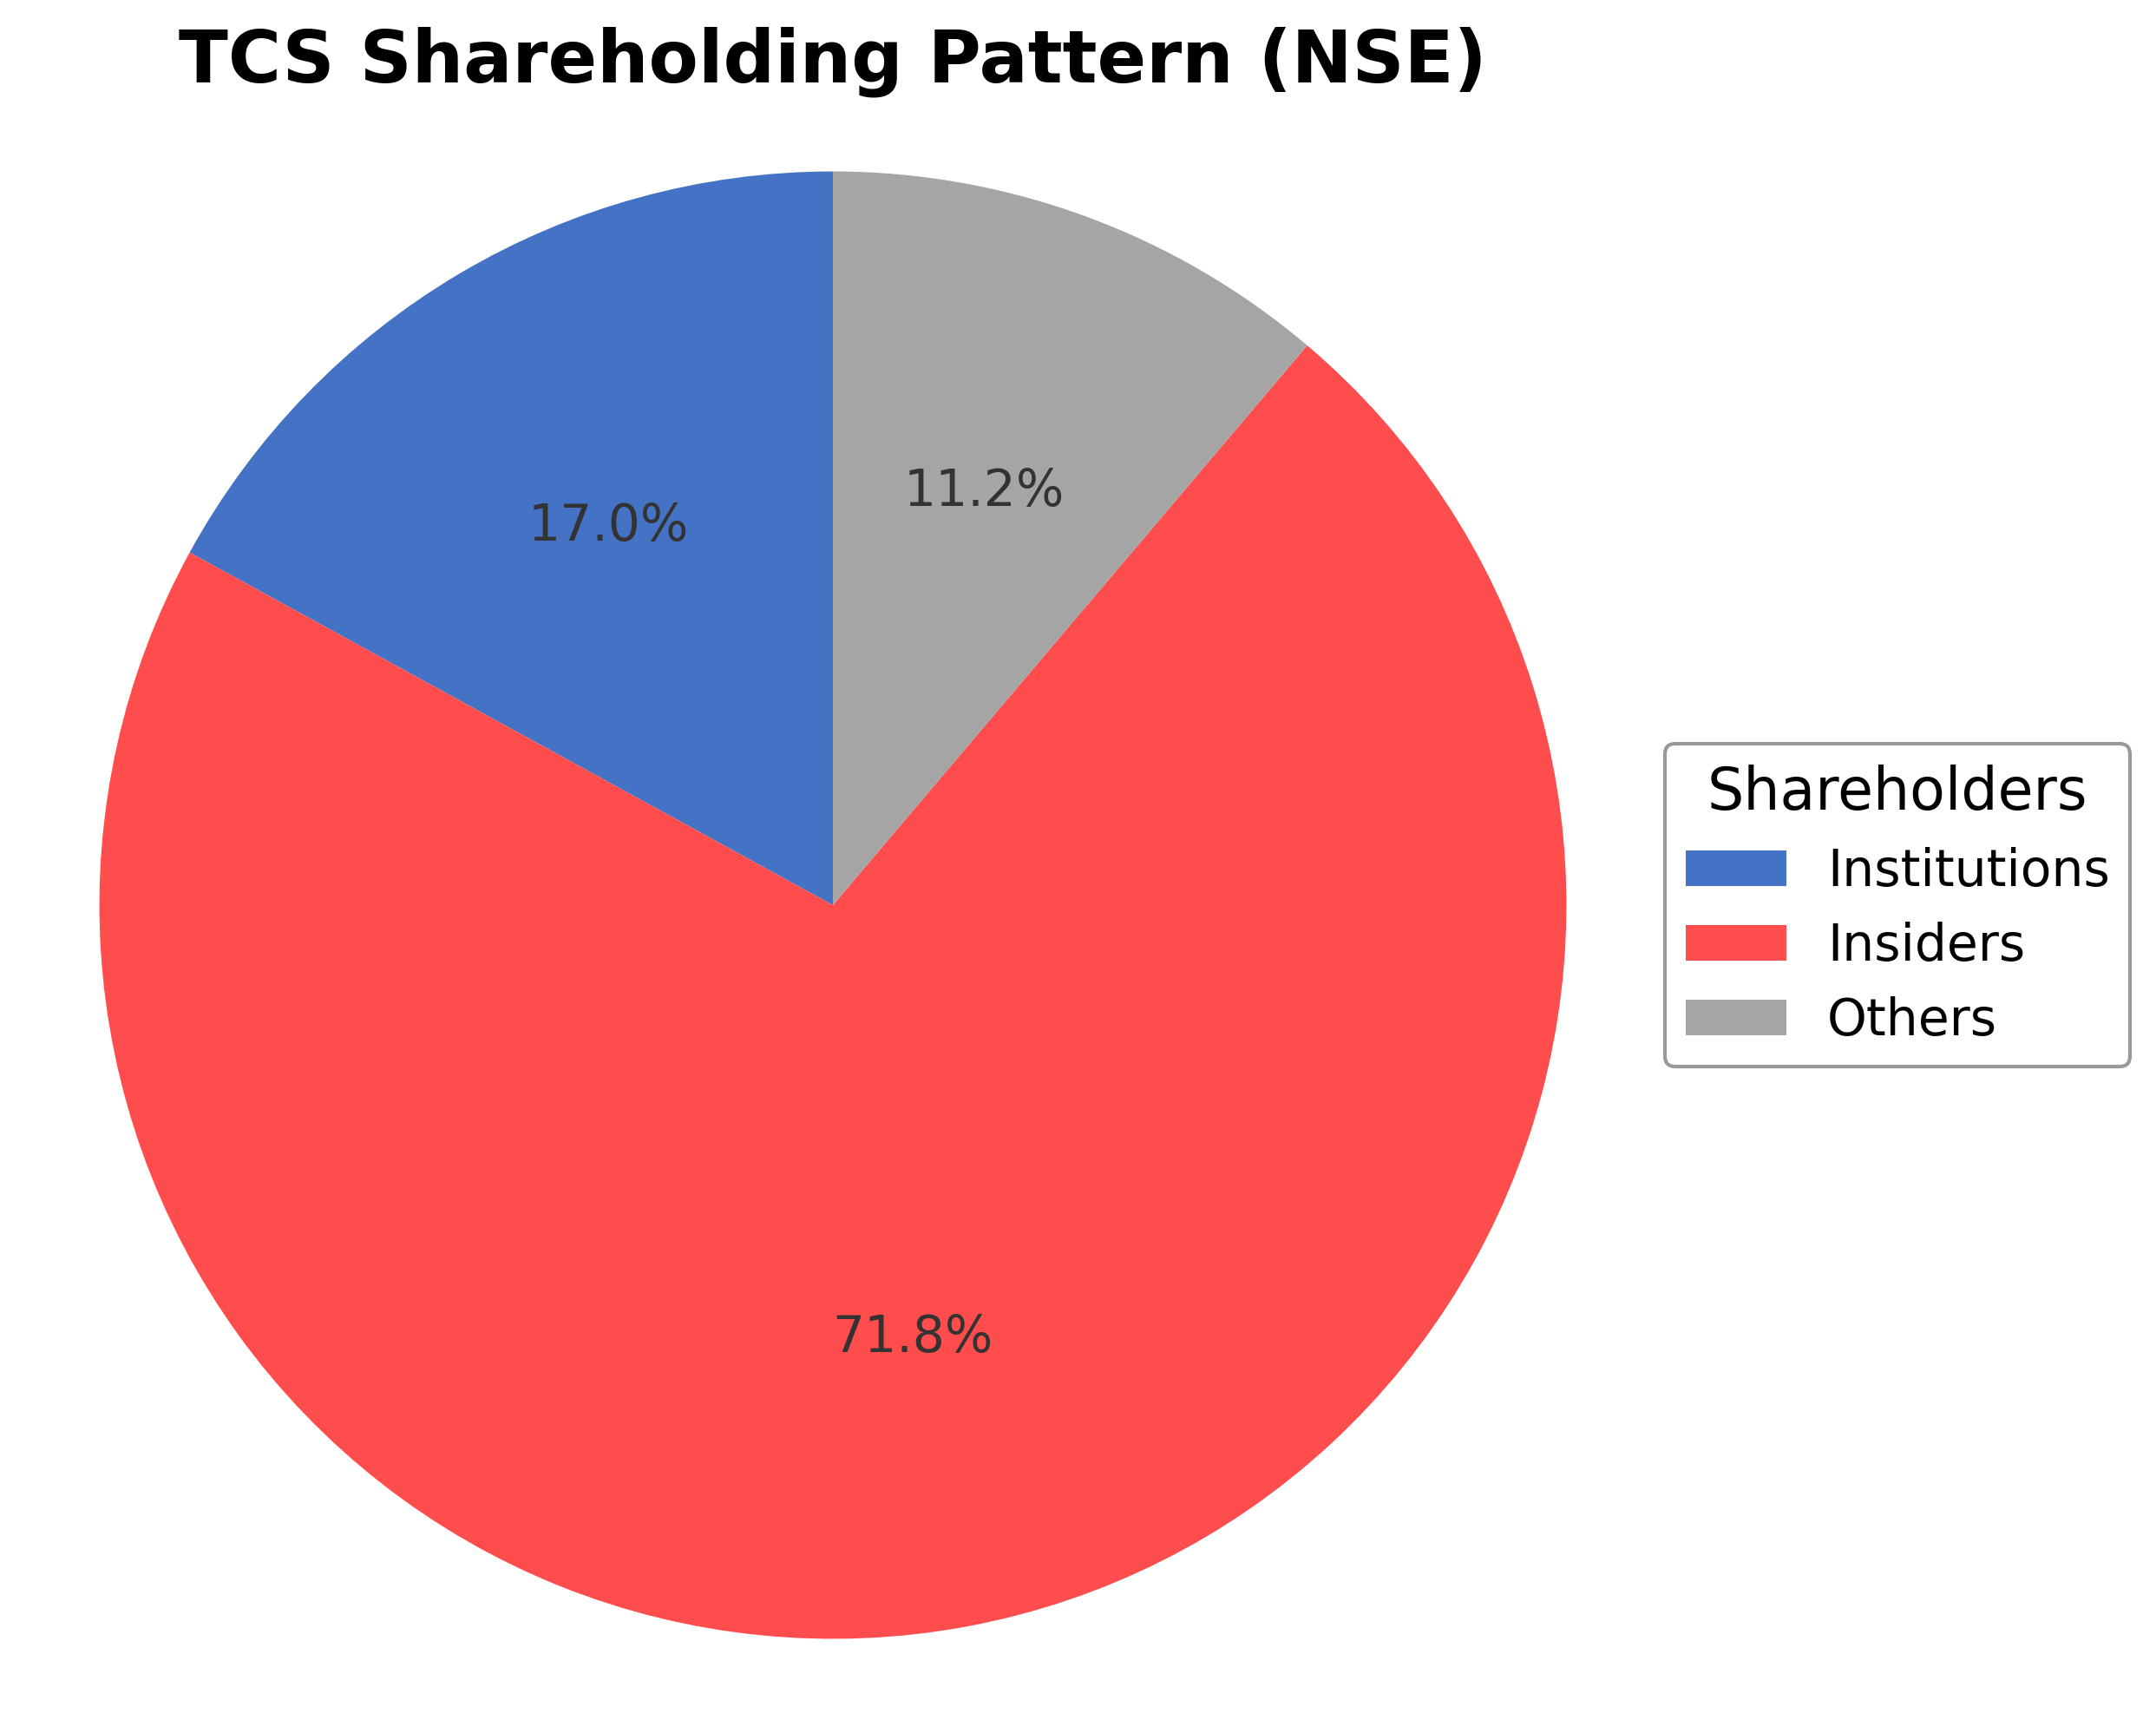
Shareholding Pattern
Sector and Industry Analysis
The global IT services sector is a substantial and rapidly expanding market, driven by increasing digital transformation across industries. Valued in the trillions of dollars, it encompasses services such as consulting, application development, infrastructure management, and emerging technologies like AI and cloud computing. Major players include Tata Consultancy Services (TCS), Accenture, Infosys, and IBM, each commanding significant market share and serving diverse global clients.
Industry trends highlight a shift toward AI integration, cloud migration, and product-centric operating models that emphasize synchronized, resilient service portfolios. Barriers to entry remain high due to the need for skilled talent, technological expertise, and established client relationships. TCS leverages its vast global footprint, innovation in AI-driven solutions, and diversified offerings to maintain a competitive edge amid intense rivalry and evolving customer demands.
The regulatory environment in IT services is shaped by data protection, cybersecurity mandates, and compliance requirements across jurisdictions, particularly in mature markets like North America and Europe. These regulations increase the demand for secure, compliant digital solutions, benefiting established providers with robust governance frameworks. Looking ahead, ongoing regulatory scrutiny and geopolitical factors will continue to influence outsourcing strategies and technology adoption patterns.
Note: Analysis synthesized from industry research, market reports, and regulatory filings. Information is subject to change based on market conditions.
Financial Ratios Dashboard
Illustrative Scenario Analysis
DCF Assumptions:
Method: Two-Stage EPS-Priority Model
Financials
Peer Analysis
| Company Name | Market Cap | P/E Ratio | P/B Ratio | EV/EBITDA | Price to CFO |
|---|---|---|---|---|---|
| Tata Consultancy Services Ltd. | ₹8.95T | 18.19 | 7.89 | 11.89 | 17.18 |
| Sonata Software Ltd. | ₹70.59B | 16.05 | 3.99 | 10.80 | 12.47 |
| Eclerx Services Ltd. | ₹133.17B | 20.55 | 5.12 | 14.01 | 20.97 |
| Mphasis Ltd. | ₹434.43B | 24.14 | 4.26 | 15.63 | 21.87 |
| Tata Technologies Ltd. | ₹236.06B | 44.42 | 6.61 | 30.83 | 34.62 |
| L&T Technology Services Ltd. | ₹384.40B | 31.43 | 6.23 | 18.55 | 26.42 |
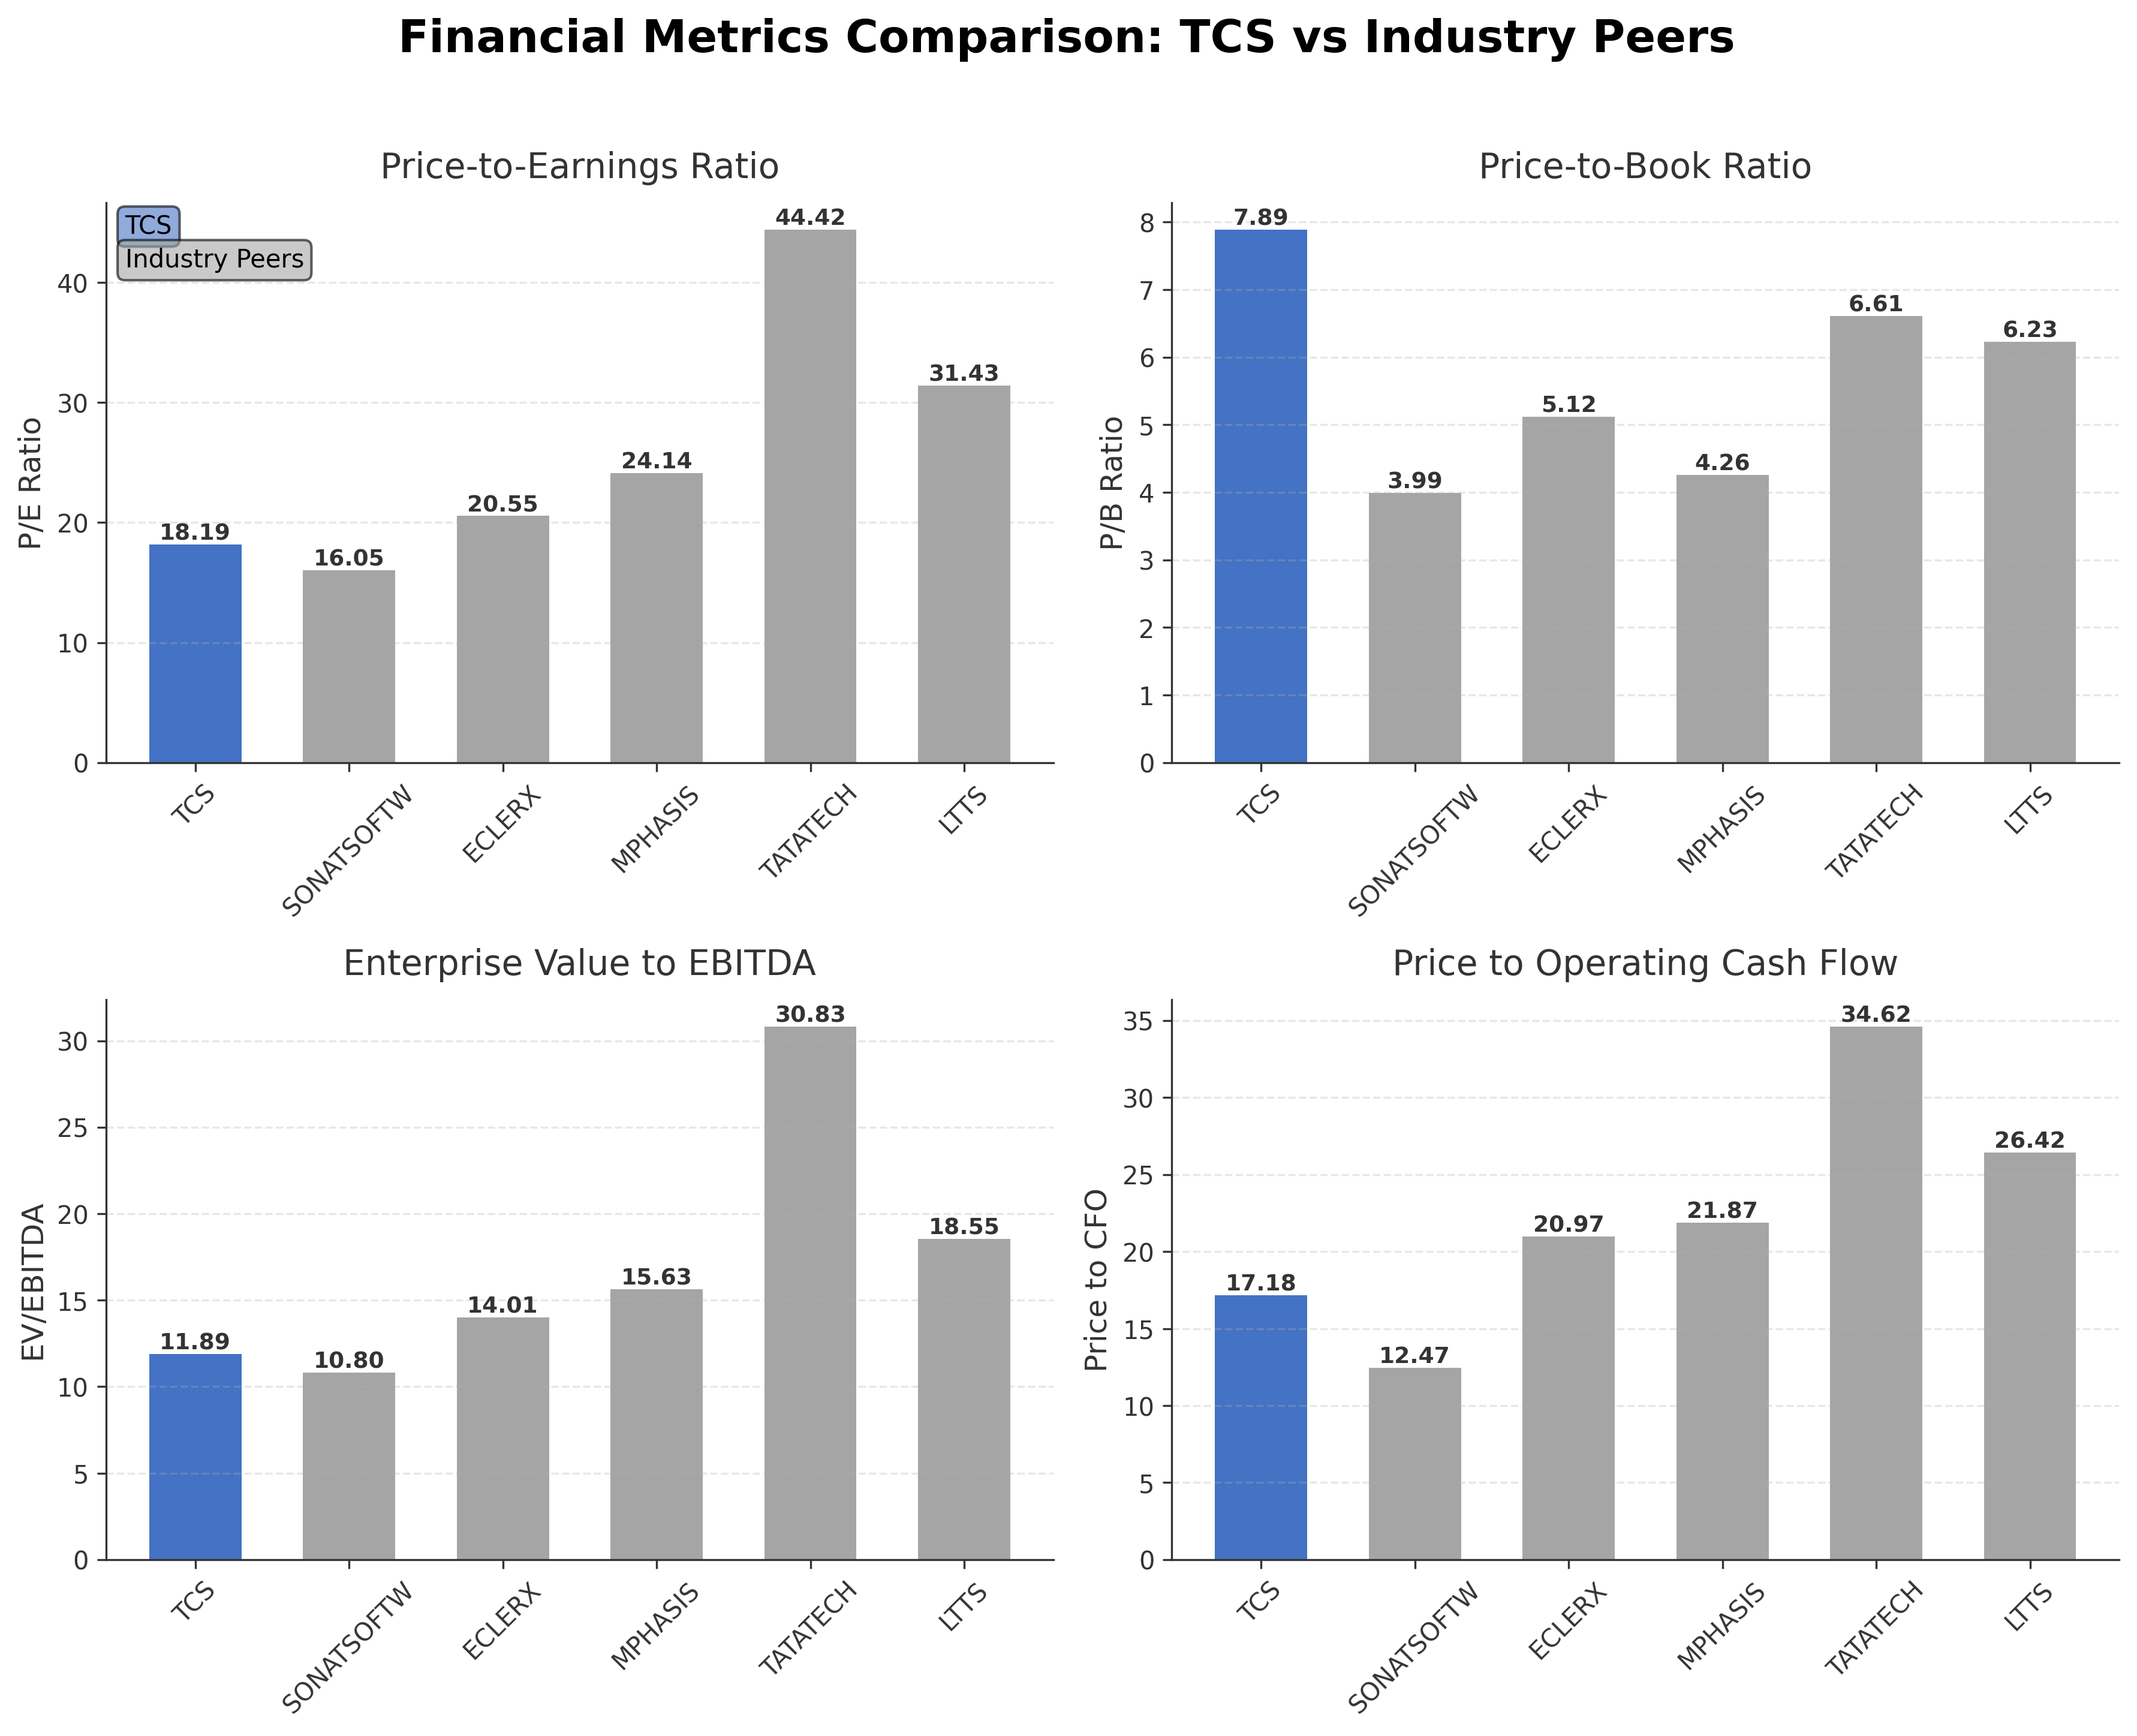
Comparison Analysis: Tata Consultancy Services Ltd. stands out among its Indian IT services peers with the largest market capitalization of ₹8.95 trillion and the highest return on equity at 48.40%, indicating superior profitability. Its valuation multiples, including a P/E of 18.19 and EV/EBITDA of 11.89, are generally lower than several peers such as Tata Technologies and L&T Technology Services, which have higher P/E ratios above 30, reflecting a more moderate valuation. TCS’s price-to-cash-flow ratio of 17.18 is competitive, though some smaller peers exhibit lower multiples. Overall, TCS combines scale, profitability, and reasonable valuation relative to its regional competitors.
Financial Metrics Comparison with Peers
Financial Statements
Comprehensive financial data including income, balance sheet, and cash flow metrics
Income Statement
| fiscal_date | 2026-03-31 | 2025-03-31 | 2024-03-31 | 2023-03-31 | 2022-03-31 |
|---|---|---|---|---|---|
| Sales | 2670.21B | 2553.24B | 2408.93B | 2254.58B | 1917.54B |
| Cost Of Goods | 1593.93B | 1574.36B | 1328.71B | 1197.59B | 1002.67B |
| Gross Profit | 1076.28B | 978.88B | 1080.22B | 1056.99B | 914.87B |
| Operating Expense Other Operating Expenses | 352.30B | 304.81B | 145.69B | 130.73B | 103.86B |
| Operating Income | 668.38B | 621.65B | 594.25B | 543.77B | 485.88B |
| Non Operating Interest Expense | 12.27B | 7.96B | 7.78B | 7.79B | 7.84B |
| Pretax Income | 654.87B | 653.31B | 619.97B | 569.07B | 516.87B |
| Income Tax | 160.33B | 165.34B | 158.98B | 146.04B | 132.38B |
| Net Income | 494.54B | 487.97B | 460.99B | 423.03B | 384.49B |
| Ebit | 667.14B | 661.27B | 627.75B | 576.86B | 524.71B |
| Ebitda | 768.00B | 713.69B | 685.06B | 626.00B | 569.82B |
| Net Income Continuous Operations | 494.54B | 487.97B | 460.99B | 423.03B | 384.49B |
| Minority Interests | -2.44B | -2.44B | -1.91B | -1.56B | -1.22B |
| Preferred Stock Dividends | 0.00 | 0.00 | 0.00 | 0.00 | 0.00 |
| Operating Expense Selling General And Administrative | N/A | 140.60B | 180.81B | 235.83B | 194.59B |
| Non Operating Interest Income | N/A | 32.96B | 37.81B | 32.48B | 26.63B |
| Eps Basic | N/A | 134.19 | 125.88 | 115.19 | 103.62 |
| Eps Diluted | N/A | 134.19 | 125.88 | 115.19 | 103.62 |
| Basic Shares Outstanding | N/A | 3.62B | 3.65B | 3.66B | 3.70B |
| Diluted Shares Outstanding | N/A | 3.62B | 3.65B | 3.66B | 3.70B |
Source: Financial statements and regulatory filings
Balance Sheet
| fiscal_date | 2026-03-31 | 2025-03-31 | 2024-03-31 | 2023-03-31 | 2022-03-31 |
|---|---|---|---|---|---|
| Cash And Cash Equivalents | 64.17B | 83.31B | 90.07B | 71.15B | 124.56B |
| Accounts Receivable | 576.30B | 501.42B | 444.34B | 410.49B | 340.74B |
| Total Assets | 1823.72B | 1596.29B | 1464.49B | 1436.51B | 1415.14B |
| Total Liabilities | 738.94B | 638.58B | 551.30B | 524.45B | 516.68B |
| Long Term Debt | 94.53B | 78.38B | 65.16B | 62.03B | 63.68B |
| Shareholders Equity | 1084.78B | 957.71B | 913.19B | 912.06B | 898.46B |
Source: Financial statements and regulatory filings
Cash Flow Statement
| fiscal_date | 2026-03-31 | 2025-03-31 | 2024-03-31 | 2023-03-31 | 2022-03-31 |
|---|---|---|---|---|---|
| Operating Activities Net Income | 494.54B | 487.97B | 460.99B | 423.03B | 384.49B |
| Operating Activities Other Non Cash Items | -27.27B | -25.15B | -30.10B | -24.67B | -18.77B |
| Operating Activities Accounts Receivable | -50.51B | -59.66B | -36.33B | -74.22B | -52.60B |
| Operating Activities Other Assets Liabilities | 39.46B | -11.11B | -26.17B | 11.69B | 23.05B |
| Operating Activities Operating Cash Flow | 456.22B | 392.05B | 368.39B | 335.83B | 336.17B |
| Investing Activities Capital Expenditures | -37.14B | -29.70B | -22.15B | -27.08B | -24.67B |
| Investing Activities Net Intangibles | -3.67B | -9.44B | -4.35B | -3.55B | -4.97B |
| Investing Activities Net Acquisitions | -67.50B | 0.00 | N/A | N/A | N/A |
| Investing Activities Purchase Of Investments | -1621.20B | -1564.58B | -1504.82B | -1342.93B | -305.66B |
| Investing Activities Sale Of Investments | 1581.07B | 1560.42B | 1552.93B | 1289.39B | 858.02B |
| Investing Activities Other Investing Activity | -10.93B | -10.58B | 30.00M | 20.00M | 30.00M |
| Investing Activities Investing Cash Flow | -155.70B | -44.44B | 25.99B | -80.60B | 527.72B |
| Financing Activities Common Stock Issuance | 1.26B | 0.00 | N/A | N/A | 1.62B |
| Financing Activities Common Dividends | -394.37B | -448.64B | -251.37B | -413.47B | -133.17B |
| Financing Activities Other Financing Charges | 740.00M | 280.00M | -39.59B | -41.74B | -420.00M |
| Financing Activities Financing Cash Flow | -392.37B | -448.36B | -460.96B | -455.21B | -311.97B |
| End Cash Position | 64.17B | 83.42B | 90.16B | 71.23B | 124.88B |
| Free Cash Flow | 479.07B | 449.71B | 416.64B | 388.65B | 369.54B |
| Financing Activities Common Stock Repurchase | N/A | 0.00 | -170.00B | 0.00 | -180.00B |
Source: Financial statements and regulatory filings
Technical Analysis
Key Insights
- TCS is currently in a consolidation phase with price trading below the 200-day moving average of ₹2,940 and near the 50-day moving average of ₹2,498, indicating a neutral to mildly bearish trend in the medium term.
- Key support levels are identified near ₹2,346 (52-week low) and ₹2,498 (50-day MA), while resistance is observed around ₹2,940 (200-day MA) and the recent high near ₹3,630.
- The stock is positioned below the 200-day moving average but fluctuates around the 50-day moving average, suggesting mixed momentum across short and long-term moving averages.
- Momentum indicators show the Relative Strength Index (RSI) in a neutral range, MACD near the signal line indicating lack of strong momentum, and Stochastic oscillators reflecting sideways movement.
- Multi-timeframe analysis reveals daily charts showing consolidation, weekly charts indicating a potential base formation, and monthly charts reflecting a longer-term uptrend with recent pullback.
- Current technical setup suggests potential for range-bound trading with possible breakout or breakdown depending on market catalysts and broader sector momentum.
Trending News
1. Headline: TCS Announces Record Date For Final Dividend Of Rs 31 — Check Payout Details
Summary: The payout brings the total dividend distributed for the fiscal year to Rs 110 per share.
Sentiment: neutral
2. Headline: Cognizant trims shareholder payouts as AI dealmaking gathers pace | Company Business News
Summary: Cognizant Technology Solutions Corp has become the third largest Indian heritage IT services firm — after Tata Consultancy Services Ltd and HCL Technologies Ltd — to dial back shareholder payouts as it redirects capital towards acquisitions and AI capability building.
Sentiment: positive
3. Headline: Tata Consumer Share Price Highlights: Tata Consumer Stock Price History - The Economic Times
Summary: Welcome to the Tata Consumer Stock Liveblog, your go-to platform for real-time updates and analysis on a top-performing stock. Stay ahead of the market with our in-depth coverage of Tata Consumer, including: Last traded price 1153.5, Market capitalization: 114145.95, Volume: 1065572, ...
Sentiment: neutral
Summary: Stock Market Highlights: Nifty50 and BSE Sensex ended in red on weak global cues. Rising oil prices today weighed on market sentiment. Market experts
Sentiment: negative
5. Headline: Investor Interest Peaks: Why TCS, Infosys, HCLTech Are Most-Searched Companies Amid Q4 Earnings Season
Summary: The companies reigned over google trends as they reported their Q4FY26 results.
Sentiment: neutral
Recent Updates
News Summary
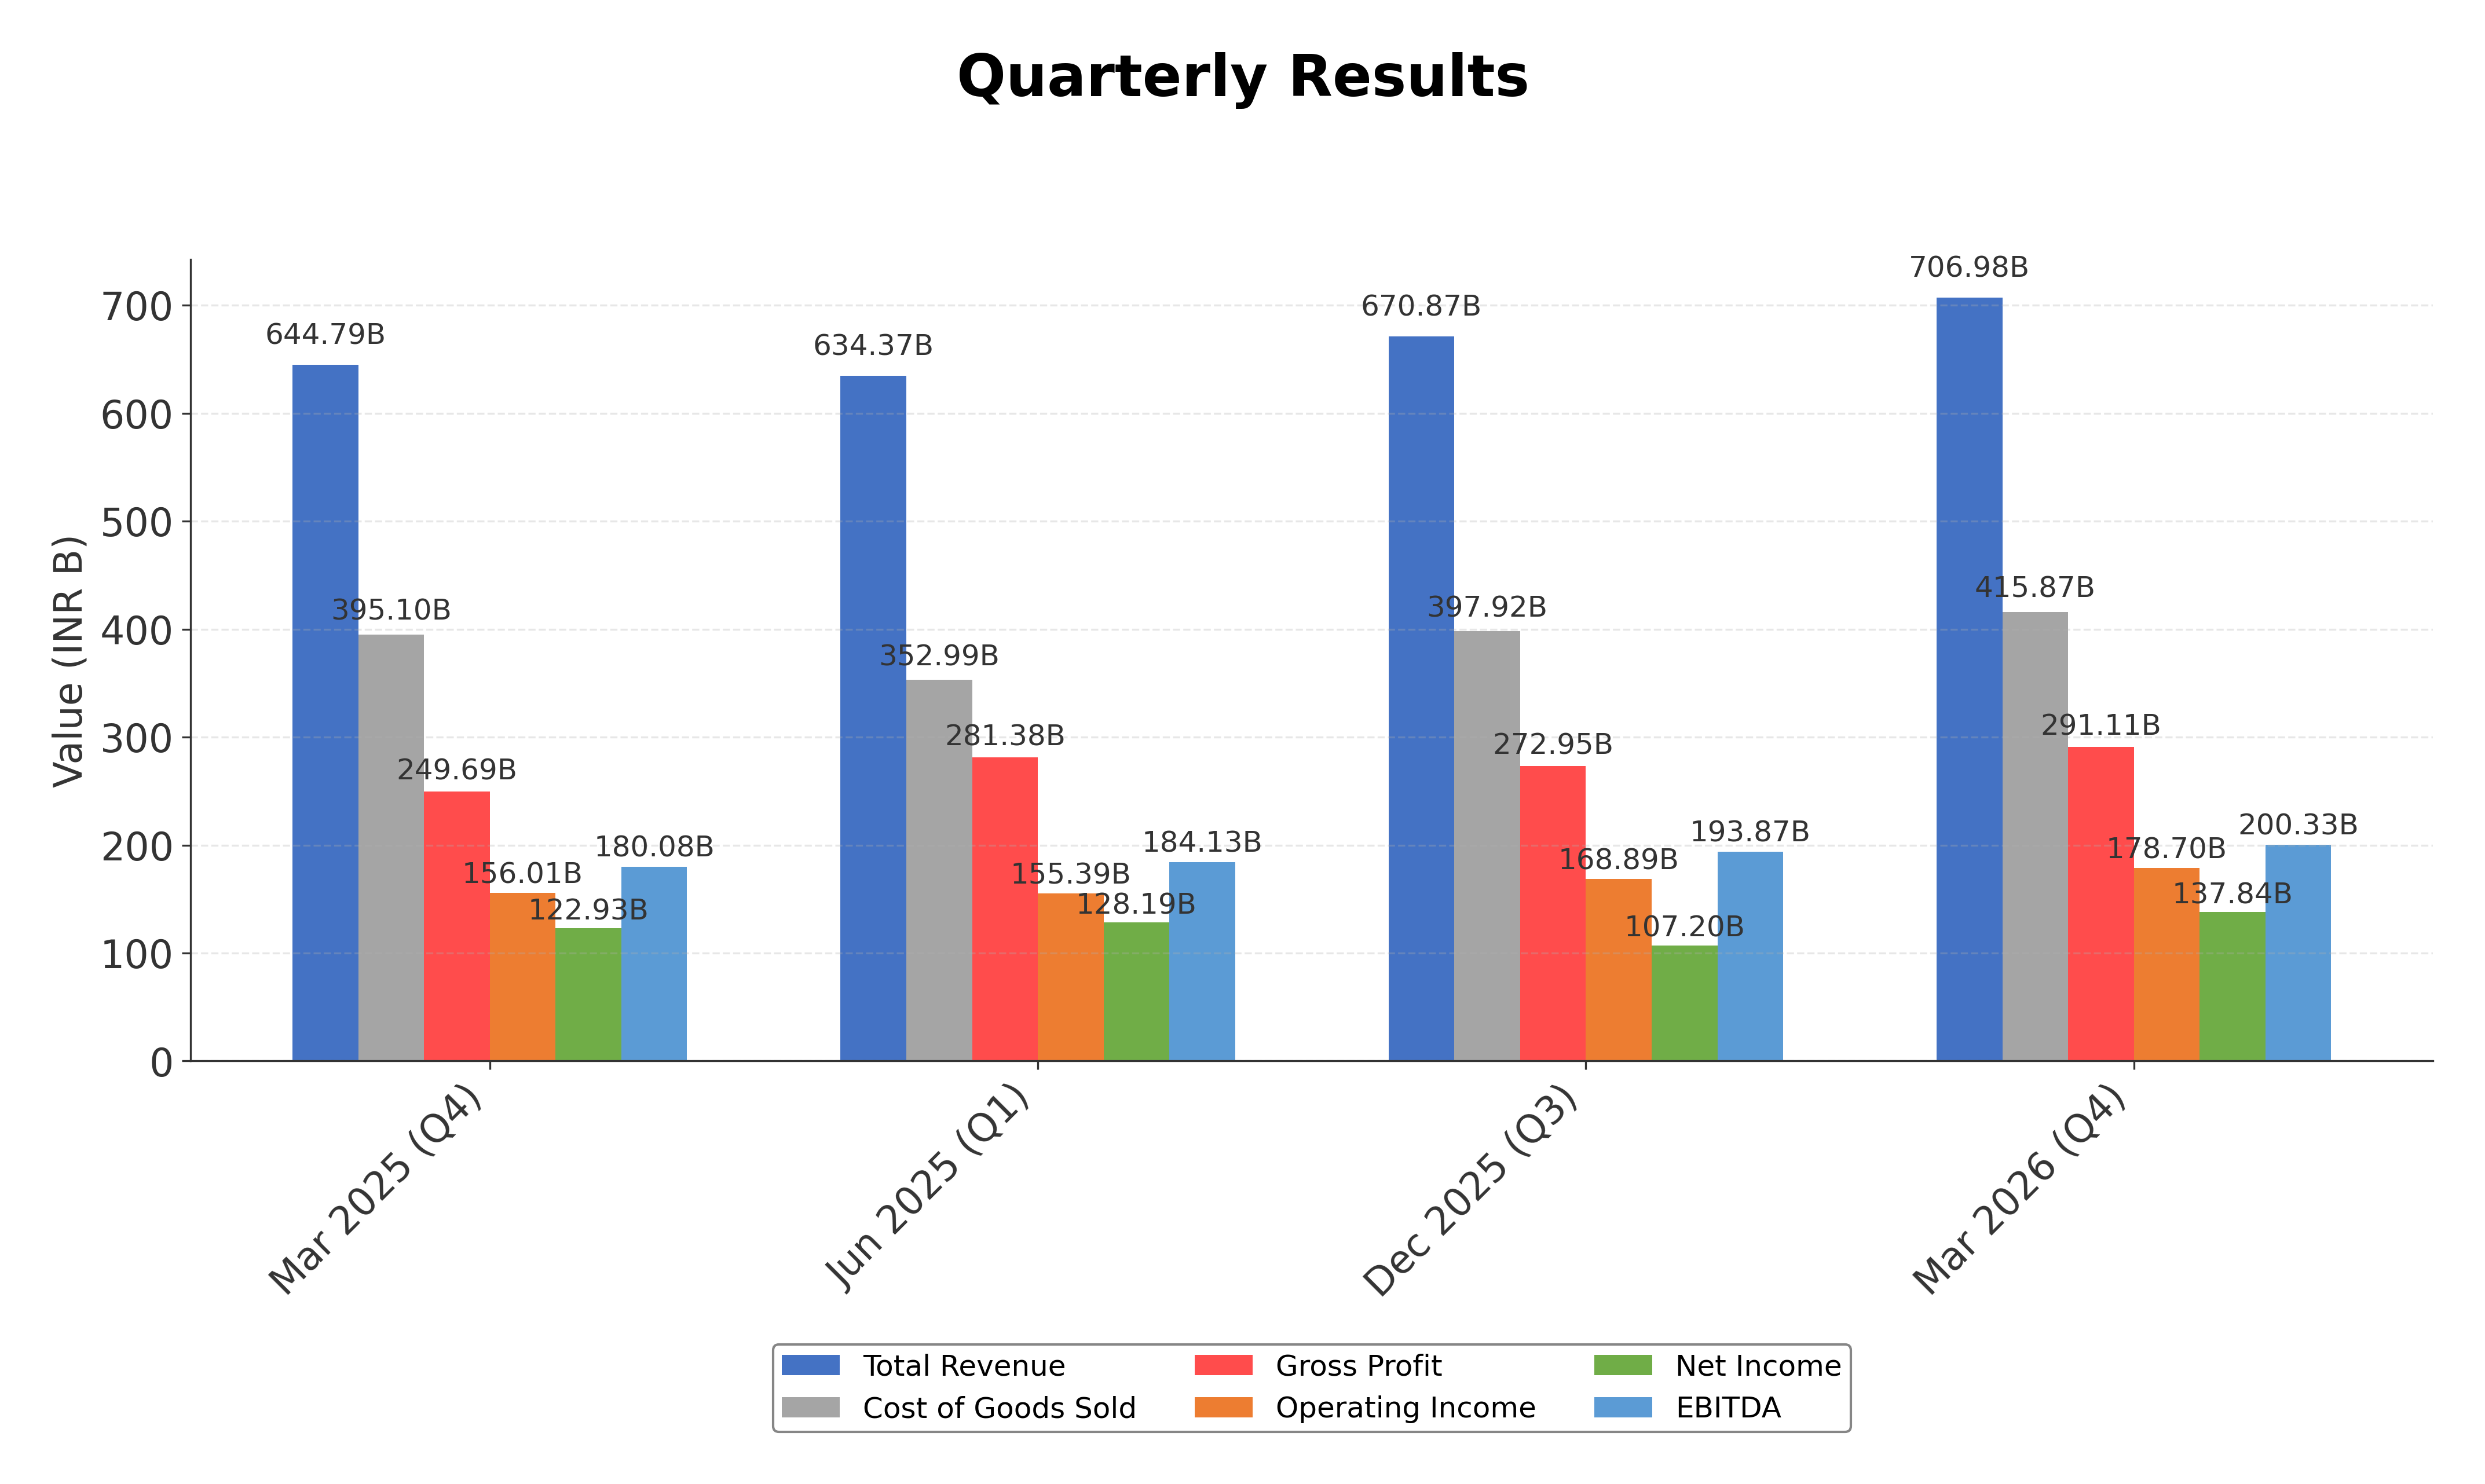
As of 2026-05-06. Tata Consultancy Services Ltd. reported its Q4 FY26 earnings with sequential revenue growth of 5.4% QoQ and 9.6% YoY in INR terms, achieving $7.621 billion in USD revenue despite macroeconomic headwinds. The company recorded a four-year high operating margin of 25%, with net margin at 19.4%, and EPS growth of 12.2% YoY. FY26 revenue reached ₹2.67 trillion with 4.6% growth in INR, though a slight 0.5% decline in USD terms was noted due to currency effects. The company’s total contract value (TCV) hit $40.7 billion for FY26, including significant AI services revenue surpassing $2.3 billion annually. Cash flow remained robust with free cash flow of ₹429.8 billion and total cash and investments of ₹500.2 billion at year-end. Management highlighted strong order books and positive momentum entering FY27, with expected margin stability and ongoing strategic acquisitions in Salesforce and cloud consulting to enhance capabilities.
News Sentiment
The overall sentiment from recent updates is cautiously positive, driven by strong financial performance, margin expansion, and strategic investments in AI and cloud services. Growth in contract wins and robust cash flow generation underpin confidence in operational execution. Neutral tones arise from currency headwinds and macroeconomic uncertainties, while positive signals stem from management’s outlook and acquisition activity. This balanced sentiment reflects a stable but vigilant market perspective on TCS’s near-term prospects.
Source List
- https://www.alphaspread.com/security/nse/tcs/investor-relations
- https://www.screener.in/company/TCS/consolidated/
Analytical Overview
Analysis Summary
Tata Consultancy Services Ltd. trades at a trailing P/E of 18.19 and forward P/E of 14.94, which are slightly below or in line with the industry average P/E of 18.19, indicating reasonable valuation relative to peers. The company demonstrates a solid growth trajectory with 9.6% quarterly revenue growth YoY and consistent free cash flow generation of ₹427.2 billion, supporting sustainable expansion. Financial health is robust, evidenced by a low debt-to-equity ratio of 0.10, a current ratio of 2.23, and strong operating cash flow of ₹520.9 billion, indicating liquidity and balance sheet strength. Sector-specific opportunities include increasing demand for AI, cloud computing, and digital transformation services, while challenges involve currency fluctuations and competitive pressures. Considering India-specific factors, TCS benefits from a favorable regulatory environment, a large skilled workforce, and growing domestic IT demand, supporting its competitive positioning.
Overall Business and Market Assessment
Supporting Factors: TCS’s strong profitability with an ROE of 48.4%, consistent revenue growth, and healthy cash flow generation
Risk Factors: No data
SWOT Analysis
Strengths
- Tata Consultancy Services Ltd. has a diversified service portfolio across multiple industries.
- The company maintains strong profitability with high operating and net margins.
- Robust cash flow generation supports operational and strategic initiatives.
- Market leadership in the Indian IT services sector with a global client base.
Weaknesses
- Stock trades at a relatively high price-to-book ratio of 7.89.
- Revenue growth shows some currency-related headwinds impacting USD terms.
- Dependence on large clients may expose the company to concentration risks.
- Operating margins could face pressure from rising wage costs.
Opportunities
- Growing demand for AI, cloud computing, and digital transformation services.
- Strategic acquisitions to enhance capabilities in Salesforce and cloud consulting.
- Expanding presence in emerging markets and new industry verticals.
- Increasing adoption of technology outsourcing by global enterprises.
Threats
- Regulatory changes and compliance requirements in multiple jurisdictions.
- Intense competition from global and domestic IT service providers.
- Currency fluctuations affecting reported revenues and profitability.
- Macroeconomic uncertainties impacting client spending on IT services.
Company Description
Tata Consultancy Services Ltd. is a leading global information technology services and consulting company. Its primary function is to provide a wide range of technology-driven business solutions aimed at enhancing operational efficiency and innovation for its clients across various sectors. TCS delivers IT services such as consulting, software development, infrastructure support, and business process outsourcing. This expansive service portfolio allows TCS to cater to diverse industries, including banking and financial services, telecommunications, retail, and healthcare. Serving clients worldwide, TCS leverages its expertise in digital technologies, like cloud computing, analytics, and artificial intelligence, to transform business landscapes. Founded in 1968 and headquartered in Mumbai, India, TCS is a flagship company of the Tata Group, contributing significantly to India's IT industry profile on the global stage. Its role in the market is pivotal, not only as a major employment provider but also as a benchmark for technological innovation and corporate governance internationally. TCS's market significance lies in its consistent delivery of robust financial performances and its reputation for quality and reliability in IT services.