

Tata Consultancy Services Ltd (TCS)
Stock Analysis Report
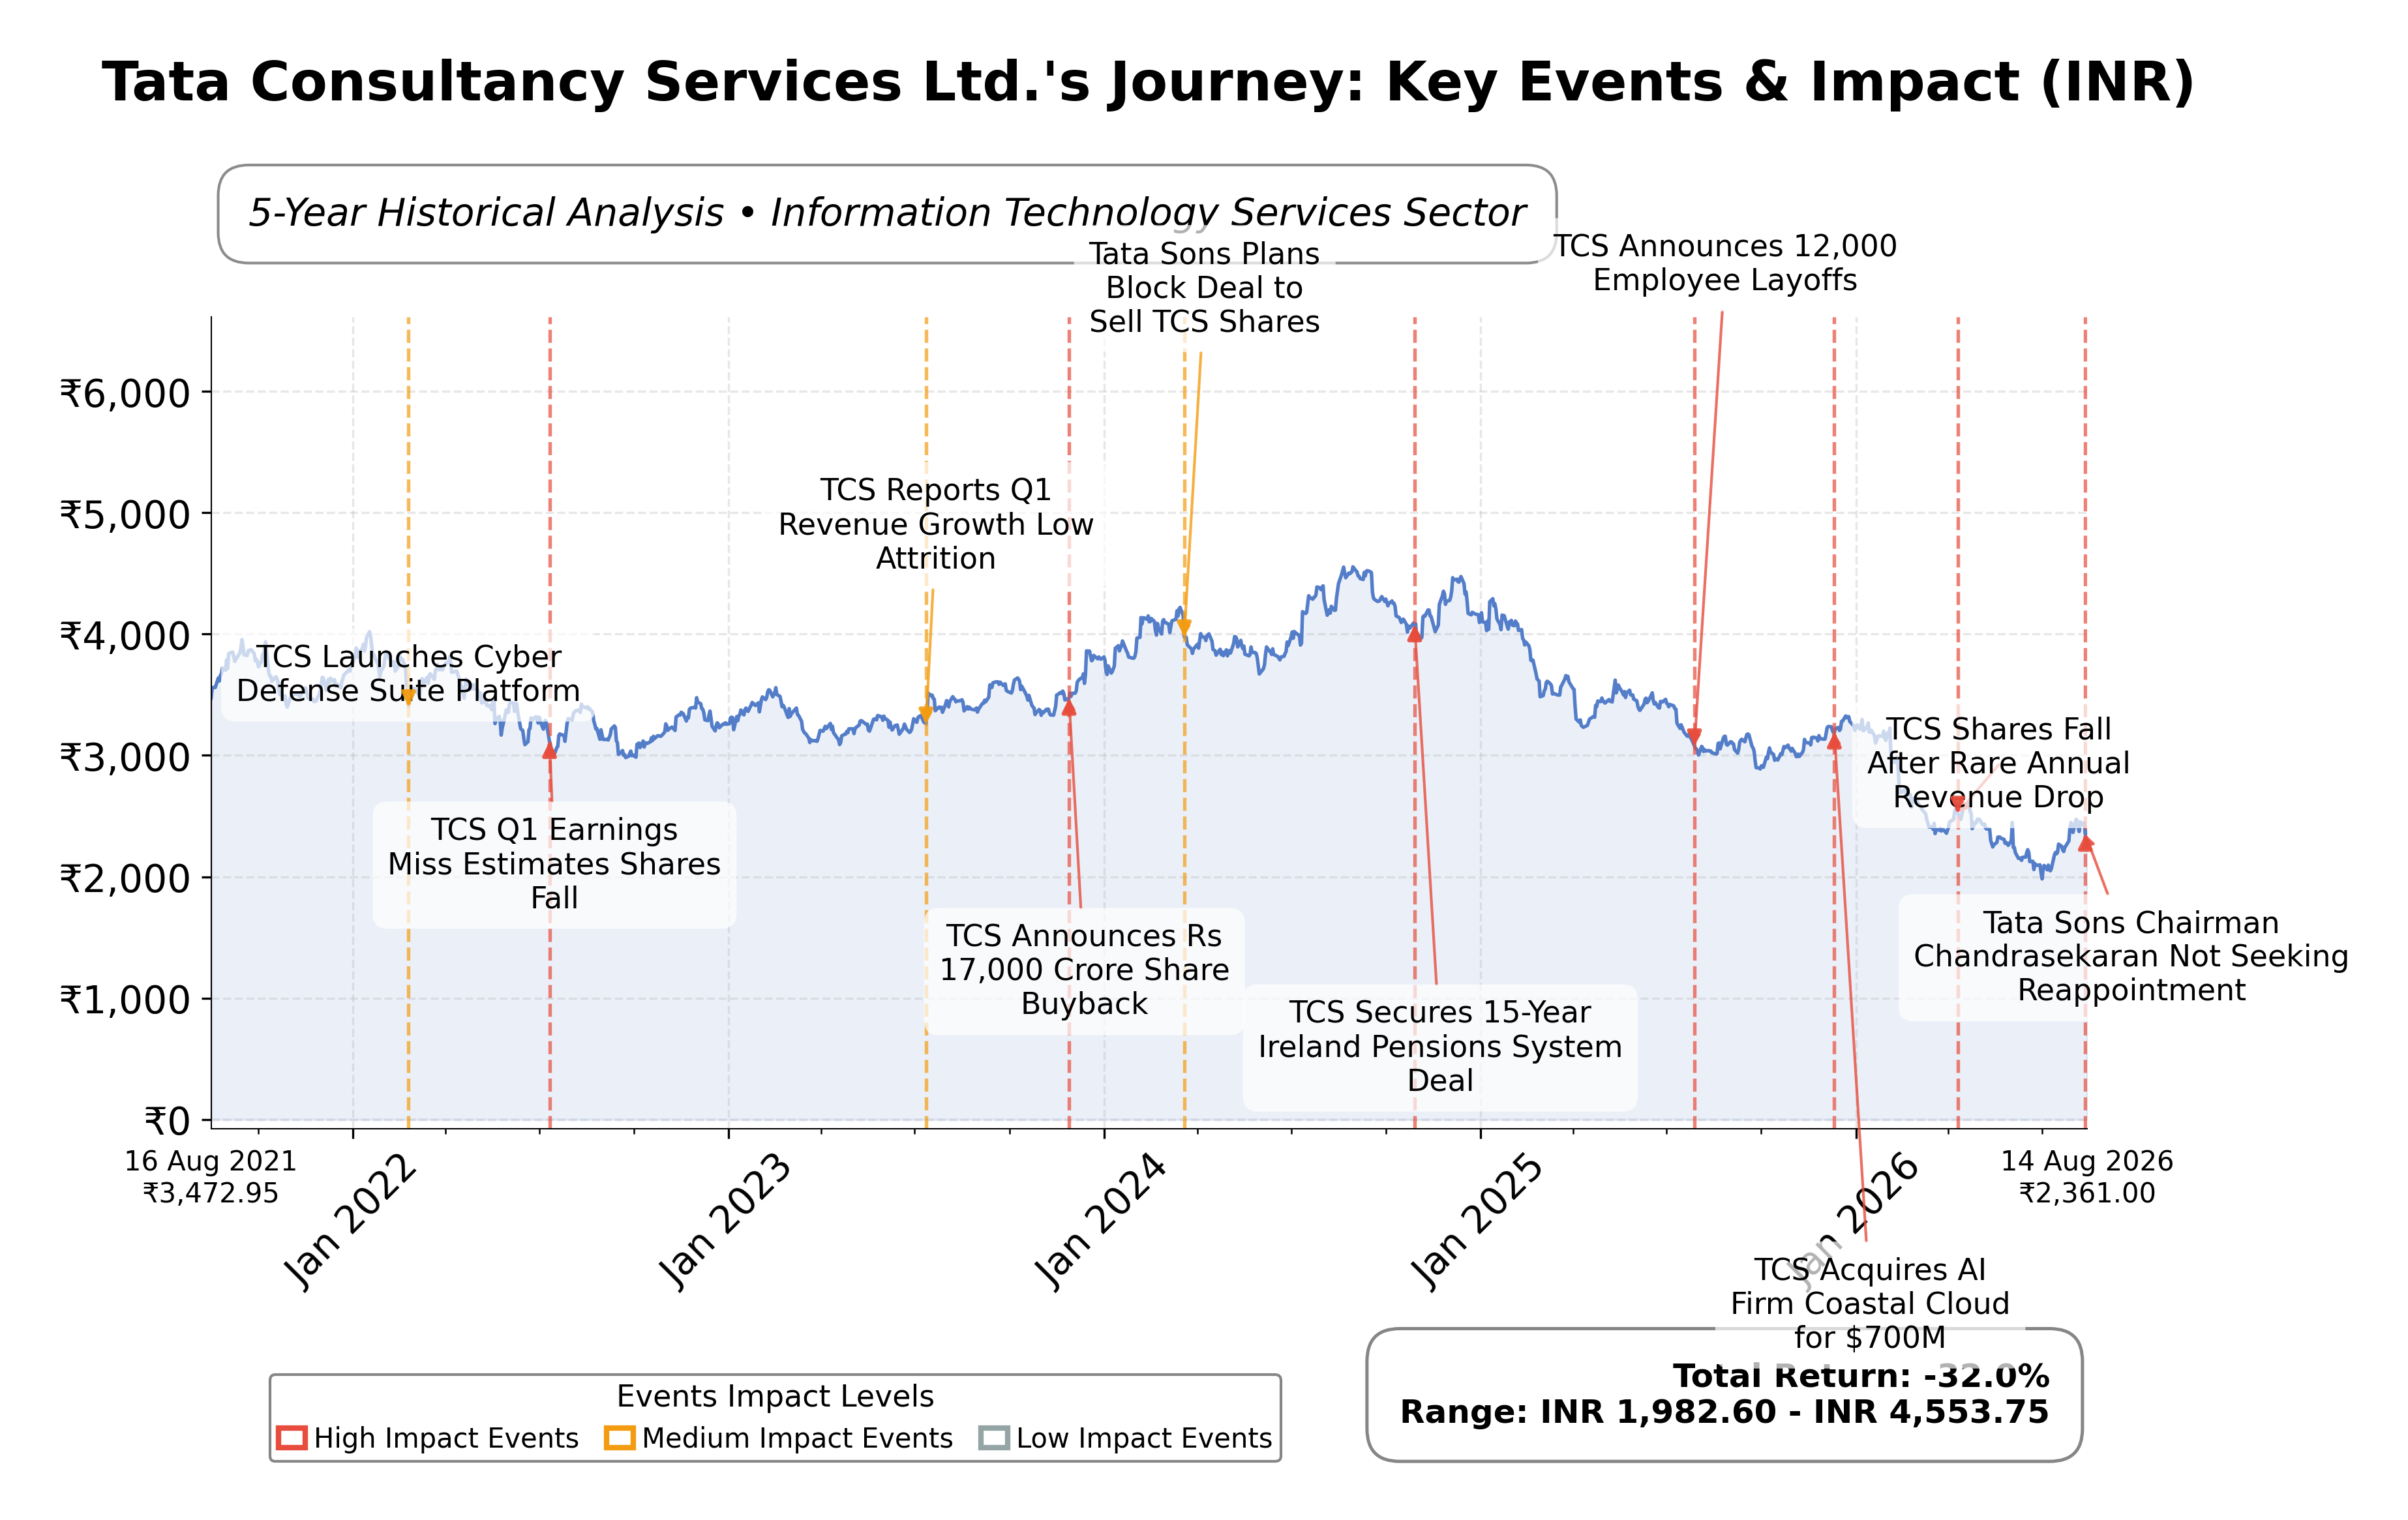
Stock Journey
Key Positives and Key Risks
Pros
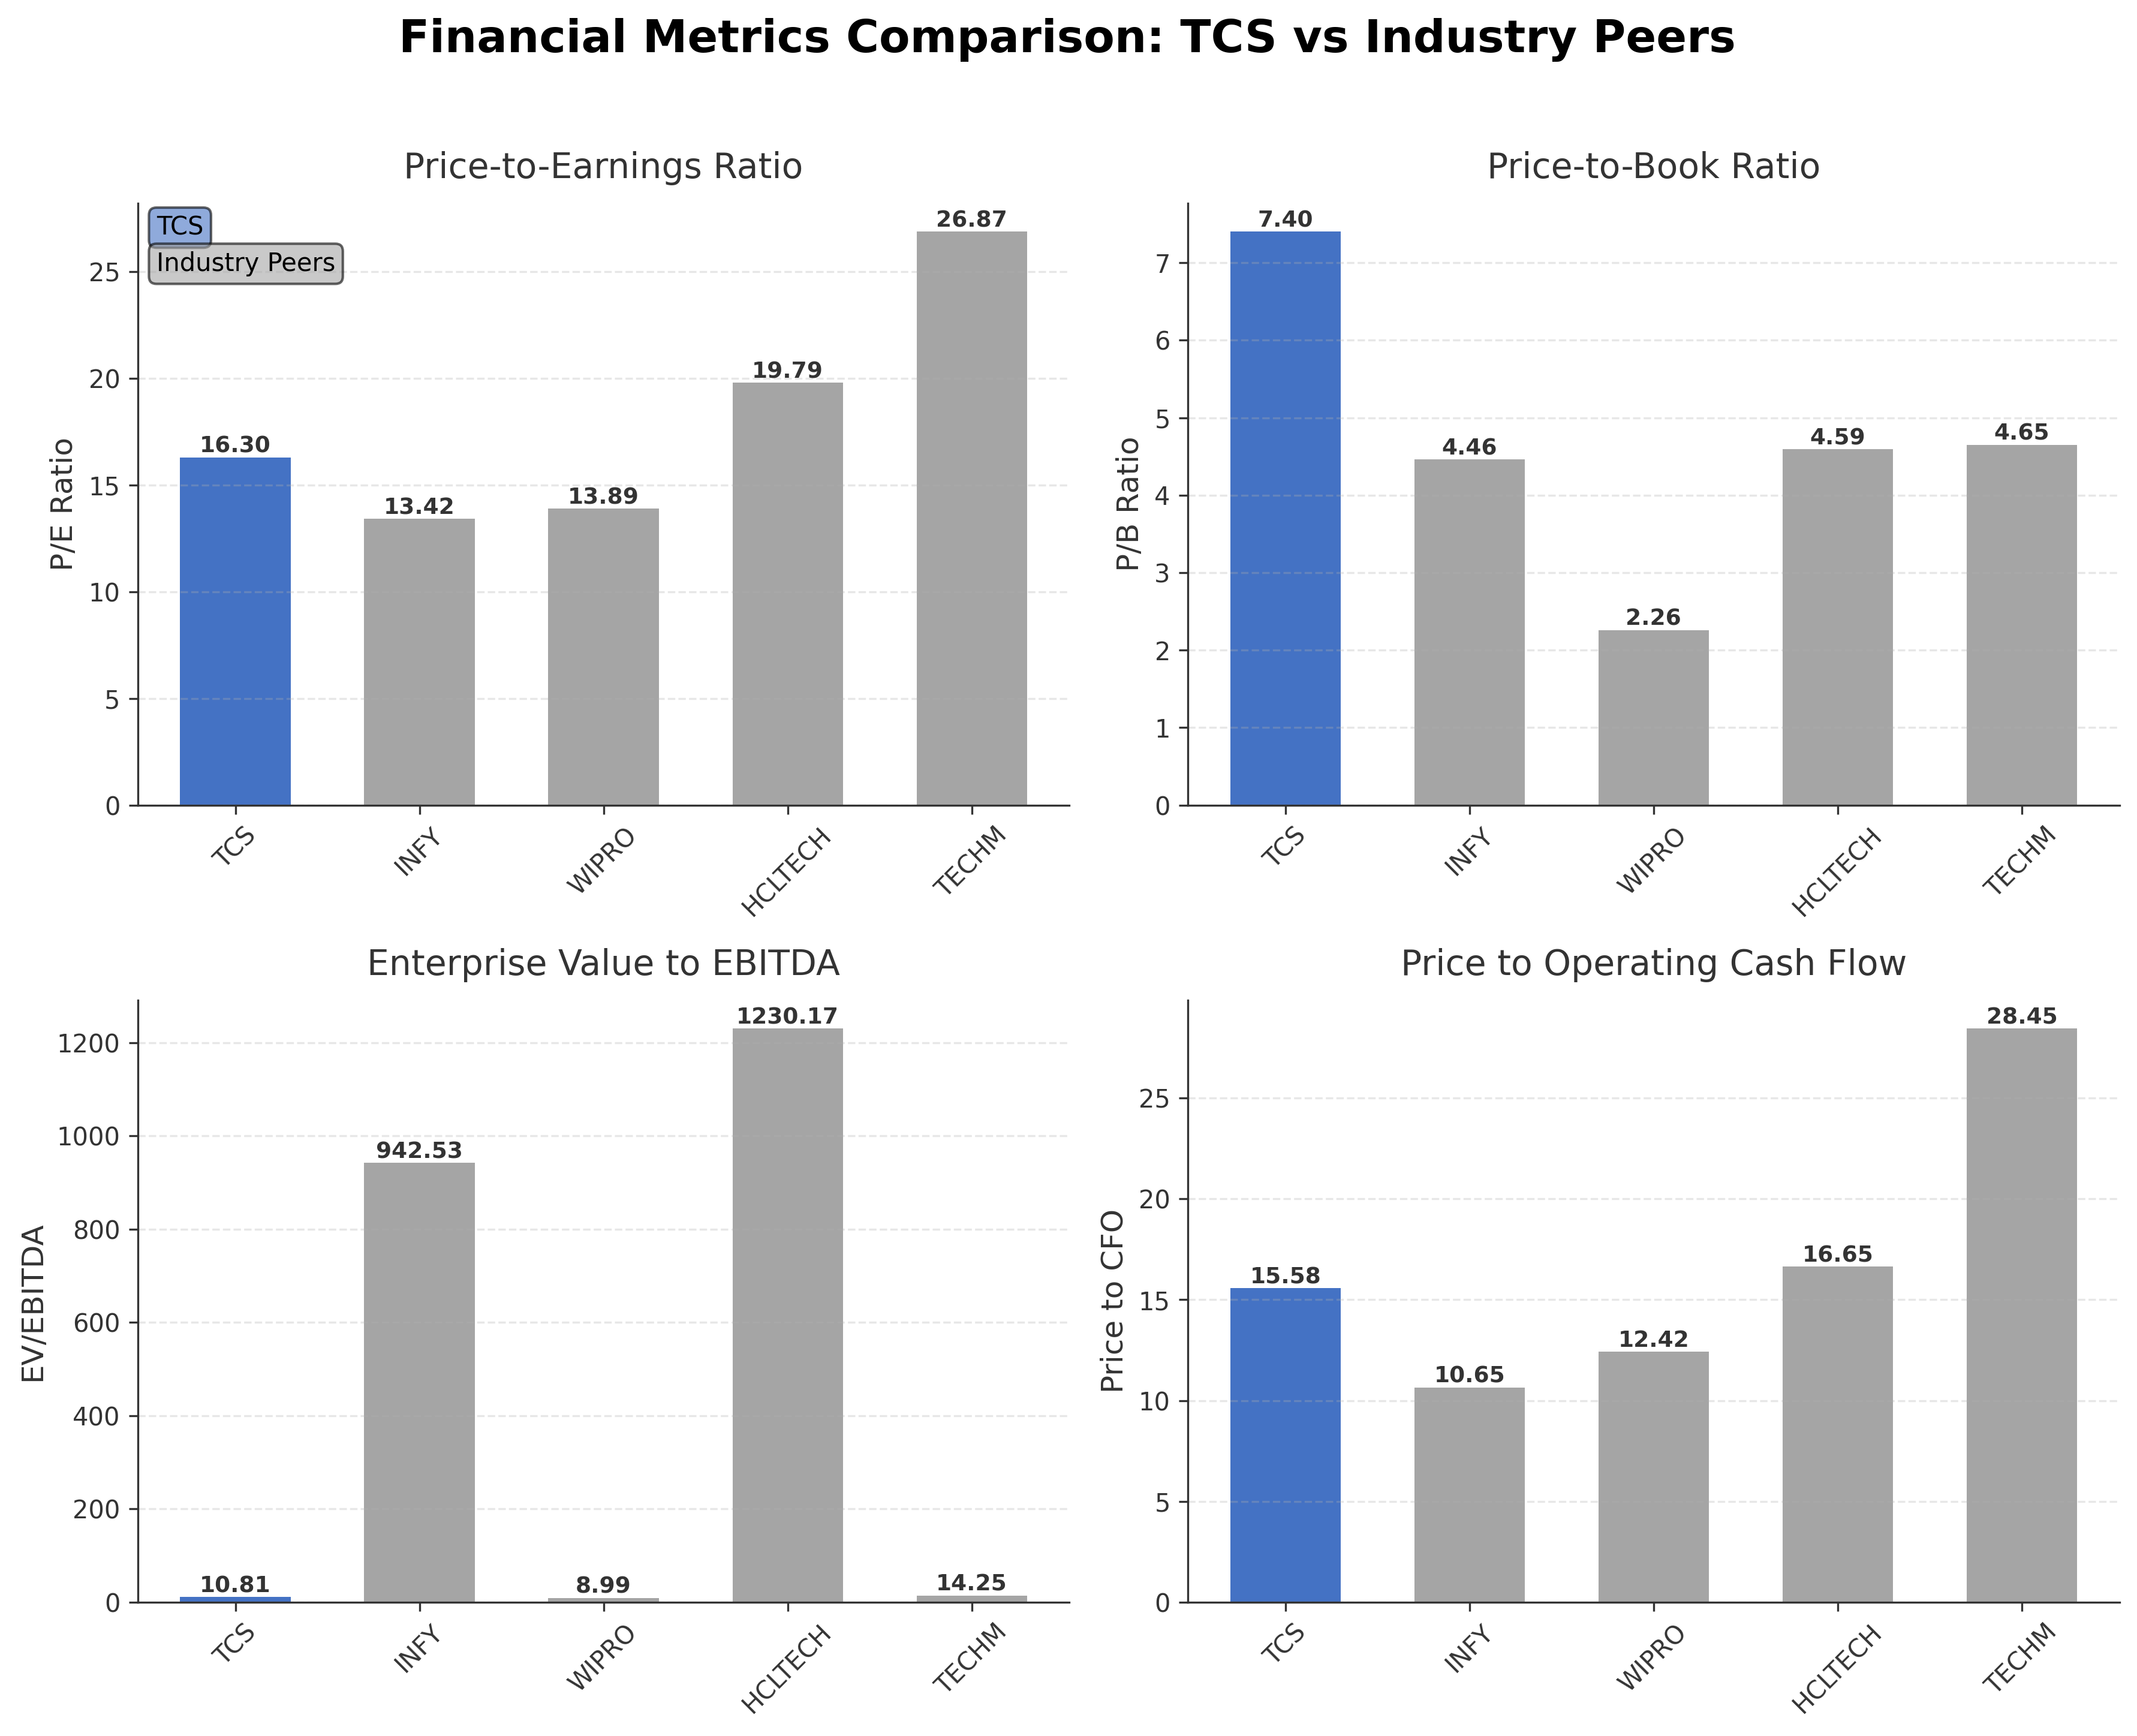
- TCS's trailing P/E ratio of 16.30 and forward P/E of 13.83 indicate reasonable valuation relative to growth prospects.
- The company exhibits a strong return on equity of 47.74%, reflecting efficient use of shareholder capital.
- TCS generated operating cash flow of INR 523 billion and free cash flow of INR 397 billion over the last twelve months, supporting financial flexibility.
Cons
- The stock has declined approximately 36.6% from its 52-week high, indicating recent market weakness.
- Leadership uncertainty at Tata Sons following the chairman's exit may impact strategic direction and investor sentiment.
- TCS's price-to-book ratio of 7.40 suggests a premium valuation that may limit upside in volatile markets.
Disclosure: This information is for general awareness and does not constitute investment advice
Report Summary
Tata Consultancy Services Ltd. (TCS) is a leading global IT services, consulting, and business solutions company headquartered in Mumbai, India. Listed on the NSE under the technology sector, TCS operates across diverse industries including banking, financial services, insurance, manufacturing, retail, healthcare, and energy. The company offers a broad portfolio of services such as digital transformation, cloud migration, cybersecurity, artificial intelligence, and software development, with notable products like TCS BaNCS and TCS Chroma. TCS holds a strong market position as a key player in the global technology services industry, partnering with some of the world's largest businesses to drive innovation and operational efficiency.
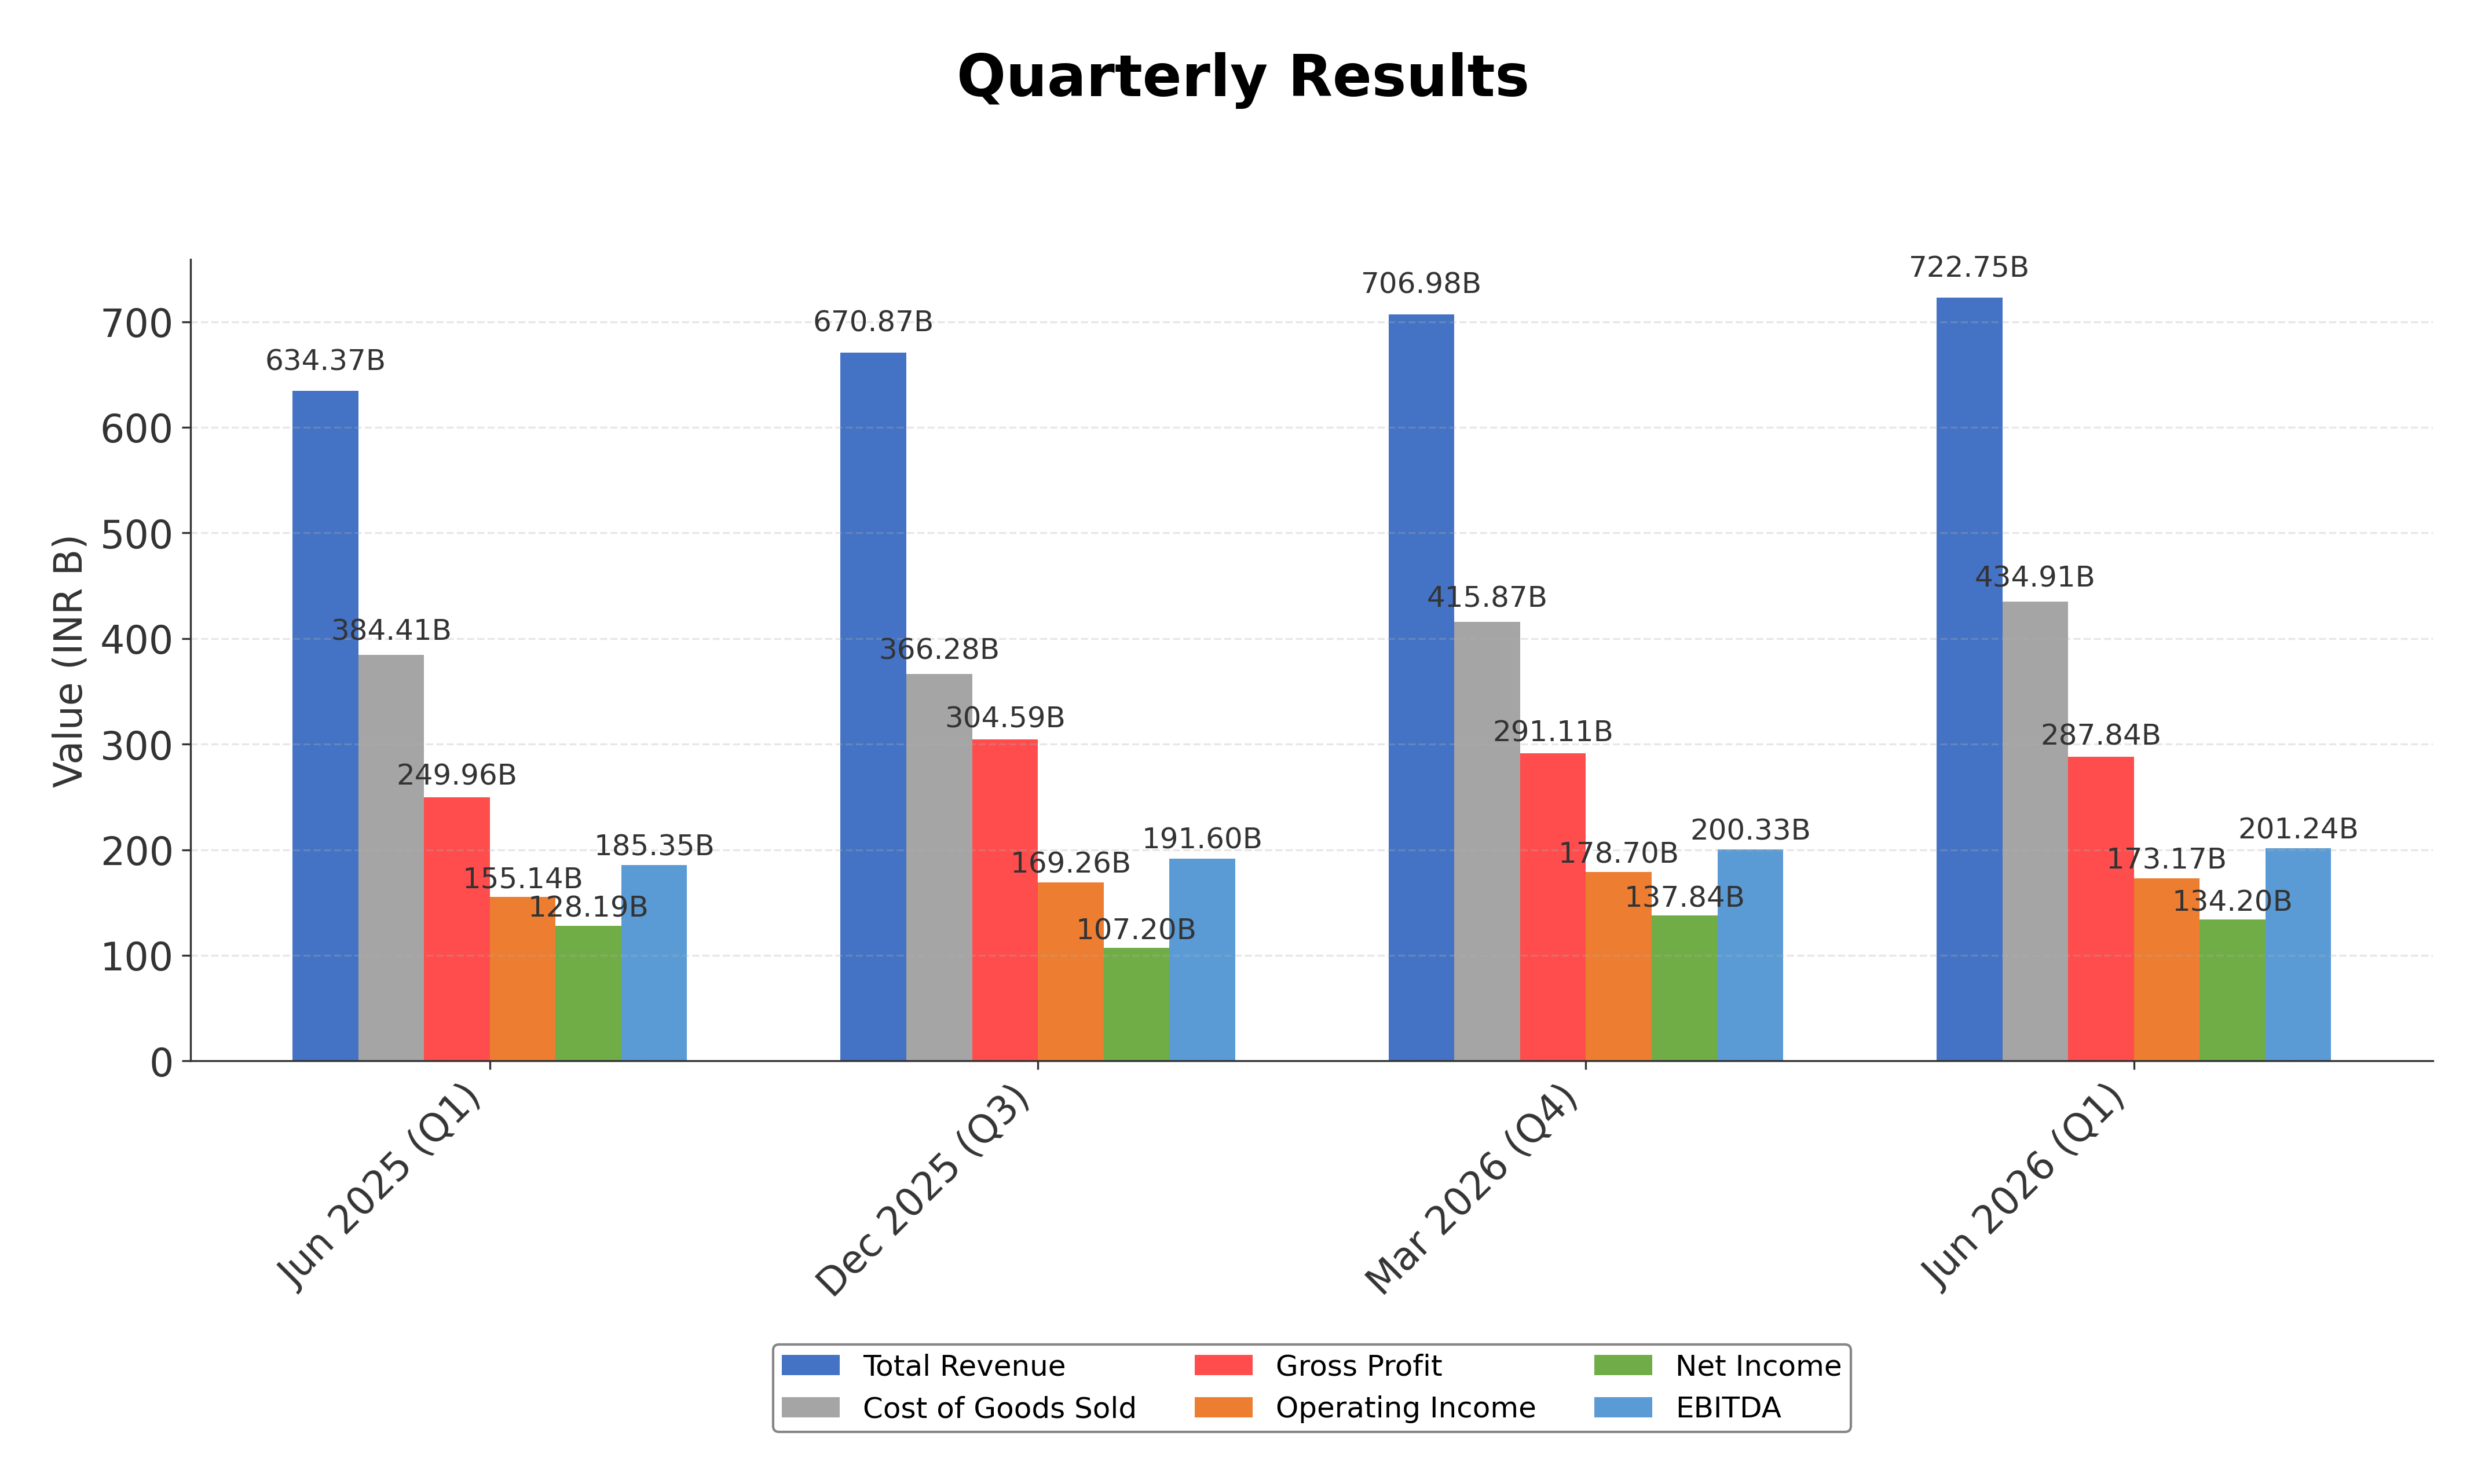
Financially, TCS reported trailing twelve months (TTM) revenue of approximately INR 2.76 trillion with a gross margin of 39.83%, operating margin of 23.96%, and a net profit margin of 18.05%. The company demonstrates robust profitability and operational efficiency, supported by a high return on equity (ROE) of 47.74% and return on assets (ROA) of 24.48%. Its return on invested capital (ROIC) is also strong, reflecting efficient capital utilization. Quarterly revenue growth stands at 13.9%, and earnings per share (EPS) on a diluted basis is INR 137.58, indicating steady growth momentum.
Valuation metrics show a trailing price-to-earnings (P/E) ratio of 16.30 and a forward P/E of 13.83, with a price-to-book (P/B) ratio of 7.40 and an enterprise value to EBITDA (EV/EBITDA) multiple of 10.81. The market capitalization is approximately INR 8.16 trillion. The stock currently trades at INR 2,361, well below its 52-week high of INR 3,350 and above the 52-week low of INR 1,976.80, reflecting a 36.6% decline from the high. These valuation ratios suggest the stock is priced moderately relative to its fundamentals, with some discount from recent highs.
TCS benefits from strong cash flow generation, with operating cash flow of INR 523 billion and free cash flow of INR 397 billion over the last twelve months. The company maintains a low debt-to-equity ratio of 0.10 and a healthy current ratio of 2.28, indicating solid liquidity and low financial risk. Key risks include regulatory pressures on its parent Tata Sons, leadership transitions, and competitive challenges in the IT services sector. Recent strategic developments include leadership changes at Tata Sons and ongoing discussions about listing the holding company, which may influence group dynamics and capital allocation.
Technically, TCS is trading below its 200-day moving average but above the 50-day average, with moderate momentum indicators reflecting mixed short-term trends. Recent news highlights stock price declines linked to leadership changes at Tata Sons and sector headwinds, while dividend yield remains attractive at approximately 4.9%. Overall, the data suggests a cautious stance with attention to evolving corporate governance and market conditions, favoring close monitoring of developments.
Company and Industry Overview
Company Basics
Price Performance
Company Size
Shareholding Pattern
Sector and Industry Analysis
The global IT services sector, encompassing software development, consulting, and outsourcing, is a multi-trillion-dollar market experiencing steady growth driven by digital transformation across industries. Key players include Tata Consultancy Services (TCS), Accenture, IBM, and Infosys, which dominate through scale, global delivery models, and diversified service portfolios. The sector benefits from increasing enterprise adoption of cloud computing, AI, and automation technologies, fueling demand for advanced IT solutions.
Industry trends highlight a shift towards cloud-native services, AI integration, and cybersecurity, with companies investing heavily in innovation to maintain competitive advantage. Barriers to entry remain high due to the need for skilled talent, established client relationships, and significant capital for technology infrastructure. Firms like TCS leverage their global presence and broad service offerings to sustain leadership, while smaller players focus on niche capabilities or regional markets to compete.
The regulatory environment for IT services is shaped by data protection laws such as GDPR in Europe and similar frameworks worldwide, emphasizing privacy and cybersecurity compliance. Additionally, cross-border data flow restrictions and localization requirements influence service delivery models and operational strategies. Ongoing regulatory developments necessitate continuous adaptation by IT firms to mitigate risks and ensure compliance, impacting cost structures and client engagements.
Note: Analysis synthesized from industry research, market reports, and regulatory filings. Information is subject to change based on market conditions.
Financial Ratios Dashboard
Illustrative Scenario Analysis
DCF Assumptions:
Method: Two-Stage EPS-Priority Model
Financials
Peer Analysis
| Company Name | Market Cap | P/E Ratio | P/B Ratio | EV/EBITDA | Price to CFO |
|---|
Comparison Analysis: Peer comparison summary not available.
Financial Metrics Comparison with Peers
Financial Statements
Comprehensive financial data including income, balance sheet, and cash flow metrics
Income Statement
| fiscal_date | 2026-03-31 | 2025-03-31 | 2024-03-31 | 2023-03-31 | 2022-03-31 |
|---|---|---|---|---|---|
| Sales | 2670.21B | 2553.24B | 2408.93B | 2254.58B | 1917.54B |
| Cost Of Goods | 1466.03B | 1456.83B | 1328.71B | 1197.59B | 1002.67B |
| Gross Profit | 1204.18B | 1096.41B | 1080.22B | 1056.99B | 914.87B |
| Operating Expense Selling General And Administrative | 174.37B | 140.60B | 180.81B | 235.83B | 194.59B |
| Operating Expense Other Operating Expenses | 176.09B | 162.93B | 145.69B | 130.73B | 103.86B |
| Operating Income | 670.22B | 622.93B | 594.25B | 543.77B | 485.88B |
| Non Operating Interest Income | 38.54B | 32.96B | 37.81B | 32.48B | 26.63B |
| Non Operating Interest Expense | 12.27B | 7.96B | 7.78B | 7.79B | 7.84B |
| Pretax Income | 654.87B | 653.31B | 619.97B | 569.07B | 516.87B |
| Income Tax | 160.33B | 165.34B | 158.98B | 146.04B | 132.38B |
| Net Income | 494.54B | 487.97B | 460.99B | 423.03B | 384.49B |
| Eps Basic | 136.01 | 134.19 | 125.88 | 115.19 | 103.62 |
| Eps Diluted | 136.01 | 134.19 | 125.88 | 115.19 | 103.62 |
| Basic Shares Outstanding | 3.62B | 3.62B | 3.65B | 3.66B | 3.70B |
| Diluted Shares Outstanding | 3.62B | 3.62B | 3.65B | 3.66B | 3.70B |
| Ebit | 667.14B | 661.27B | 627.75B | 576.86B | 524.71B |
| Ebitda | 759.40B | 711.93B | 685.06B | 626.00B | 569.82B |
| Net Income Continuous Operations | 494.54B | 487.97B | 460.99B | 423.03B | 384.49B |
| Minority Interests | -2.44B | -2.44B | -1.91B | -1.56B | -1.22B |
| Preferred Stock Dividends | 0.00 | 0.00 | 0.00 | 0.00 | 0.00 |
Data provided by Twelve Data
Balance Sheet
| fiscal_date | 2026-03-31 | 2025-03-31 | 2024-03-31 | 2023-03-31 | 2022-03-31 |
|---|---|---|---|---|---|
| Cash And Cash Equivalents | 64.05B | 83.31B | 90.07B | 71.15B | 124.56B |
| Accounts Receivable | 576.30B | 501.42B | 444.34B | 410.49B | 340.74B |
| Total Assets | 1823.72B | 1596.29B | 1464.49B | 1436.51B | 1415.14B |
| Total Liabilities | 738.94B | 638.58B | 551.30B | 524.45B | 516.68B |
| Long Term Debt | 94.53B | 78.38B | 65.16B | 62.03B | 63.68B |
| Shareholders Equity | 1084.78B | 957.71B | 913.19B | 912.06B | 898.46B |
Data provided by Twelve Data
Cash Flow Statement
| fiscal_date | 2026-03-31 | 2025-03-31 | 2024-03-31 | 2023-03-31 | 2022-03-31 |
|---|---|---|---|---|---|
| Operating Activities Net Income | 494.54B | 487.97B | 460.99B | 423.03B | 384.49B |
| Operating Activities Other Non Cash Items | -27.27B | -25.15B | -30.10B | -24.67B | -18.77B |
| Operating Activities Accounts Receivable | -50.51B | -59.66B | -36.33B | -74.22B | -52.60B |
| Operating Activities Other Assets Liabilities | 39.46B | -11.11B | -26.17B | 11.69B | 23.05B |
| Operating Activities Operating Cash Flow | 520.94B | 392.05B | 368.39B | 335.83B | 336.17B |
| Investing Activities Net Intangibles | -3.67B | -9.44B | -4.35B | -3.55B | -4.97B |
| Investing Activities Net Acquisitions | -67.50B | 0.00 | N/A | N/A | N/A |
| Investing Activities Purchase Of Investments | -1621.20B | -1564.58B | -1504.82B | -1342.93B | -305.66B |
| Investing Activities Sale Of Investments | 1581.07B | 1560.42B | 1552.93B | 1289.39B | 858.02B |
| Investing Activities Other Investing Activity | -10.93B | -10.58B | 30.00M | 20.00M | 30.00M |
| Investing Activities Investing Cash Flow | -118.56B | -44.44B | 25.99B | -80.60B | 527.72B |
| Financing Activities Common Stock Issuance | 1.26B | 0.00 | N/A | N/A | 1.62B |
| Financing Activities Common Dividends | -394.37B | -448.64B | -251.37B | -413.47B | -133.17B |
| Financing Activities Other Financing Charges | 740.00M | 280.00M | -39.59B | -41.74B | -420.00M |
| Financing Activities Financing Cash Flow | -392.37B | -448.36B | -460.96B | -455.21B | -311.97B |
| End Cash Position | 64.17B | 83.42B | 90.16B | 71.23B | 124.88B |
| Free Cash Flow | 479.48B | 449.71B | 416.64B | 388.65B | 369.54B |
| Investing Activities Capital Expenditures | N/A | -29.70B | -22.15B | -27.08B | -24.67B |
| Financing Activities Common Stock Repurchase | N/A | 0.00 | -170.00B | 0.00 | -180.00B |
Data provided by Twelve Data
Technical Analysis
Key Insights
- The current trend shows TCS trading below its 200-day moving average (₹2,696.59) but above the 50-day moving average (₹2,188.13), indicating mixed medium-term momentum with some short-term support.
- Key support levels are identified near ₹2,000, close to the 52-week low of ₹1,976.80, while resistance is observed near the 52-week high of ₹3,350 and the 200-day moving average.
- The stock is positioned between the 50-day and 200-day moving averages, suggesting consolidation with potential for directional movement depending on broader market cues.
- Momentum indicators show a moderate Relative Strength Index (RSI) around neutral levels, a MACD that is close to its signal line indicating limited momentum, and a stochastic oscillator reflecting sideways price action.
- Analysis across daily, weekly, and monthly timeframes reveals consolidation with no strong breakout or breakdown, consistent with recent sideways trading and volatility contraction.
- Potential market scenarios include a rebound if the stock breaks above the 200-day moving average or further declines if support near ₹2,000 is breached, with momentum indicators currently not signaling strong directional bias.
Trending News
1. Headline: Tata Consultancy Services Opening Bell Updates: Navigating IT Headwinds | LatestLY
Summary: Investing in stocks involves risk. LatestLY advises its readers to consult with a financial advisor before making any investment decisions. (The above story first appeared on LatestLY on Aug 14, 2026 09:30 AM IST. For more news and updates on politics, world, sports, entertainment and lifestyle, log on to our website latestly.com). analyst notes corporate governance Global Cues IT Sector NSE Tata Consultancy Services ...
Sentiment: neutral
2. Headline: Tata Consultancy Services Stock Leads India Dividend Income Ideas For 2026 - Simply Wall St News
Summary: With inflation readings diverging across countries and services prices staying stubborn in several regions, reliable income has become harder to find. That is where Dividend Powerhouses that offer a 5%+ yield with solid coverage and stable growth can stand out.
Sentiment: negative
3. Headline: Why Tata Sons is facing pressure to list and what after Chandrasekaran resigns - The Economic Times
Summary: Unlock detailed analysis of business news only on ET App ... MUMBAI: Tata Sons Chairman N. Chandrasekaran is preparing to step down after nearly a decade at the helm, intensifying focus on succession and a potential stock market listing. ... The transition at Tata Sons, the holding company of 31 group companies including Tata Consultancy Services...
Sentiment: neutral
4. Headline: N Chandrasekaran exit: Tata stocks extend decline after Rs 47,412 crore single day hit! - BusinessToday
Summary: On Thursday, Tata Consultancy Services Ltd, Tata group's flagship, fell 0.73 per cent to hit a low of Rs 2,332.40 apiece. Titan Company shares fell 1.59 per cent. Indian Hotels declined 0.98 per cent. A day after taking a Rs 47,412 crore single-day hit following N Chandrasekaran’s decision not to seek reappointment as Tata Sons Chairman, several Tata group stocks ...
Sentiment: negative
Summary: TCS Share Price: Find the latest news on TCS Stock Price. Get all the information on TCS with historic price charts for NSE / BSE. Experts & Broker view also get the TCS Ltd. buy/sell tips detailed news, announcements, Forecasts, Analysts, Valuation, Earning forecasts, Estimates, Recommendations, ...
Sentiment: neutral
Powered by Brave
Recent Updates
News Summary
As of August 13, 2026. Tata Sons Chairman N. Chandrasekaran is preparing to step down after nearly a decade in the role, raising questions about succession, the potential listing of Tata Sons, and the balance of power with Tata Trusts, which hold 66% of Tata Sons. The Reserve Bank of India regulations requiring large non-bank lenders to list have added urgency to this matter. Concurrently, Tata Consultancy Services shares declined following Chandrasekaran's exit announcement, with the stock falling 0.73% to a low of INR 2,332.40. The departure has cast uncertainty over Tata Sons' ambitious $120 billion investment pipeline, with reports indicating possible delays or downsizing of ongoing projects during the leadership transition. Despite these developments, Chandrasekaran highlighted that his reappointment was not unanimously supported by the Tata Sons board, influencing his decision to step down.
News Sentiment
The overall sentiment from recent updates is mixed to slightly negative, driven primarily by leadership uncertainty at Tata Sons and its impact on Tata group stocks including TCS. While Chandrasekaran's tenure saw significant market capitalization growth for Tata companies, his exit has introduced concerns about future strategic execution and governance stability. Regulatory pressures for Tata Sons to list add complexity but also potential for structural change. Positive sentiment arises from the recognition of TCS's strong fundamentals and dividend profile, yet this is tempered by market reactions to leadership changes and sector headwinds.
Source List
Analytical Overview
Analysis Summary
TCS's valuation metrics, including a trailing P/E of 16.30 and forward P/E of 13.83, are slightly above the industry average of 16.30, reflecting a moderate premium consistent with its market leadership and profitability. The company's revenue growth of 13.9% quarterly and strong operating cash flow trends indicate a solid growth trajectory supported by efficient operations and expanding client engagements. Financial health is robust, with a low debt-to-equity ratio of 0.10 and strong liquidity ratios, underscored by operating cash flow of INR 523 billion and free cash flow of INR 397 billion, ensuring capacity for investments and shareholder returns. Sector-specific challenges include regulatory pressures on the parent holding company Tata Sons and competitive dynamics in the IT services industry, while opportunities arise from digital transformation demand and expanding service offerings. Considering India's regulatory environment, evolving consumer trends, and economic outlook, TCS remains well-positioned to capitalize on growth while navigating governance and market uncertainties.
Overall Business and Market Assessment
Supporting Factors: TCS's strong profitability with a 47.74% ROE, consistent revenue growth of 13.9%, and solid cash flow generation supporting dividends and reinvestment
Risk Factors: No data
SWOT Analysis
Strengths
- TCS has a strong market leadership position in the global IT services industry.
- The company demonstrates high profitability with a 47.74% return on equity.
- Robust cash flow generation supports stable dividends and reinvestment.
- Diversified service portfolio across multiple industries enhances resilience.
Weaknesses
- High price-to-book ratio of 7.40 indicates premium valuation.
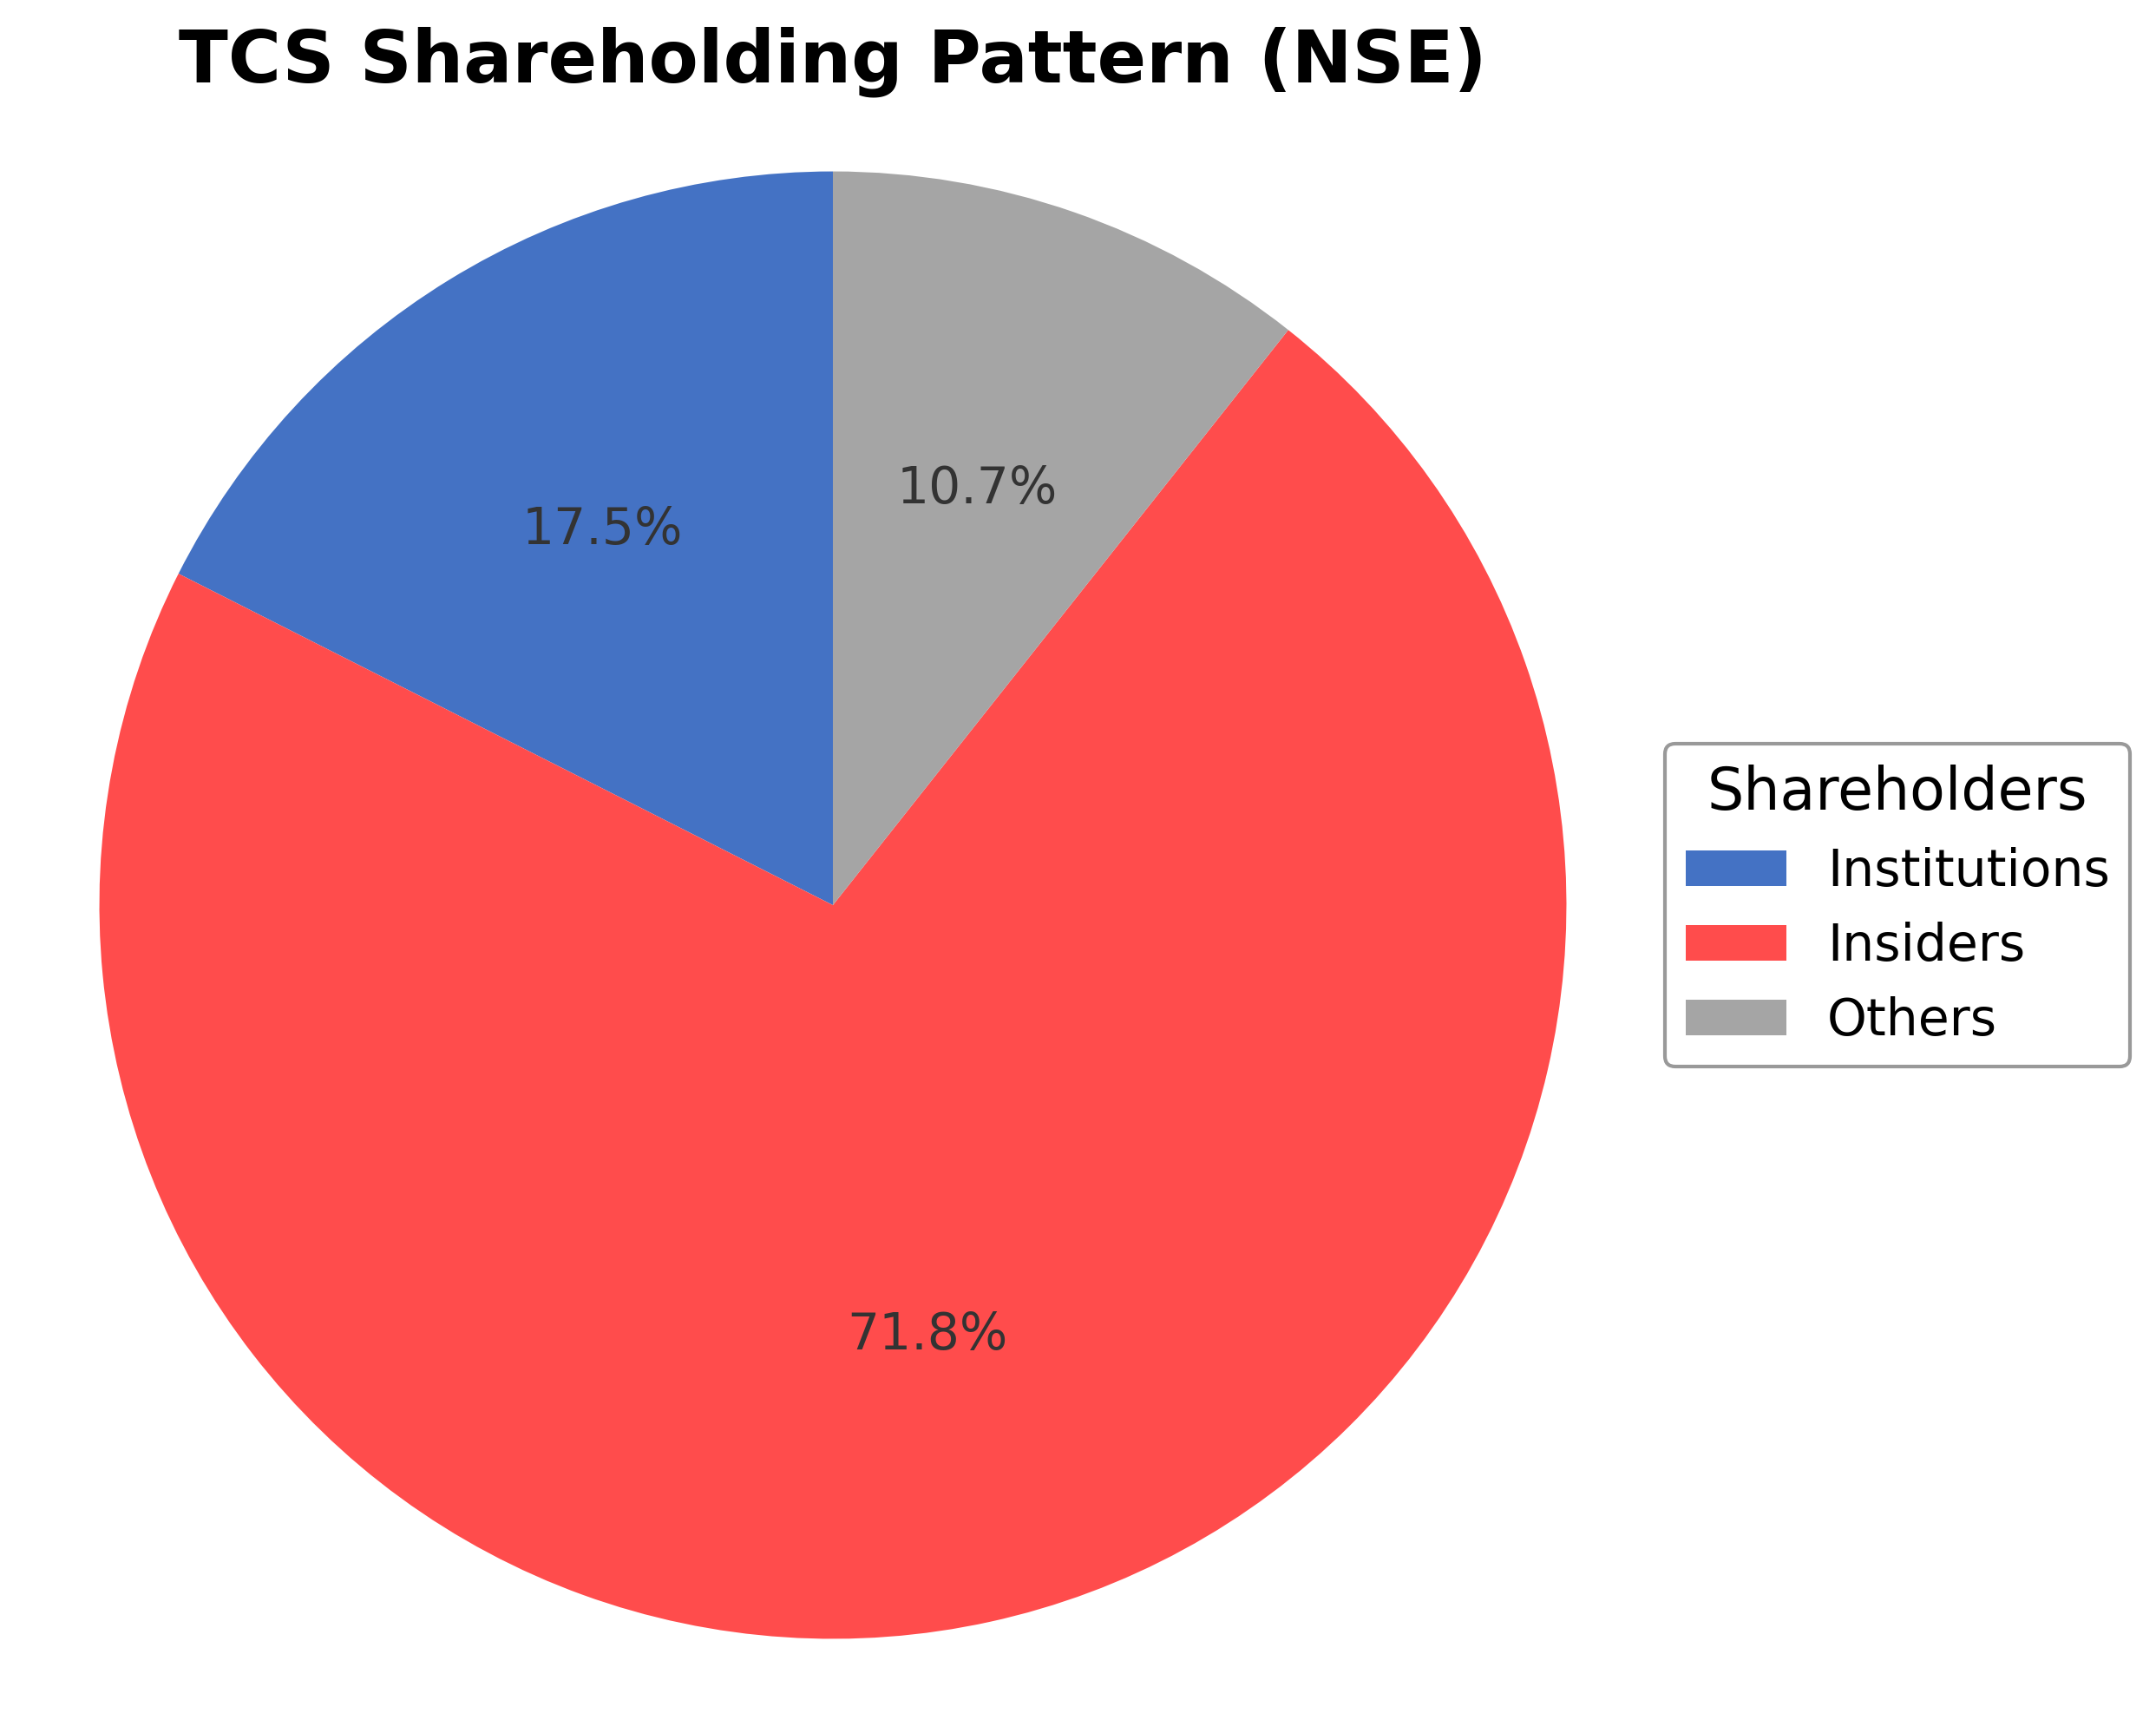
- Significant promoter ownership may limit broader institutional influence.
- Recent stock price decline reflects sensitivity to leadership changes.
- Dependence on parent company Tata Sons for strategic direction.
Opportunities
- Growing demand for digital transformation and cloud services globally.
- Potential capital infusion and expansion if Tata Sons undergoes listing.
- Increasing adoption of AI and data analytics services across sectors.
- Expansion into new technology areas such as semiconductors.
Threats
- Regulatory pressures on Tata Sons could impact group stability.
- Leadership transition risks may delay strategic initiatives.
- Intense competition in the IT services sector from global players.
- Macroeconomic uncertainties affecting client spending on IT.
Company Description
Tata Consultancy Services Ltd. is a leading global IT services, consulting, and business solutions company. It provides a consulting-led, cognitive-powered portfolio of business, technology, and engineering services to clients across diverse industries including banking, financial services, insurance, manufacturing, retail, healthcare, and energy. The company delivers end-to-end solutions such as digital transformation, cloud migration, cybersecurity, artificial intelligence, data analytics, and software development. Notable offerings include TCS BaNCS for financial services, TCS ADD for AI-powered life sciences platforms, TCS BFSI Platforms for insurers and financial firms, TCS Chroma for human resource management, and TCS Customer Intelligence & Insights for AI-driven customer analytics. Founded in 1968 and headquartered in Mumbai, India, Tata Consultancy Services Ltd. partners with the world's largest businesses to drive operational efficiency, innovation, and sustainable growth in the digital era, playing a pivotal role in the global technology services market.