


Tata Capital Limited (TATACAP)
Stock Analysis Report
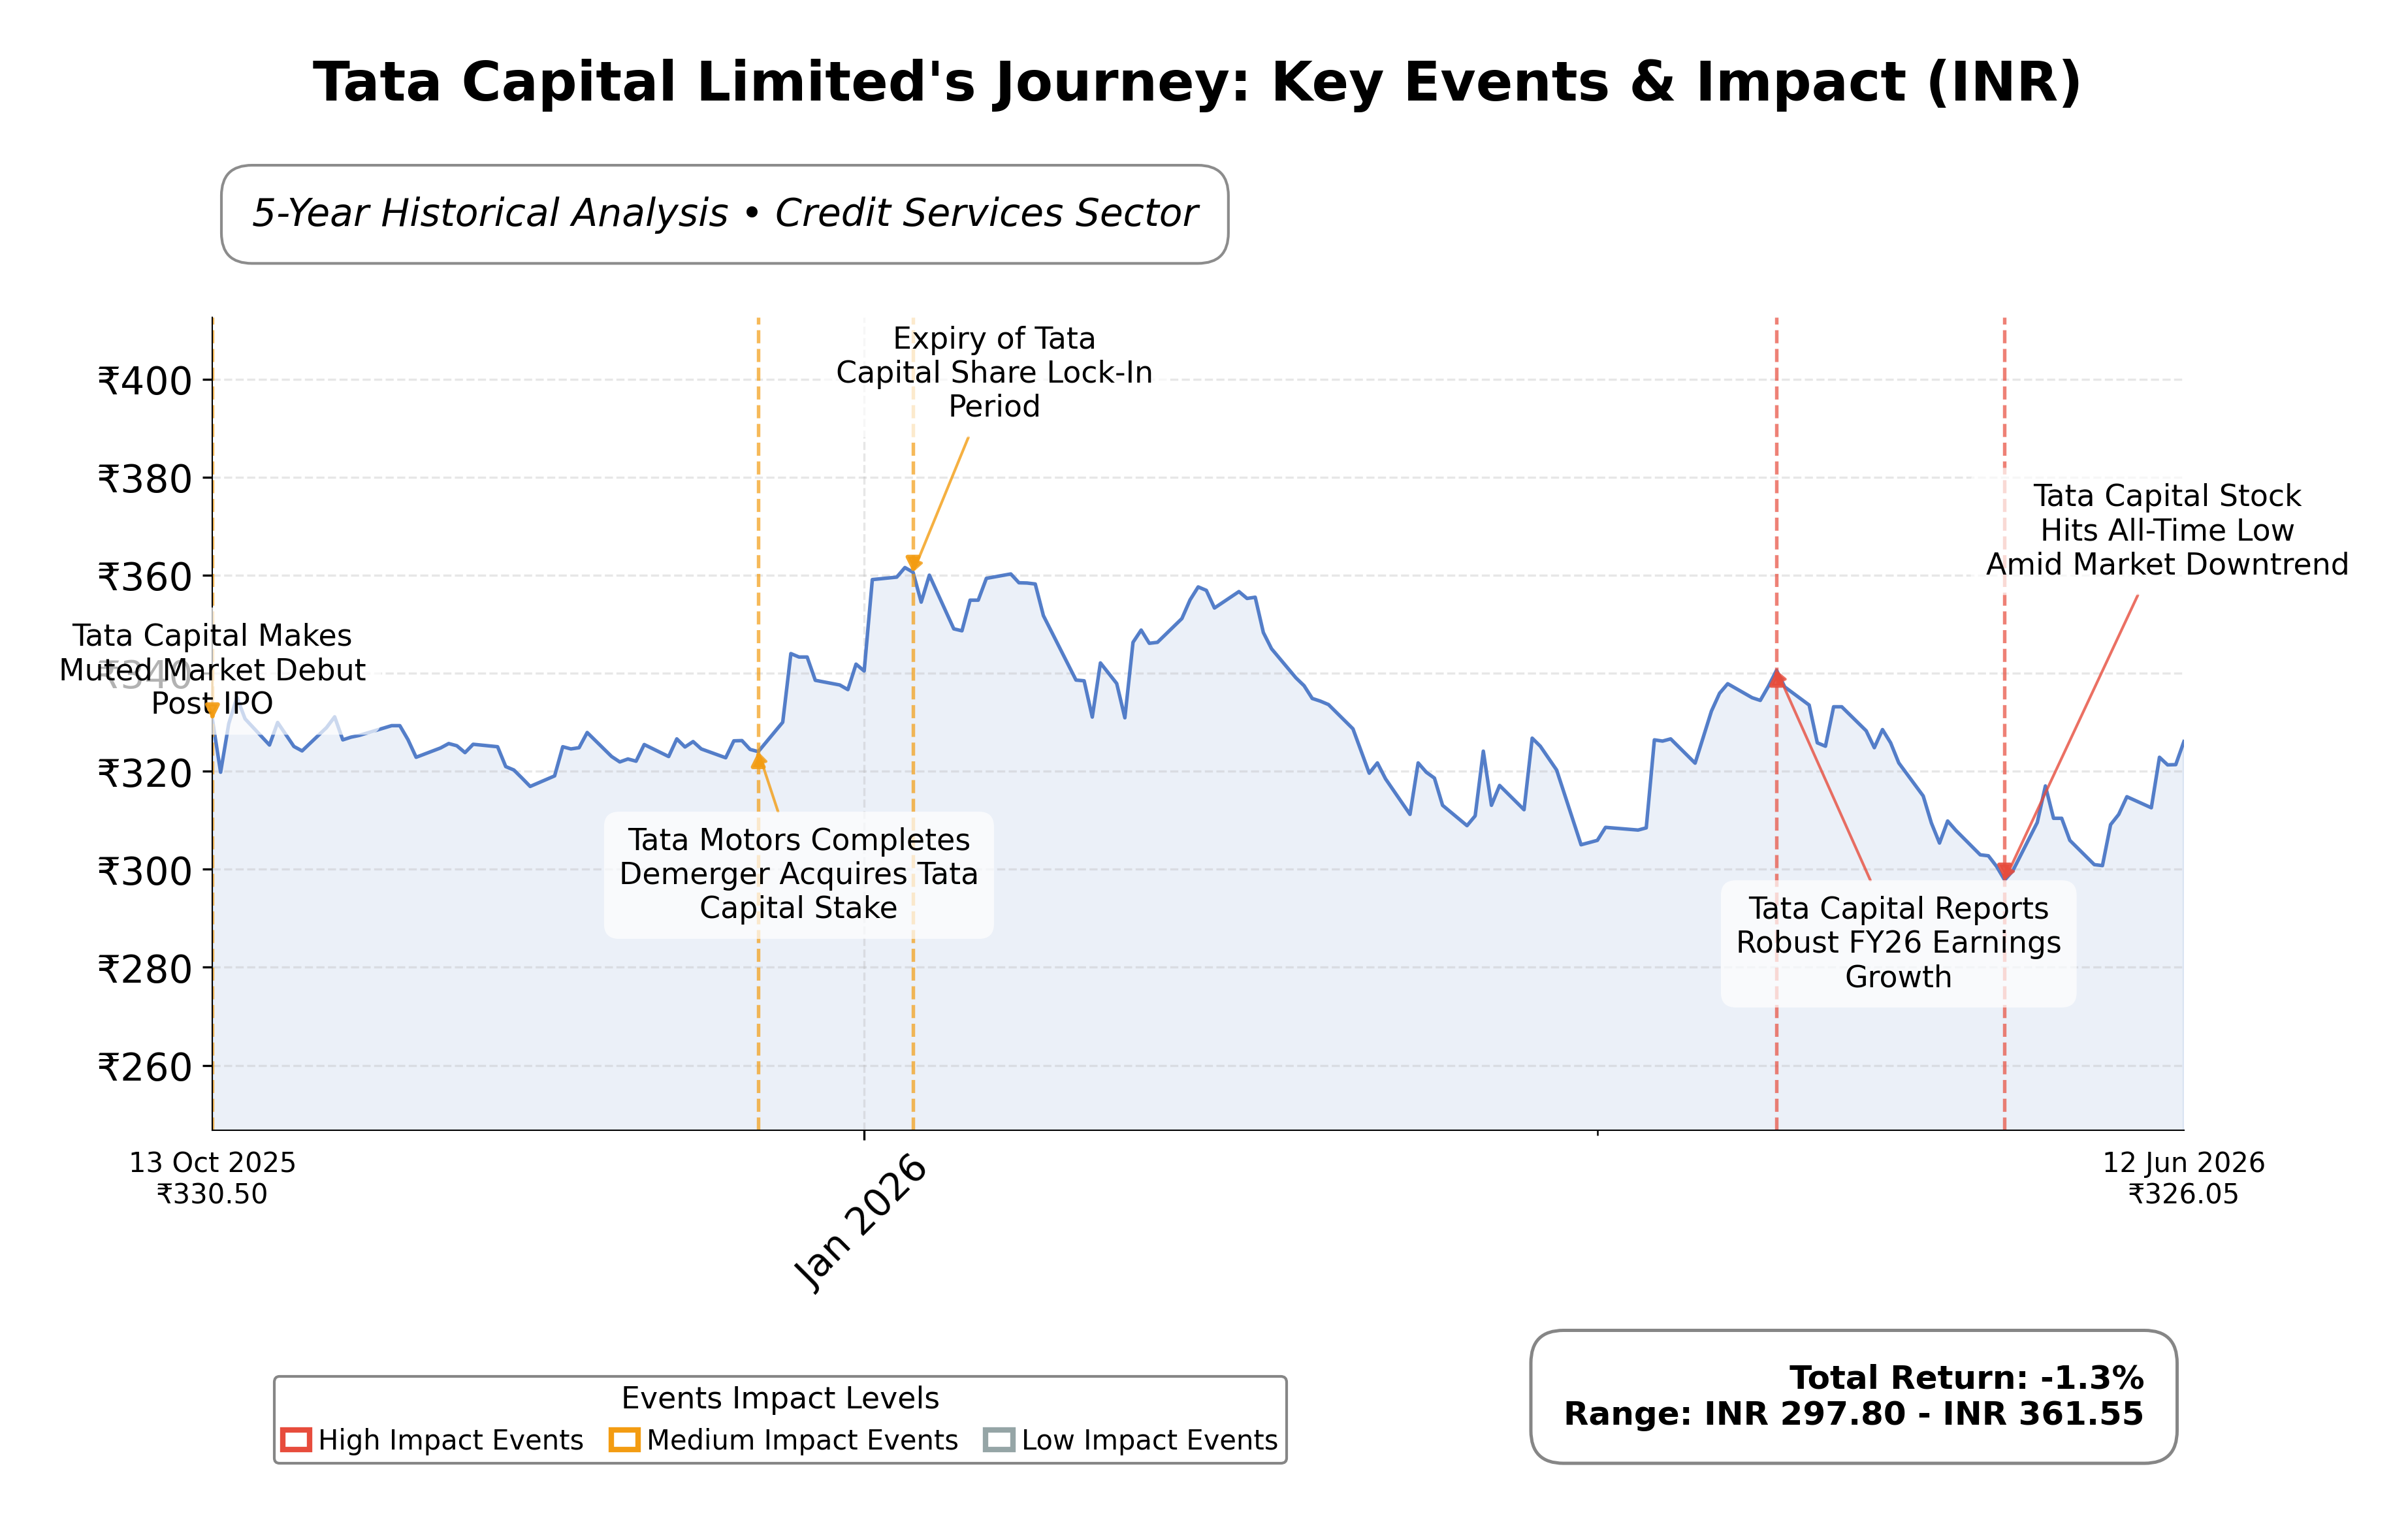
Stock Journey
Key Positives and Key Risks
Pros
- Strong profitability with a net profit margin of 39.0% and operating margin of 55.5%, indicating efficient operations.
- Robust asset growth with consolidated AUM increasing 20% year-on-year to ₹2.77 lakh crore, supporting revenue expansion.
- Reasonable valuation with a forward P/E of 15.6 and PEG ratio of 0.70, reflecting growth expectations priced in.
Cons
- High leverage with a debt-to-equity ratio exceeding 500%, posing financial risk and potential liquidity concerns.
- Negative operating cash flow of ₹-379.6 billion TTM, which may impact operational flexibility.
- Elevated enterprise value to EBITDA multiple of 60.9, suggesting the stock is expensive relative to earnings.
Disclosure: This information is for general awareness and does not constitute investment advice
Report Summary
Tata Capital Limited operates as a diversified non-banking financial company (NBFC) within the Tata Group, serving India’s financial services sector. Listed on the NSE under the symbol TATACAP, it provides a broad range of credit services including retail, SME, and corporate lending, along with insurance and wealth management products. The company also engages in cleantech and infrastructure financing through subsidiaries, positioning itself as a systemically important institution with a significant presence in India’s financial ecosystem.
Financially, Tata Capital reported trailing twelve months (TTM) revenue of approximately ₹125.3 billion with a gross margin of 41.1%, operating margin of 55.5%, and a net profit margin of 39.0%. Its return on equity (ROE) stands at 12.0%, and return on assets (ROA) at 1.8%, indicating moderate profitability and efficient asset utilization. The company’s operating cash flow is negative at ₹-379.6 billion TTM, but it generated positive levered free cash flow of ₹48.5 billion, reflecting complex cash dynamics typical of NBFCs.
Valuation metrics show a trailing P/E ratio of 27.7 and a forward P/E of 15.6, with a price-to-book ratio of 3.61 and an enterprise value to EBITDA multiple near 60.9, suggesting a premium valuation relative to earnings and book value. The market capitalization is approximately ₹1.37 trillion, with the stock trading near ₹339, within a 52-week range of ₹296 to ₹367.3. These figures imply the stock is priced toward the higher end of its recent trading band.
Key strengths include a robust asset base of ₹2.9 trillion, strong profitability margins, and a strategic merger with Tata Motors Finance that expanded its motor finance segment. The company maintains a very high current ratio of 105.7, indicating ample short-term liquidity, though it carries substantial debt with a debt-to-equity ratio exceeding 500%. Risks involve regulatory changes, competitive pressures in the NBFC sector, and the operational challenges of integrating diverse lending portfolios. Recent leadership changes include the appointment of a new Chief Risk Officer, and the company is actively pursuing digital transformation and multi-OEM diversification.
Technically, Tata Capital’s price is above its 50-day moving average but below the 200-day average, with momentum indicators showing mixed signals across daily and weekly timeframes. Recent news highlights a blend of positive developments such as bullish technical patterns and leadership appointments, alongside neutral and negative market sentiments. Overall, the data suggests a cautious stance with potential for selective accumulation depending on evolving fundamentals and market conditions.
Company and Industry Overview
Company Basics
Price Performance
Company Size
Shareholding Pattern
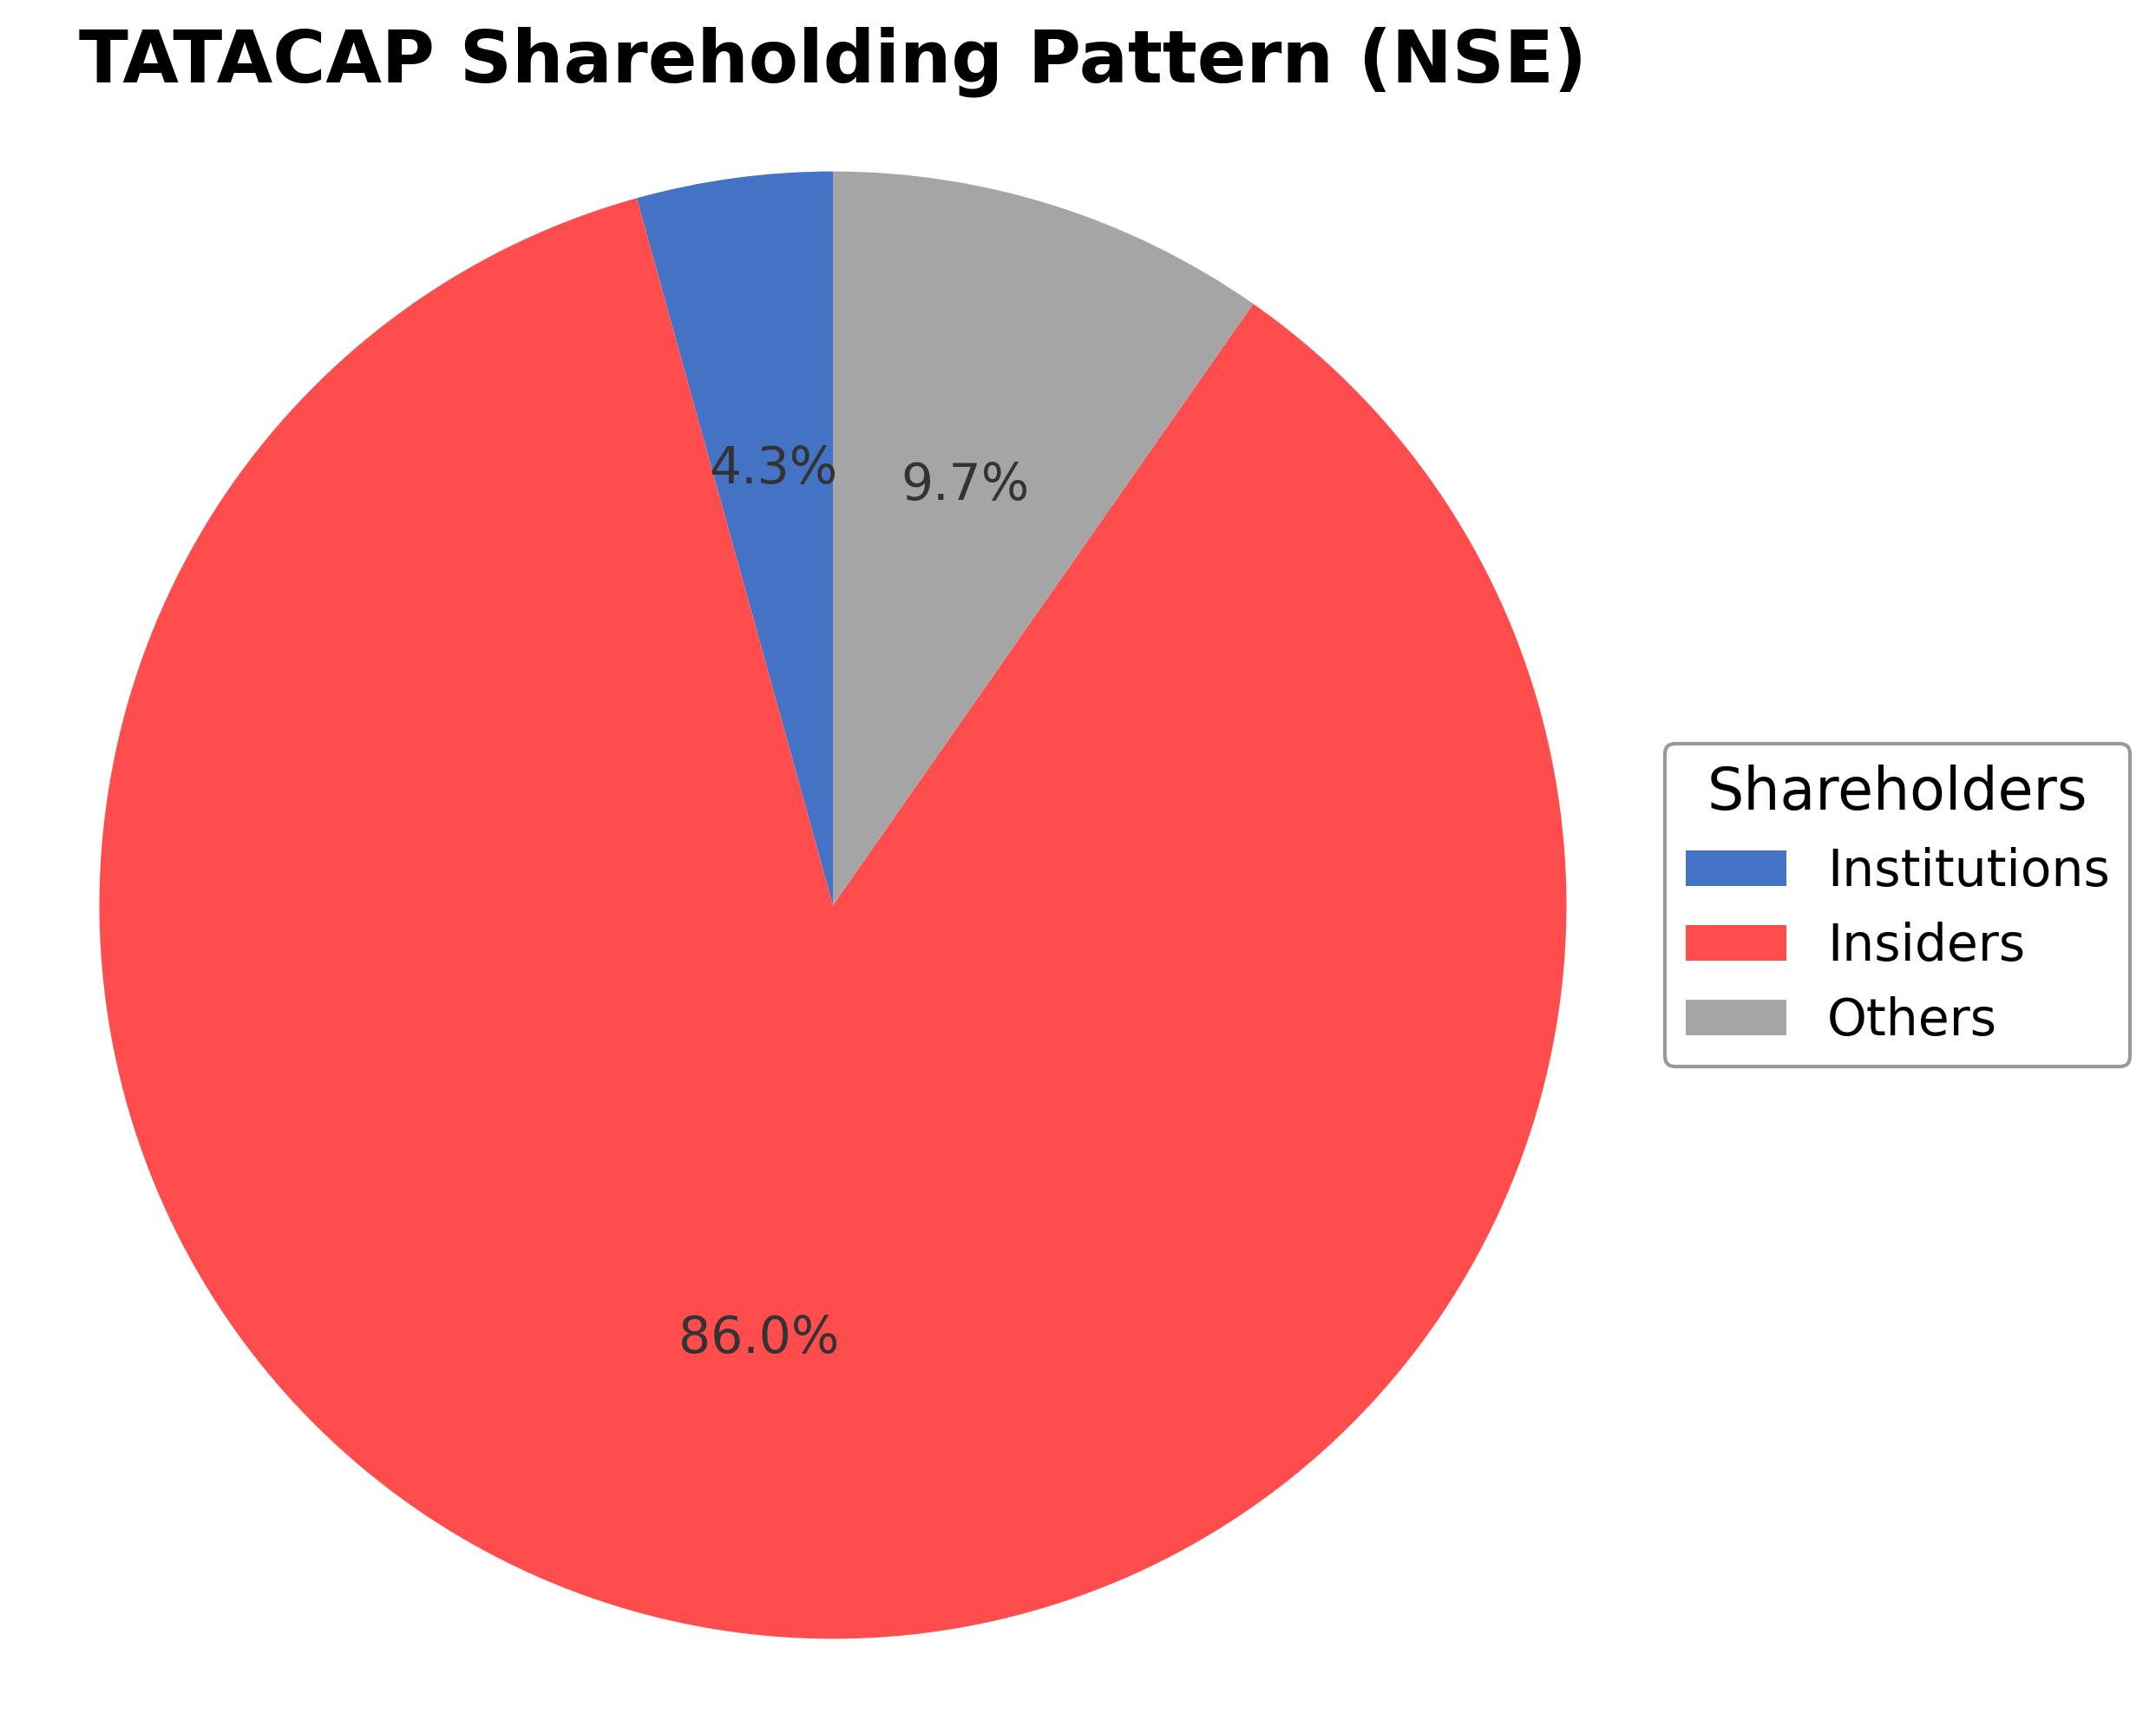
Tata Capital Limited's shareholding structure is characterized by a small promoter holding of approximately 0.86%, with institutional investors owning about 4.31%, and the vast majority of shares held by public and retail investors at roughly 94.83%. Over the past 12-24 months, institutional ownership has remained relatively stable with no significant accumulation or distribution trends reported. Major institutional shareholders include mutual funds and asset managers typical of the Indian financial sector. This ownership distribution reflects a broad market participation with limited insider concentration, which may influence corporate governance dynamics and strategic decision-making. The current pattern suggests a market perception of Tata Capital as a widely held financial services entity with governance aligned to public shareholder interests.
Sector and Industry Analysis
The Indian non-banking financial company (NBFC) sector, encompassing firms like Tata Capital Limited, represents a significant segment of the country's financial services market. With a market capitalization in the trillions of INR and a broad customer base, the sector has shown steady growth driven by rising consumer credit demand and expanding financial inclusion. Key players include established NBFCs offering diverse loan products such as personal, home, business, and vehicle loans, alongside wealth management and microfinance services.
Industry trends reveal a shift towards digital lending platforms and diversified financial products to capture a wider market share and improve customer experience. Competitive dynamics are shaped by the presence of large conglomerates with strong brand equity, such as Tata Capital, which leverage extensive distribution networks and product variety. Barriers to entry remain high due to capital requirements, regulatory compliance, and the need for robust risk management frameworks.
The regulatory environment for NBFCs in India is governed by the Reserve Bank of India (RBI), which enforces prudential norms, capital adequacy standards, and consumer protection measures. Recent regulations have focused on enhancing transparency, tightening asset quality monitoring, and ensuring liquidity stability. These regulatory measures aim to strengthen sector resilience while supporting sustainable growth, impacting how companies like Tata Capital structure their operations and manage risks.
Note: Analysis synthesized from industry research, market reports, and regulatory filings. Information is subject to change based on market conditions.
Financial Ratios Dashboard
Illustrative Scenario Analysis
DCF Assumptions:
Method: Two-Stage EPS-Priority Model
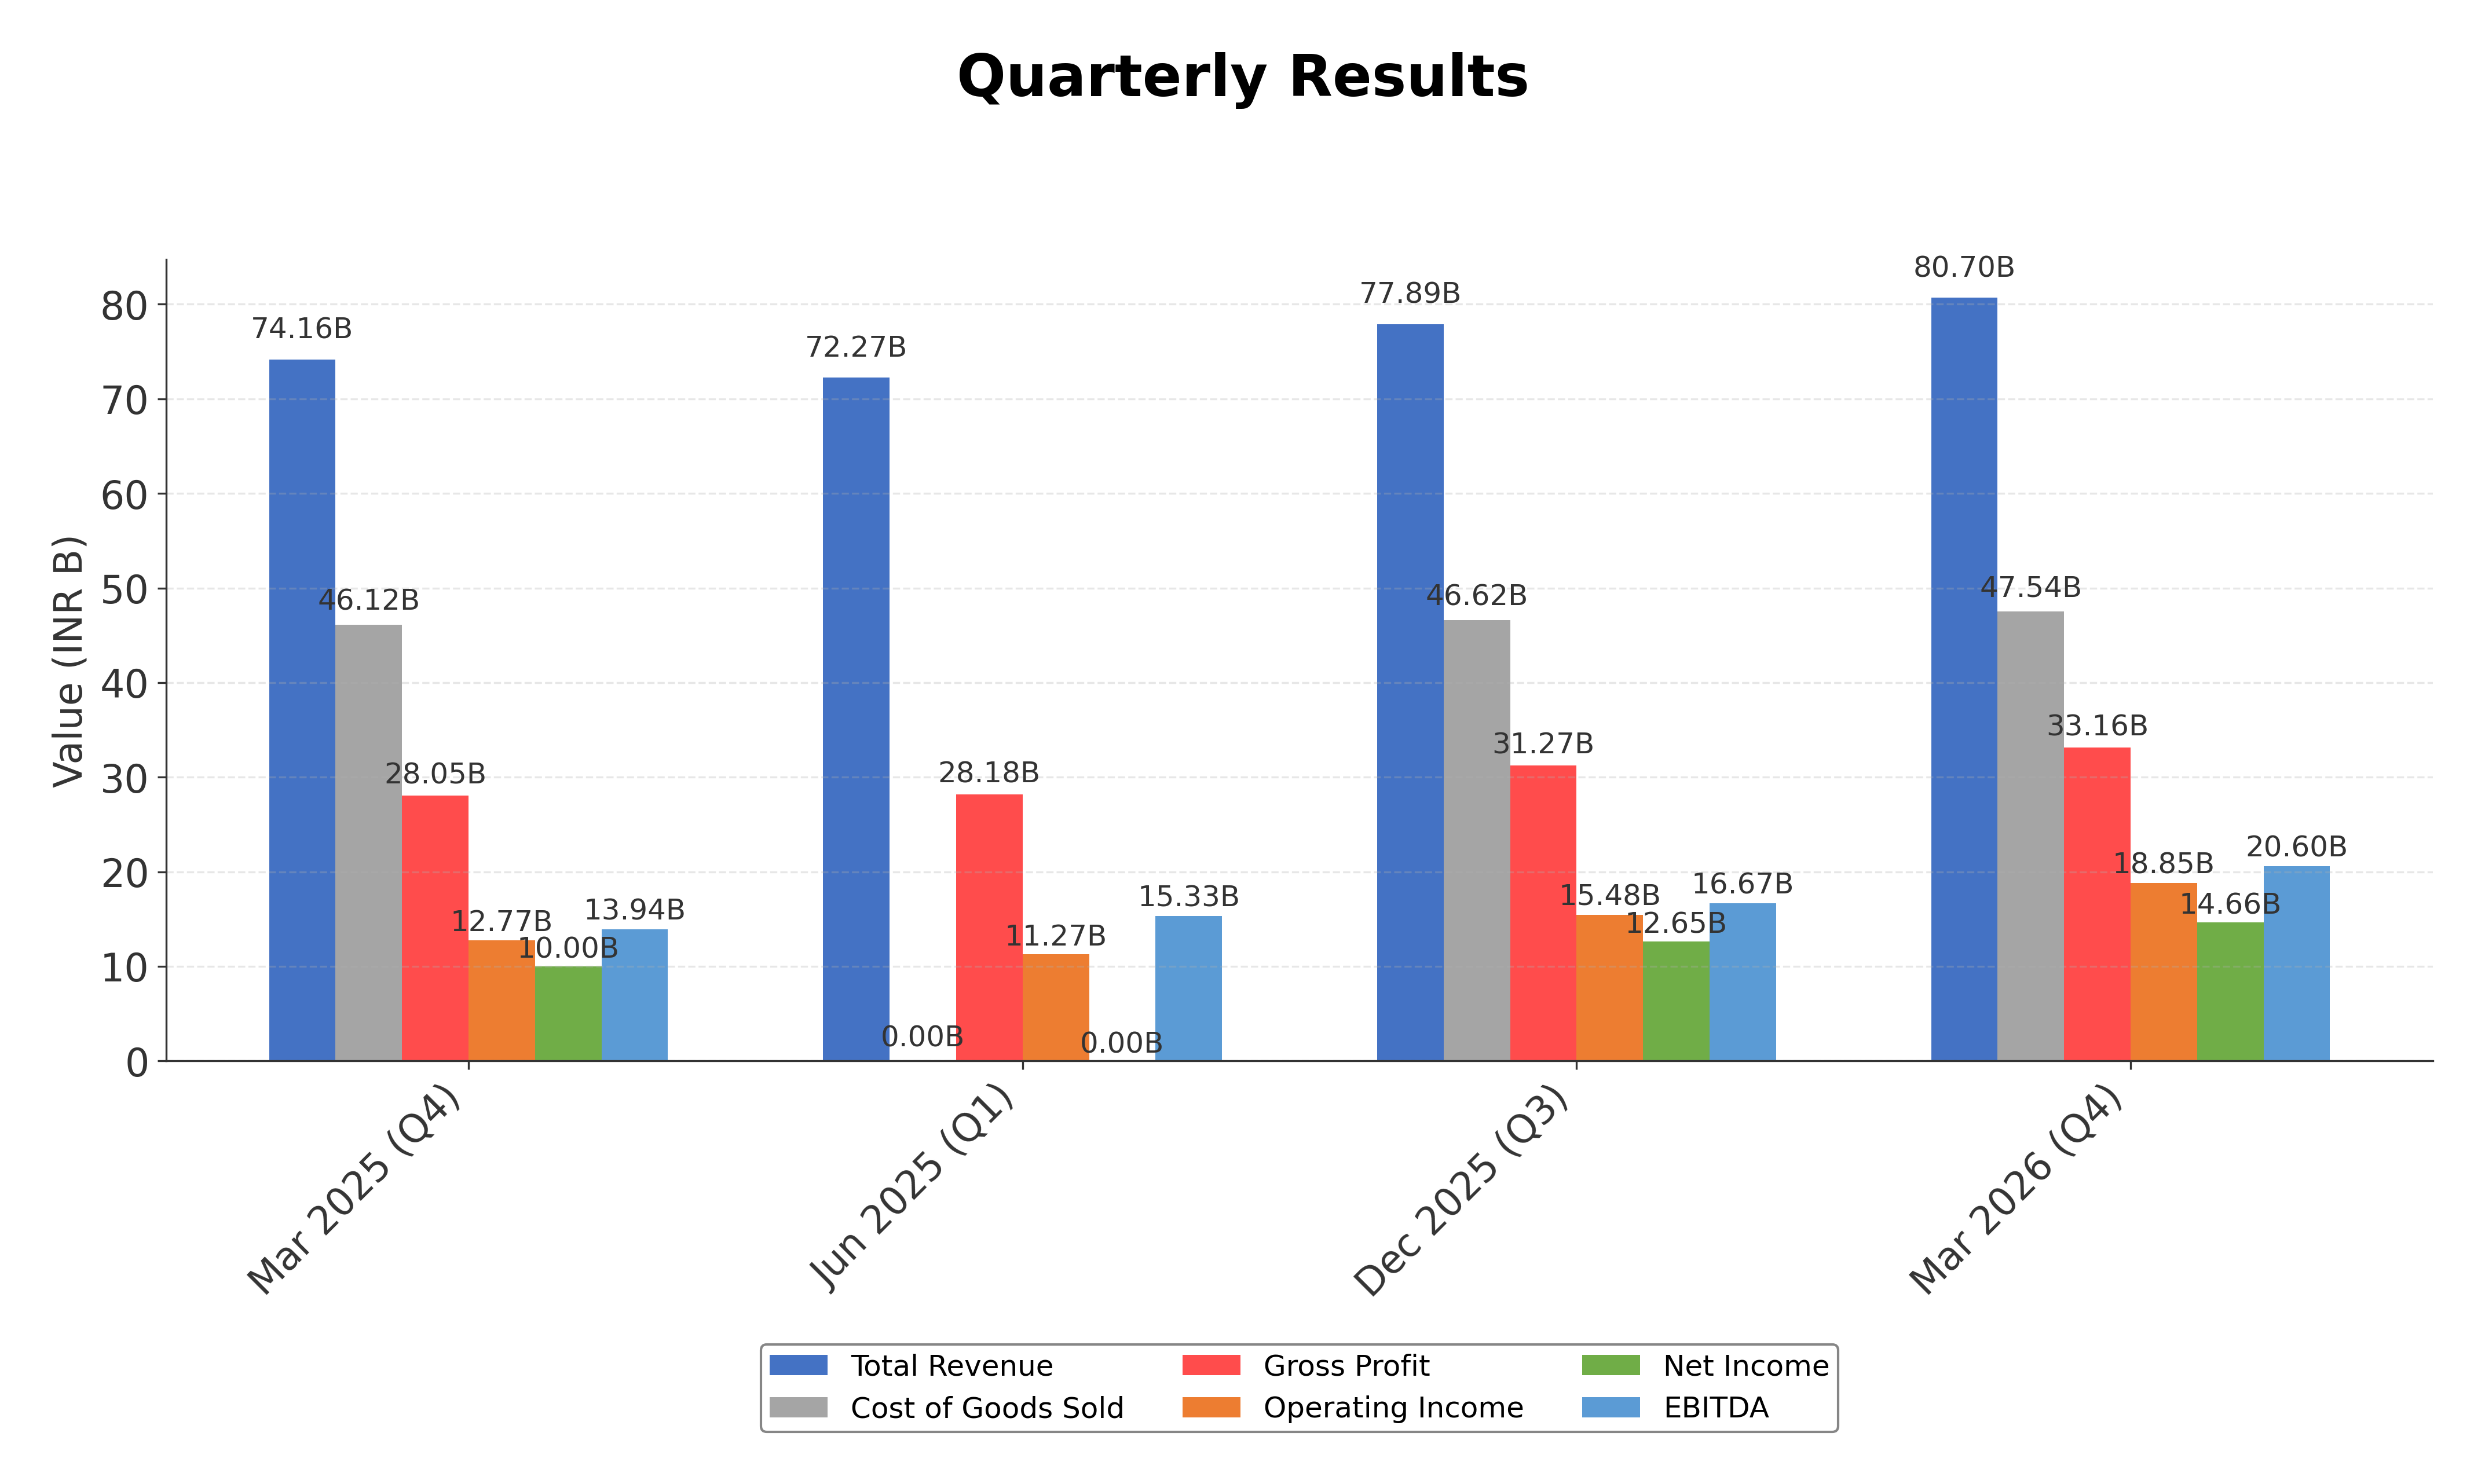
Financials
Peer Analysis
| Company Name | Market Cap | P/E Ratio | P/B Ratio | EV/EBITDA | Price to CFO |
|---|---|---|---|---|---|
| Tata Capital Limited | ₹1.37T | 27.7 | 3.61 | 60.89 | -3.62 |
| Bajaj Finance Ltd. | ₹5.71T | 30.12 | 5.01 | N/A | -8.68 |
| Sundaram Finance Ltd. | ₹458.38B | 22.27 | 3.03 | N/A | -7.78 |
| Manappuram Finance Ltd. | ₹286.69B | 26.06 | 1.61 | N/A | -1.42 |
| SBI Cards and Payment Services Ltd. | ₹560.93B | 25.75 | 3.47 | N/A | 113.77 |
| Five-Star Business Finance Limited | ₹129.63B | 11.79 | 1.75 | 10.4 | -49.05 |
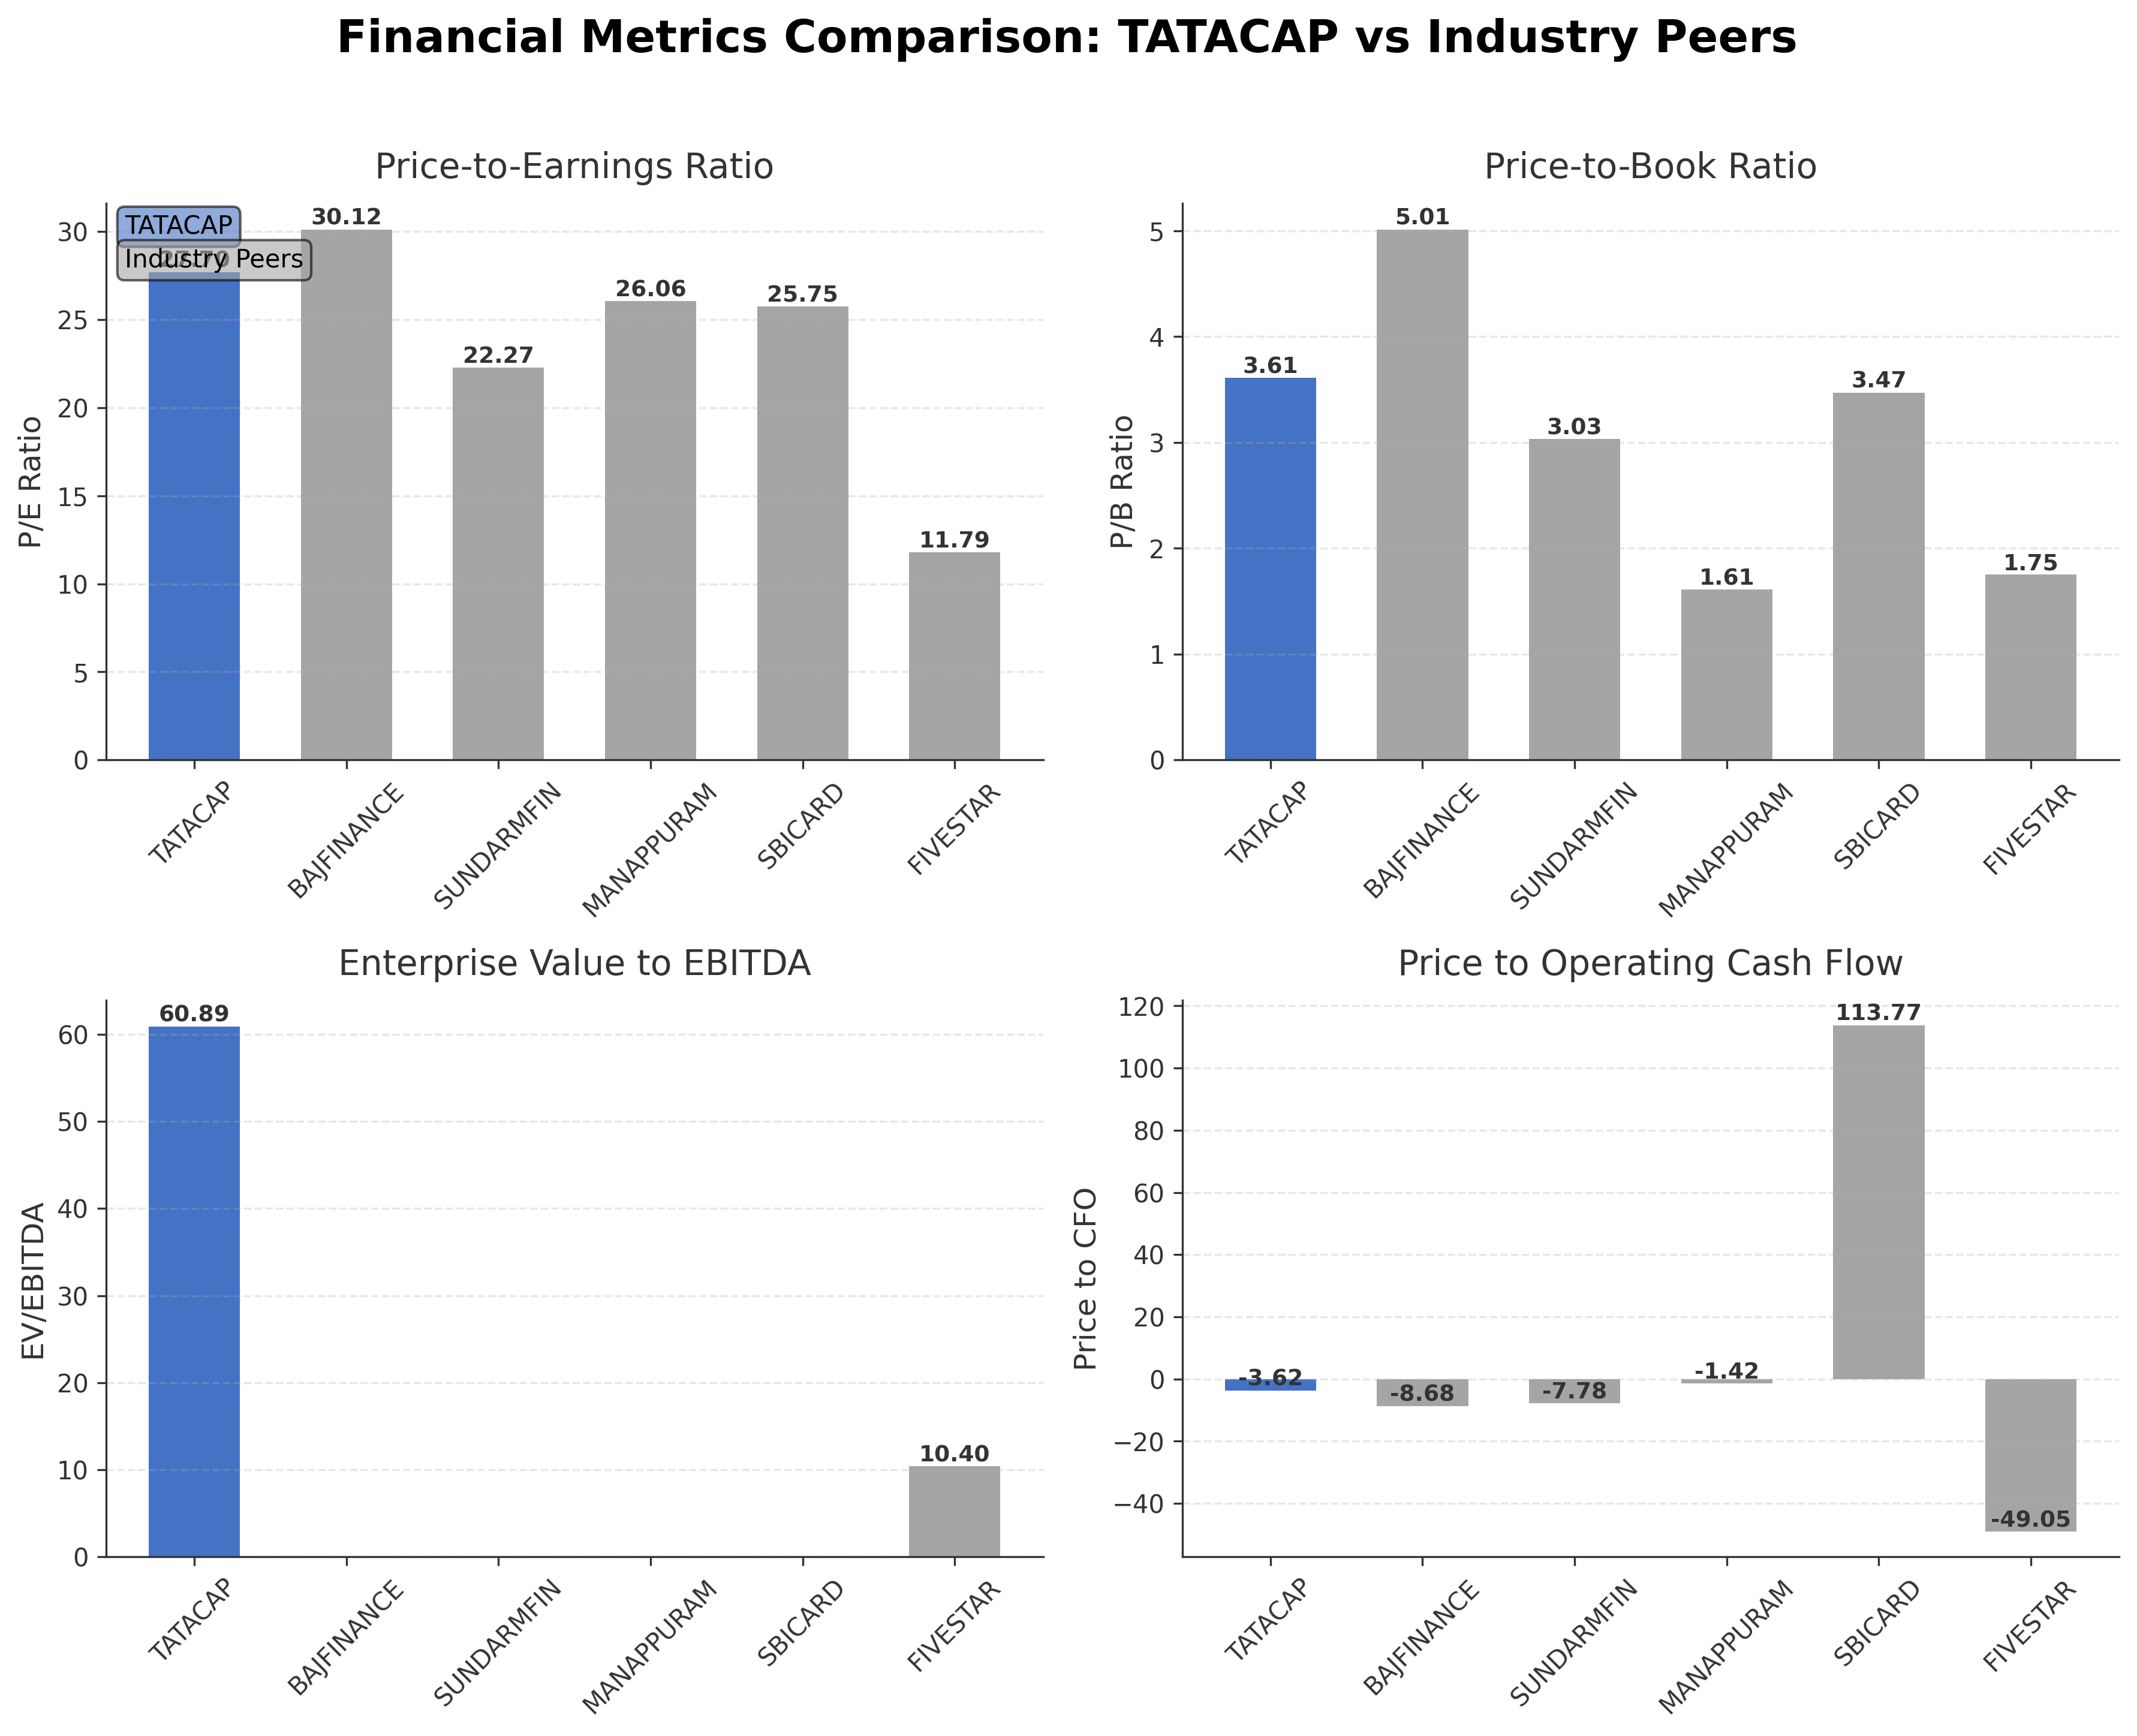
Comparison Analysis: Tata Capital Limited holds a mid-tier market capitalization of ₹1.37 trillion within its peer group, with a trailing P/E of 27.7 that is slightly lower than Bajaj Finance's 30.1 but higher than several others such as Sundaram Finance and Five-Star Business Finance. Its price-to-book ratio of 3.61 is moderate, positioned below Bajaj Finance's 5.01 but above Manappuram Finance's 1.61, reflecting a premium valuation relative to book value. The enterprise value to EBITDA multiple of 60.9 is notably high compared to peers where data is available, indicating a relatively expensive valuation on an earnings basis. Tata Capital's return on equity at 12.0% is solid but trails top performers like Bajaj Finance and Five-Star Business Finance, suggesting room for improvement in profitability. The negative price-to-cash-flow ratio contrasts with SBI Cards' positive figure, highlighting differences in cash generation efficiency. Overall, Tata Capital exhibits competitive strengths but faces valuation and cash flow challenges relative to its industry peers.
Financial Metrics Comparison with Peers
Financial Statements
Comprehensive financial data including income, balance sheet, and cash flow metrics
Income Statement
| fiscal_date | 2026-03-31 | 2025-03-31 |
|---|---|---|
| Sales | 307.85B | 277.59B |
| Cost Of Goods | 188.14B | 178.43B |
| Gross Profit | 119.71B | 99.16B |
| Operating Expense Other Operating Expenses | 56.30B | 52.37B |
| Operating Income | 58.04B | 42.89B |
| Pretax Income | 65.62B | N/A |
| Income Tax | 16.71B | N/A |
| Net Income | 48.91B | N/A |
| Ebit | 58.04B | 42.89B |
| Ebitda | 60.75B | 43.77B |
| Net Income Continuous Operations | 65.62B | N/A |
| Minority Interests | -448.10M | N/A |
| Preferred Stock Dividends | 0.00 | N/A |
Data provided by Twelve Data
Balance Sheet
| fiscal_date | 2026-03-31 |
|---|---|
| Cash And Cash Equivalents | 36.41B |
| Accounts Receivable | 2.06B |
| Total Assets | 2905.04B |
| Total Liabilities | 2433.96B |
| Long Term Debt | 2277.67B |
| Shareholders Equity | 471.07B |
Data provided by Twelve Data
Cash Flow Statement
| fiscal_date | 2026-03-31 | 2025-03-31 |
|---|---|---|
| Operating Activities Net Income | 65.62B | N/A |
| Operating Activities Stock Based Compensation | 477.60M | N/A |
| Operating Activities Other Non Cash Items | -126.93B | -107.05B |
| Operating Activities Accounts Receivable | -478.43B | -356.21B |
| Operating Activities Other Assets Liabilities | 17.43B | -1.40B |
| Operating Activities Operating Cash Flow | -521.83B | -464.67B |
| Investing Activities Capital Expenditures | -9.64B | N/A |
| Investing Activities Net Acquisitions | 0.00 | N/A |
| Investing Activities Purchase Of Investments | -6997.18B | -7683.62B |
| Investing Activities Sale Of Investments | 7009.49B | N/A |
| Investing Activities Investing Cash Flow | 2.67B | -7683.62B |
| Financing Activities Long Term Debt Issuance | 1350.18B | N/A |
| Financing Activities Long Term Debt Payments | -1105.27B | N/A |
| Financing Activities Common Stock Issuance | 85.83B | N/A |
| Financing Activities Common Dividends | -1.66B | N/A |
| Financing Activities Other Financing Charges | -7.55B | N/A |
| Financing Activities Financing Cash Flow | 321.52B | N/A |
| End Cash Position | 36.41B | 94.75B |
| Free Cash Flow | -389.60B | -311.10B |
Data provided by Twelve Data
Technical Analysis
Key Insights
- The current trend shows the stock price trading above the 50-day moving average (₹319.10) but below the 200-day moving average (₹328.86), indicating a mixed medium-term momentum.
- Key support levels are near the 52-week low of ₹296 and the 50-day moving average around ₹319, while resistance is observed near the 52-week high of ₹367.3 and the 200-day moving average.
- The stock is positioned above the short-term 10-day moving average but has not decisively broken above the longer-term 200-day moving average, suggesting consolidation.
- Momentum indicators such as RSI and MACD show neutral to slightly bullish readings, with the RSI neither overbought nor oversold and MACD lines converging.
- Multi-timeframe analysis reveals that daily charts exhibit sideways movement, weekly charts suggest potential for upward momentum, and monthly charts indicate longer-term consolidation.
- Potential market scenarios include a breakout above the 200-day moving average leading to renewed upward momentum or a retest of support levels near ₹296 if downward pressure intensifies.
Trending News
1. Headline: TMPV to hike price of PVs from 01 July | Capital Market News - Business Standard
Summary: Tata Motors Passenger Vehicles announced that it will increase prices of its passenger vehicle portfolio, including both internal combustion engine (ICE) and electric vehicles (EV), by up to 1.5%, effective 1 July 2026.
Sentiment: positive
Summary: Home / Markets / Capital Market News / Stock Alert: Infosys, Gujarat Alkalies, Tata Capital, Astral, Ratnaveer Precision, Avanti Feeds
Sentiment: neutral
Summary: Upcoming Dividend stocks next week: Among the companies, Sanofi Consumer Healthcare India has announced the highest final dividend of ₹75 per share, with June 19, 2026, fixed as the record date
Sentiment: neutral
4. Headline: Stocks To Watch Today: Vedanta, Dabur, Cyient, Tata Capital, Federal Bank & More
Summary: Here's a look at stocks that are likely to be in focus during the trading session on Thursday.
Sentiment: neutral
5. Headline: Tata Motors Passenger Vehicles Ltd down for fifth straight session | Capital Market News - Business Standard
Summary: Home / Markets / Capital Market News / Tata Motors Passenger Vehicles Ltd down for fifth straight session ... Tata Motors Passenger Vehicles Ltd is quoting at Rs 376, down 1.31% on the day as on 13:19 IST on the NSE. The stock tumbled 13.17% in last one year as compared to a 6.57% slide in ...
Sentiment: negative
Powered by Brave
Recent Updates
News Summary
As of June 12, 2026. Tata Capital reported strong financial performance for FY 2026, with consolidated assets under management (AUM) growing 20% year-on-year to ₹2.77 lakh crore and a profit after tax (PAT) increase of 16% sequentially to ₹1,502 crore. Excluding the motor finance segment, AUM expanded 28% year-on-year and PAT rose 51%, driven by lower credit costs and improved asset quality. The merger with Tata Motors Finance completed in May 2025 has expanded the motor finance operations, contributing to segment growth. The company’s cost-to-income ratio improved to 38.3%, and credit costs declined to 0.9%, reflecting operational efficiencies. The board has approved a final dividend of Re. 0.57 per share and is considering issuance of Non-Convertible Debentures to strengthen capital. Leadership changes include the appointment of Kamal Bhatia as Chief Risk Officer effective July 1, 2026. Outlook guidance for FY 2027 targets AUM growth of 23%-25%, with improved margins and lower cost of funds anticipated due to liability repricing.
News Sentiment
The overall sentiment from recent updates is cautiously positive, driven by strong earnings growth, operational improvements, and strategic initiatives such as the Tata Motors Finance merger and leadership appointments. Positive factors include robust AUM expansion, improved asset quality, and cost efficiencies. Neutral tones arise from regulatory monitoring and capital raising plans, which indicate prudent risk management. Negative sentiment is limited but present in the form of cautious market reactions and technical indicators. The balance of news suggests a stable outlook with potential for continued growth tempered by sector-specific risks.
Source List
- https://quartr.com/companies/tata-capital-limited_21556
- https://economictimes.indiatimes.com/tata-capital-ltd/stocksupdate/companyid-23856.cms
Analytical Overview
Analysis Summary
Tata Capital’s valuation metrics show a trailing P/E of 27.7 and a forward P/E of 15.6, which are broadly in line with the industry average P/E of 27.7, indicating fair valuation relative to peers. The PEG ratio of 0.70 suggests reasonable growth expectations priced in. Revenue growth of 7% quarterly and a 51% year-on-year PAT increase (ex-motor finance) highlight a positive growth trajectory supported by expanding AUM and improving asset quality. However, operating cash flow is negative, reflecting sector-specific cash cycle dynamics, though levered free cash flow remains positive at ₹48.5 billion. The company’s high debt-to-equity ratio of over 500% is typical for NBFCs but warrants monitoring for financial health. Sector challenges include regulatory changes and competitive pressures, while opportunities lie in digital transformation and multi-OEM diversification. India-specific factors such as evolving regulatory frameworks and growing retail credit demand influence Tata Capital’s market positioning.
Overall Business and Market Assessment
Supporting Factors: solid profitability, strong AUM growth, and strategic integration of motor finance operations, supporting a positive growth outlook
Risk Factors: No data
SWOT Analysis
Strengths
- Robust asset base with ₹2.9 trillion in total assets.
- Strong profitability margins with a net profit margin of 39.0%.
- Strategic merger with Tata Motors Finance expanding motor finance segment.
- Diverse loan portfolio covering retail, SME, and corporate lending.
Weaknesses
- High debt-to-equity ratio exceeding 500%, indicating significant leverage.
- Negative operating cash flow of ₹-379.6 billion TTM.
- Relatively low institutional ownership at 4.31%.
- Price-to-EBITDA multiple of 60.9 suggests expensive valuation.
Opportunities
- Growth potential in unsecured retail loans and SME lending segments.
- Digital transformation initiatives enhancing operational efficiency.
- Expansion through multi-OEM partnerships in motor finance.
- Favorable regulatory environment supporting NBFC growth.
Threats
- Regulatory changes including new Labour Codes impacting operations.
- Competitive pressures from other NBFCs and banks.
- Macroeconomic volatility affecting credit demand and asset quality.
- Potential risks from integration challenges post-merger.
Company Description
Tata Capital Limited is a leading diversified non-banking financial company (NBFC) in India, operating as a core investment company within the Tata Group. Its primary function is to provide a comprehensive suite of financial solutions, including retail, small business, and corporate lending. The company’s offerings span personal loans, home loans, business loans, vehicle and equipment finance, loans against property, microfinance, and leasing, complemented by distribution of insurance and wealth management products. Tata Capital also plays a significant role in cleantech and infrastructure project financing through its specialized subsidiaries. As a systemically important institution, Tata Capital serves a broad client base, addressing the financial needs of individuals, MSMEs, and large corporations. The company is recognized for its robust asset base, strong profitability metrics, and emphasis on prudent risk management. It has demonstrated steady growth and resilient asset quality, making it an influential player in India’s financial sector. Tata Capital’s strategic positioning within the Tata Group ecosystem, together with its diversified loan portfolio and expanding market presence, underlines its market significance as a trusted provider of financial services in India.