


Tamilnadu Petroproducts Ltd (TNPETRO)
Stock Analysis Report
Stock Journey
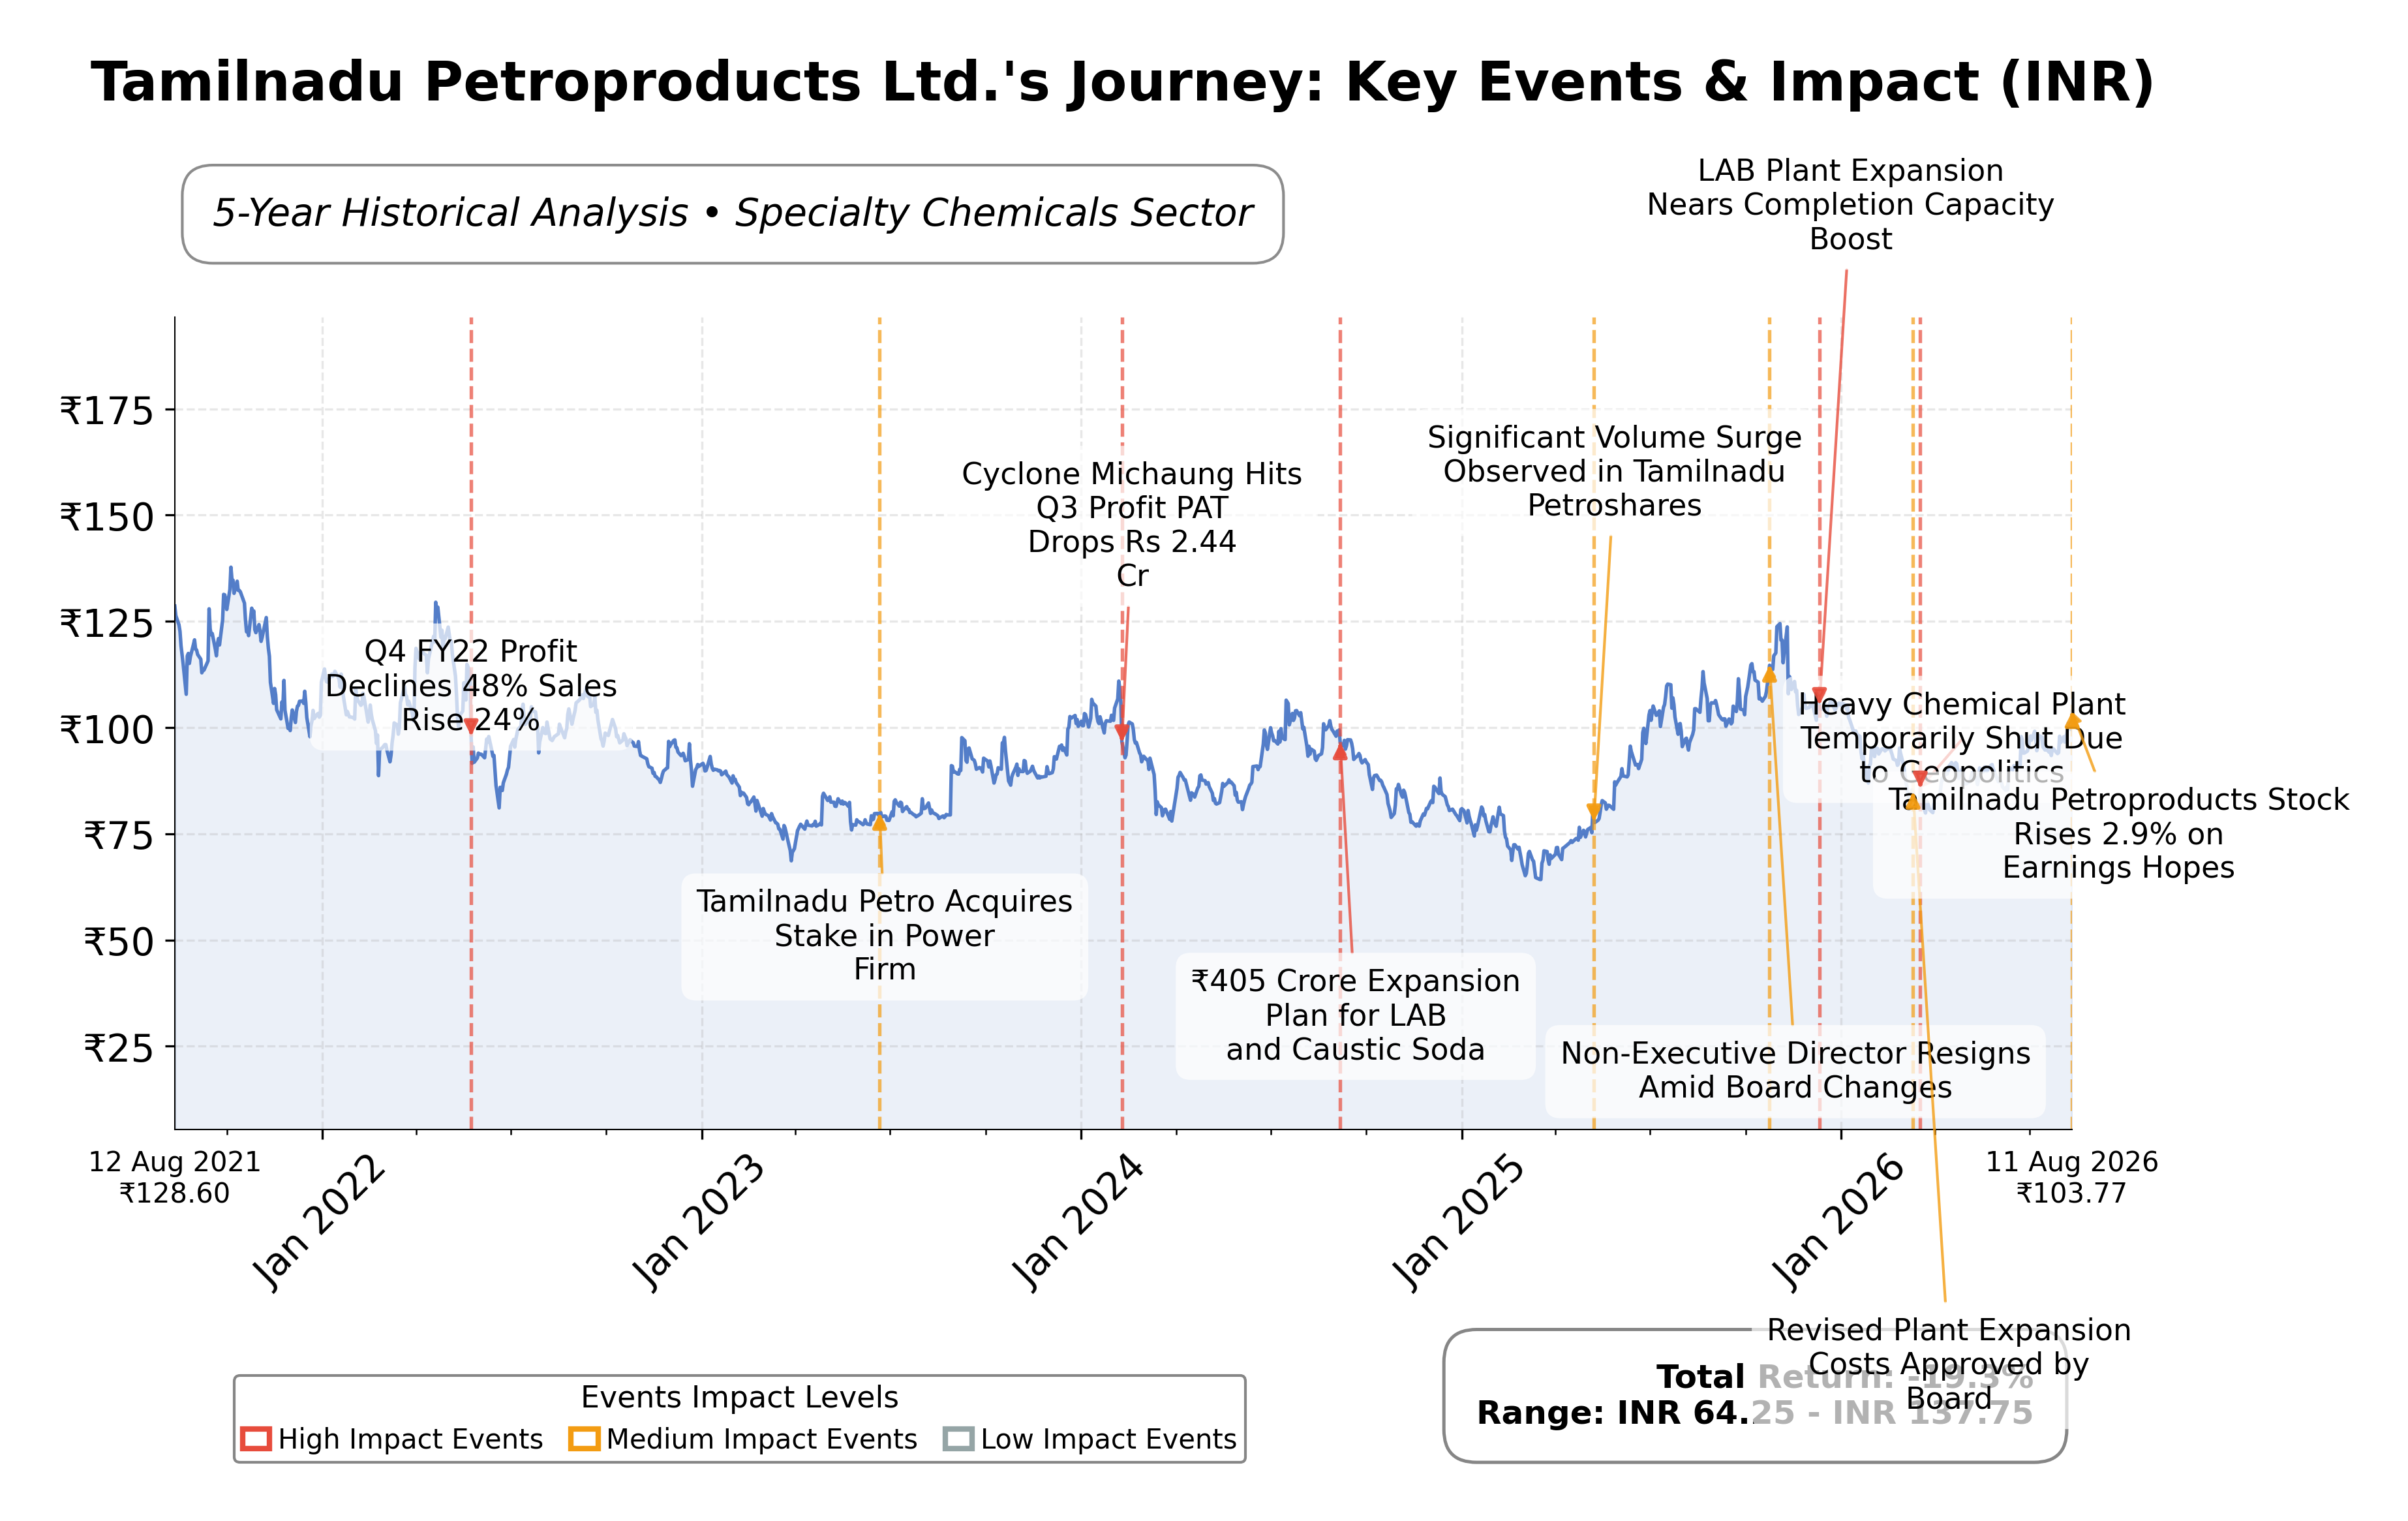
Key Positives and Key Risks
Pros
- Tamilnadu Petroproducts trades at a low P/E ratio of 9.58 compared to industry peers, indicating potential valuation attractiveness.
- The company maintains a strong cash balance of INR 3.44 billion, supporting liquidity despite negative cash flow.
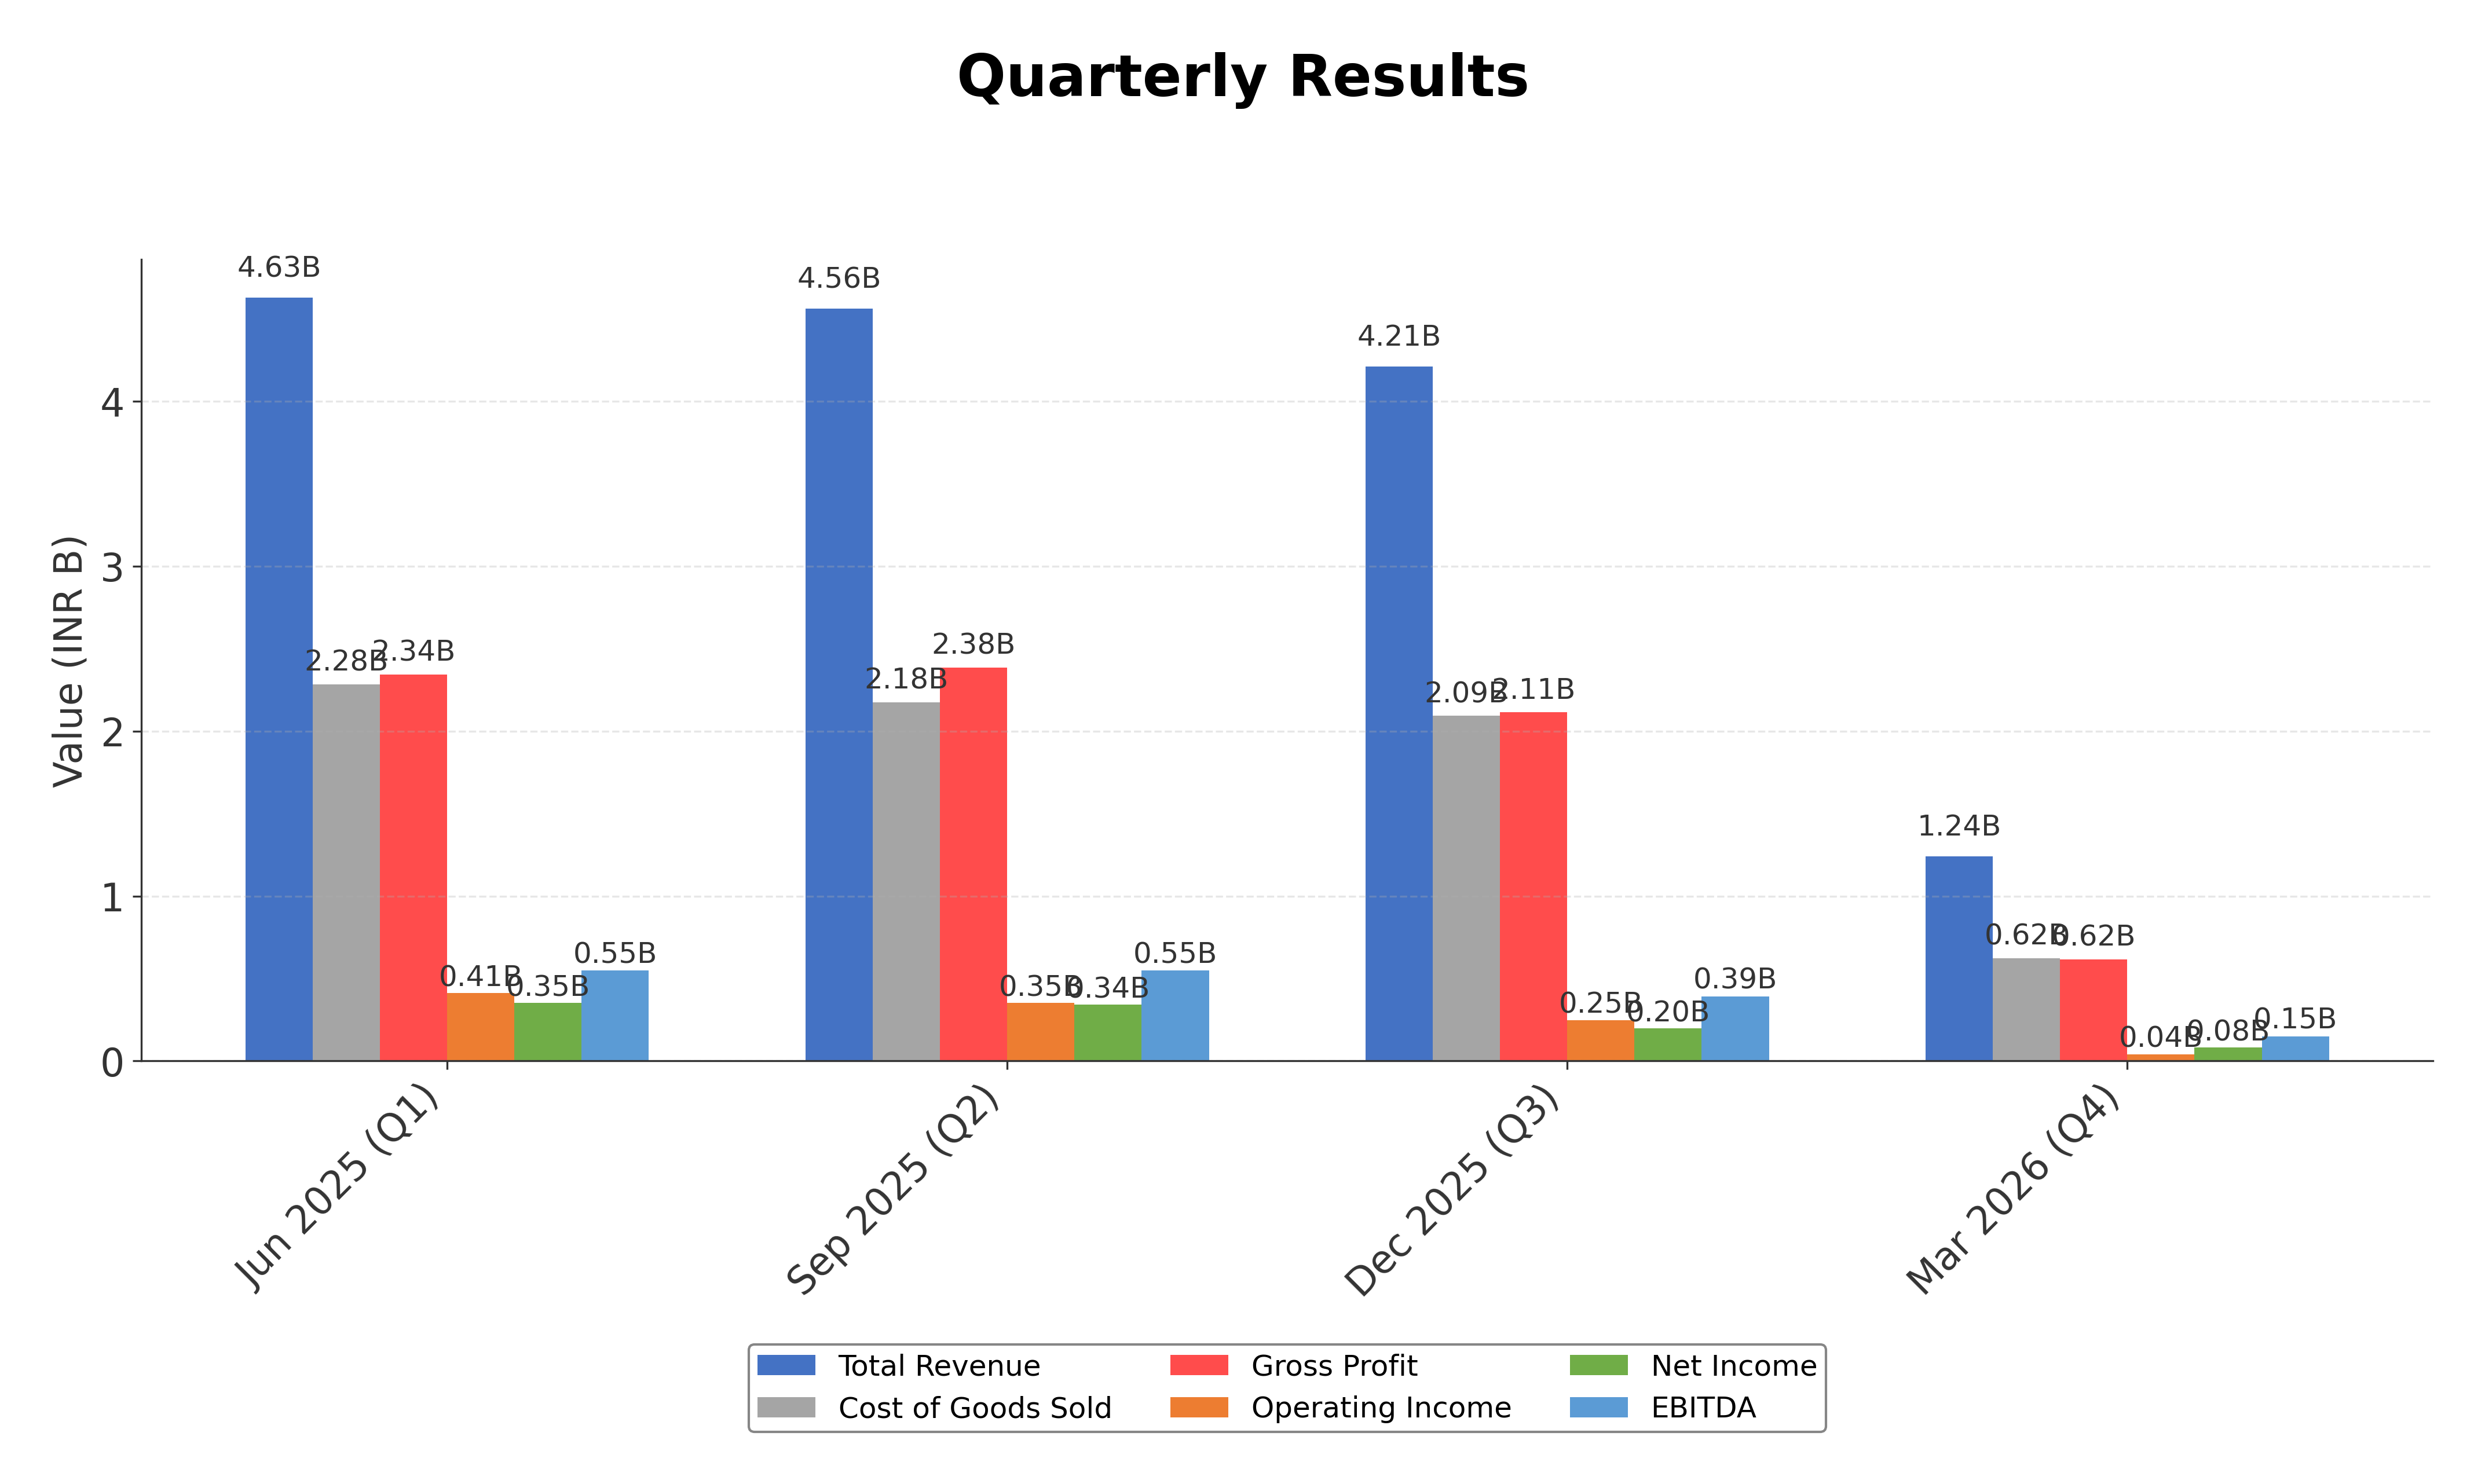
- Recent quarterly net profit surged by 127%, with revenue increasing 68%, reflecting operational recovery.
Cons
- Operating cash flow is negative at approximately -INR 1.0 billion, indicating cash generation challenges.
- Quarterly revenue declined sharply by 72.6% year-over-year before the recent rebound, showing volatility.
- Low operating margin of 3.36% limits profitability expansion compared to peers with higher margins.
Disclosure: This information is for general awareness and does not constitute investment advice
Report Summary
Tamilnadu Petroproducts Ltd. (TNPETRO) operates primarily in the specialty chemicals industry, listed on the NSE in India under the Basic Materials sector. The company manufactures key chemical products including Linear Alkyl Benzene (LAB), Epichlorohydrin, and Caustic Soda, serving diverse industrial applications such as detergents, epoxy resins, textiles, and oil refining. Its strategic positioning as a significant supplier in both domestic and international markets underscores its role in the global chemical supply chain, supported by comprehensive manufacturing capabilities and sustainable practices.
Financially, TNPETRO reported trailing twelve months (TTM) revenue of approximately INR 14.66 billion with a gross margin of 49.7%, indicating efficient production and cost management. Operating margin stands at 3.36%, while net profit margin is 6.65%, reflecting moderate profitability. Return on equity (ROE) is 10.1% and return on assets (ROA) is 4.3%, suggesting reasonable returns on shareholder capital and asset utilization. However, the company experienced a significant quarterly revenue decline of 72.6% year-over-year, signaling recent operational challenges.
Valuation metrics show a trailing price-to-earnings (P/E) ratio of 9.58 and a price-to-book (P/B) ratio of 0.92, with an enterprise value to EBITDA (EV/EBITDA) of 8.04. The market capitalization is approximately INR 9.59 billion. The stock price currently trades at INR 106.60, within a 52-week range of INR 78.67 to INR 129.89, positioning it closer to the upper end of its annual trading band. These valuation figures suggest the stock is priced modestly relative to its book value and earnings.
Key strengths include a strong cash position of INR 3.44 billion against total debt of INR 4.65 billion, maintaining a current ratio of 1.60 which indicates adequate short-term liquidity. The company benefits from market leadership in specialty chemicals and strategic off-take agreements with major FMCG players. Risks involve recent negative cash flow trends, a significant drop in quarterly revenue, and exposure to regulatory and raw material price volatility. Recent strategic actions include leadership changes with the appointment of a new non-executive director and a favorable GST appeal outcome reducing tax liabilities.
Technically, the stock shows resilience trading above its 50-day and 200-day moving averages, with a beta of 0.33 indicating low volatility relative to the market. Momentum indicators and multi-timeframe analysis suggest a cautiously positive trend. Overall, the data reflects a company with stable fundamentals but facing near-term operational headwinds, warranting a measured approach to monitoring its performance and market developments.
Company and Industry Overview
Company Basics
Price Performance
Company Size
Shareholding Pattern
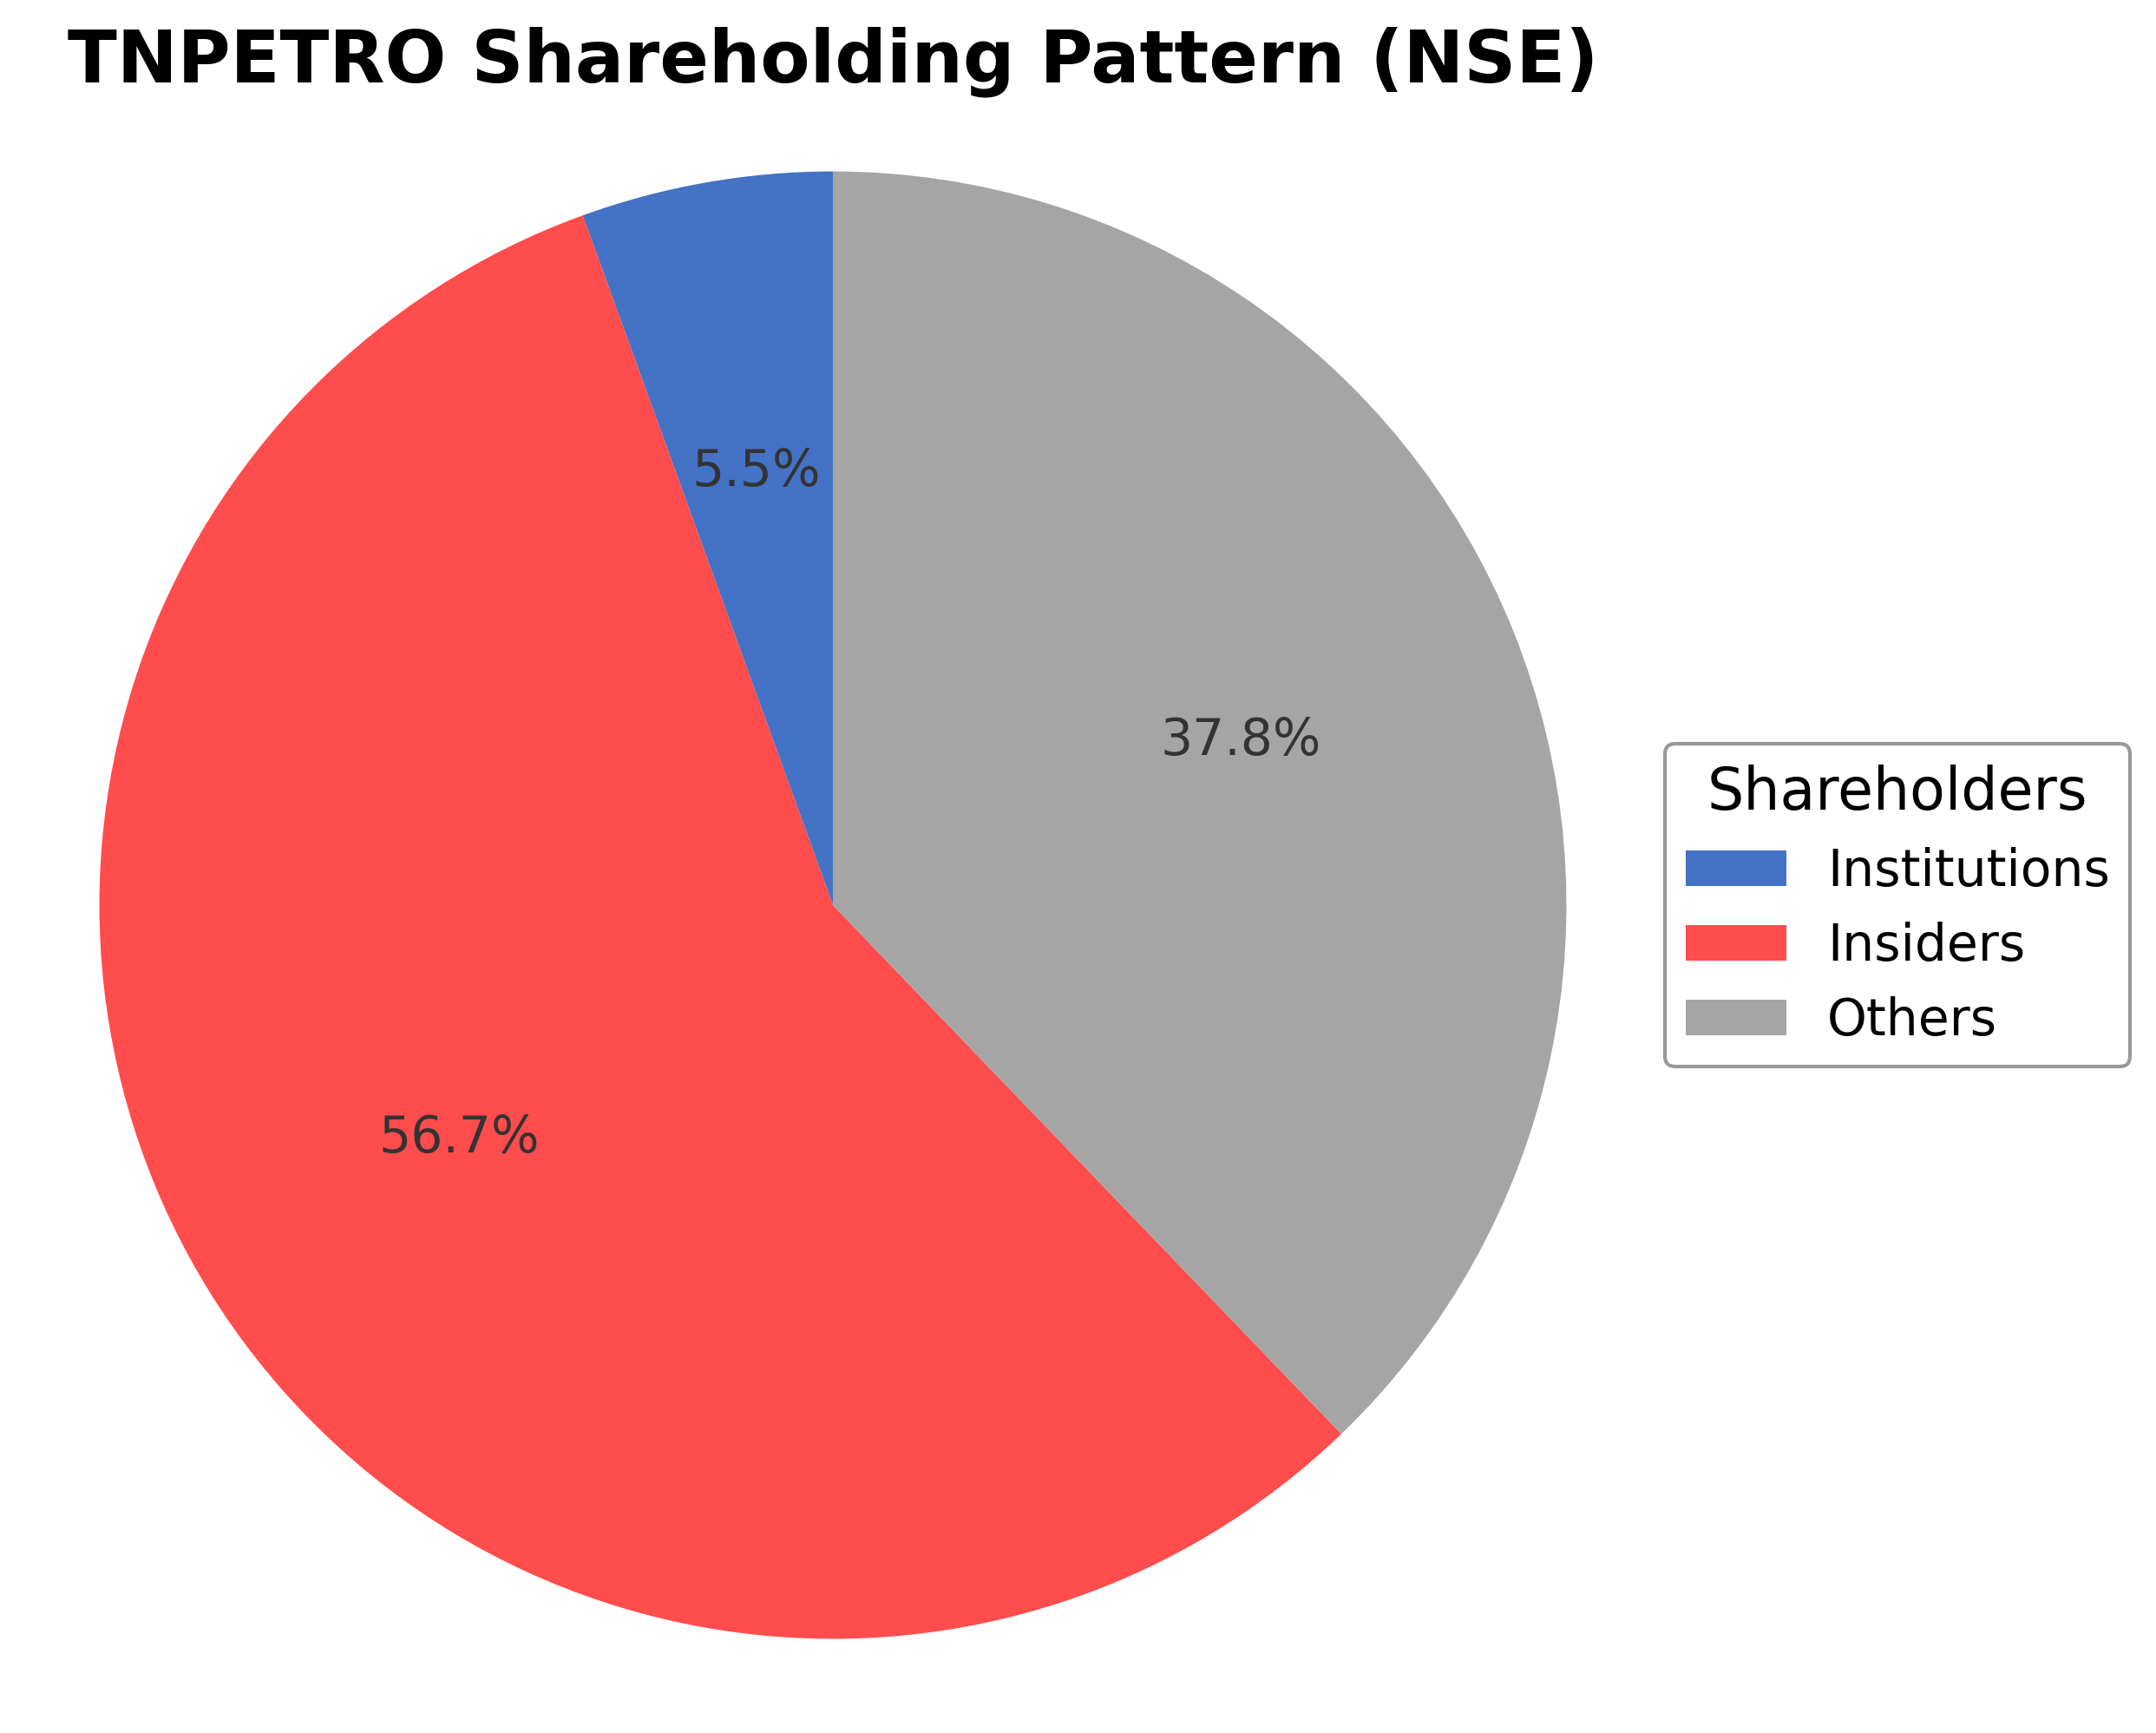
Tamilnadu Petroproducts Ltd. exhibits a shareholding structure dominated by insiders holding approximately 56.65%, institutional investors controlling 5.54%, and the remaining 37.81% held by public and other shareholders. Over the past 12 to 24 months, promoter holdings have remained stable, while institutional ownership has shown minor fluctuations without significant accumulation or distribution trends. Major institutional investors have maintained steady positions, reflecting a neutral market sentiment. This ownership distribution suggests a governance framework with strong promoter influence, balanced by moderate institutional oversight, potentially supporting consistent strategic direction and operational stability within the specialty chemicals sector.
Sector and Industry Analysis
The petrochemical sector in India is a significant contributor to the economy, with a market size valued in billions of dollars and a steady growth trajectory driven by rising demand in downstream industries such as FMCG, textiles, and automotive. Major players include large integrated oil and gas companies alongside specialized petrochemical manufacturers like Tamilnadu Petroproducts Ltd. The sector benefits from the country's expanding industrial base and increasing consumption of petrochemical derivatives.
Industry trends highlight a shift towards value-added products and firm off-take agreements with FMCG companies, as seen with Tamilnadu Petroproducts securing annual contracts with price adjustments linked to international raw material costs. Competitive dynamics are characterized by moderate barriers to entry due to capital intensity and technical expertise required in manufacturing products like LAB and HCD. Established companies leverage scale, long-term contracts, and operational efficiencies to maintain market share amidst fluctuating raw material prices.
The regulatory environment for the petrochemical industry in India involves compliance with environmental norms, safety standards, and pricing policies influenced by global crude oil markets. Government initiatives promoting domestic manufacturing and import substitution impact the sector’s growth prospects. Ongoing regulatory scrutiny on emissions and waste management necessitates continuous investments in cleaner technologies, shaping the industry's operational and capital expenditure outlook.
Note: Analysis synthesized from industry research, market reports, and regulatory filings. Information is subject to change based on market conditions.
Financial Ratios Dashboard
Illustrative Scenario Analysis
DCF Assumptions:
Method: Two-Stage EPS-Priority Model
Financials
Peer Analysis
| Company Name | Market Cap | P/E Ratio | P/B Ratio | EV/EBITDA | Price to CFO |
|---|---|---|---|---|---|
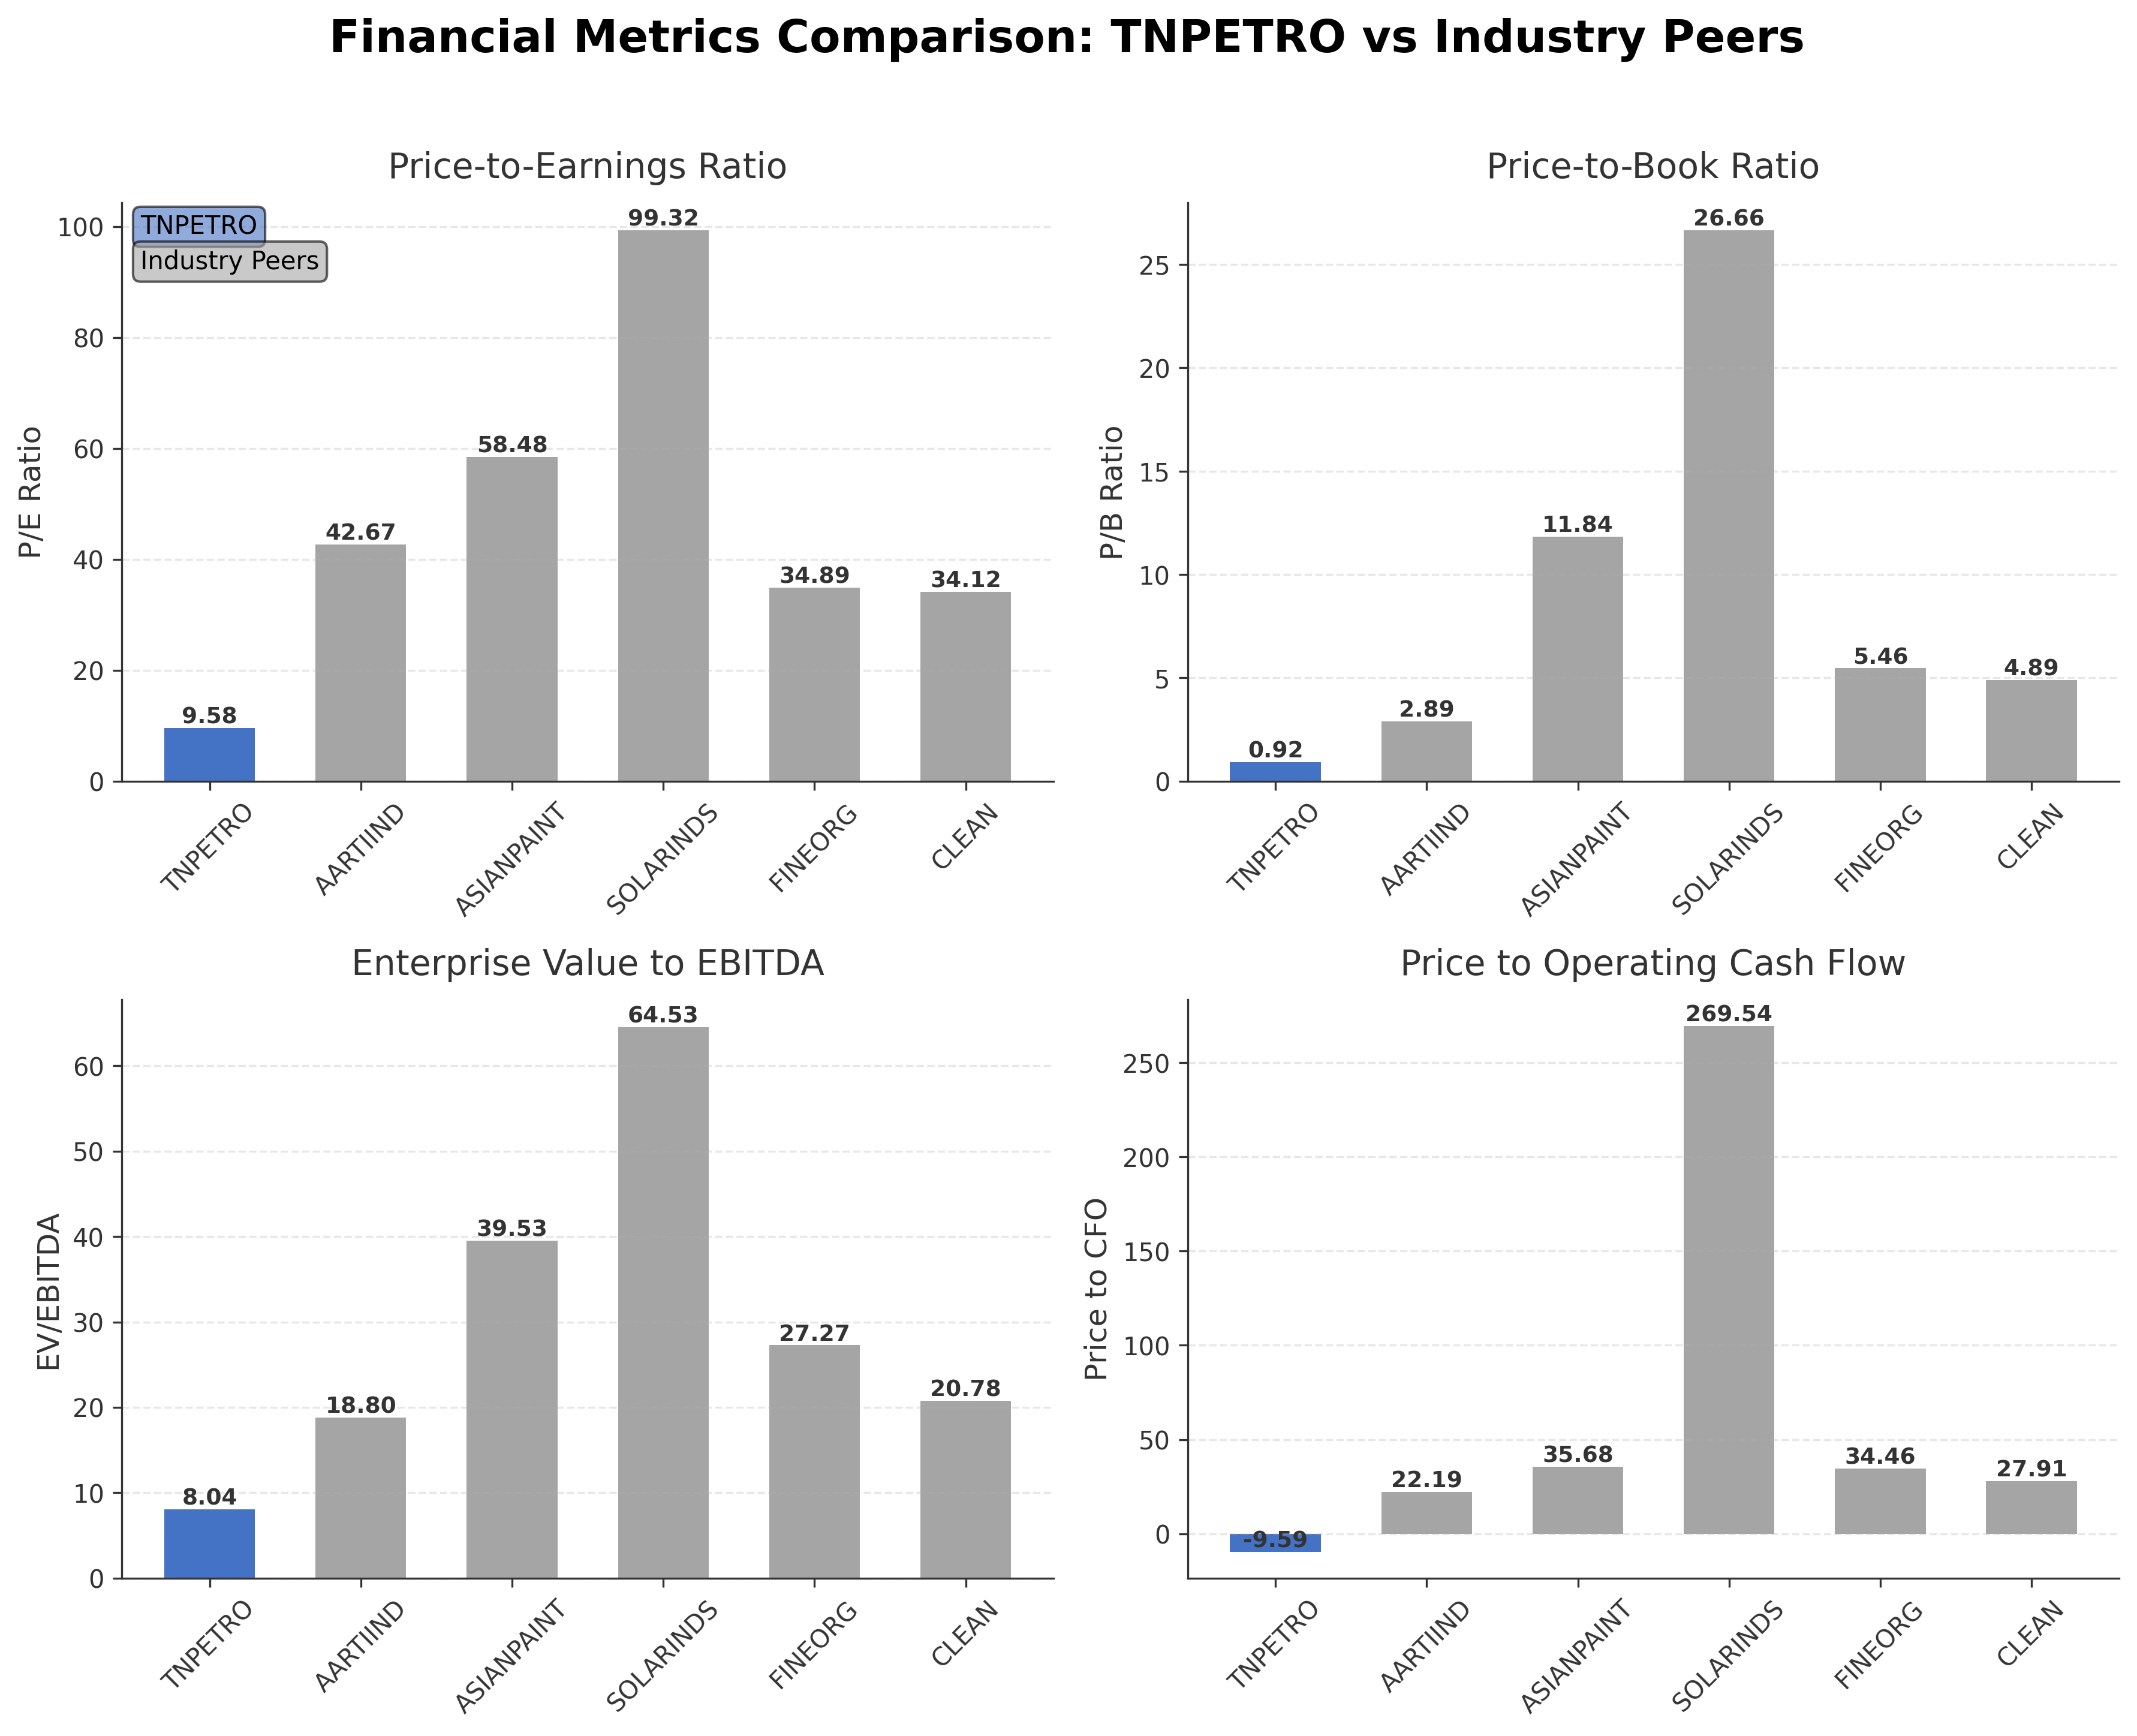
| Tamilnadu Petroproducts Ltd. | ₹9.59B | 9.58 | 0.92 | 8.04 | -9.59 |
| Aarti Industries Ltd. | ₹173.31B | 42.67 | 2.89 | 18.80 | 22.19 |
| Asian Paints Ltd. | ₹2.53T | 58.48 | 11.84 | 39.53 | 35.68 |
| Solar Industries India Ltd. | ₹1.67T | 99.32 | 26.66 | 64.53 | 269.54 |
| Fine Organic Industries Ltd. | ₹148.04B | 34.89 | 5.46 | 27.27 | 34.46 |
| Clean Science & Technology Ltd. | ₹76.63B | 34.12 | 4.89 | 20.78 | 27.91 |
Comparison Analysis: Tamilnadu Petroproducts Ltd. trades at significantly lower valuation multiples compared to its industry peers, with a P/E of 9.58 and P/B of 0.92 versus much higher ratios among competitors such as Asian Paints and Solar Industries India. Its EV/EBITDA of 8.04 is also substantially below peer averages, indicating a more conservative valuation. The company’s return on equity of 10.10% is moderate but lower than several peers demonstrating stronger profitability. Negative price to cash flow ratio contrasts with positive figures for peers, highlighting cash flow challenges. Overall, TNPETRO appears undervalued relative to its larger and more growth-oriented specialty chemical peers but faces operational and liquidity considerations.
Financial Metrics Comparison with Peers
Financial Statements
Comprehensive financial data including income, balance sheet, and cash flow metrics
Income Statement
| fiscal_date | 2026-03-31 | 2025-03-31 | 2024-03-31 | 2023-03-31 | 2022-03-31 |
|---|---|---|---|---|---|
| Sales | 14.64B | 18.23B | 16.65B | 21.47B | 18.02B |
| Cost Of Goods | 7.18B | 11.47B | 10.21B | 13.00B | 9.04B |
| Gross Profit | 7.46B | 6.76B | 6.44B | 8.47B | 8.98B |
| Operating Expense Other Operating Expenses | 5.68B | 5.34B | 4.92B | 6.40B | 5.77B |
| Operating Income | 1.05B | 381.70M | 540.50M | 1.09B | 2.24B |
| Non Operating Interest Expense | 162.30M | 35.77M | 49.51M | 49.79M | 36.73M |
| Pretax Income | 1.29B | 785.73M | 648.33M | 1.24B | 2.36B |
| Income Tax | 313.00M | 202.22M | 147.69M | 300.59M | 610.53M |
| Net Income | 974.50M | 583.50M | 500.64M | 941.84M | 1.75B |
| Eps Basic | 10.83 | 6.49 | 5.56 | 10.47 | 19.49 |
| Eps Diluted | 10.83 | 6.49 | 5.56 | 10.47 | 19.49 |
| Basic Shares Outstanding | 89.98M | 89.97M | 89.97M | 89.97M | 89.97M |
| Diluted Shares Outstanding | 89.98M | 89.97M | 89.97M | 89.97M | 89.97M |
| Ebit | 1.45B | 821.50M | 697.83M | 1.29B | 2.40B |
| Ebitda | 1.64B | 915.90M | 1.01B | 1.48B | 2.64B |
| Net Income Continuous Operations | 1.29B | 785.73M | 648.33M | 1.24B | 2.36B |
| Preferred Stock Dividends | 0.00 | 0.00 | 0.00 | 0.00 | 0.00 |
| Operating Expense Selling General And Administrative | N/A | 253.62M | 275.23M | 338.74M | 347.01M |
| Non Operating Interest Income | N/A | 195.48M | 171.34M | 188.31M | 170.89M |
Data provided by Twelve Data
Balance Sheet
| fiscal_date | 2026-03-31 | 2025-03-31 | 2024-03-31 | 2023-03-31 | 2022-03-31 |
|---|---|---|---|---|---|
| Cash And Cash Equivalents | 2.03B | 2.30B | 1.68B | 1.54B | 1.23B |
| Accounts Receivable | 286.50M | 872.92M | 961.62M | 1.39B | 1.12B |
| Total Assets | 17.00B | 13.54B | 10.91B | 11.02B | 9.81B |
| Total Liabilities | 6.82B | 4.42B | 2.31B | 2.81B | 2.33B |
| Long Term Debt | 1.64B | 1.24B | 136.23M | 132.93M | 129.53M |
| Shareholders Equity | 10.18B | 9.12B | 8.59B | 8.21B | 7.48B |
Data provided by Twelve Data
Cash Flow Statement
| fiscal_date | 2026-03-31 | 2025-03-31 | 2024-03-31 | 2023-03-31 | 2022-03-31 |
|---|---|---|---|---|---|
| Operating Activities Net Income | 1.29B | 785.73M | 648.33M | 1.24B | 2.36B |
| Operating Activities Other Non Cash Items | -74.20M | -132.92M | -99.55M | -120.06M | -112.78M |
| Operating Activities Accounts Receivable | 584.10M | 88.70M | 427.02M | -263.68M | -309.19M |
| Operating Activities Other Assets Liabilities | -2.46B | 1.14B | 469.45M | -213.54M | -511.17M |
| Operating Activities Operating Cash Flow | -1.00B | 1.88B | 1.45B | 645.15M | 1.43B |
| Investing Activities Capital Expenditures | -2.57B | 1.81M | 58.10M | 29.40M | 93.00K |
| Investing Activities Purchase Of Investments | -45.40M | N/A | -394.84M | -58.01M | -693.54M |
| Investing Activities Sale Of Investments | 43.50M | 1.19B | 235.00K | 306.70M | 808.00K |
| Investing Activities Investing Cash Flow | -2.57B | 1.19B | -378.60M | 78.65M | -712.84M |
| Financing Activities Short Term Debt Issuance | 2.89B | 67.10M | -585.92M | 197.01M | -15.25M |
| Financing Activities Common Dividends | -108.00M | -107.97M | -129.79M | -255.41M | -215.64M |
| Financing Activities Financing Cash Flow | 2.79B | -40.87M | -1.31B | -68.80M | -246.19M |
| End Cash Position | 2.03B | 2.30B | 1.68B | 1.54B | 1.23B |
| Free Cash Flow | -3.57B | -1.80B | 1.16B | 24.95M | 716.94M |
| Investing Activities Other Investing Activity | N/A | N/A | -42.09M | -199.44M | -20.20M |
| Financing Activities Long Term Debt Payments | N/A | N/A | -596.30M | -10.40M | -15.30M |
| Financing Activities Other Financing Charges | N/A | N/A | N/A | -1.00K | N/A |
Data provided by Twelve Data
Technical Analysis
Key Insights
- Tamilnadu Petroproducts exhibits a generally upward trend with price currently above both the 50-day (₹93.99) and 200-day (₹95.08) moving averages, indicating positive medium to long-term momentum.
- Key support levels are identified near ₹93.00 and ₹79.00, while resistance is observed around the recent 52-week high near ₹130.00.
- The stock’s position above major moving averages suggests sustained buying interest, with the 10-day moving average also trending upward.
- Momentum indicators show a moderate Relative Strength Index (RSI) near neutral levels, a positive MACD crossover, and stochastic oscillators indicating potential short-term consolidation.
- Analysis across daily, weekly, and monthly timeframes confirms a stable bullish bias with no significant signs of reversal.
- Potential scenarios include continuation of the upward trend if support holds, or sideways movement if resistance near ₹130 limits gains in the near term.
Trending News
Summary: Sales rise 68.08% to Rs 777.92 crore · Powered by Capital Market - Live News
Sentiment: positive
2. Headline: Tamilnadu Petroproducts Net Profit Jumps 127%, Revenue Up 68% In Q1 FY27
Summary: Tamilnadu Petroproducts Limited reported a significant increase in its consolidated net profit, which rose by 127.23 percent year-on-year for the quarter ended 30 June 2026.
Sentiment: positive
3. Headline: Why Chennai Petroleum, MRPL shares are surging today - BusinessToday
Summary: Chennai Petroleum jumped 16.79 per cent to hit a 52-week high of Rs 1,449. The stock was later trading 16.39 per cent higher at Rs 1,444.05, taking its gains in calendar year 2026 to 70.69 per cent.
Sentiment: positive
4. Headline: 100% Return In One Year: Chennai Petroleum Corporation Stock Surges 10% In Trade
Summary: Chennai Petroleum has recommended a Rs 54 final dividend as its stock delivers around 100% return over one year
Sentiment: positive
Summary: Q1 Results Today, 11th August 2026 Highlights: Find all the latest Q1 results 2026 updates of Aadhaar Ventures India, Aananda Lakshmi Spinning Mills, Abans Enterprises, Accel, Ace Engitech, Apex Capital And Finance, Advance Lifestyles, Advance Multitech, Advance Petrochemicals, Aeroflex ...
Sentiment: positive
Powered by Brave
Recent Updates
News Summary
As of 12 August 2026. Tamilnadu Petroproducts Ltd. reported a strong financial quarter with consolidated net profit rising by over 127% and revenue increasing by approximately 68% in Q1 FY27, signaling a robust operational rebound. The company announced the appointment of Mr. Sanket Balvantrao Waghe as a Non-Executive Director, enhancing its board composition. Additionally, a favorable GST appeal outcome reduced the company’s tax demand significantly, improving its regulatory standing. The Board has scheduled the Annual General Meeting for 25th September 2026 and fixed the record date for dividend purposes, reflecting ongoing shareholder engagement. Recent stock price movements show positive momentum with volumes increasing, supported by these fundamental developments.
News Sentiment
The overall sentiment from recent updates is predominantly positive, driven by strong quarterly earnings growth and regulatory successes such as the GST appeal win. Leadership changes have been neutral but contribute to governance stability. Market response has been favorable, as evidenced by stock price appreciation and increased trading volumes. These factors collectively indicate constructive investor confidence, although some neutral tones arise from routine corporate announcements and broader sectoral earnings reports. The outlook remains cautiously optimistic based on the current news flow.
Source List
- https://www.freepressjournal.in/business/tamilnadu-petroproducts-net-profit-jumps-127-revenue-up-68-in-q1-fy27
- https://economictimes.indiatimes.com/tamilnadu-petroproducts-ltd/stocksupdate/companyid-12937.cms
Analytical Overview
Analysis Summary
Tamilnadu Petroproducts’ valuation metrics, including a trailing P/E of 9.58, are significantly lower than industry averages, suggesting a relatively attractive valuation compared to peers with much higher multiples. The company’s revenue growth shows recent volatility with a sharp quarterly decline, although the latest quarter indicates a strong rebound. Cash flow trends are negative with operating and free cash flows in deficit, raising concerns about liquidity despite a solid cash balance. Sector-specific challenges include raw material price fluctuations and regulatory compliance, while opportunities exist in expanding demand for specialty chemicals in India’s growing industrial base. The company’s Indian market positioning benefits from established off-take agreements and government-linked ownership, which may support stability amid economic shifts.
Overall Business and Market Assessment
Supporting Factors: a modest valuation relative to peers, recent strong quarterly earnings growth, and a robust cash position
Risk Factors: the negative cash flow trends, significant quarterly revenue volatility, and exposure to regulatory and raw material risks
SWOT Analysis
Strengths
- Tamilnadu Petroproducts has a diversified product portfolio including LAB, Epichlorohydrin, and Caustic Soda.
- The company maintains a strong cash position of INR 3.44 billion supporting liquidity.
- Established off-take agreements with major FMCG companies provide revenue stability.
- Market leadership in specialty chemicals within India enhances competitive positioning.
Weaknesses
- Negative operating and free cash flow indicate liquidity management challenges.
- Recent quarterly revenue declined sharply by 72.6% year-over-year before rebounding.
- Relatively low operating margin of 3.36% limits profitability expansion.
- Limited institutional ownership at 5.54% may reduce external governance influence.
Opportunities
- Growing demand for specialty chemicals in India’s industrial sectors offers expansion potential.
- Favorable regulatory outcomes such as GST appeal reduce financial liabilities.
- Technological advancements can improve manufacturing efficiency and sustainability.
- Potential to increase export market share amid global chemical supply chain shifts.
Threats
- Volatility in raw material prices may impact input costs and margins.
- Regulatory changes and compliance risks could increase operational costs.
- Competitive pressures from larger, higher-margin specialty chemical companies.
- Macroeconomic factors such as currency fluctuations and inflation may affect profitability.
Company Description
Tamilnadu Petroproducts Ltd. is a prominent player in the chemical manufacturing industry in India. This company primarily focuses on the production of three main chemical products: Linear Alkyl Benzene (LAB), which is essential in the manufacturing of biodegradable detergents; Epichlorohydrin, a key raw material in epoxy resin production; and Caustic Soda, which is widely used across various sectors including textiles, paper, and oil refining. The company holds a strong position in the market due to its comprehensive manufacturing processes and commitment to sustainable practices. Tamilnadu Petroproducts Ltd. plays a significant role in supporting industries that require large-scale chemical inputs, contributing substantially to the industrial growth within the region and beyond. Operating with a focus on quality and consumer needs, the company is an important supplier to both domestic and international markets, making it a vital component of the global chemical supply chain. Its strategic initiatives and technological advancements continue to enhance its resilience and capacity in this competitive sector.