
Suzlon Energy Ltd (SUZLON)
Stock Analysis Report
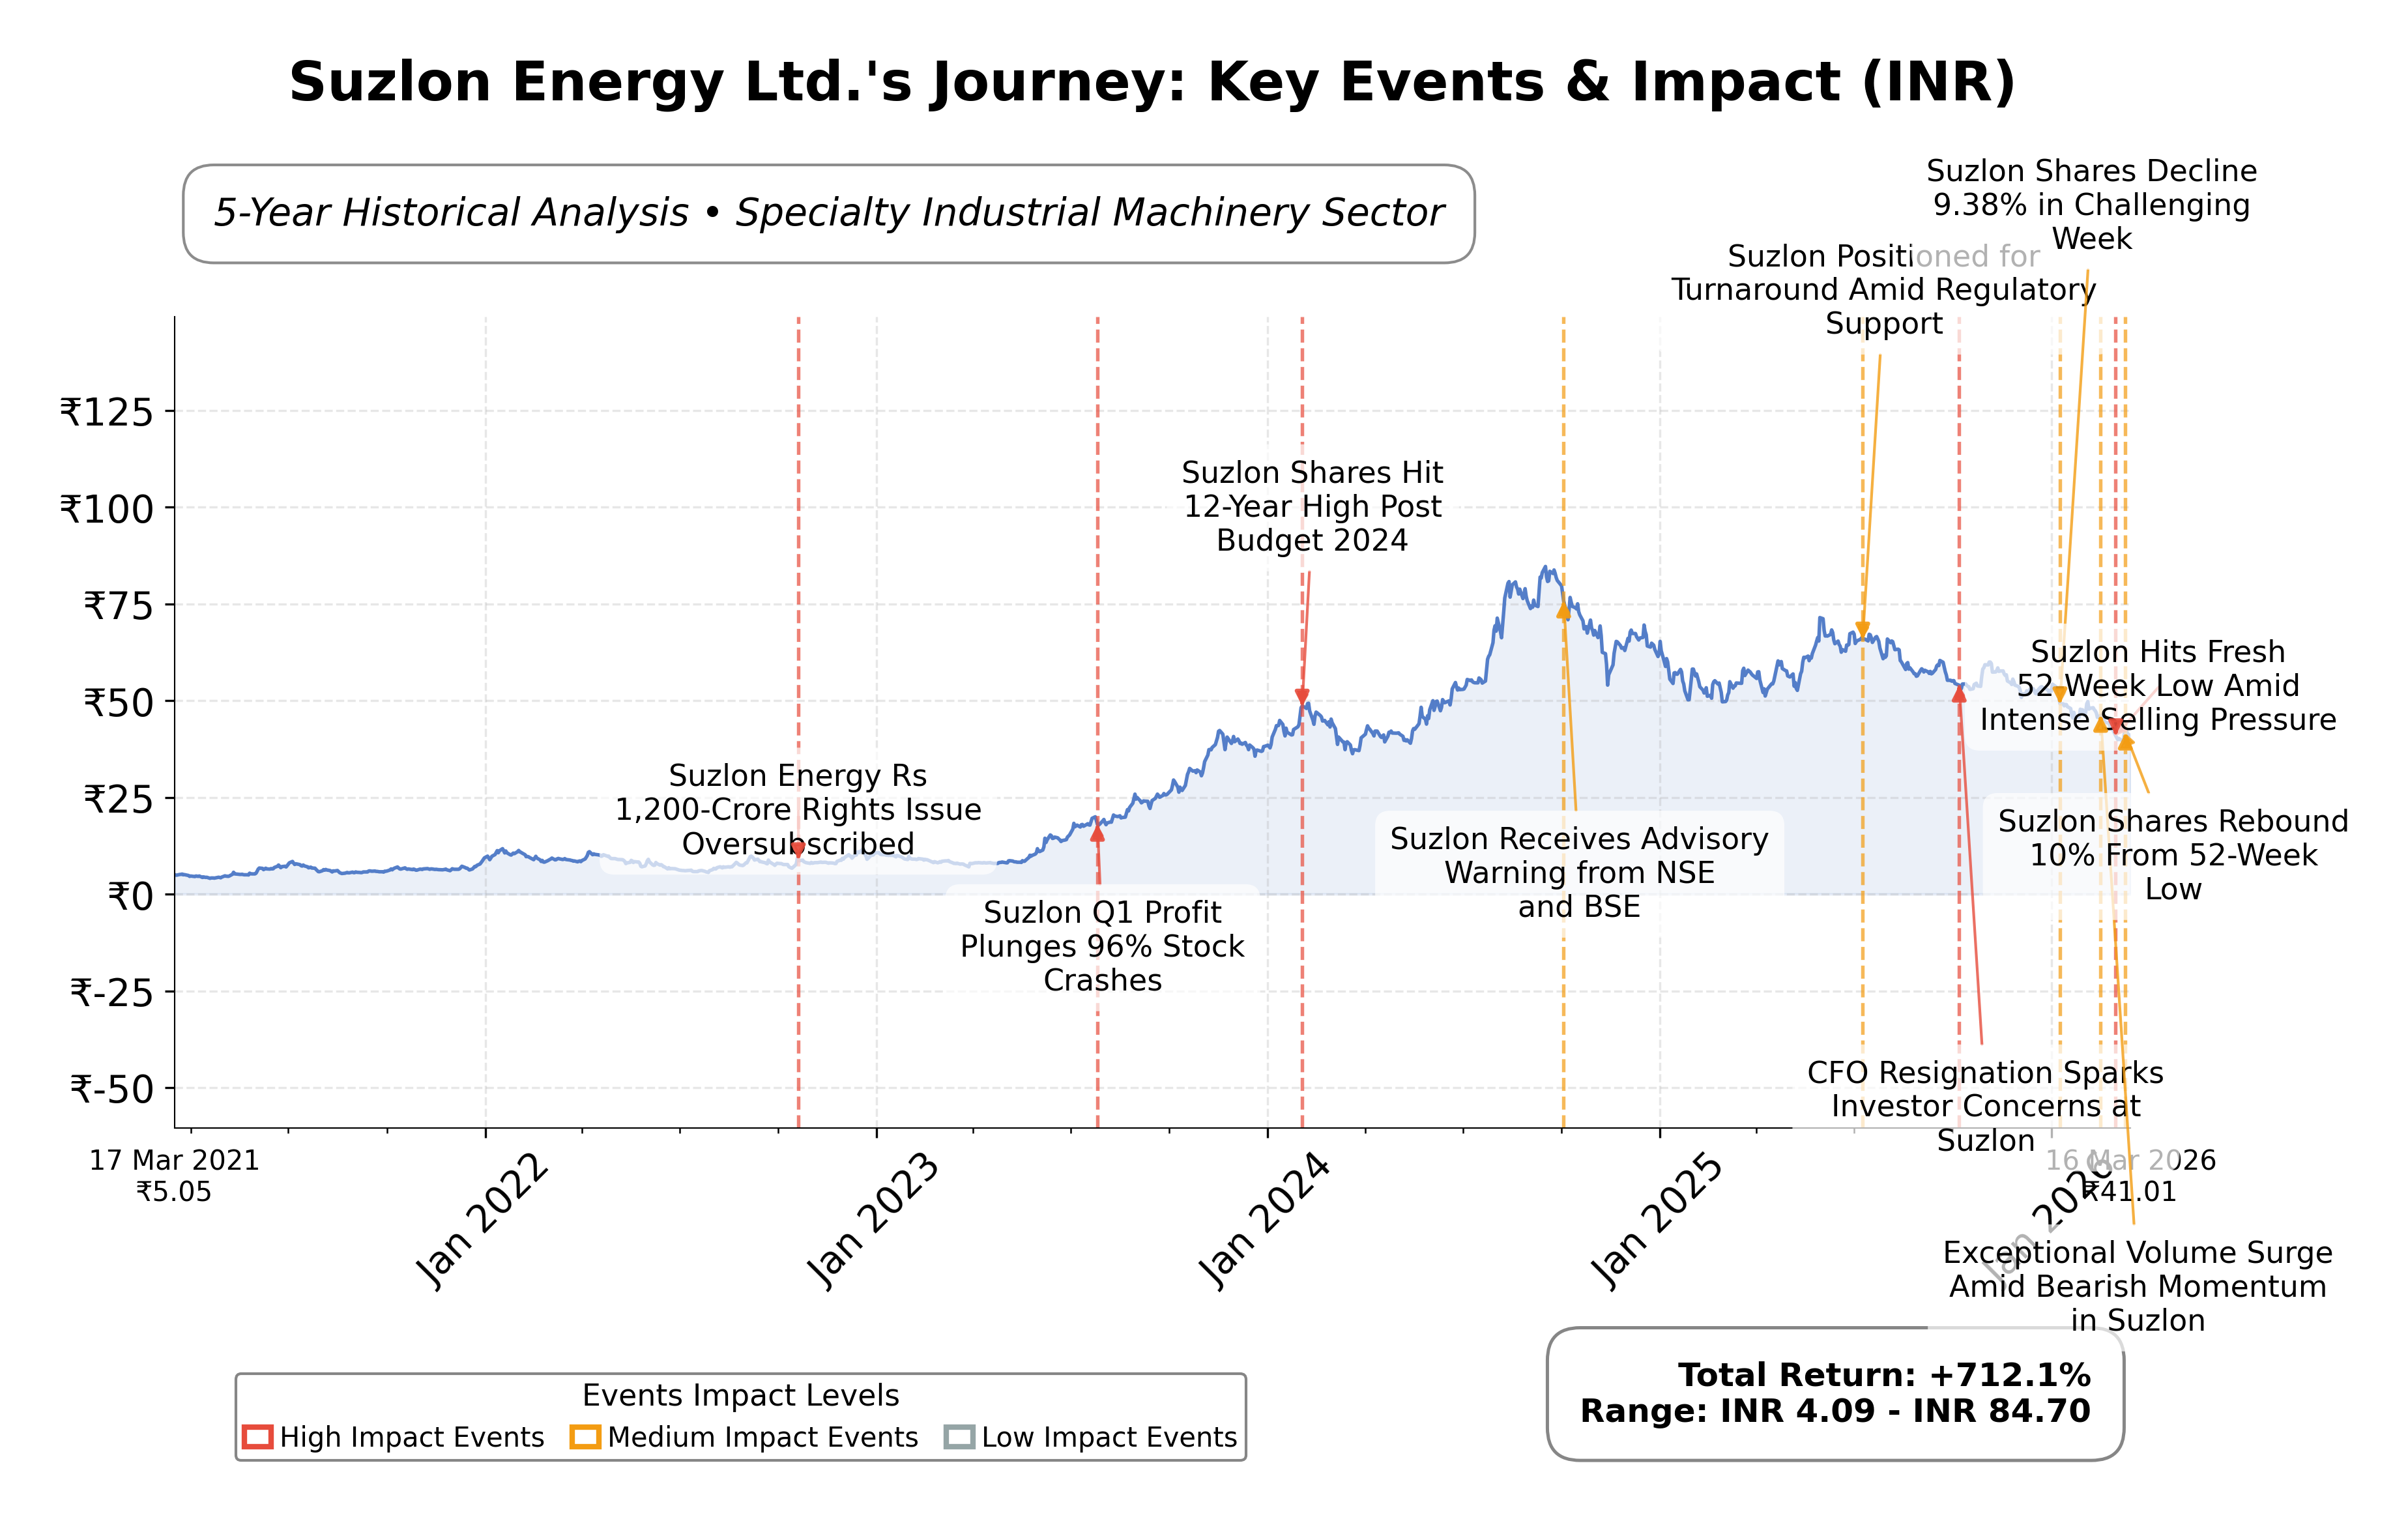
Stock Journey
Key Positives and Key Risks
Pros
- Revenue growth of 42.4% year-over-year demonstrates strong business expansion.
- Return on equity of 33.93% indicates efficient use of shareholder capital.
- Recent large turbine order from Tata Power Renewable Energy reflects robust demand.
Cons
- High debt-to-equity ratio of 5.05 suggests elevated financial risk.
- Stock price shows a downside risk of 42.56% from 52-week high, indicating volatility.
- Price-to-cash-flow ratio of 65.95 is significantly higher than peers, implying cash flow concerns.
Disclosure: This information is for general awareness and does not constitute investment advice
Report Summary
Suzlon Energy Ltd. is a prominent player in the renewable energy sector, specializing in the manufacturing and deployment of wind turbines. Operating primarily within the specialty industrial machinery industry, the company focuses on delivering sustainable energy solutions through wind power technology. Suzlon holds a significant position in both domestic and international markets, offering comprehensive services including installation, maintenance, and wind resource assessment to support the global transition to renewable energy.
Financially, Suzlon Energy reports a market capitalization of approximately â¹567.93 billion with a trailing P/E ratio of 17.55 and a forward P/E of 20.90, reflecting valuation metrics aligned with industry averages. The company exhibits a profit margin of 21.56% and a return on equity of 33.93%, indicating solid profitability and efficient capital utilization. Revenue growth stands robust at 42.4% year-over-year, supported by a gross margin of 34.79%. The enterprise value to EBITDA ratio is 21.64, while the price-to-book ratio is elevated at 7.25, suggesting premium valuation relative to book value.
From a technical perspective, Suzlonâs stock shows mixed signals with recent volume surges and modest price gains. The company has recently undertaken strategic initiatives including leadership restructuring under the Suzlon 2.0 vision and secured a significant turbine order from Tata Power Renewable Energy, highlighting growth momentum. Strengths include strong institutional and retail investor interest, while risks involve market volatility and sector-specific challenges such as regulatory dynamics and competitive pressures.
In comparison to its Indian industry peers such as Kirloskar Brothers, Cummins India, Elgi Equipments, KSB Ltd., and Elecon Engineering, Suzlon maintains a competitive market capitalization and favorable return on equity. Its valuation metrics, including P/E and EV/EBITDA ratios, are generally lower than several peers, indicating relatively attractive valuation. However, Suzlonâs price-to-cash-flow ratio is notably higher, which may reflect differing cash flow dynamics or market sentiment. Peer companies exhibit a range of valuation and profitability profiles, positioning Suzlon within a diverse competitive landscape.
Suzlon Energy Ltd. navigates the evolving renewable energy landscape as a key contributor to sustainable infrastructure development. Recent achievements such as securing large-scale orders and leadership realignment underscore pivotal moments for the company. Ongoing challenges include managing valuation premiums and market fluctuations amid sector growth. The company stands to benefit from expanding renewable energy demand but must balance execution risks and competitive pressures. Given the current financial and technical data, a balanced approach emphasizing monitoring of operational and market developments may be appropriate for those assessing Suzlonâs equity.
Company and Industry Overview
Company Basics
Price Performance
Company Size
Shareholding Pattern
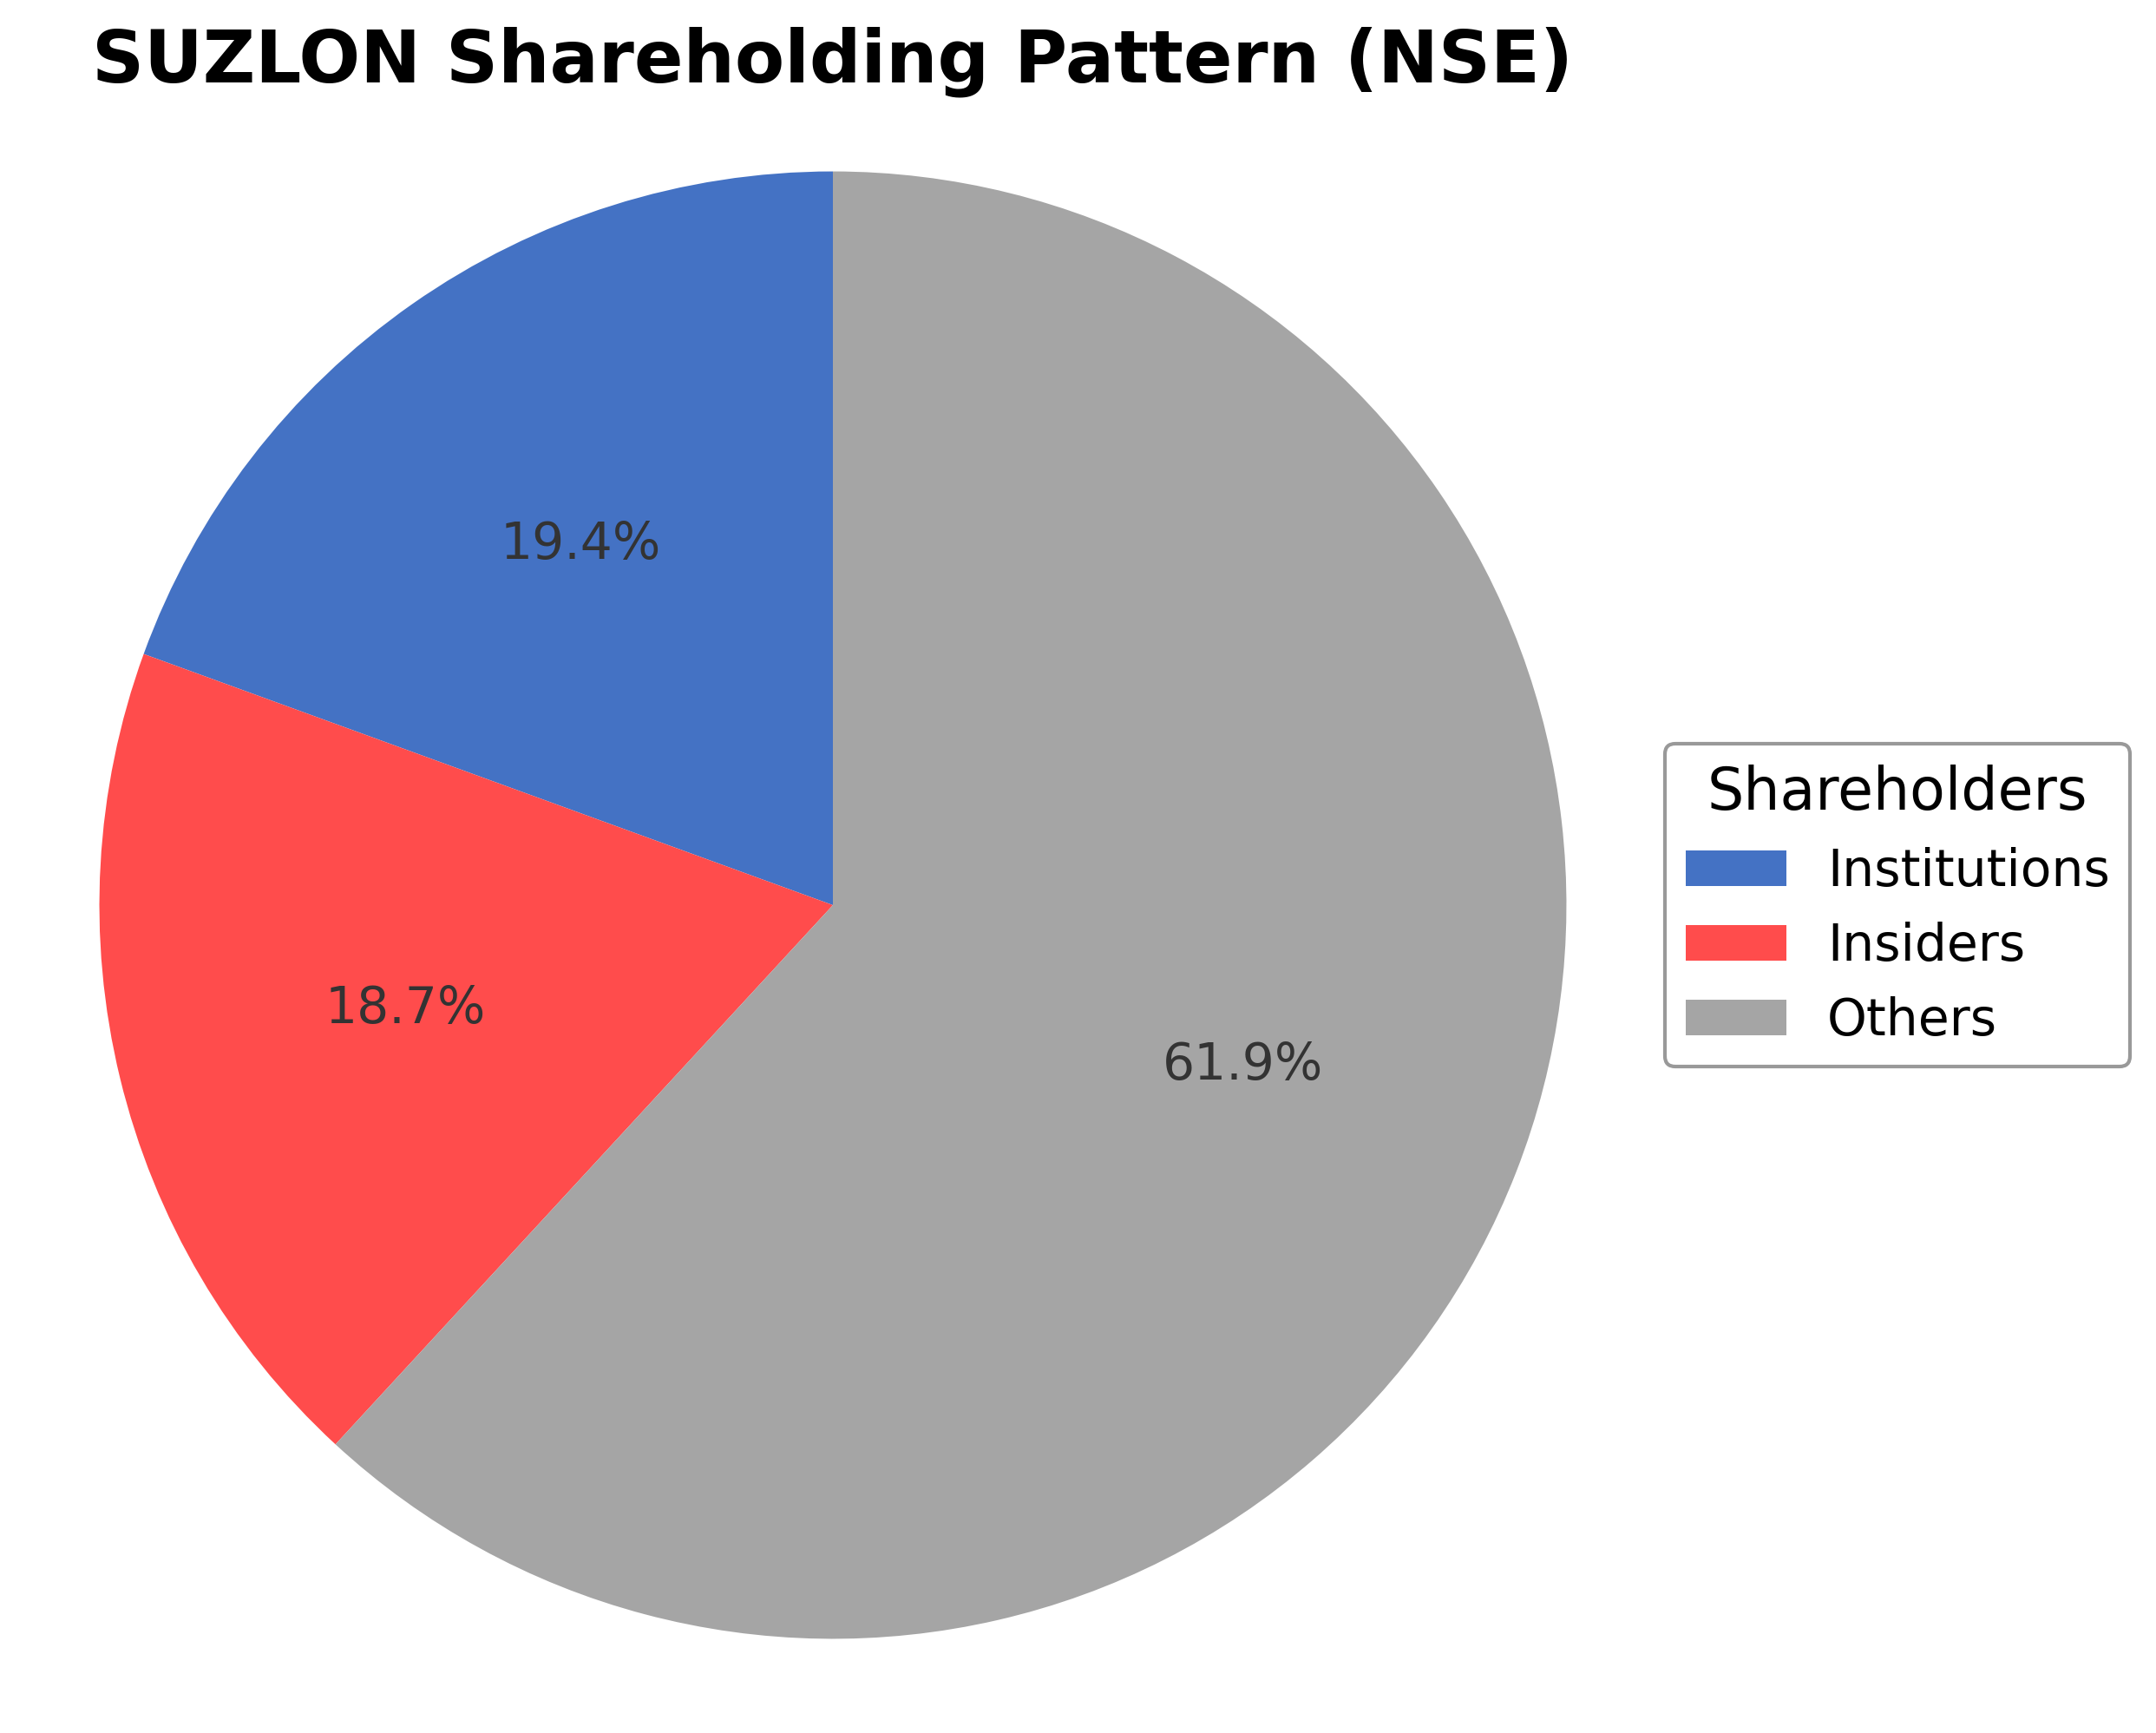
Suzlon Energy Ltd.'s ownership structure comprises approximately 18.70% held by insiders including executives and board members, 19.44% by institutional investors such as mutual funds and asset managers, and the remaining 61.86% by public shareholders including retail investors and employee stock plans. Over the past 12 to 24 months, institutional holdings have shown a moderate increase, reflecting growing confidence from major funds. This pattern suggests a balanced market sentiment with active participation from both insiders and institutions, supporting governance stability and strategic initiatives. The current ownership distribution positions Suzlon to leverage collaborative corporate actions while maintaining broad market engagement.
Sector and Industry Analysis
Suzlon Energy Ltd operates within the Capital Goods sector, specifically in the Electrical Equipment industry, with a focus on wind energy solutions. The sector is characterized by its critical role in infrastructure development and renewable energy transition. Globally and in India, the wind energy market has witnessed robust growth driven by increasing demand for clean energy, government incentives, and commitments to reduce carbon emissions. The Indian wind energy market alone is valued in billions of dollars, with annual installed capacity growth rates typically in the high single digits to low double digits, reflecting strong expansion prospects. Key players in this industry include Suzlon Energy, Vestas, Siemens Gamesa, and GE Renewable Energy, with Suzlon holding a significant market share domestically and expanding internationally.
Industry trends emphasize rapid technological advancements such as larger and more efficient turbines, digitalization for predictive maintenance, and integration with smart grids. Consumer behavior is shifting towards sustainable energy adoption, supported by corporate and governmental renewable energy targets. Emerging opportunities lie in offshore wind projects, hybrid renewable systems combining wind and solar, and energy storage solutions to address intermittency. Additionally, the declining cost of wind power generation and improvements in turbine technology enhance competitiveness against fossil fuels, further accelerating industry growth.
The regulatory landscape is pivotal in shaping the industry’s trajectory. In India, policies such as the National Wind-Solar Hybrid Policy, Renewable Energy Certificates (RECs), and accelerated depreciation benefits incentivize investment. Compliance with environmental clearances, grid connectivity standards, and local content requirements are mandatory. Internationally, adherence to evolving safety and quality standards, carbon credit mechanisms, and cross-border trade regulations impact operations. Government targets aiming for 500 GW of renewable energy capacity by 2030 underscore the policy-driven growth environment, although regulatory uncertainties and tariff structures remain areas to monitor.
Competitive dynamics in the wind energy equipment industry are marked by moderate to high entry barriers due to capital intensity, technological expertise, and established supply chains. Market structure tends toward oligopolistic competition with a few dominant global and regional players. Suzlon’s competitive positioning benefits from its integrated model spanning manufacturing, project development, and servicing, though it faces challenges from global incumbents with deeper R&D capabilities and scale economies. The industry also experiences pricing pressures and margin volatility linked to raw material costs and policy shifts. Strategic partnerships, innovation in turbine design, and after-sales service excellence are critical for sustaining market share and profitability.
Note: Analysis synthesized from industry research, market reports, and regulatory filings. Information is subject to change based on market conditions.
Illustrative Scenario Analysis
DCF Assumptions:
Method: Two-Stage EPS-Priority Model
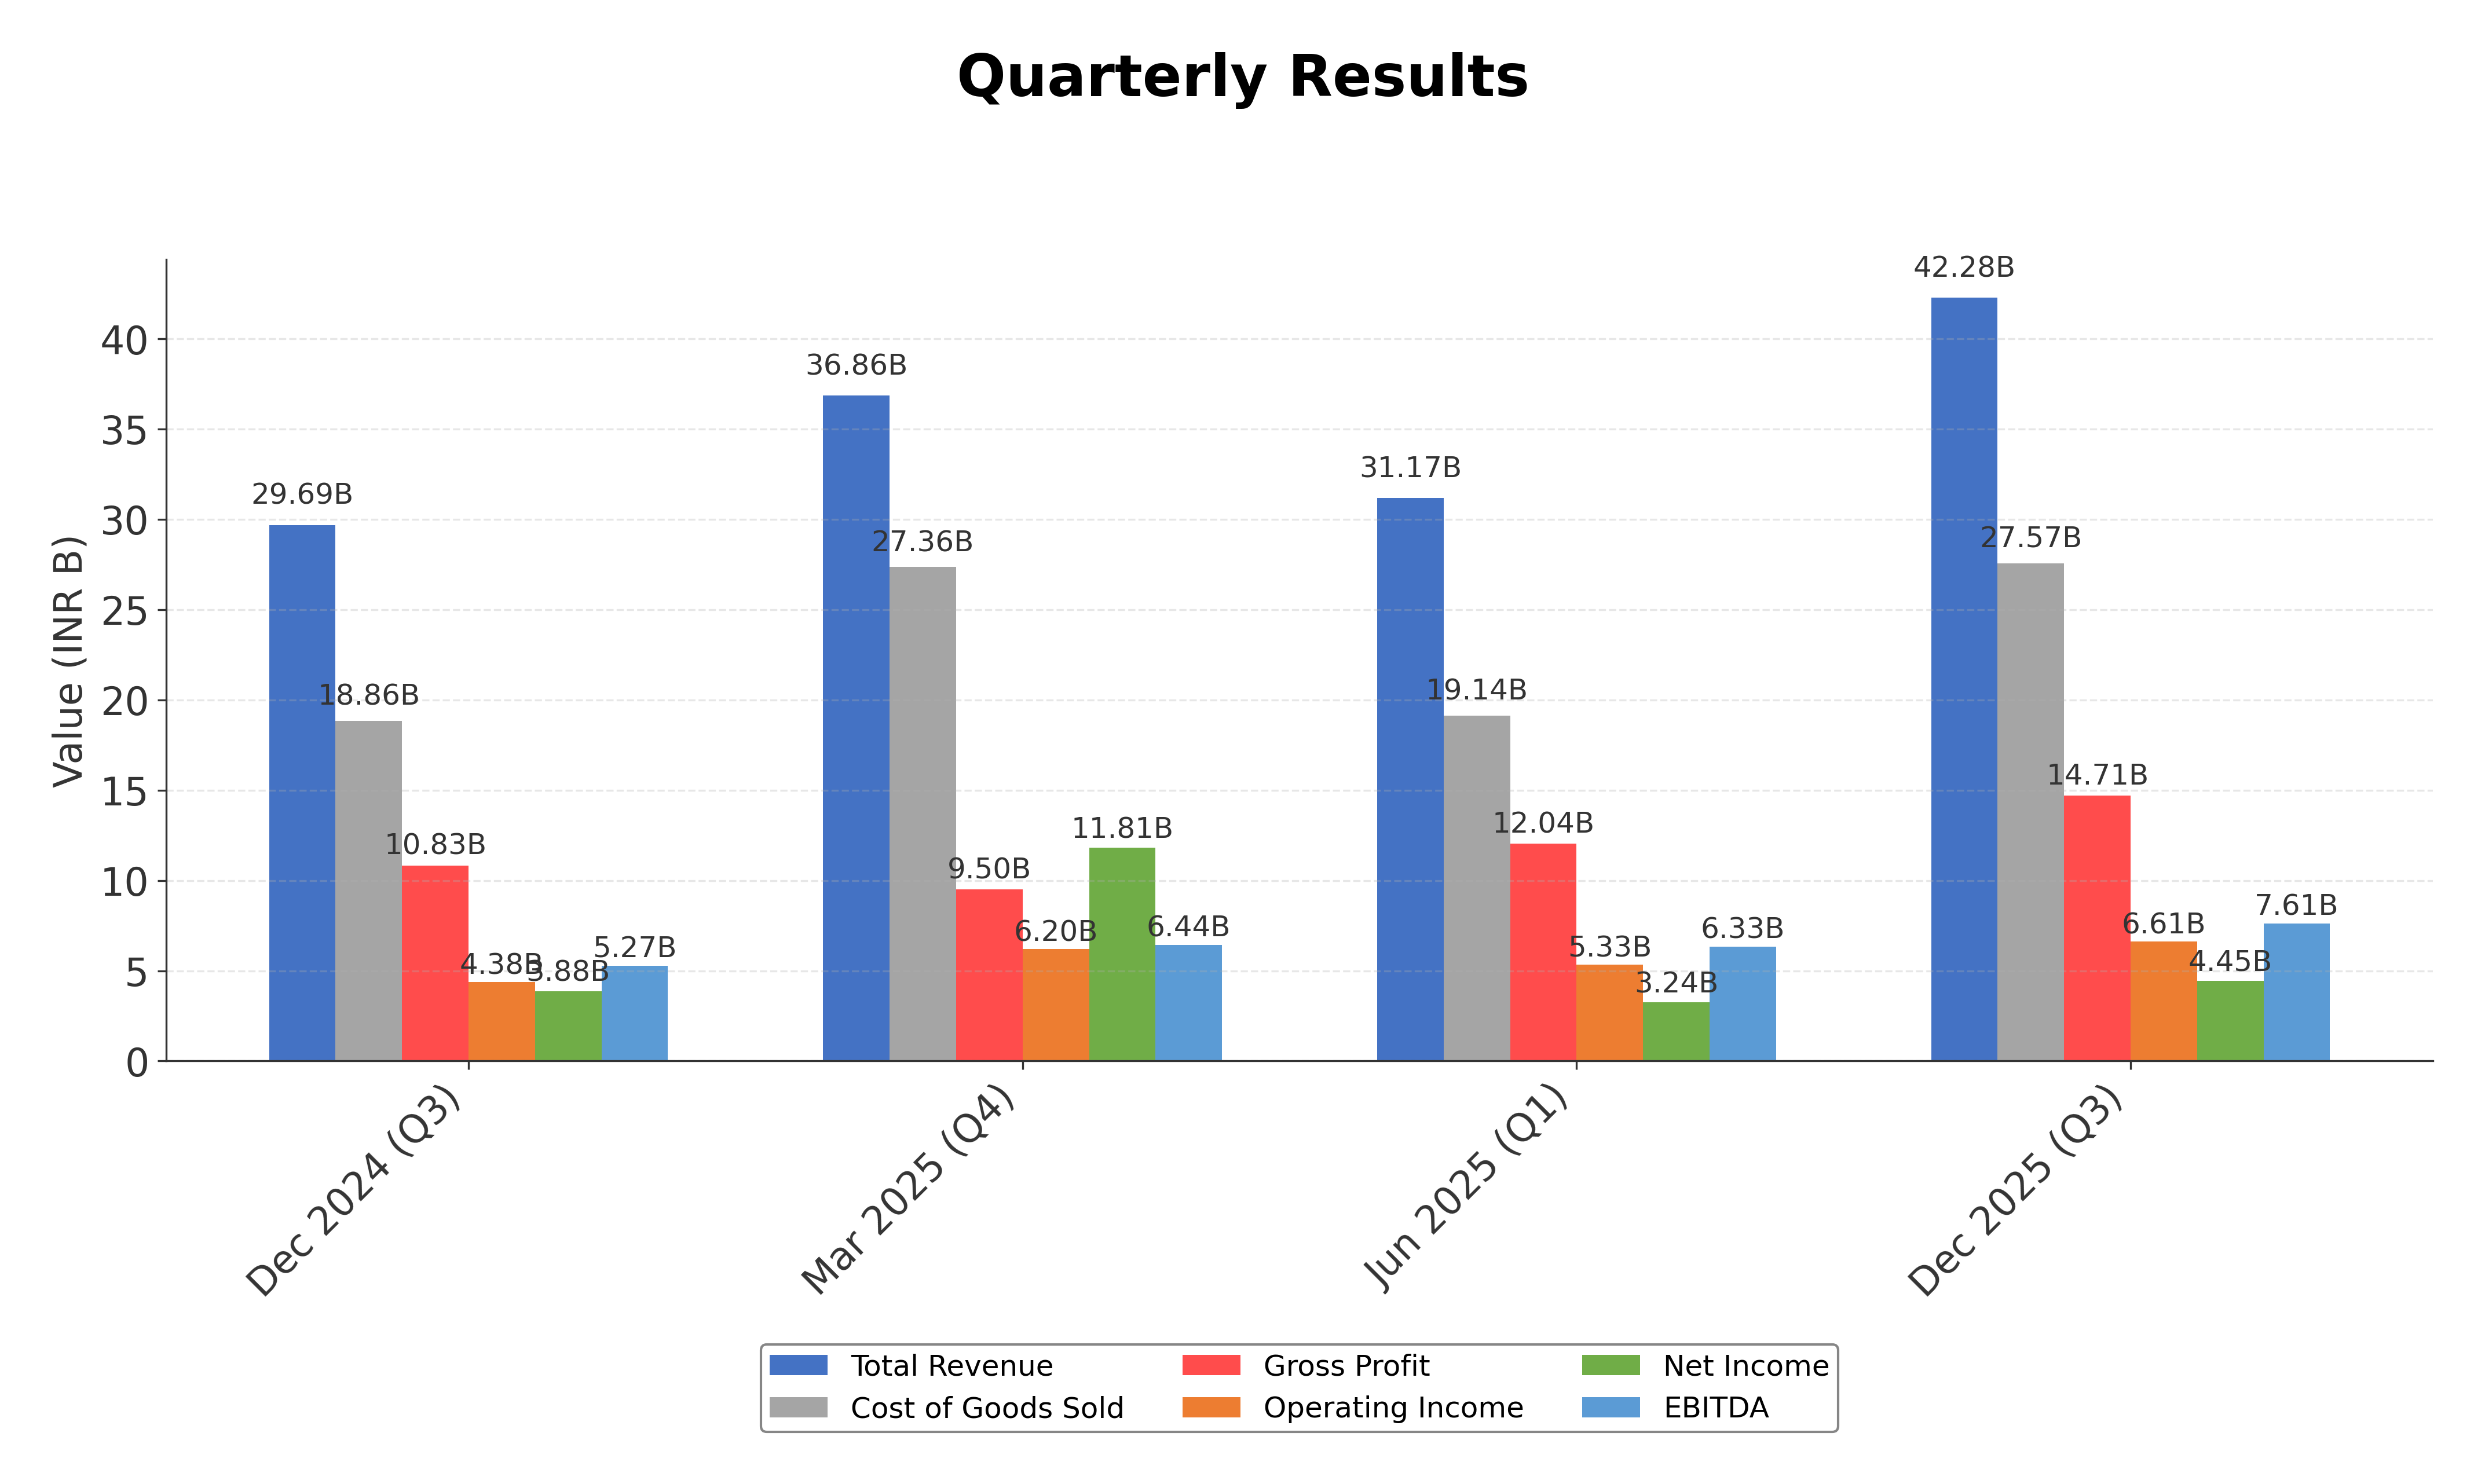
Financials
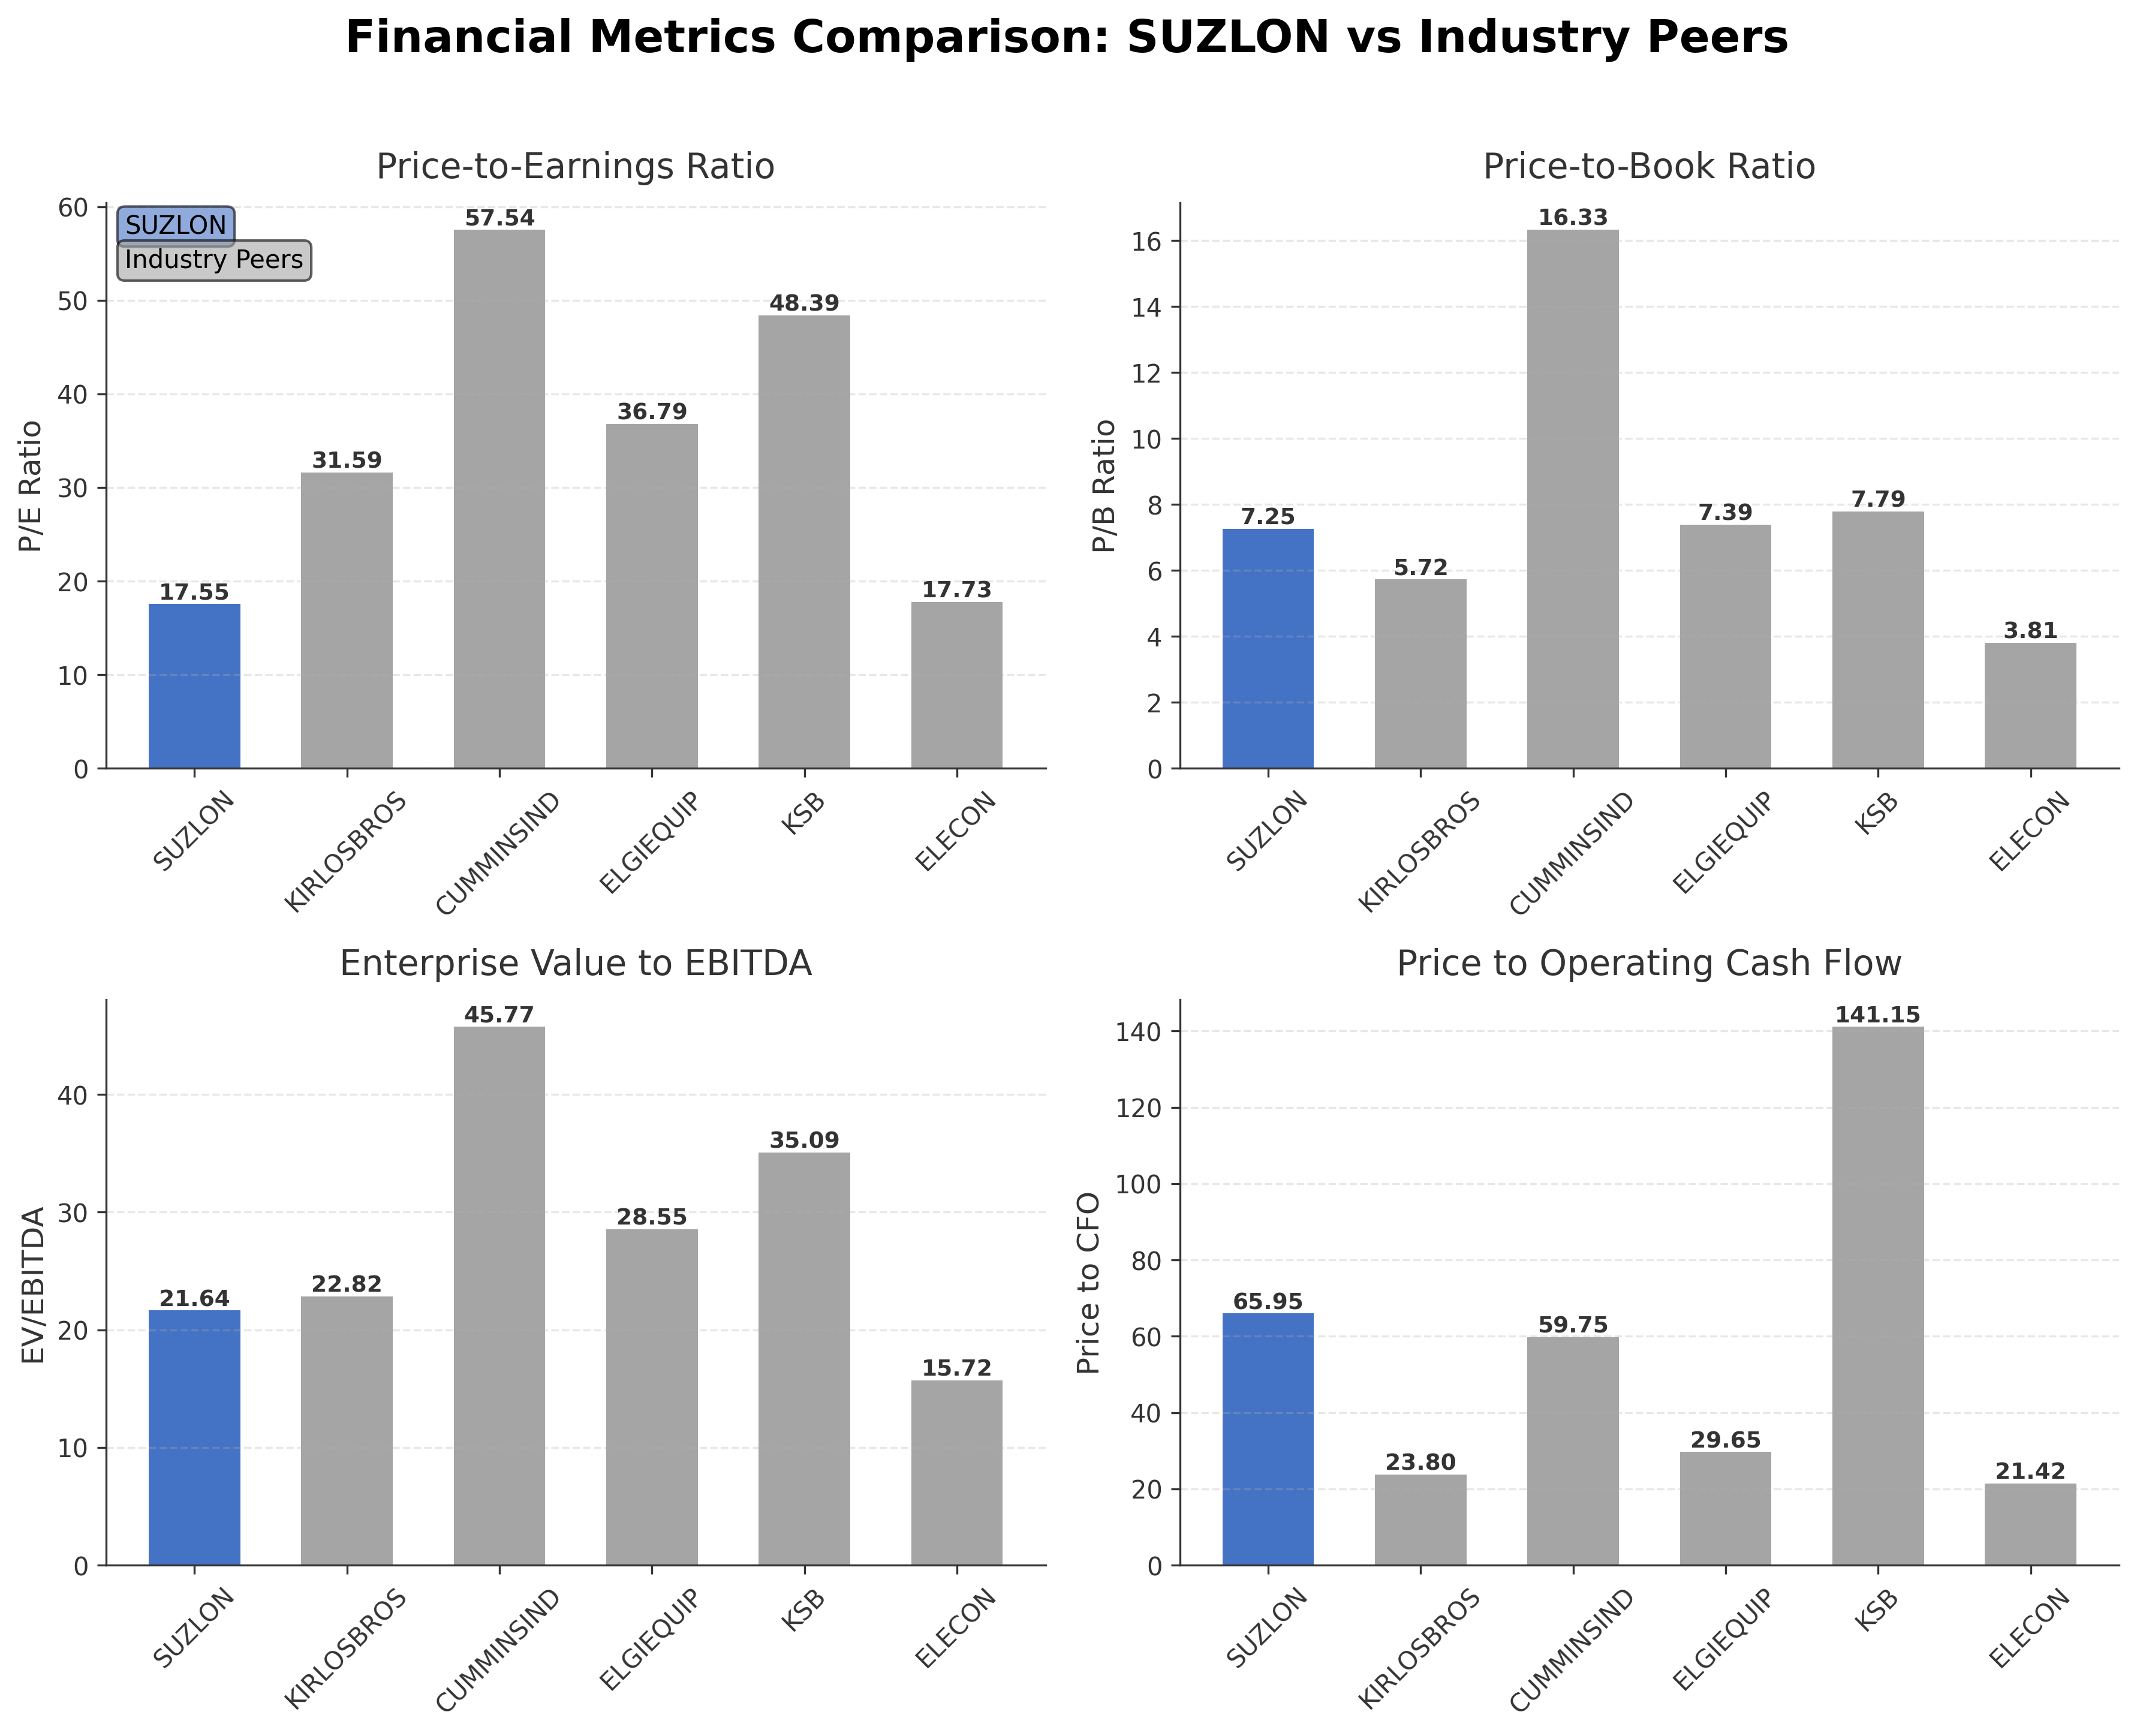
Peer Analysis
| Company Name | Market Cap | P/E Ratio | P/B Ratio | EV/EBITDA | Price to CFO |
|---|---|---|---|---|---|
| Suzlon Energy Ltd. | ₹567.93B | 17.55 | 7.25 | 21.64 | 65.95 |
| Kirloskar Brothers Limited | ₹120.74B | 31.59 | 5.72 | 22.82 | 23.80 |
| Cummins India Ltd. | ₹1.29T | 57.54 | 16.33 | 45.77 | 59.75 |
| Elgi Equipments Ltd. | ₹148.26B | 36.79 | 7.39 | 28.55 | 29.65 |
| KSB Ltd. | ₹130.70B | 48.39 | 7.79 | 35.09 | 141.15 |
| Elecon Engineering Co. Ltd. | ₹85.42B | 17.73 | 3.81 | 15.72 | 21.42 |
Comparison Analysis: Suzlon Energy Ltd. demonstrates a competitive position within the Indian specialty industrial machinery sector, with a market capitalization significantly larger than most peers except Cummins India. Its P/E ratio of 17.55 is notably lower than several peers, indicating a more moderate valuation relative to earnings. The company’s return on equity at 33.93% surpasses all listed peers, reflecting strong profitability and efficient equity utilization. However, Suzlon’s price-to-cash-flow ratio is substantially higher than peers, suggesting differing cash flow profiles or market perceptions. Overall, Suzlon balances favorable profitability with moderate valuation metrics compared to regional competitors.
Financial Metrics Comparison with Peers
Financial Statements
Comprehensive financial data including income, balance sheet, and cash flow metrics
Income Statement
| fiscal_date | 2025-03-31 | 2024-03-31 | 2023-03-31 | 2022-03-31 | 2021-03-31 |
|---|---|---|---|---|---|
| Sales | 107.63B | 64.97B | 59.47B | 65.20B | 32.95B |
| Cost Of Goods | 71.77B | 42.03B | 40.00B | 45.43B | 17.04B |
| Gross Profit | 35.86B | 22.94B | 19.46B | 19.77B | 15.90B |
| Operating Expense Research And Development | 55.10M | 101.90M | 72.30M | 41.30M | 59.60M |
| Operating Expense Selling General And Administrative | 2.56B | 1.28B | 990.90M | 1.43B | 1.05B |
| Operating Expense Other Operating Expenses | 4.45B | 3.53B | 3.15B | 3.83B | 3.83B |
| Operating Income | 16.18B | 8.57B | 5.96B | 6.31B | 3.01B |
| Non Operating Interest Income | 1.03B | 383.00M | 196.30M | 221.90M | 198.70M |
| Non Operating Interest Expense | 1.06B | 1.06B | 3.83B | 7.03B | 9.57B |
| Pretax Income | 14.47B | 6.59B | 28.92B | 4.00M | 1.05B |
| Income Tax | -6.25B | -8.60M | 44.20M | 1.67B | 46.30M |
| Net Income | 20.72B | 6.60B | 28.87B | -1.77B | 1.04B |
| Eps Basic | 1.52 | 0.50 | 2.64 | -0.21 | 0.13 |
| Eps Diluted | 1.51 | 0.50 | 2.64 | -0.21 | 0.11 |
| Basic Shares Outstanding | 13.64B | 13.15B | 10.78B | 9.29B | 8.26B |
| Diluted Shares Outstanding | 13.64B | 13.15B | 10.78B | 9.29B | 8.26B |
| Ebit | 15.52B | 7.65B | 32.75B | 7.03B | 10.62B |
| Ebitda | 18.76B | 10.17B | 8.31B | 9.35B | 5.35B |
| Net Income Continuous Operations | 14.47B | 6.59B | 28.92B | 4.00M | 1.05B |
| Minority Interests | 0.00 | 0.00 | -382.80M | -230.40M | 5.90M |
| Preferred Stock Dividends | 0.00 | 0.00 | 0.00 | 0.00 | 0.00 |
Data provided by Twelve Data
Balance Sheet
| fiscal_date | 2025-03-31 | 2024-03-31 | 2023-03-31 | 2022-03-31 | 2021-03-31 |
|---|---|---|---|---|---|
| Cash And Cash Equivalents | 9.01B | 2.50B | 3.67B | 4.37B | 2.62B |
| Accounts Receivable | 38.66B | 18.30B | 11.70B | 13.77B | 11.90B |
| Total Assets | 129.60B | 71.79B | 55.23B | 64.75B | 66.01B |
| Total Liabilities | 68.54B | 32.59B | 44.24B | 100.37B | 100.02B |
| Long Term Debt | 5.71B | 659.50M | 15.35B | 56.50B | 60.82B |
| Shareholders Equity | 61.06B | 39.20B | 10.99B | -35.62B | -34.01B |
Data provided by Twelve Data
Cash Flow Statement
| fiscal_date | 2025-03-31 | 2024-03-31 | 2023-03-31 | 2022-03-31 | 2021-03-31 |
|---|---|---|---|---|---|
| Operating Activities Net Income | 14.47B | 6.59B | 28.92B | 4.00M | 1.05B |
| Operating Activities Stock Based Compensation | 1.15B | 291.40M | 0.00 | N/A | N/A |
| Operating Activities Other Non Cash Items | 1.90B | 2.67B | -21.35B | 7.61B | 1.55B |
| Operating Activities Accounts Receivable | -20.07B | -6.77B | 1.93B | -2.30B | 677.60M |
| Operating Activities Other Assets Liabilities | 11.17B | -3.84B | -7.12B | 3.88B | -2.27B |
| Operating Activities Operating Cash Flow | 8.61B | -1.06B | 2.38B | 9.19B | 1.01B |
| Investing Activities Capital Expenditures | -3.68B | -2.26B | -142.00M | -758.20M | -489.80M |
| Investing Activities Net Acquisitions | -4.41B | 436.80M | 769.60M | 106.70M | 0.00 |
| Investing Activities Purchase Of Investments | -725.00M | -397.20M | 0.00 | N/A | N/A |
| Investing Activities Sale Of Investments | 383.60M | 314.90M | 0.00 | N/A | N/A |
| Investing Activities Investing Cash Flow | -8.44B | -1.91B | 729.30M | -552.20M | -356.50M |
| Financing Activities Long Term Debt Issuance | 1.05B | 0.00 | 30.29B | 0.00 | 499.80M |
| Financing Activities Long Term Debt Payments | -439.30M | -18.02B | -43.84B | -5.75B | -1.91B |
| Financing Activities Short Term Debt Issuance | -230.60M | -17.90M | 152.40M | -1.49B | -1.18B |
| Financing Activities Common Stock Issuance | 221.60M | 20.65B | 10.80B | 0.00 | 3.42B |
| Financing Activities Other Financing Charges | 4.11B | N/A | N/A | N/A | N/A |
| Financing Activities Financing Cash Flow | 4.72B | 2.62B | -2.59B | -7.23B | 822.40M |
| End Cash Position | 11.13B | 4.27B | 3.67B | 5.00B | 2.62B |
| Free Cash Flow | 7.21B | -1.48B | 3.90B | 12.25B | 4.79B |
| Investing Activities Other Investing Activity | N/A | N/A | 101.70M | 99.30M | 133.30M |
Data provided by Twelve Data
Technical Analysis
Key Insights
- The current trend shows mixed price action with recent volume surges but modest upward price movement, indicating cautious market participation.
- Key support levels are observed near ₹38.19, the 52-week low, while resistance is noted around ₹46.16 and ₹55.54, corresponding to the 50-day and 200-day moving averages respectively.
- The stock price is currently below the 200-day moving average at ₹55.54 and slightly below the 50-day moving average at ₹46.16, suggesting a neutral to slightly bearish medium-term trend.
- Momentum indicators such as RSI and MACD display mixed signals, with RSI near neutral levels and MACD showing limited divergence, reflecting balanced momentum.
- Multi-timeframe analysis indicates consolidation on daily charts with potential for volatility on weekly and monthly timeframes due to recent volume spikes.
- Potential market scenarios include a continuation of sideways movement with possible breakouts if volume sustains or a retracement towards support levels if momentum weakens.
Trending News
1. Headline: Suzlon Energy Ltd Sees Exceptional Volume Surge Amid Mixed Technical Signals
Summary: Suzlon Energy Ltd (SUZLON), a mid-cap player in the Heavy Electrical Equipment sector, witnessed one of the highest trading volumes on 16 Mar 2026, with over 1.95 crore shares exchanging hands. Despite a modest price gain of 0.68%, the stock’s volume surge and technical indicators reveal ...
Sentiment: positive
Summary: In the last three months, the stock price dropped 22%, going from Rs 53 to Rs 41. FII holding increased to 23.73% in December from 22.71% in September ’25, and retail holding rose to 26.20% from 25.89%. Suzlon Energy
Sentiment: positive
Summary: In the energy segment, he believes Tata Power Company Ltd could see strong performance after a prolonged consolidation phase. "Tata Power has been consolidating for nearly one and a half years. After this consolidation, the stock may witness good outperformance going ahead," Jain said. With that being said, Jain remains cautious on Suzlon ...
Sentiment: positive
4. Headline: Suzlon, YES Bank, VIL, Tata Motors: 17 of 20 top retail favourite stocks fall amid Iran war - BusinessToday
Summary: Tata Steel Ltd, HDFC Bank Ltd and Jio Financial Services Ltd, some of the retail favourite stocks have fallen 5-9 per cent this month. Stocks such as Reliance Power Ltd, NHPC Ltd and Suzlon Energy Ltd fared relatively better, falling 0.5-1.5 per cent against Sensex and Nifty falls of 7.3-7.6 ...
Sentiment: negative
5. Headline: Why Are NTPC Green, KPI, JSW, Adani Green Suzlon Rising? Green Energy Stock Market Crash Iran-US War - Goodreturns
Summary: Green Energy Stocks Defy Market Crash Amid Iran-US War: Why Are NTPC Green, KPI, JSW, Adani and Suzlon Rising?
Sentiment: negative
6. Headline: Buy, Sell Or Hold: Paras Defence, Suzlon, Quality Power, Happiest Minds, Sarda Energy — Ask Profit
Summary: Should you add shares of Paras Defence and Space Technologies Ltd.? Should you hold shares of Suzlon Energy Ltd.at the current market price?
Sentiment: neutral
7. Headline: Suzlon Energy Ltd gains for third straight session | Capital Market News - Business Standard
Summary: Suzlon Energy Ltd is quoting at Rs 43.05, up 3.44% on the day as on 12:49 IST on the NSE. The stock is down 21.12% in last one year as compared to a 5.92% jump in NIFTY and a 16.88% jump in the Nifty Energy index.
Sentiment: positive
8. Headline: Suzlon, BHEL, Tata Power, Adani Power, JSW Energy, ACME Solar, among 11 stocks to buy; target prices - BusinessToday
Summary: StocksSuzlon, BHEL, Tata Power, Adani Power, JSW Energy, ACME Solar, among 11 stocks to buy; target prices ... Equipment manufacturer Bharat Heavy Electricals Ltd (BHEL): Target price Rs 355, 'Buy' and Suzlon Energy Ltd: target price Rs 64, 'Buy'.
Sentiment: neutral
9. Headline: Suzlon allots 77,000 shares under ESOP 2022, marginally lifts paid-up capital - TipRanks.com
Summary: Suzlon Energy Ltd ( ($IN:SUZLON) ) has provided an update. Suzlon Energy Limited has allotted 77,000 fully paid-up equity shares following the exercise of employee ...
Sentiment: positive
10. Headline: Suzlon Energy: MOFSL meets management, cuts valuation multiple and revises target price - BusinessToday
Summary: MOFSL, which met Suzlon Energy Ltd Executive Vice Chairman Girish Tanti and CFO Rahul Jain to discuss the recent leadership restructuring under the Suzlon 2.0 vision, has cut its valuation multiple on the stock to 27 times from 30 times earlier, which is broadly in line with its historical ...
Sentiment: negative
Powered by Brave
Recent Updates
News Summary
Recent news surrounding Suzlon Energy Ltd highlights a combination of strong trading activity, strategic growth, and market positioning within the renewable energy sector. The company experienced exceptional volume surges indicating heightened market interest, alongside steady gains over consecutive sessions. Suzlon’s commitment to sustainability is underscored by its pledge to power all manufacturing facilities with 100% renewable energy by 2030. Additionally, the company secured its largest turbine order for fiscal year 2026 from Tata Power Renewable Energy, signaling robust demand and operational expansion. These developments occur amid a dynamic market environment characterized by geopolitical tensions and sector-specific volatility, influencing investor sentiment and stock performance.
News Sentiment
Overall sentiment is moderately positive, reflecting confidence in Suzlon’s strategic initiatives and market opportunities. Positive news on volume surges, order wins, and sustainability commitments contrasts with cautious views on valuation and market volatility. Sentiment varies across sources but trends towards optimism about Suzlon’s growth prospects and resilience in a competitive renewable energy landscape.
Analytical Overview
Analysis Summary
Valuation Metrics: Suzlon Energy’s trailing P/E ratio of 17.55 aligns closely with the industry average, while the forward P/E of 20.90 suggests moderate expectations for earnings growth. The PEG ratio of 0.15 indicates valuation relative to growth is favorable compared to peers.
Growth Trajectory: The company’s revenue growth of 42.4% year-over-year and positive quarterly earnings growth of 15.1% demonstrate a strong upward trajectory. Operating cash flow and free cash flow figures further support healthy cash generation.
Financial Health: Suzlon maintains a current ratio of 1.75 indicating adequate short-term liquidity. However, the total debt to equity ratio of 5.05 reflects a relatively high leverage level, which warrants monitoring. Cash reserves of approximately ₹9.03 billion provide some financial flexibility.
Sector Specific Factors: The renewable energy sector in India benefits from supportive regulatory frameworks and increasing demand for sustainable solutions. Suzlon’s leadership in wind energy positions it well to capitalize on these trends, though competition and policy shifts remain relevant considerations.
Market Positioning: Suzlon’s comprehensive service offerings and recent large turbine order from Tata Power underscore competitive advantages in technology and market reach within the Indian renewable energy landscape.
Investment Conclusion
Supporting Factors: Robust revenue growth of 42.4% and strong return on equity at 33.93% indicate operational strength.
Risk Factors: High debt-to-equity ratio of 5.05 presents financial leverage risks.
SWOT Analysis
Strengths
- Strong market position in the renewable energy sector with comprehensive wind turbine solutions.
- Robust revenue growth of 42.4% and high return on equity at 33.93%.
- Established presence in both domestic and international markets.
- Significant institutional and retail investor participation supporting governance.
Weaknesses
- High debt-to-equity ratio of 5.05 indicating elevated financial leverage.
- Price-to-cash-flow ratio significantly higher than peers, suggesting cash flow concerns.
- Stock price trading below 200-day moving average indicating medium-term weakness.
- Negative retained earnings reflecting historical accumulated losses.
Opportunities
- Growing demand for renewable energy in India supported by favorable regulations.
- Recent large turbine order from Tata Power Renewable Energy signaling expansion potential.
- Commitment to 100% renewable energy for manufacturing facilities by 2030 enhancing sustainability profile.
- Potential to leverage technological advancements for improved efficiency.
Threats
- Market volatility influenced by geopolitical tensions and sector-specific risks.
- Competitive pressures from domestic and international renewable energy firms.
- Regulatory changes that could impact project approvals and subsidies.
- Economic fluctuations affecting capital expenditure in the energy sector.
Company Description
Suzlon Energy Ltd. is a leading renewable energy company specializing in the production of wind turbines. Its primary function is to provide sustainable energy solutions by harnessing wind energy, contributing significantly to the global energy transition towards renewable sources. Suzlon Energy's offerings include a range of wind turbines with varied technologies and capacities aimed at maximizing efficiency and performance. The company operates primarily across the wind energy sector but also plays a role in other green energy initiatives. Its market significance is underscored by its comprehensive service portfolio which includes installation, maintenance, and wind resource assessment, making it a holistic solutions provider in the renewable energy space. Suzlon Energy Ltd. has established a presence in both domestic and international markets, supporting the growth of clean energy infrastructure worldwide.