
Suzlon Energy Ltd (SUZLON)
Stock Analysis Report
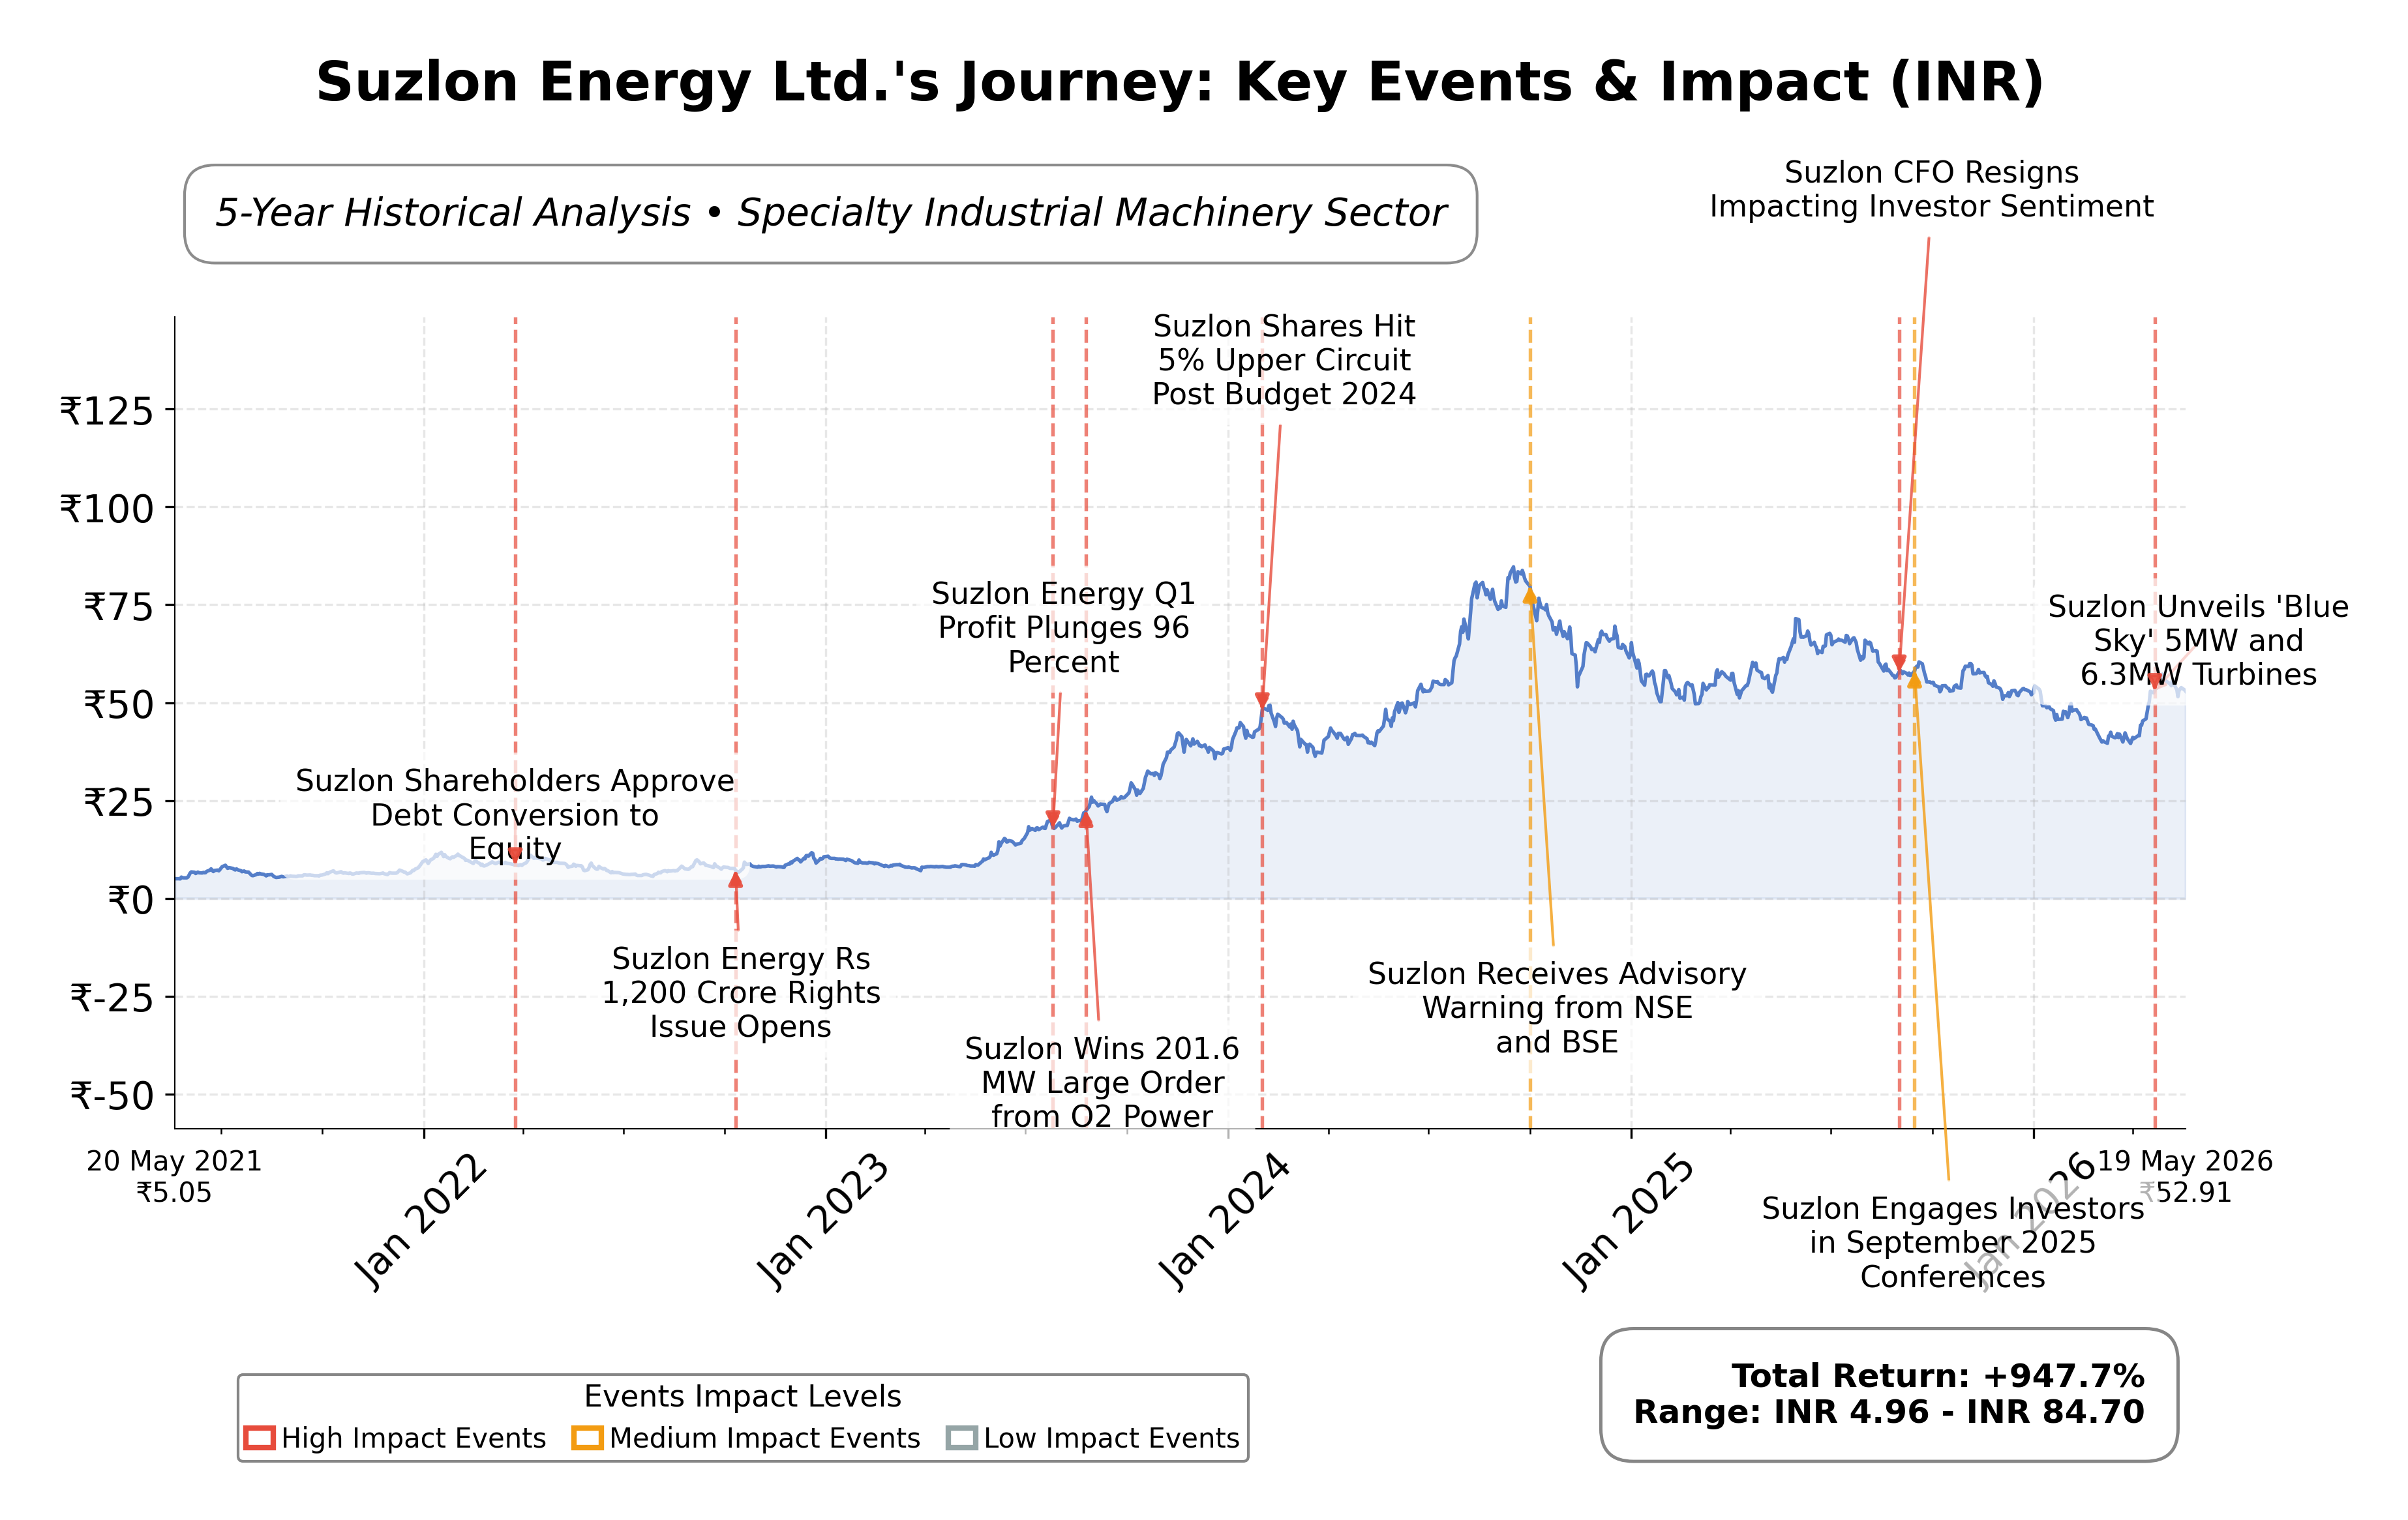
Stock Journey
Key Positives and Key Risks
Pros
- Strong return on equity at 33.93% indicating efficient use of shareholder capital.
- Robust quarterly revenue growth of 42.4% reflecting accelerating business momentum.
- Positive levered free cash flow of INR 20.72 billion supporting operational liquidity.
Cons
- High debt-to-equity ratio of 5.05 signaling elevated financial leverage risk.
- Price-to-book ratio of 9.42 suggests the stock is trading at a premium relative to book value.
- Price to cash flow ratio of 85.75 indicates a high valuation compared to cash flow generation.
Disclosure: This information is for general awareness and does not constitute investment advice
Report Summary
Suzlon Energy Ltd. is a prominent player in the renewable energy sector, specializing in the design, manufacture, and servicing of wind turbines. Listed on the National Stock Exchange of India (NSE) under the symbol SUZLON, the company operates within the Industrials sector, specifically focusing on Specialty Industrial Machinery. Suzlon’s comprehensive offerings include wind turbine production, installation, maintenance, and wind resource assessment, positioning it as an integrated solutions provider in the global renewable energy market. Its presence spans domestic and international markets, with a strategic emphasis on expanding its footprint in Europe and other key regions.
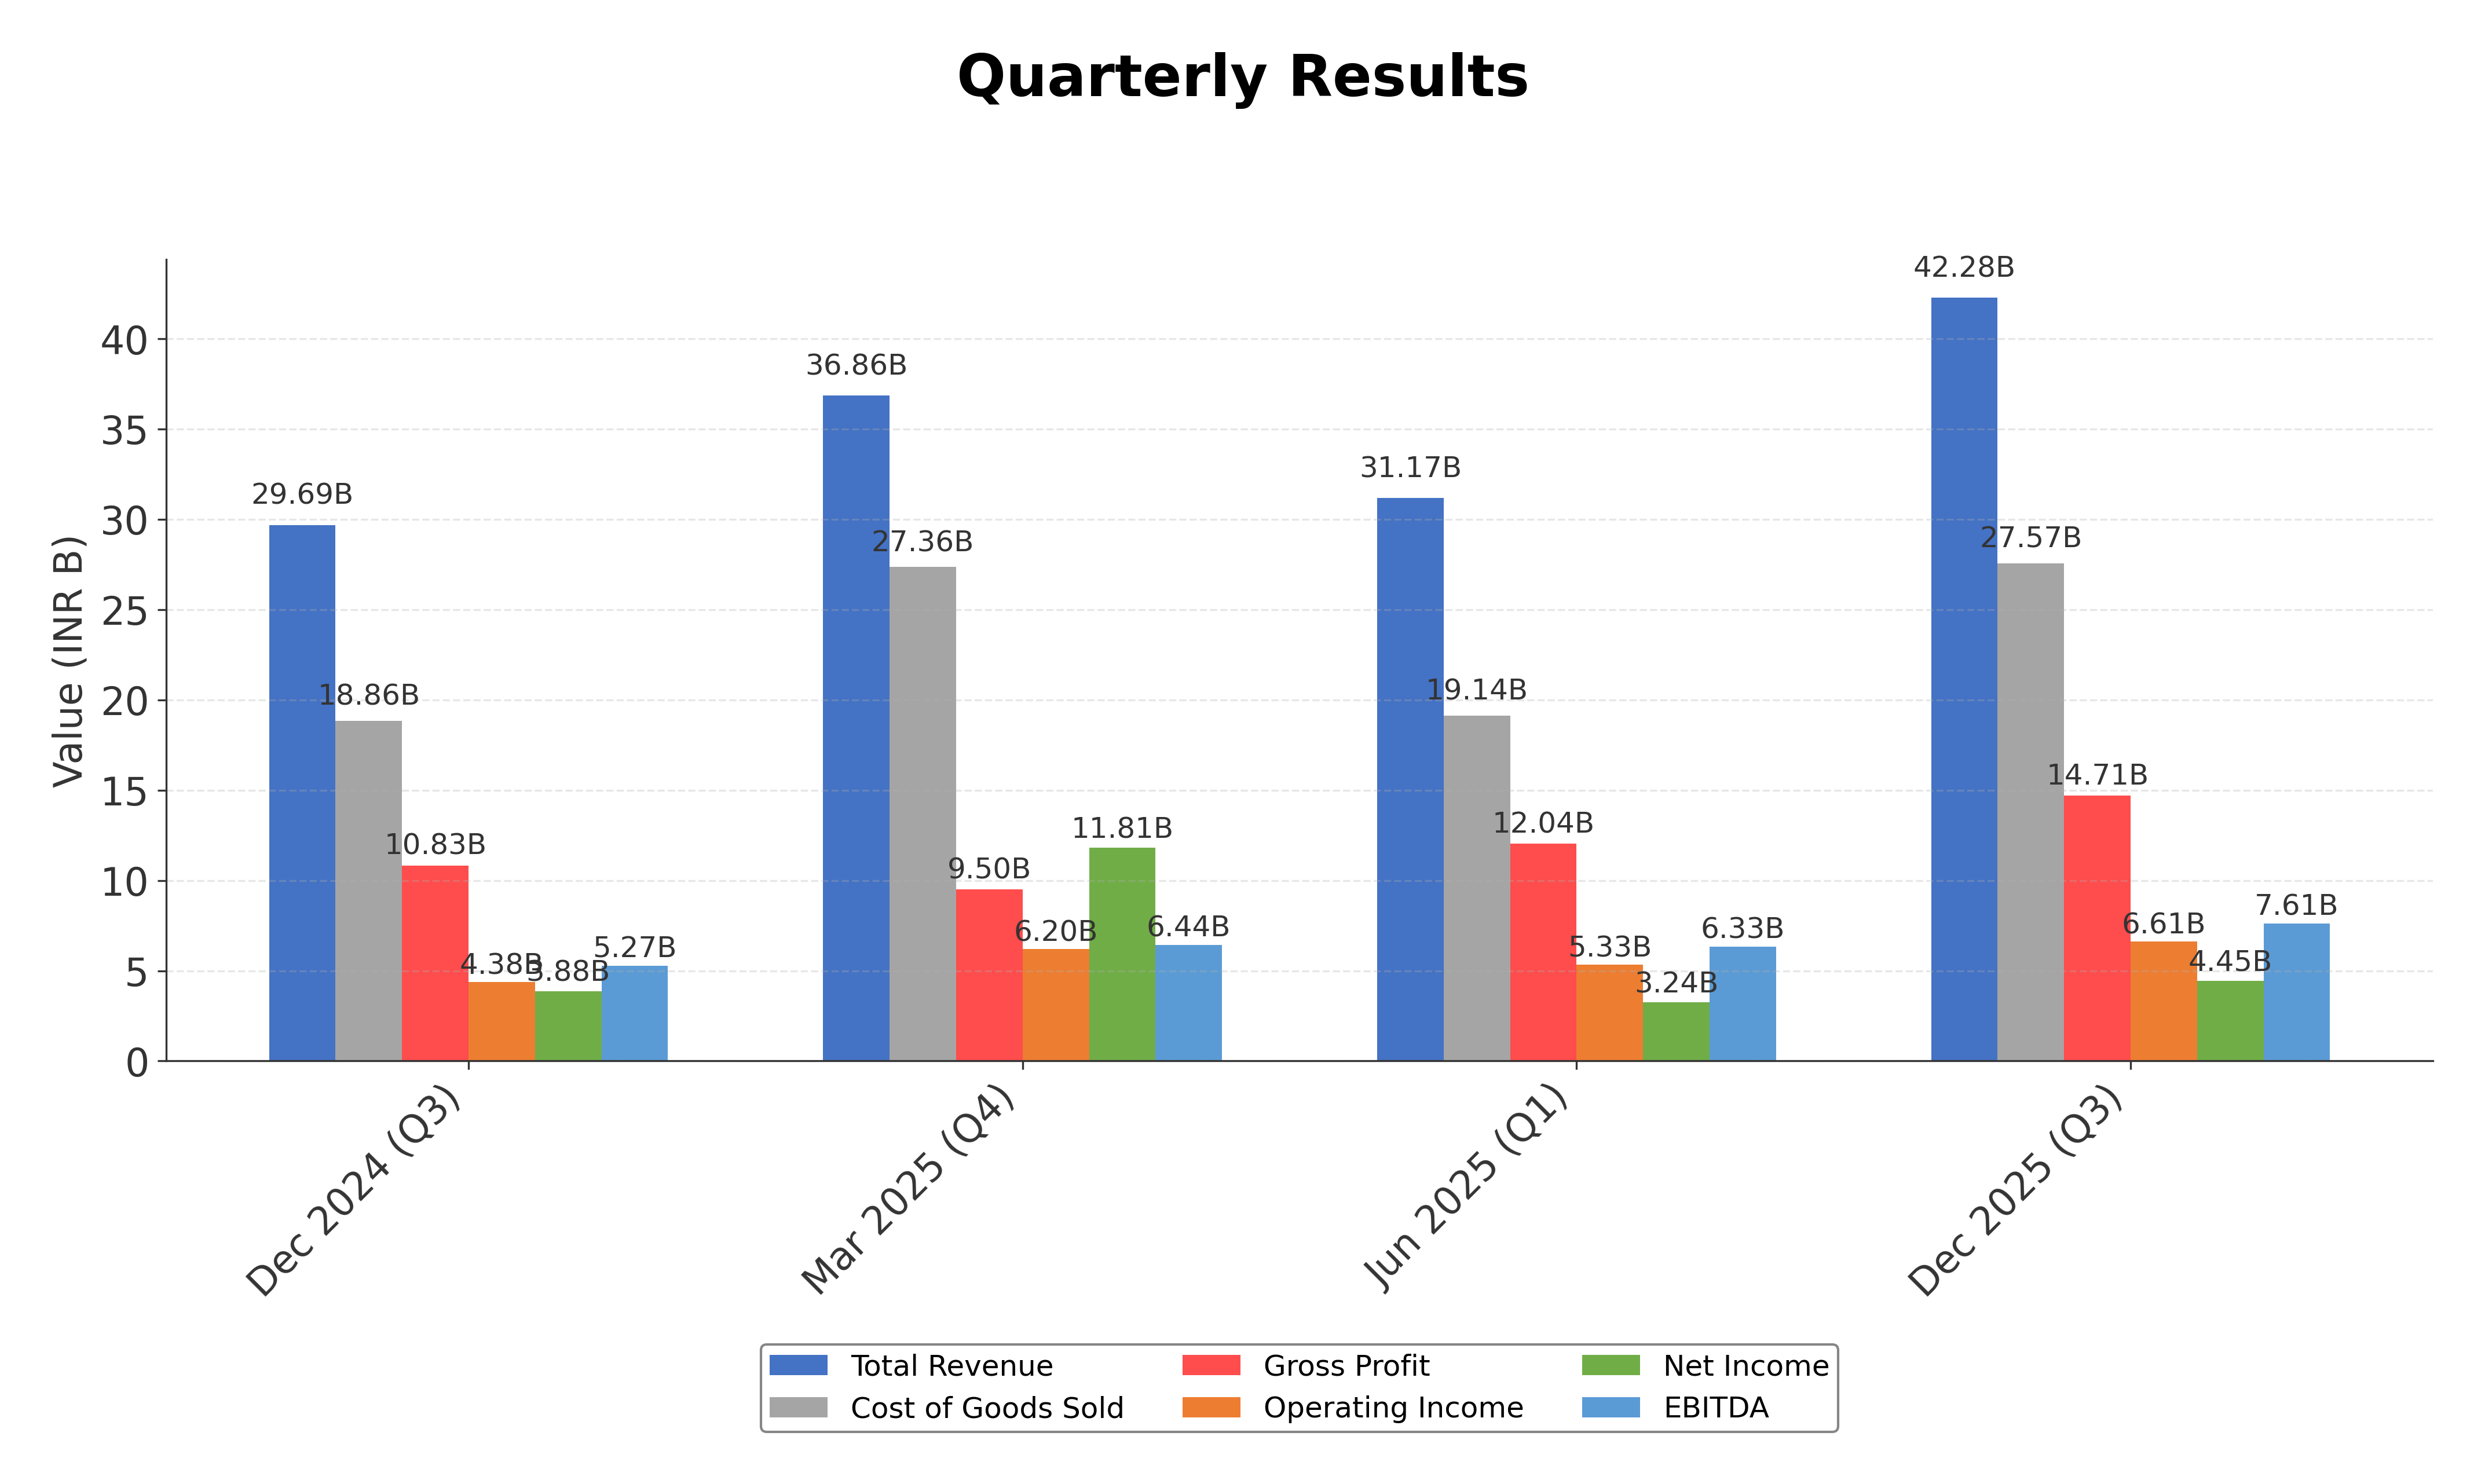
Financially, Suzlon reported trailing twelve months (TTM) revenue of approximately INR 149.85 billion, with a gross margin of 34.79%, operating margin of 15.64%, and a net profit margin of 21.56%. The company demonstrates strong profitability and operational efficiency, supported by a return on equity (ROE) of 33.93% and return on assets (ROA) of 15.99%. Its return on invested capital (ROIC) is reflected in an enterprise value to EBITDA ratio of 27.32, indicating moderate capital efficiency relative to earnings. Quarterly revenue growth stands robust at 42.4%, complemented by a 15.1% year-over-year earnings growth, signaling positive momentum.
From a valuation perspective, Suzlon’s trailing price-to-earnings (P/E) ratio is 22.81, closely aligned with the industry average, while the forward P/E is higher at 27.24, reflecting anticipated earnings growth. The price-to-book (P/B) ratio is elevated at 9.42, suggesting a premium valuation relative to book value. The market capitalization is approximately INR 738.45 billion, with the stock currently trading at INR 52.64 within a 52-week range of INR 38.19 to INR 74.30. This places the current price below the annual high, indicating some downside risk relative to the peak.
Suzlon’s strengths include strong cash flow generation with operating cash flow of INR 8.61 billion and levered free cash flow of INR 20.72 billion, alongside a manageable debt level with total debt of INR 3.97 billion and a current ratio of 1.75. The company’s strategic initiatives, such as its return to the European market and employee stock option allotments, underscore its growth orientation and talent retention efforts. Key risks include sectoral competition, regulatory changes in renewable energy policies, and market volatility impacting stock performance.
Technically, Suzlon’s stock shows mixed signals with price currently below the 200-day moving average of INR 51.66 but above the 50-day moving average of INR 47.18. Momentum indicators suggest moderate investor interest amid recent price corrections following a strong rally. Overall, the data suggests a cautious stance with potential for accumulation in favorable market conditions, balanced by the need to monitor valuation and sector dynamics closely.
Company and Industry Overview
Company Basics
Price Performance
Company Size
Shareholding Pattern
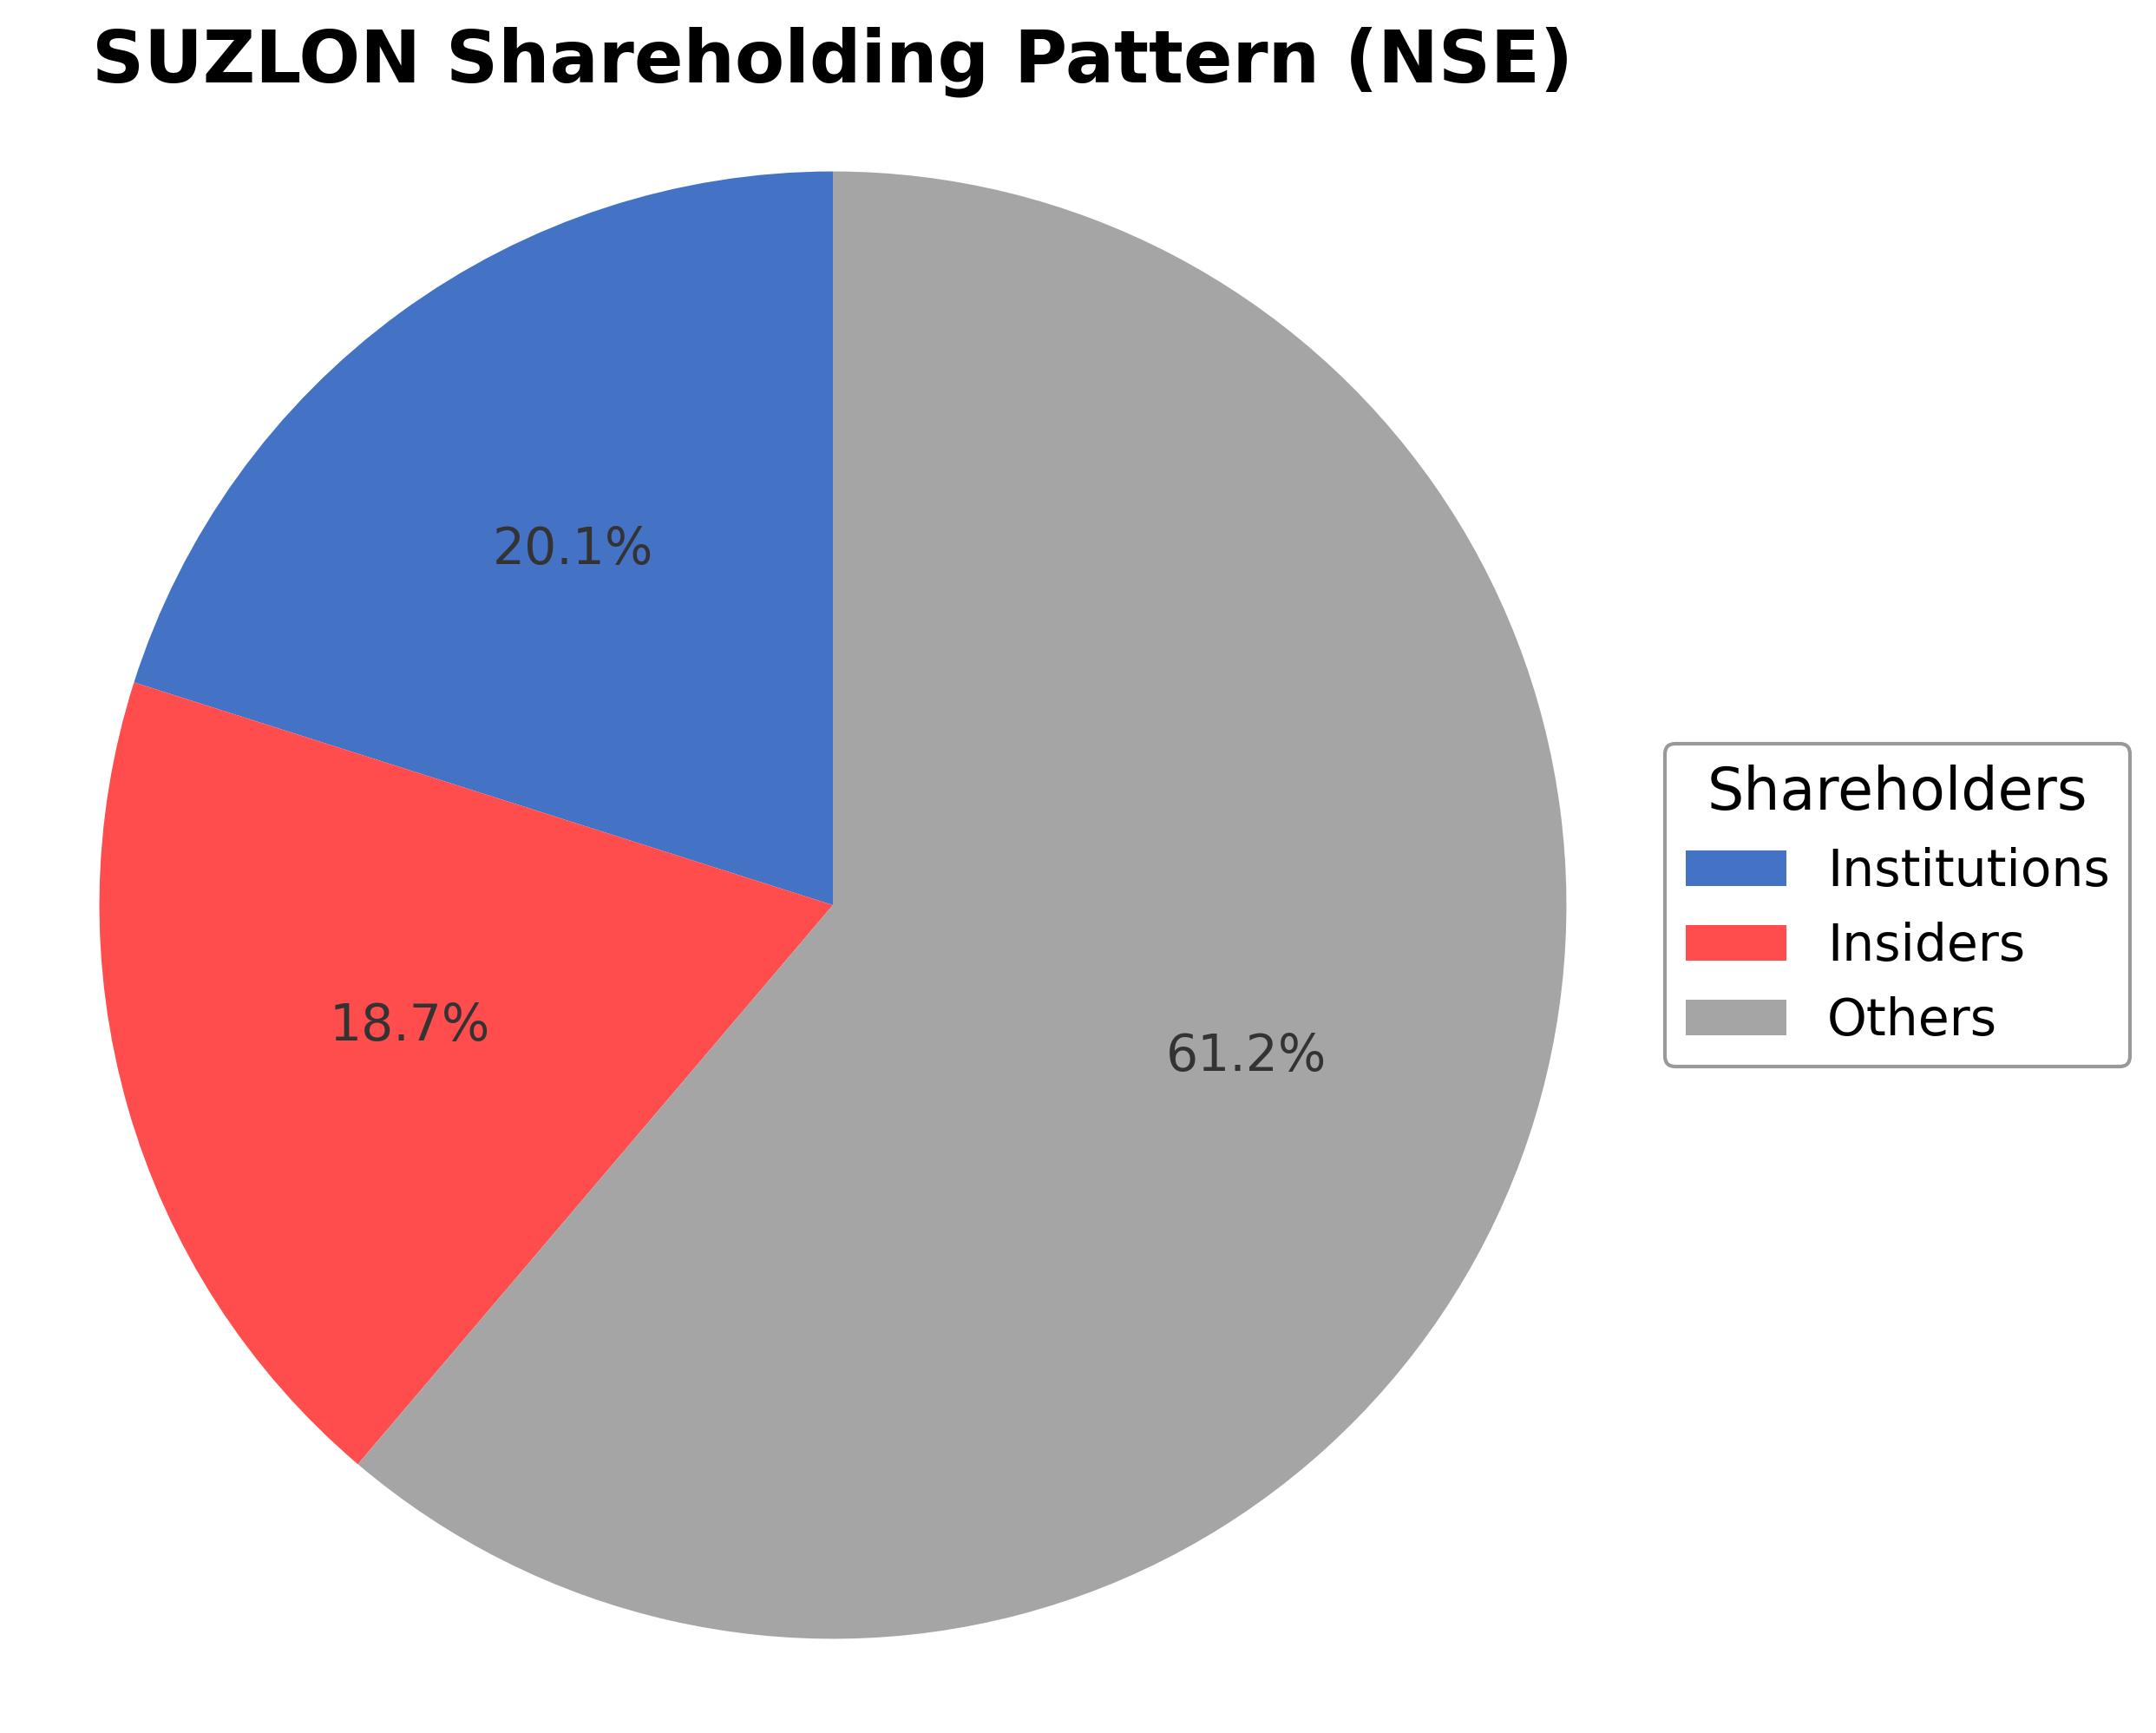
Suzlon Energy Ltd.'s ownership structure comprises approximately 18.70% insiders including executives and board members, 20.09% institutional investors such as mutual funds and pension funds, and the remaining 61.21% held by public shareholders including retail investors and employee stock plans. Over the past 12 to 24 months, institutional holdings have shown moderate accumulation, reflecting growing confidence from key investment firms. Major funds have increased positions in line with the company's strategic expansion and improving financial metrics. This shareholding pattern indicates balanced market sentiment with significant public participation, supporting governance transparency and strategic flexibility for future corporate actions.
Sector and Industry Analysis
The renewable energy sector in India is experiencing rapid growth, driven by ambitious government targets to achieve 500 GW of renewable capacity by 2030. Wind energy constitutes a significant portion of this expansion, with companies like Suzlon Energy Ltd., Siemens Gamesa, Vestas, and GE Renewable Energy leading the market. The sector benefits from increasing demand for clean energy, technological advancements, and growing investments, positioning it as a critical component of India’s energy transition.
Within the wind energy industry, key trends include the shift towards higher-capacity turbines (3–3.5 MW and above) and the expansion into export markets such as Southeast Asia and Africa. Competitive dynamics are shaped by global players with strong technological capabilities, while domestic firms like Suzlon leverage operational efficiency and local market knowledge. Barriers to entry remain high due to capital intensity, technological complexity, and the need for long-term project execution expertise.
The regulatory environment strongly supports renewable energy growth through subsidies, tax incentives, and favorable tendering processes, which have been pivotal in driving sector expansion. Policies promoting green bonds and renewable capacity targets underpin investor confidence and project financing. However, execution risks linked to policy continuity, raw material cost fluctuations, and logistical challenges remain factors that could influence industry performance.
Note: Analysis synthesized from industry research, market reports, and regulatory filings. Information is subject to change based on market conditions.
Financial Ratios Dashboard
Illustrative Scenario Analysis
DCF Assumptions:
Method: Two-Stage EPS-Priority Model
Financials
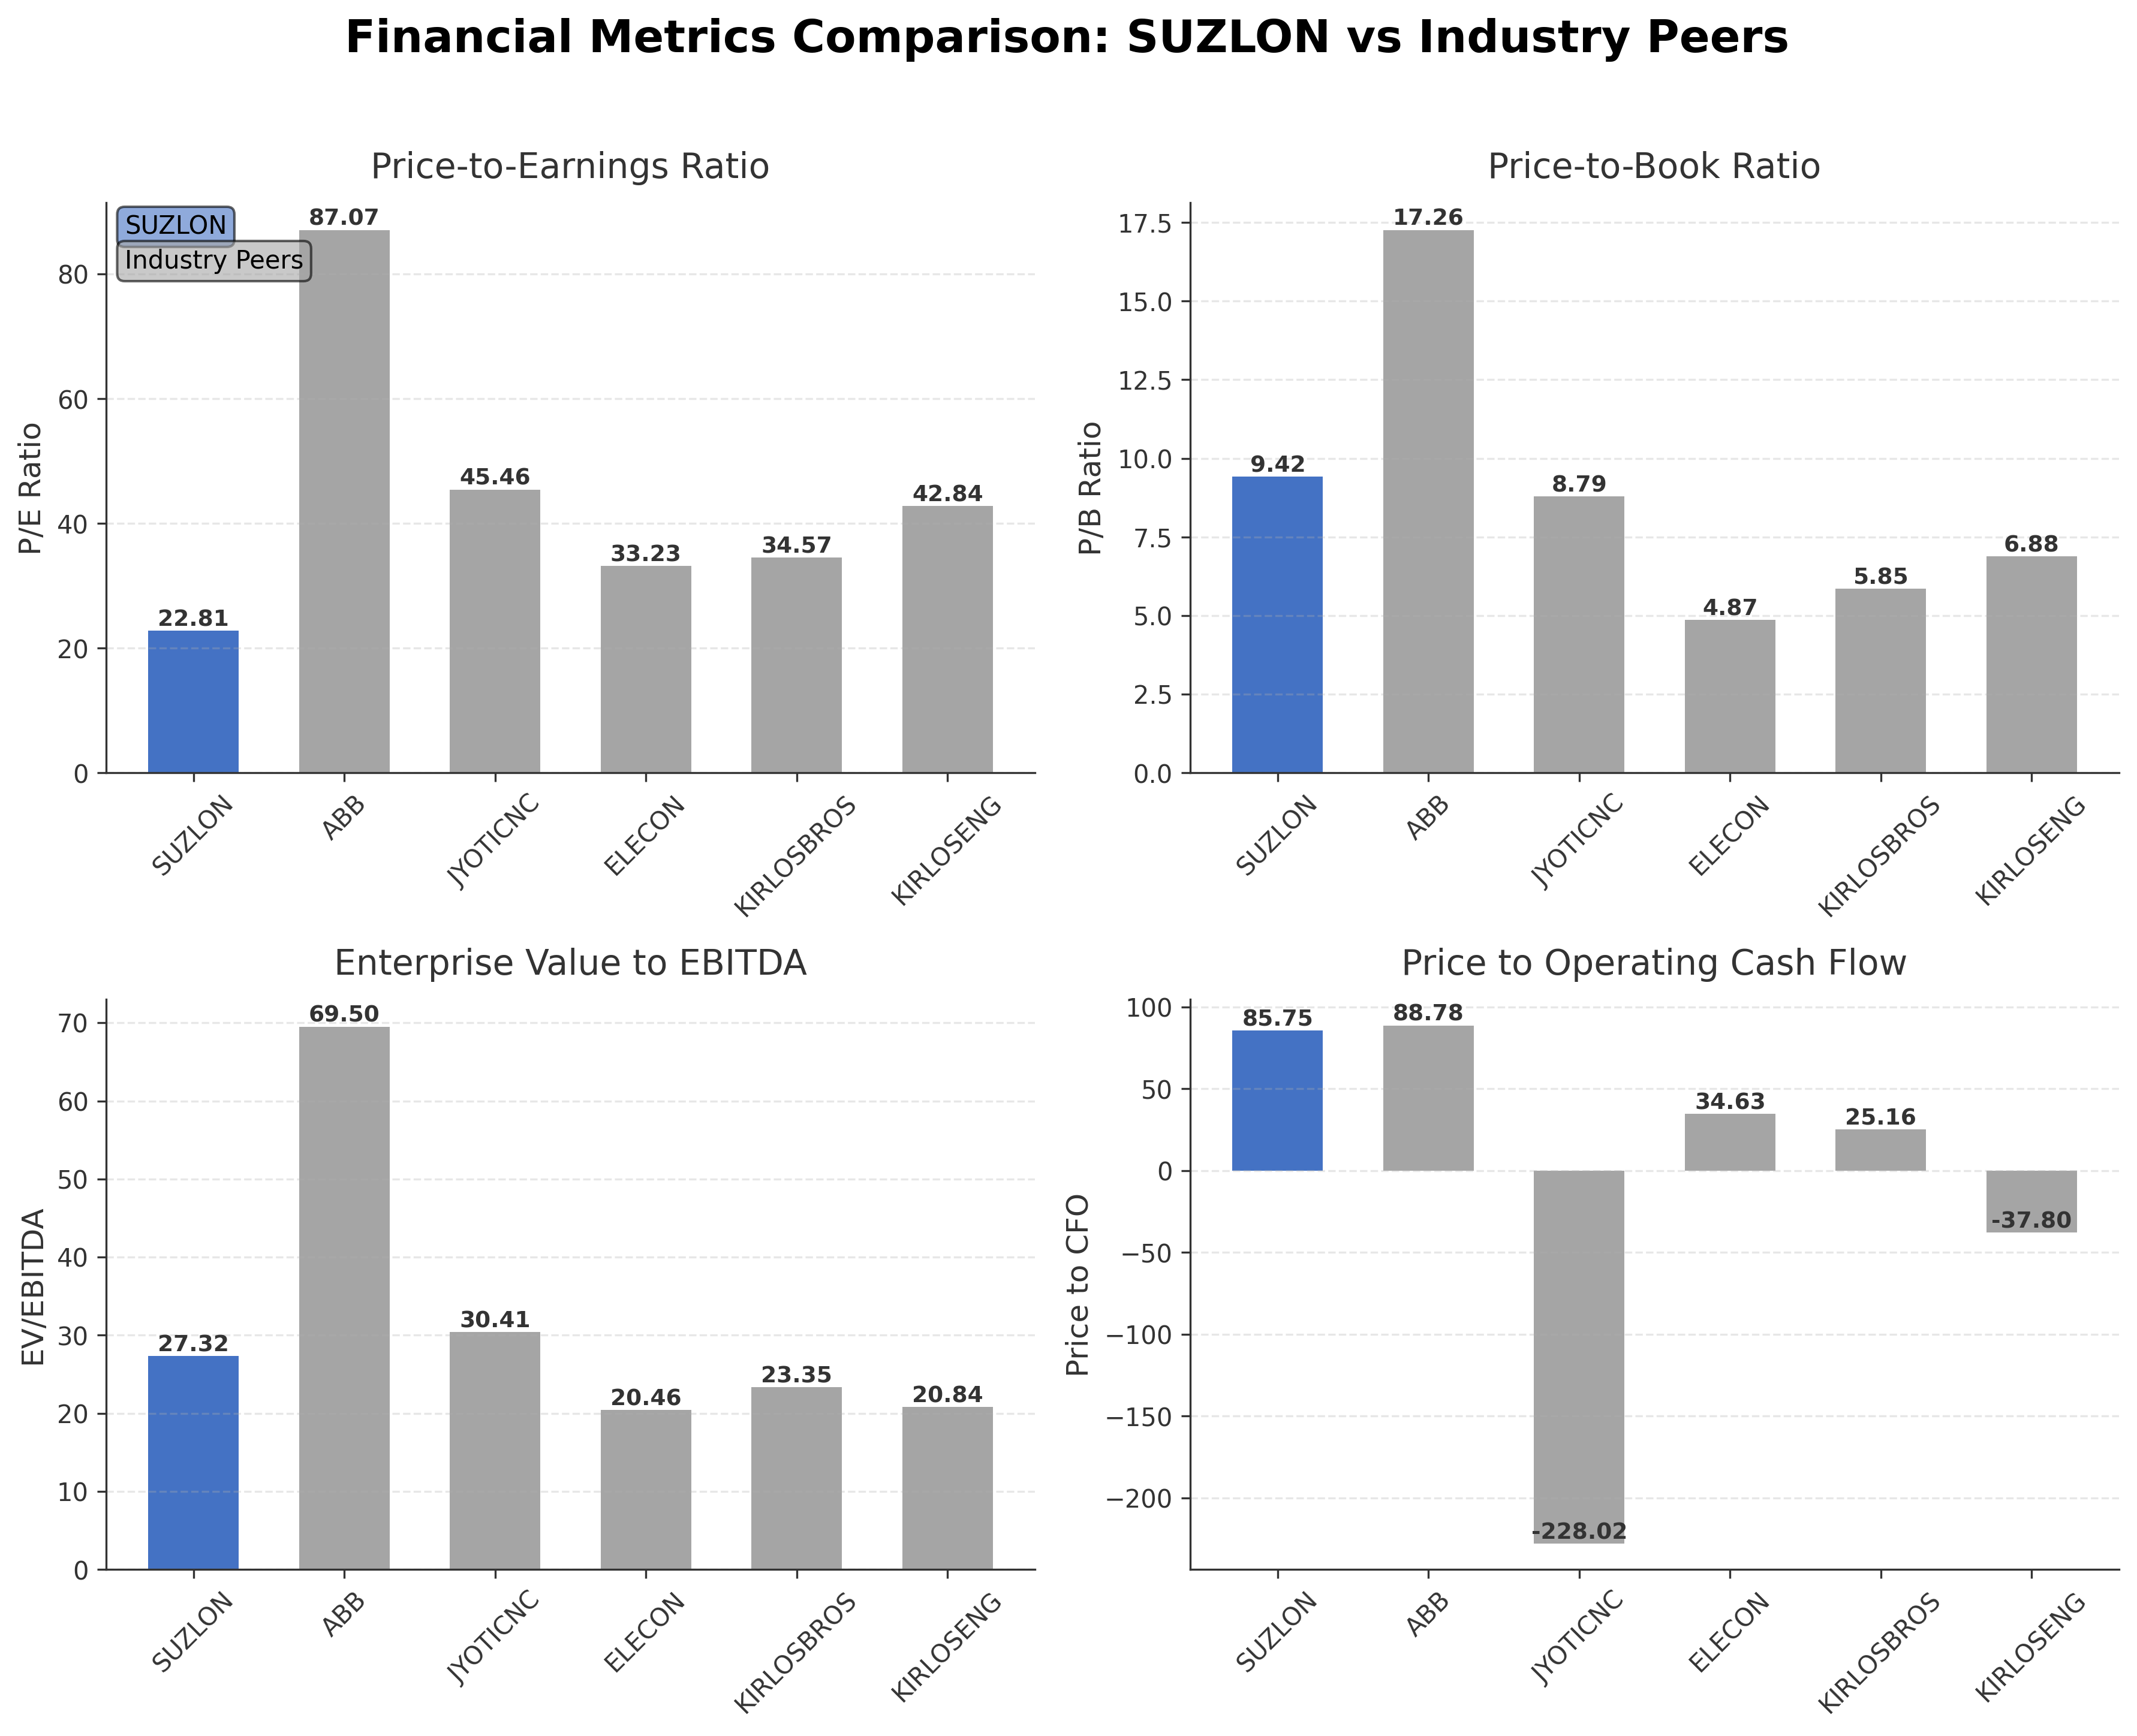
Peer Analysis
| Company Name | Market Cap | P/E Ratio | P/B Ratio | EV/EBITDA | Price to CFO |
|---|---|---|---|---|---|
| Suzlon Energy Ltd. | ₹738.45B | 22.81 | 9.42 | 27.32 | 85.75 |
| ABB India Ltd. | ₹1.35T | 87.07 | 17.26 | 69.50 | 88.78 |
| Jyoti CNC Automation Ltd. | ₹160.87B | 45.46 | 8.79 | 30.41 | -228.02 |
| Elecon Engineering Co. Ltd. | ₹108.80B | 33.23 | 4.87 | 20.46 | 34.63 |
| Kirloskar Brothers Limited | ₹127.64B | 34.57 | 5.85 | 23.35 | 25.16 |
| Kirloskar Oil Engines Ltd. | ₹252.97B | 42.84 | 6.88 | 20.84 | -37.80 |
Comparison Analysis: Suzlon Energy Ltd. exhibits a comparatively moderate market capitalization within its peer group, with a P/E ratio of 22.81 significantly lower than peers such as ABB India Ltd. at 87.07 and Jyoti CNC Automation Ltd. at 45.46, indicating more reasonable earnings valuation. Its P/B ratio of 9.42 is higher than most peers, reflecting a premium on book value, while its EV/EBITDA of 27.32 is in the mid-range relative to the peer set. Suzlon’s return on equity at 33.93% stands out as the highest among peers, demonstrating superior profitability. However, the price to CFO ratio at 85.75 is elevated, suggesting relatively high pricing compared to cash flow generation. Overall, Suzlon shows strengths in profitability and valuation metrics but trades at a premium on book value and cash flow multiples.
Financial Metrics Comparison with Peers
Financial Statements
Comprehensive financial data including income, balance sheet, and cash flow metrics
Income Statement
| fiscal_date | 2025-03-31 | 2024-03-31 | 2023-03-31 | 2022-03-31 | 2021-03-31 |
|---|---|---|---|---|---|
| Sales | 107.63B | 64.97B | 59.47B | 65.20B | 32.95B |
| Cost Of Goods | 71.77B | 42.03B | 40.00B | 45.43B | 17.04B |
| Gross Profit | 35.86B | 22.94B | 19.46B | 19.77B | 15.90B |
| Operating Expense Research And Development | 55.10M | 101.90M | 72.30M | 41.30M | 59.60M |
| Operating Expense Selling General And Administrative | 2.56B | 1.28B | 990.90M | 1.43B | 1.05B |
| Operating Expense Other Operating Expenses | 4.45B | 3.53B | 3.15B | 3.83B | 3.83B |
| Operating Income | 16.18B | 8.57B | 5.96B | 6.31B | 3.01B |
| Non Operating Interest Income | 1.03B | 383.00M | 196.30M | 221.90M | 198.70M |
| Non Operating Interest Expense | 1.06B | 1.06B | 3.83B | 7.03B | 9.57B |
| Pretax Income | 14.47B | 6.59B | 28.92B | 4.00M | 1.05B |
| Income Tax | -6.25B | -8.60M | 44.20M | 1.67B | 46.30M |
| Net Income | 20.72B | 6.60B | 28.87B | -1.77B | 1.04B |
| Eps Basic | 1.52 | 0.50 | 2.64 | -0.21 | 0.13 |
| Eps Diluted | 1.51 | 0.50 | 2.64 | -0.21 | 0.11 |
| Basic Shares Outstanding | 13.64B | 13.15B | 10.78B | 9.29B | 8.26B |
| Diluted Shares Outstanding | 13.64B | 13.15B | 10.78B | 9.29B | 8.26B |
| Ebit | 15.52B | 7.65B | 32.75B | 7.03B | 10.62B |
| Ebitda | 18.76B | 10.17B | 8.31B | 9.35B | 5.35B |
| Net Income Continuous Operations | 14.47B | 6.59B | 28.92B | 4.00M | 1.05B |
| Minority Interests | 0.00 | 0.00 | -382.80M | -230.40M | 5.90M |
| Preferred Stock Dividends | 0.00 | 0.00 | 0.00 | 0.00 | 0.00 |
Source: Financial statements and regulatory filings
Balance Sheet
| fiscal_date | 2025-03-31 | 2024-03-31 | 2023-03-31 | 2022-03-31 | 2021-03-31 |
|---|---|---|---|---|---|
| Cash And Cash Equivalents | 9.01B | 2.50B | 3.67B | 4.37B | 2.62B |
| Accounts Receivable | 38.66B | 18.30B | 11.70B | 13.77B | 11.90B |
| Total Assets | 129.60B | 71.79B | 55.23B | 64.75B | 66.01B |
| Total Liabilities | 68.54B | 32.59B | 44.24B | 100.37B | 100.02B |
| Long Term Debt | 5.71B | 659.50M | 15.35B | 56.50B | 60.82B |
| Shareholders Equity | 61.06B | 39.20B | 10.99B | -35.62B | -34.01B |
Source: Financial statements and regulatory filings
Cash Flow Statement
| fiscal_date | 2025-03-31 | 2024-03-31 | 2023-03-31 | 2022-03-31 | 2021-03-31 |
|---|---|---|---|---|---|
| Operating Activities Net Income | 14.47B | 6.59B | 28.92B | 4.00M | 1.05B |
| Operating Activities Stock Based Compensation | 1.15B | 291.40M | 0.00 | N/A | N/A |
| Operating Activities Other Non Cash Items | 1.90B | 2.67B | -21.35B | 7.61B | 1.55B |
| Operating Activities Accounts Receivable | -20.07B | -6.77B | 1.93B | -2.30B | 677.60M |
| Operating Activities Other Assets Liabilities | 11.17B | -3.84B | -7.12B | 3.88B | -2.27B |
| Operating Activities Operating Cash Flow | 8.61B | -1.06B | 2.38B | 9.19B | 1.01B |
| Investing Activities Capital Expenditures | -3.68B | -2.26B | -142.00M | -758.20M | -489.80M |
| Investing Activities Net Acquisitions | -4.41B | 436.80M | 769.60M | 106.70M | 0.00 |
| Investing Activities Purchase Of Investments | -725.00M | -397.20M | 0.00 | N/A | N/A |
| Investing Activities Sale Of Investments | 383.60M | 314.90M | 0.00 | N/A | N/A |
| Investing Activities Investing Cash Flow | -8.44B | -1.91B | 729.30M | -552.20M | -356.50M |
| Financing Activities Long Term Debt Issuance | 1.05B | 0.00 | 30.29B | 0.00 | 499.80M |
| Financing Activities Long Term Debt Payments | -439.30M | -18.02B | -43.84B | -5.75B | -1.91B |
| Financing Activities Short Term Debt Issuance | -230.60M | -17.90M | 152.40M | -1.49B | -1.18B |
| Financing Activities Common Stock Issuance | 221.60M | 20.65B | 10.80B | 0.00 | 3.42B |
| Financing Activities Other Financing Charges | 4.11B | N/A | N/A | N/A | N/A |
| Financing Activities Financing Cash Flow | 4.72B | 2.62B | -2.59B | -7.23B | 822.40M |
| End Cash Position | 11.13B | 4.27B | 3.67B | 5.00B | 2.62B |
| Free Cash Flow | 7.21B | -1.48B | 3.90B | 12.25B | 4.79B |
| Investing Activities Other Investing Activity | N/A | N/A | 101.70M | 99.30M | 133.30M |
Source: Financial statements and regulatory filings
Technical Analysis
Key Insights
- The current trend shows a mixed price action with the stock trading slightly above the 50-day moving average (₹47.18) but below the 200-day moving average (₹51.66), indicating potential short-term support but longer-term resistance.
- Key support levels are identified near ₹47.00 and ₹38.19 (52-week low), while resistance is observed around ₹52.64 (current price) and ₹74.30 (52-week high).
- The stock is positioned above the 10-day moving average but struggles to sustain above the 200-day moving average, suggesting consolidation within a trading range.
- Momentum indicators show RSI in a neutral zone, MACD lines converging near the signal line, and stochastic oscillators indicating moderate momentum without clear directional bias.
- Multi-timeframe analysis reveals daily charts showing consolidation, weekly charts indicating sideways movement, and monthly charts reflecting a longer-term uptrend with recent corrections.
- Potential market scenarios include a continuation of consolidation with possible upward momentum if the stock breaks above the 200-day moving average, or further downside risk if support levels near ₹47.00 are breached.
Trending News
1. Headline: Vodafone Idea to cement top spot in equity share count; nearly 4x YES Bank after fundraise - BusinessToday
Summary: Indian Oil Corporation, Suzlon Energy Ltd, Reliance Industries Ltd, Indian Railway Finance Corporation and GTL Infrastructure are the next five companies in line. ... Despite having the highest number of equity shares, Vodafone Idea is ranked third amongst the most widely owned stocks with nearly ...
Sentiment: positive
2. Headline: Suzlon Energy share price targets as multibagger attempts a pullback post correction - BusinessToday
Summary: Suzlon Energy is a provider of renewable energy solutions. The company is a producer of wind turbines. It offers a range of solar energy solutions, such as solar irradiance assessment, land acquisition and approvals, infrastructure and power evacuation, supply chain, installation and commission and life cycle asset management. Disclaimer: Business Today provides stock market news ...
Sentiment: negative
3. Headline: Suzlon Energy, Patanjali, Nalco, SAIL, IREDA To Cochin Adani Mutual Funds 10 Nifty MidCap Stocks - Goodreturns
Summary: Suzlon Energy, Patanjali, Nalco, SAIL, IREDA To Cochin: Mutual Funds Went Big On These 10 Nifty MidCap Stocks
Sentiment: positive
4. Headline: Suzlon Energy Stock May 16: Gains Third Session as Renewable Demand Surges | Meyka
Summary: Stock NewsBusinessExecutive ... NewsTechnical IndicatorsTechnology ... Suzlon Energy gains third session at Rs 54.43, up 1.8% on May 16. Stock outperforms Nifty Energy index despite year-long underperformance. Renewable energy sector momentum driven by India's clean energy transition. Investor search volume surges 75% signaling renewed market interest. ... Suzlon Energy Ltd is capturing ...
Sentiment: positive
5. Headline: Suzlon Energy Ltd gains for third straight session | Capital Market News - Business Standard
Summary: Suzlon Energy Ltd is down 10.89% in last one year as compared to a 4.94% slide in NIFTY and a 12.15% slide in the Nifty Energy index. The PE of the stock is 23.34 based on TTM earnings ending December 25. ... Don't miss the most important news and views of the day.
Sentiment: negative
Recent Updates
News Summary
As of 2026-05-20. Suzlon Energy Ltd has recently allotted 1.95 lakh shares under its Employee Stock Option Plan (ESOP) 2022, marginally increasing its equity base as part of efforts to incentivize and retain key talent. Additionally, a senior company leader highlighted Suzlon's strategic return to the European market, emphasizing plans to expand its presence in this important renewable energy region. These developments underscore Suzlon's focus on growth and talent alignment amid a competitive global renewable energy landscape.
News Sentiment
The overall sentiment from recent updates is mixed to neutral, reflecting positive strategic moves such as market expansion in Europe and employee retention initiatives, balanced by cautious investor reactions to equity dilution through ESOP allotments. While these actions support long-term growth prospects, the lack of major financial disclosures or transformative events tempers immediate enthusiasm. The sentiment suggests steady progress without significant volatility in market perception.
Source List
- https://www.tipranks.com/news/company-announcements/suzlon-allots-1-95-lakh-shares-under-esop-2022-marginally-lifts-equity-base
- https://www.windpowermonthly.com/article/1958105/interview-suzlon-leader-companys-return-second-home-europe
Analytical Overview
Analysis Summary
Suzlon Energy’s valuation metrics show a trailing P/E of 22.81 and forward P/E of 27.24, which are in line with or slightly above the industry average of 22.81, indicating a valuation consistent with sector expectations. The company’s PEG ratio of 0.20 suggests undervaluation relative to expected earnings growth, highlighting potential growth value. Revenue growth is robust at 42.4% quarterly, supported by positive cash flow trends with operating cash flow of INR 8.61 billion and levered free cash flow of INR 20.72 billion, indicating improving financial health. The debt-to-equity ratio is elevated at 5.05, reflecting leverage that warrants monitoring, though total debt remains manageable at INR 3.97 billion relative to cash reserves of INR 9.03 billion. Sector-specific opportunities include the accelerating adoption of renewable energy in India and globally, while challenges involve regulatory shifts and competitive pressures. Considering India-specific factors, Suzlon benefits from favorable government policies promoting clean energy and increasing consumer demand for sustainable solutions.
Overall Business and Market Assessment
Supporting Factors: robust revenue growth of 42.4%, high return on equity of 33.93%, and positive cash flow generation
Risk Factors: the high debt-to-equity ratio of 5.05 and valuation premiums reflected in a P/B ratio of 9.42
SWOT Analysis
Strengths
- Strong profitability with a return on equity of 33.93%.
- Robust revenue growth of 42.4% in the most recent quarter.
- Positive cash flow generation with levered free cash flow of INR 20.72 billion.
- Comprehensive renewable energy solutions and global market presence.
Weaknesses
- High debt-to-equity ratio of 5.05 indicating elevated leverage.
- Price-to-book ratio of 9.42 suggests premium valuation.
- Relatively high price to cash flow ratio at 85.75.
- Negative retained earnings impacting shareholders’ equity.
Opportunities
- Expanding footprint in the European renewable energy market.
- Favorable government policies supporting clean energy adoption in India.
- Growing global demand for sustainable energy solutions.
- Potential for strategic partnerships and technological advancements.
Threats
- Regulatory changes affecting renewable energy incentives.
- Intense competition within the specialty industrial machinery sector.
- Market volatility impacting stock price performance.
- Macroeconomic factors influencing capital availability and project financing.
Company Description
Suzlon Energy Ltd. is a leading renewable energy company specializing in the production of wind turbines. Its primary function is to provide sustainable energy solutions by harnessing wind energy, contributing significantly to the global energy transition towards renewable sources. Suzlon Energy's offerings include a range of wind turbines with varied technologies and capacities aimed at maximizing efficiency and performance. The company operates primarily across the wind energy sector but also plays a role in other green energy initiatives. Its market significance is underscored by its comprehensive service portfolio which includes installation, maintenance, and wind resource assessment, making it a holistic solutions provider in the renewable energy space. Suzlon Energy Ltd. has established a presence in both domestic and international markets, supporting the growth of clean energy infrastructure worldwide.