


Surya Roshni Ltd (SURYAROSNI)
Stock Analysis Report
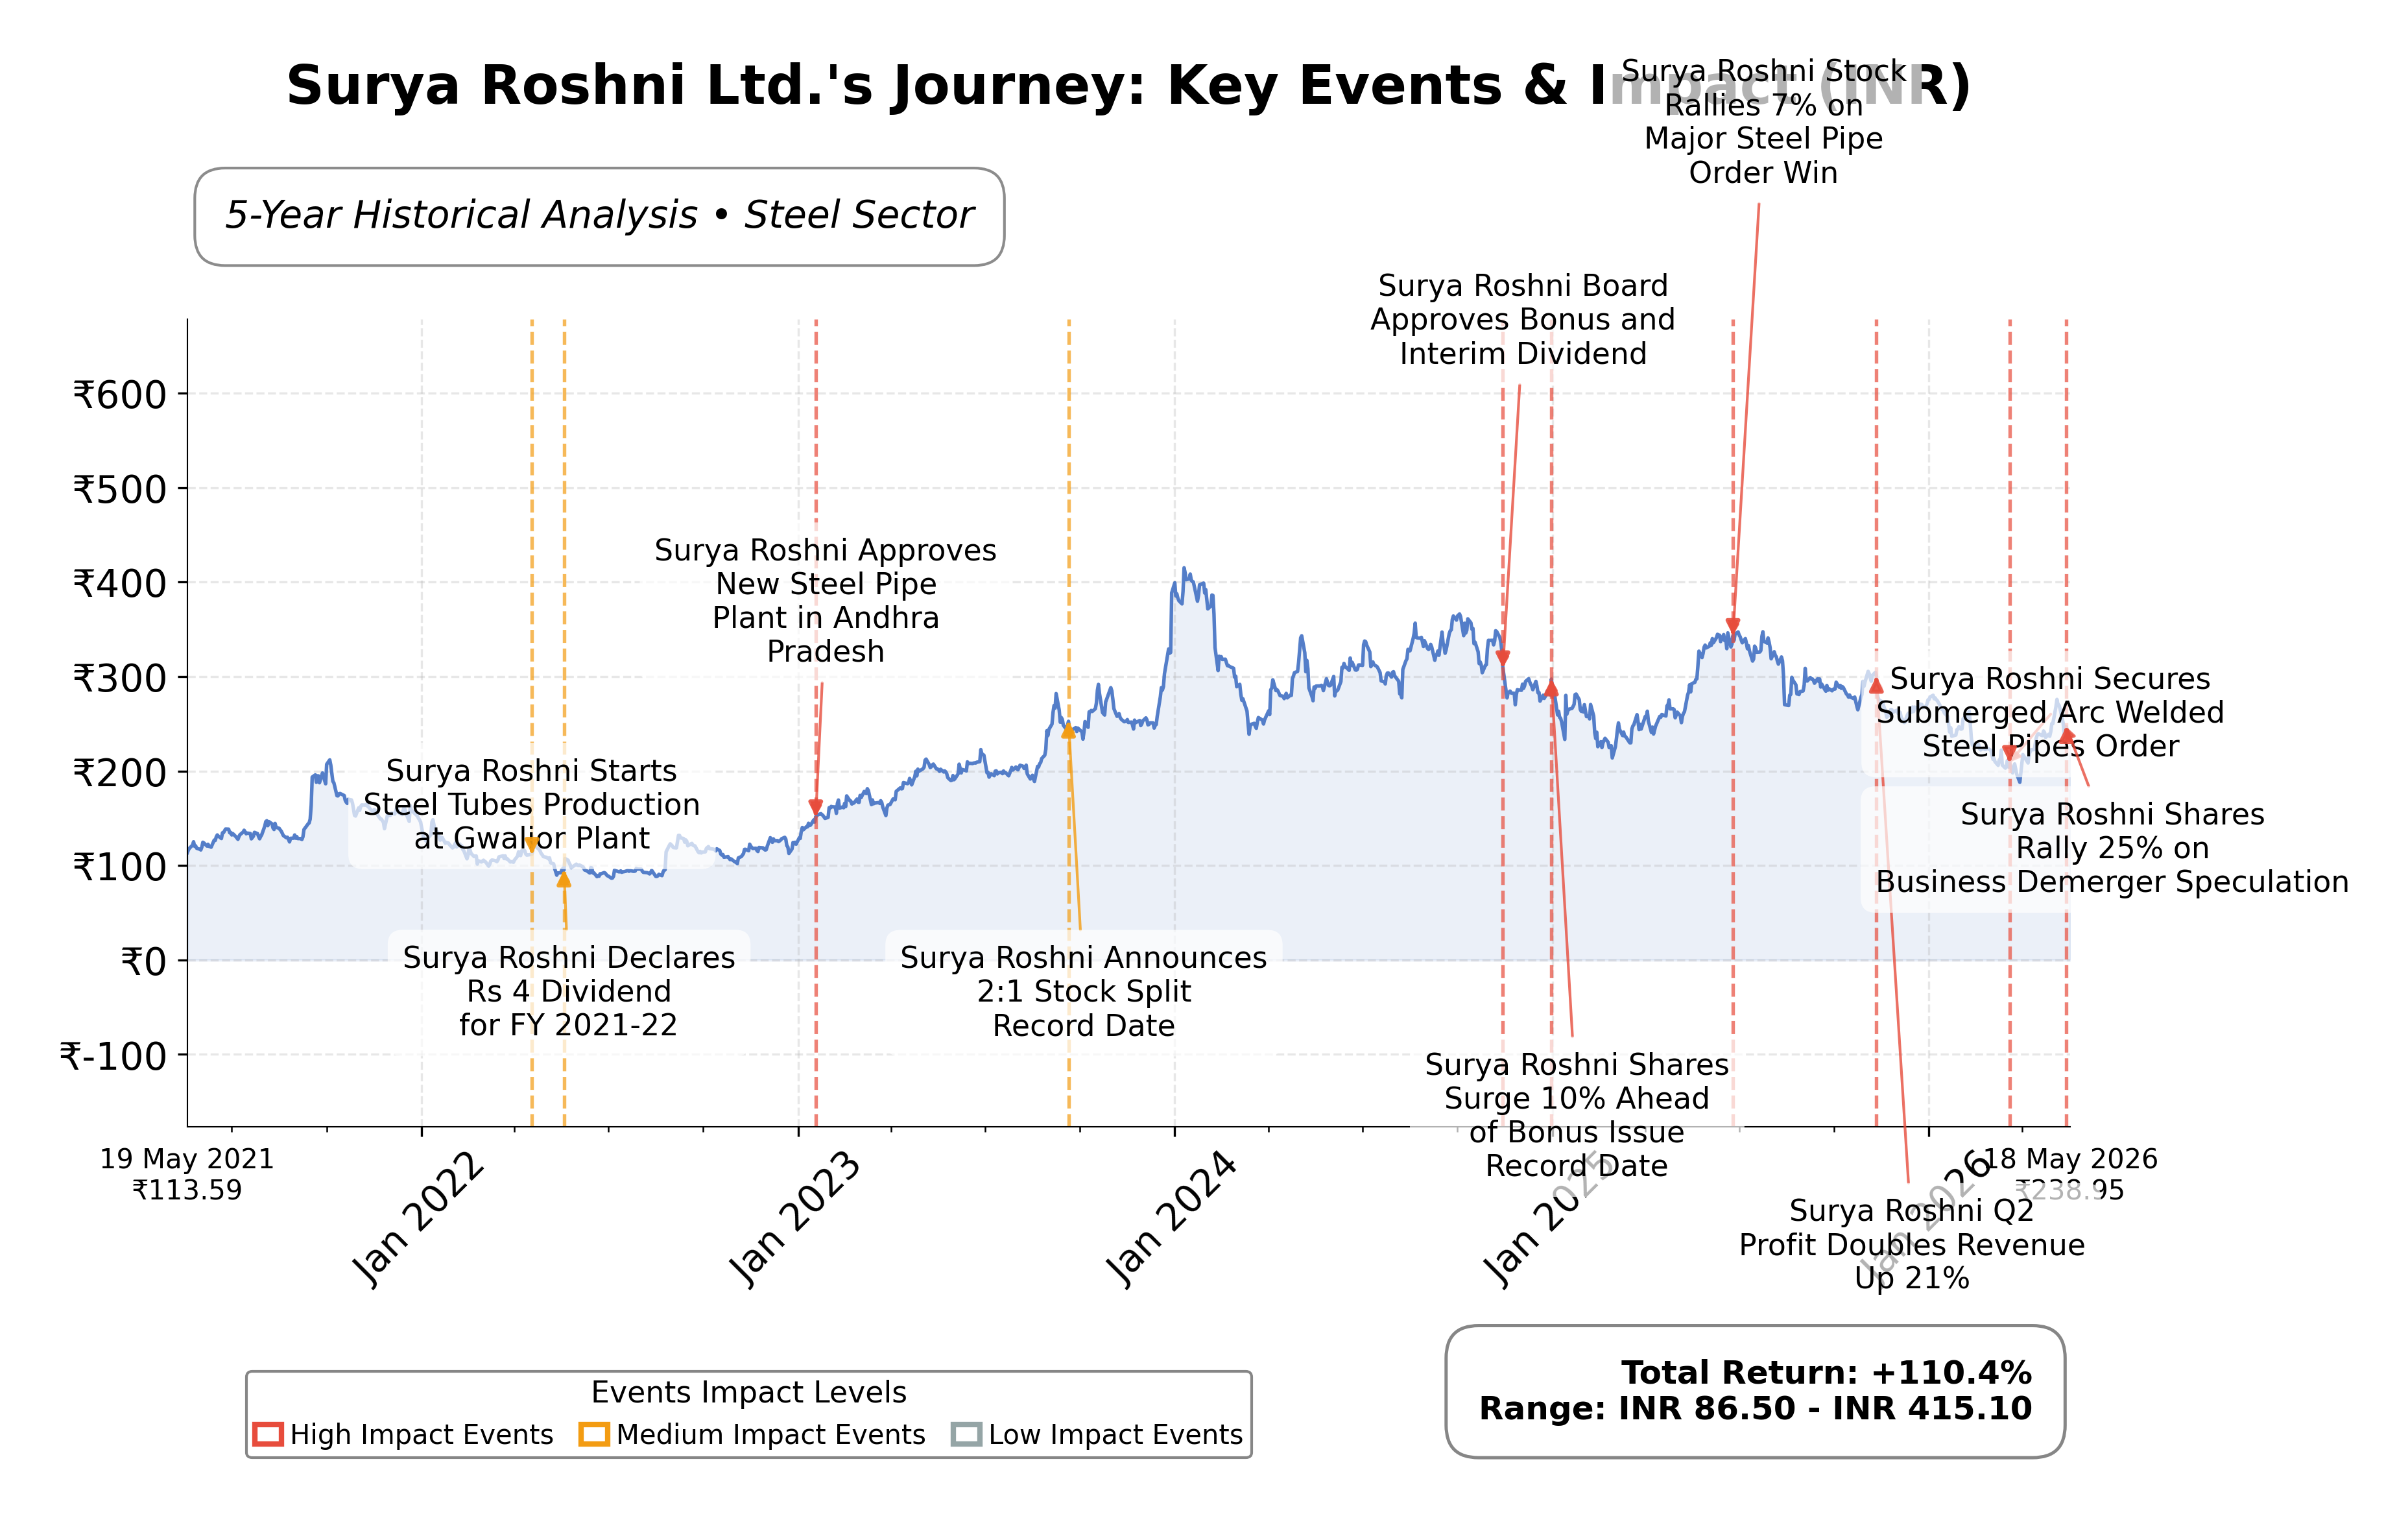
Stock Journey
Key Positives and Key Risks
Pros
- Reasonable valuation with a trailing P/E of 16.37 and forward P/E of 12.07, below industry average.
- Strong liquidity indicated by a current ratio of 2.97 and cash reserves of approximately ₹5 billion supporting operational stability.
- Robust return on equity of 14.06% demonstrating effective capital utilization and profitability.
Cons
- Declining quarterly earnings growth of -11.4% signaling recent profitability challenges.
- High promoter ownership at 68.82% may limit external governance and influence.
- Sector volatility and competitive pressures in steel and lighting markets pose ongoing risks.
Disclosure: This information is for general awareness and does not constitute investment advice
Report Summary
Surya Roshni Ltd. is a leading Indian manufacturer specializing in energy-efficient lighting products and steel pipes, operating primarily in the Basic Materials sector under the Steel industry. Listed on the NSE (National Stock Exchange of India), the company serves both domestic and international markets with a diverse product portfolio including LED lighting, ERW steel pipes, and cold rolled steel strips. Established in 1973, Surya Roshni has built a strong market presence and distribution network, positioning itself as a significant player in India's infrastructure and construction sectors.
Financially, Surya Roshni reported trailing twelve months (TTM) revenue of approximately ₹75.23 billion with a gross margin of 22.58%, operating margin of 5.80%, and a net profit margin of 4.22%. The company’s return on equity (ROE) stands at 14.06%, return on assets (ROA) at 10.72%, and return on invested capital (ROIC) is reflected in an EV/EBITDA ratio of 9.29, indicating moderate profitability and operational efficiency. Despite a slight year-over-year decline in quarterly earnings growth (-11.4%), the company maintains positive revenue growth of 3.2% and solid cash flow generation with operating cash flow of ₹4.26 billion and free cash flow of ₹3.47 billion.
Valuation metrics show Surya Roshni trading at a trailing P/E of 16.37 and a forward P/E of 12.07, with a price-to-book ratio of 2.07 and enterprise value to EBITDA of 9.29. The market capitalization is approximately ₹52.0 billion, with the stock price currently at ₹244.10, positioned between its 52-week low of ₹187.35 and high of ₹359. This pricing suggests the stock is valued moderately relative to its fundamentals and industry peers, with a PEG ratio of 0.21 indicating potential undervaluation relative to earnings growth.
The company exhibits strengths such as strong cash reserves of nearly ₹5 billion, a healthy current ratio of 2.97 indicating liquidity, and low total debt of ₹1.24 billion relative to equity. Key risks include sector volatility, competitive pressures in steel and lighting markets, and regulatory challenges. Recent strategic developments include market speculation about a potential business demerger to separate its lighting and steel pipe segments, which has generated positive investor interest and could lead to more focused operational management.
Technically, Surya Roshni’s stock shows mixed momentum with price action above the 50-day moving average but below the 200-day average, and momentum indicators reflecting a transition phase. Recent news highlights export order wins and corporate restructuring rumors, suggesting a dynamic environment. Overall, the data points to a scenario warranting close observation for evolving market and operational developments.
Company and Industry Overview
Company Basics
Price Performance
Company Size
Shareholding Pattern
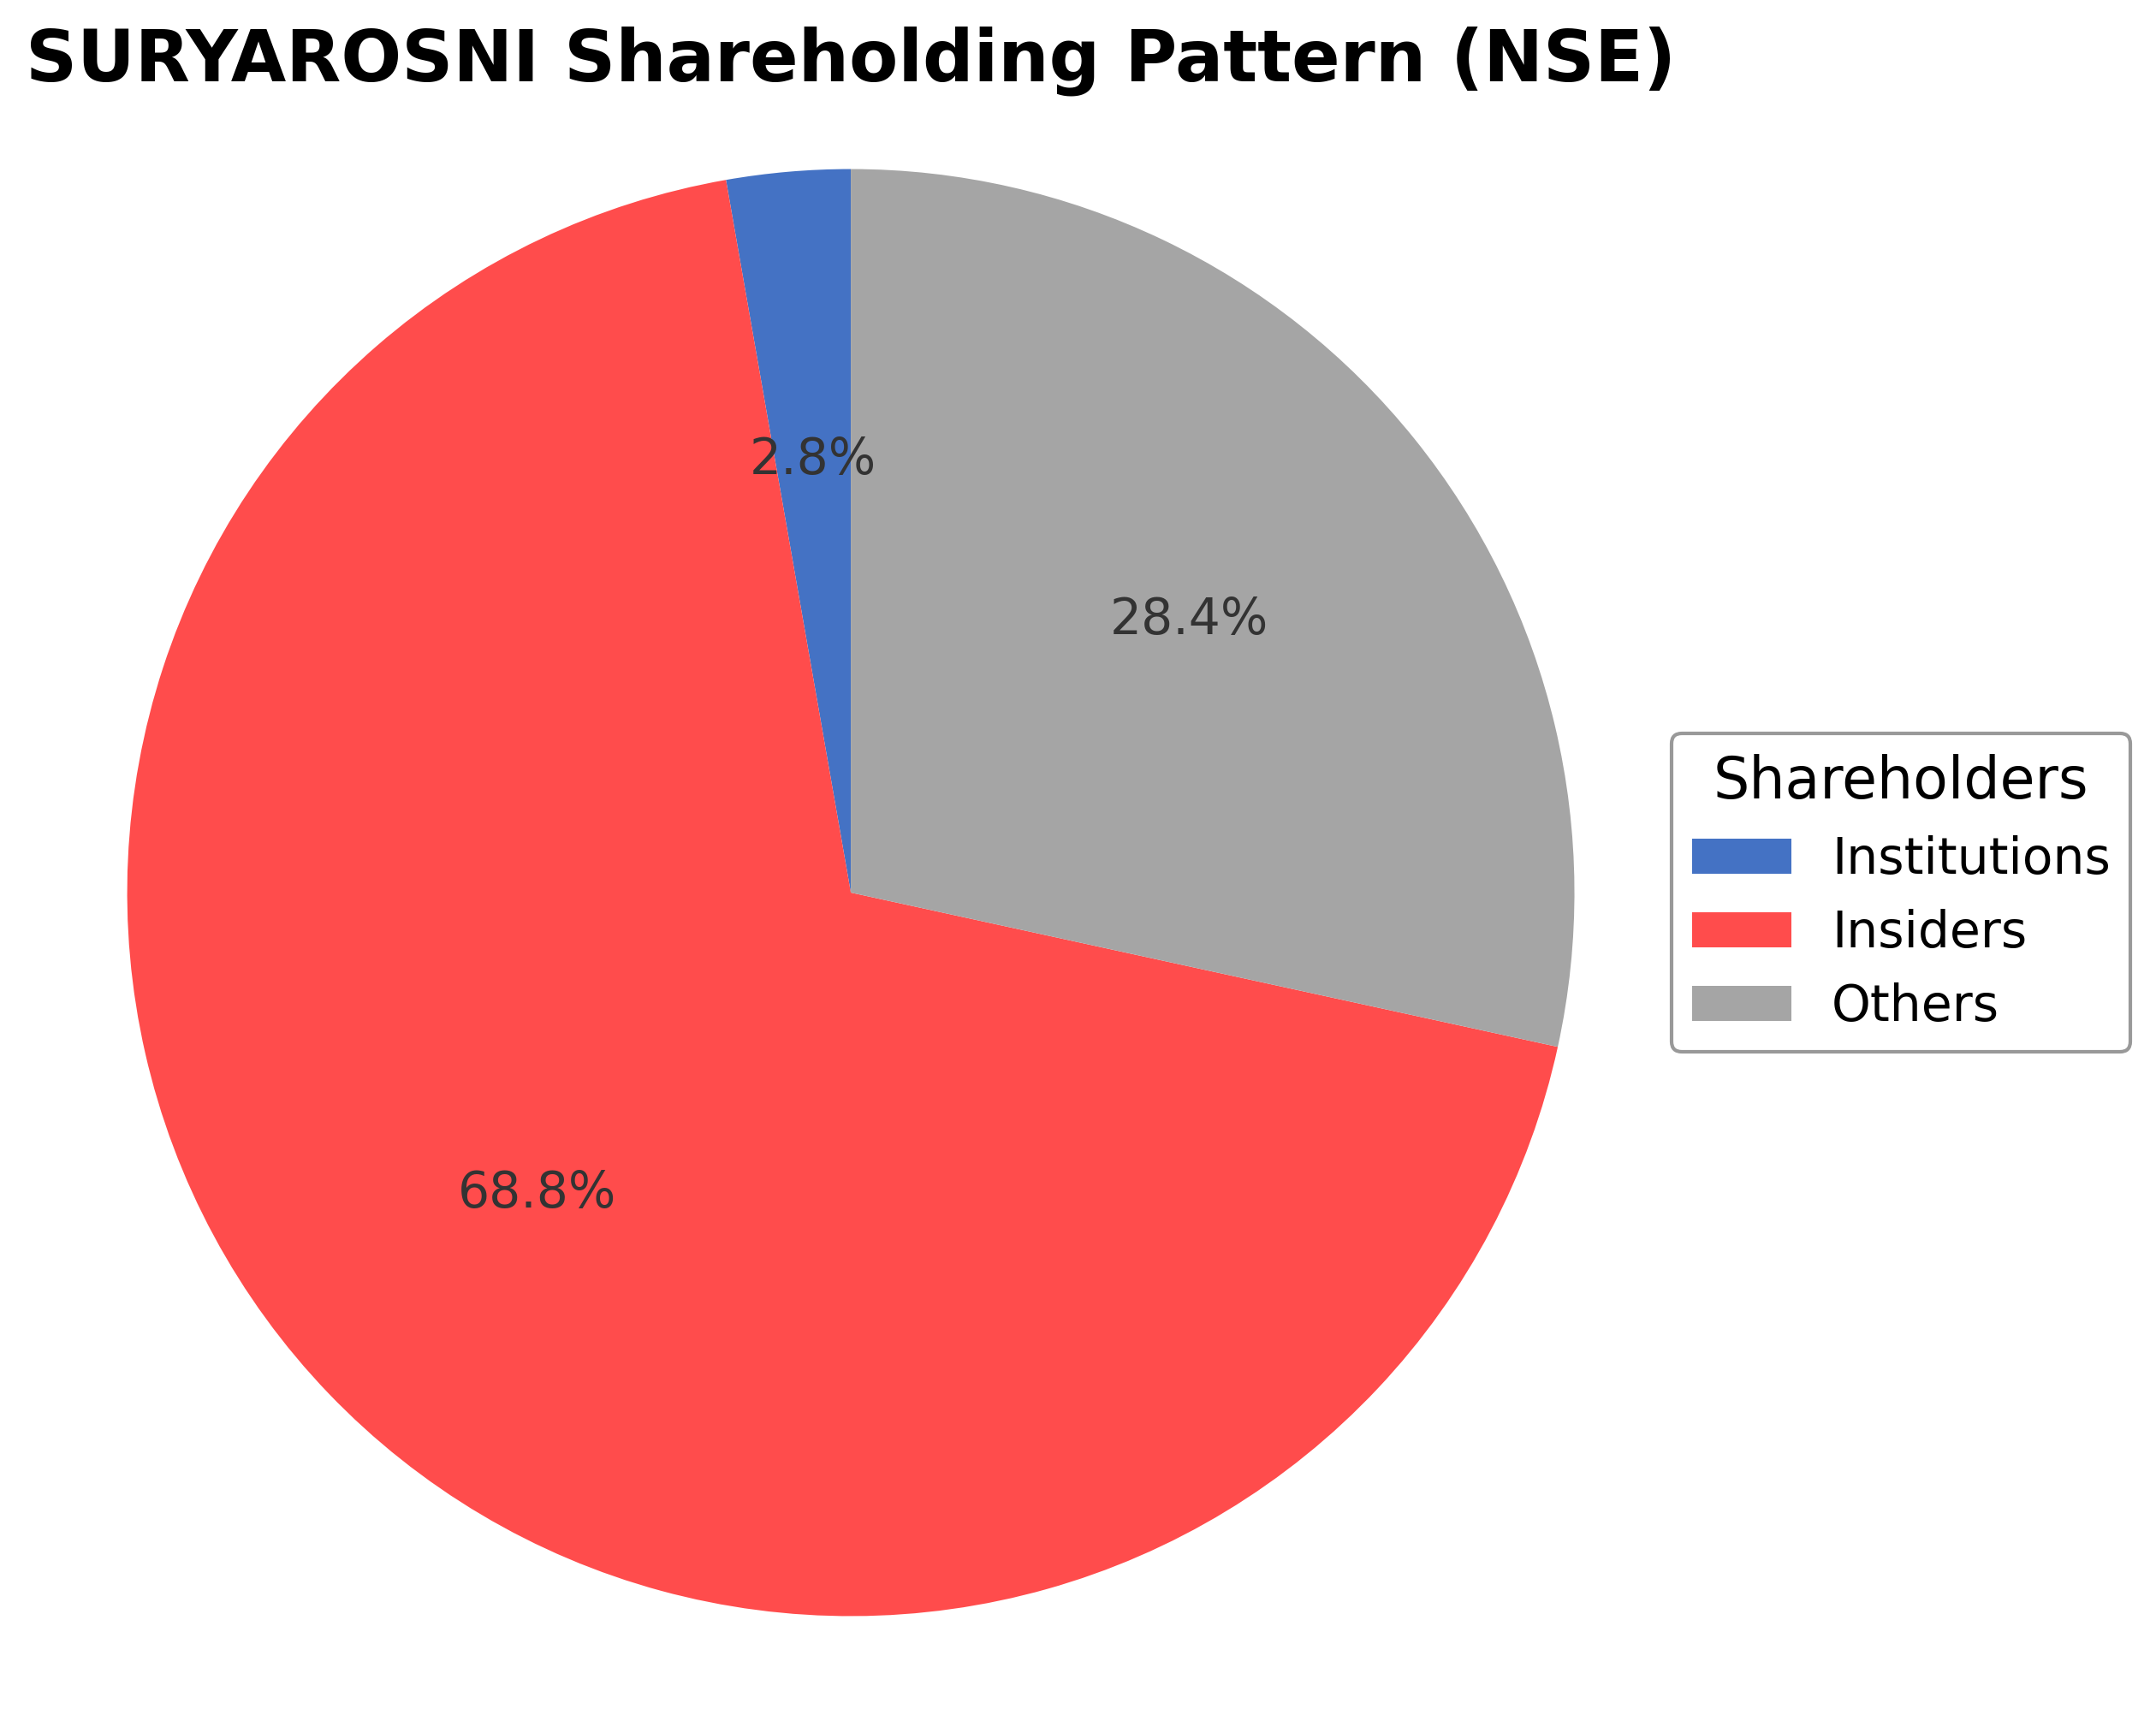
Surya Roshni Ltd.'s ownership structure is dominated by insiders, including promoters and executives, holding approximately 68.82% of shares, reflecting strong founder and management control. Institutional investors maintain a modest stake of 2.76%, indicating limited institutional accumulation or distribution activity recently. The remaining 28.42% is held by public shareholders, including retail investors and employee stock plans. Over the past 12-24 months, there have been no significant shifts in major ownership positions reported. This concentrated insider ownership suggests a governance model with strategic decision-making largely influenced by promoters, potentially facilitating focused corporate actions such as the proposed business demerger. The relatively low institutional presence may imply cautious market sentiment or limited analyst coverage within the sector. Overall, the shareholding pattern underscores a stable ownership base with implications for sustained strategic direction and operational continuity.
Sector and Industry Analysis
The lighting and steel manufacturing sector in India, which includes companies like Surya Roshni Ltd, has witnessed steady growth driven by urbanization, infrastructure development, and rising consumer demand. The market size for lighting solutions is expanding rapidly due to increased adoption of energy-efficient LED technology, while the steel segment benefits from government initiatives promoting domestic production. Key players in this sector include established firms such as Havells, Bajaj Electricals, and Tata Steel, which compete across product categories and distribution networks.
Industry trends show a marked shift towards sustainable and smart lighting solutions, with innovation in LED products and integrated systems gaining traction. Competitive dynamics are shaped by economies of scale, brand recognition, and distribution reach, creating moderate barriers to entry for new players. Companies are increasingly focusing on product differentiation and cost optimization to maintain market share amid rising raw material costs and evolving consumer preferences.
The regulatory environment is influenced by energy efficiency standards and environmental norms that promote the use of eco-friendly lighting products and sustainable steel manufacturing practices. Government policies such as the Perform, Achieve, and Trade (PAT) scheme incentivize energy savings, impacting operational strategies in the sector. Ongoing regulatory emphasis on quality, safety, and environmental compliance is expected to drive further innovation and consolidation within the industry.
Note: Analysis synthesized from industry research, market reports, and regulatory filings. Information is subject to change based on market conditions.
Financial Ratios Dashboard
Illustrative Scenario Analysis
DCF Assumptions:
Method: Two-Stage EPS-Priority Model
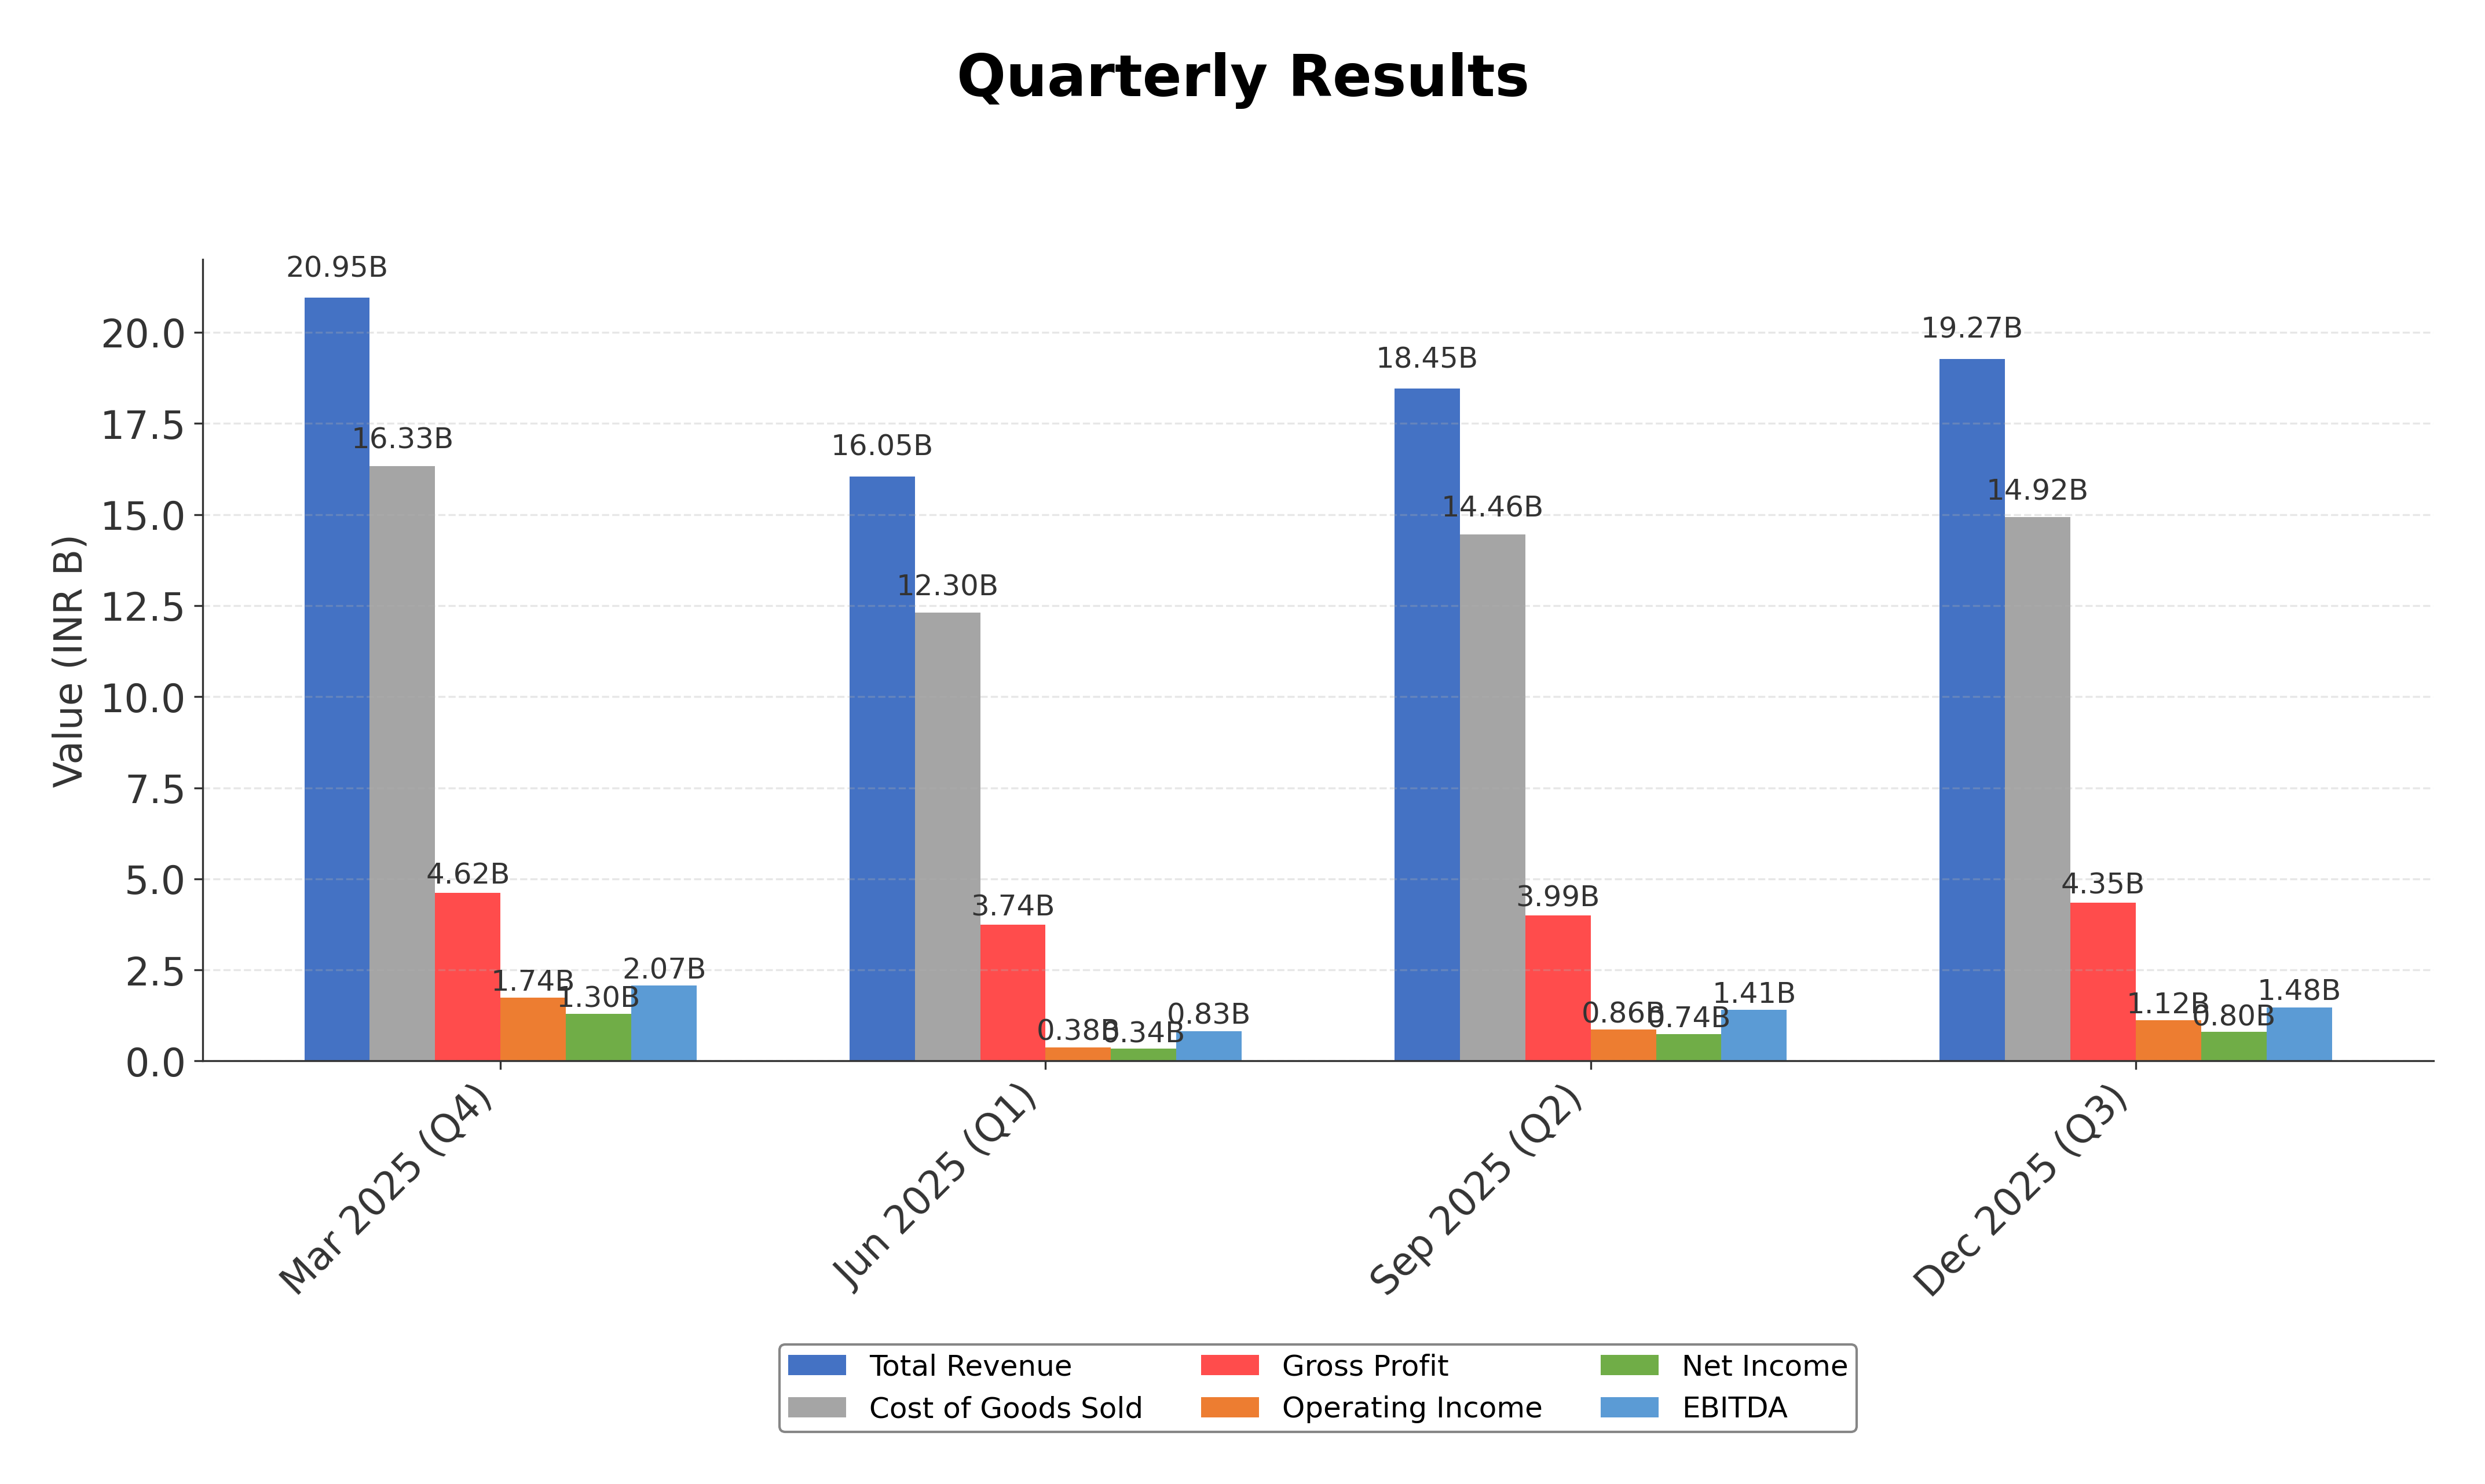
Financials
Peer Analysis
| Company Name | Market Cap | P/E Ratio | P/B Ratio | EV/EBITDA | Price to CFO |
|---|---|---|---|---|---|
| Surya Roshni Ltd. | ₹52.00B | 16.37 | 2.07 | 9.29 | 12.21 |
| Jindal Steel & Power Ltd. | ₹1.25T | 37.25 | 2.52 | 14.98 | 17.40 |
| Nmdc Steel Ltd. | ₹128.36B | -5.43 | 0.99 | 24.95 | -9.74 |
| Apl Apollo Tubes Ltd. | ₹524.83B | 43.64 | 9.91 | 28.91 | 24.95 |
| Steel Authority of India Limited | ₹794.71B | 28.50 | 1.37 | 10.64 | 8.10 |
| Jindal Saw Ltd. | ₹146.07B | 15.04 | 1.16 | 8.32 | 8.25 |
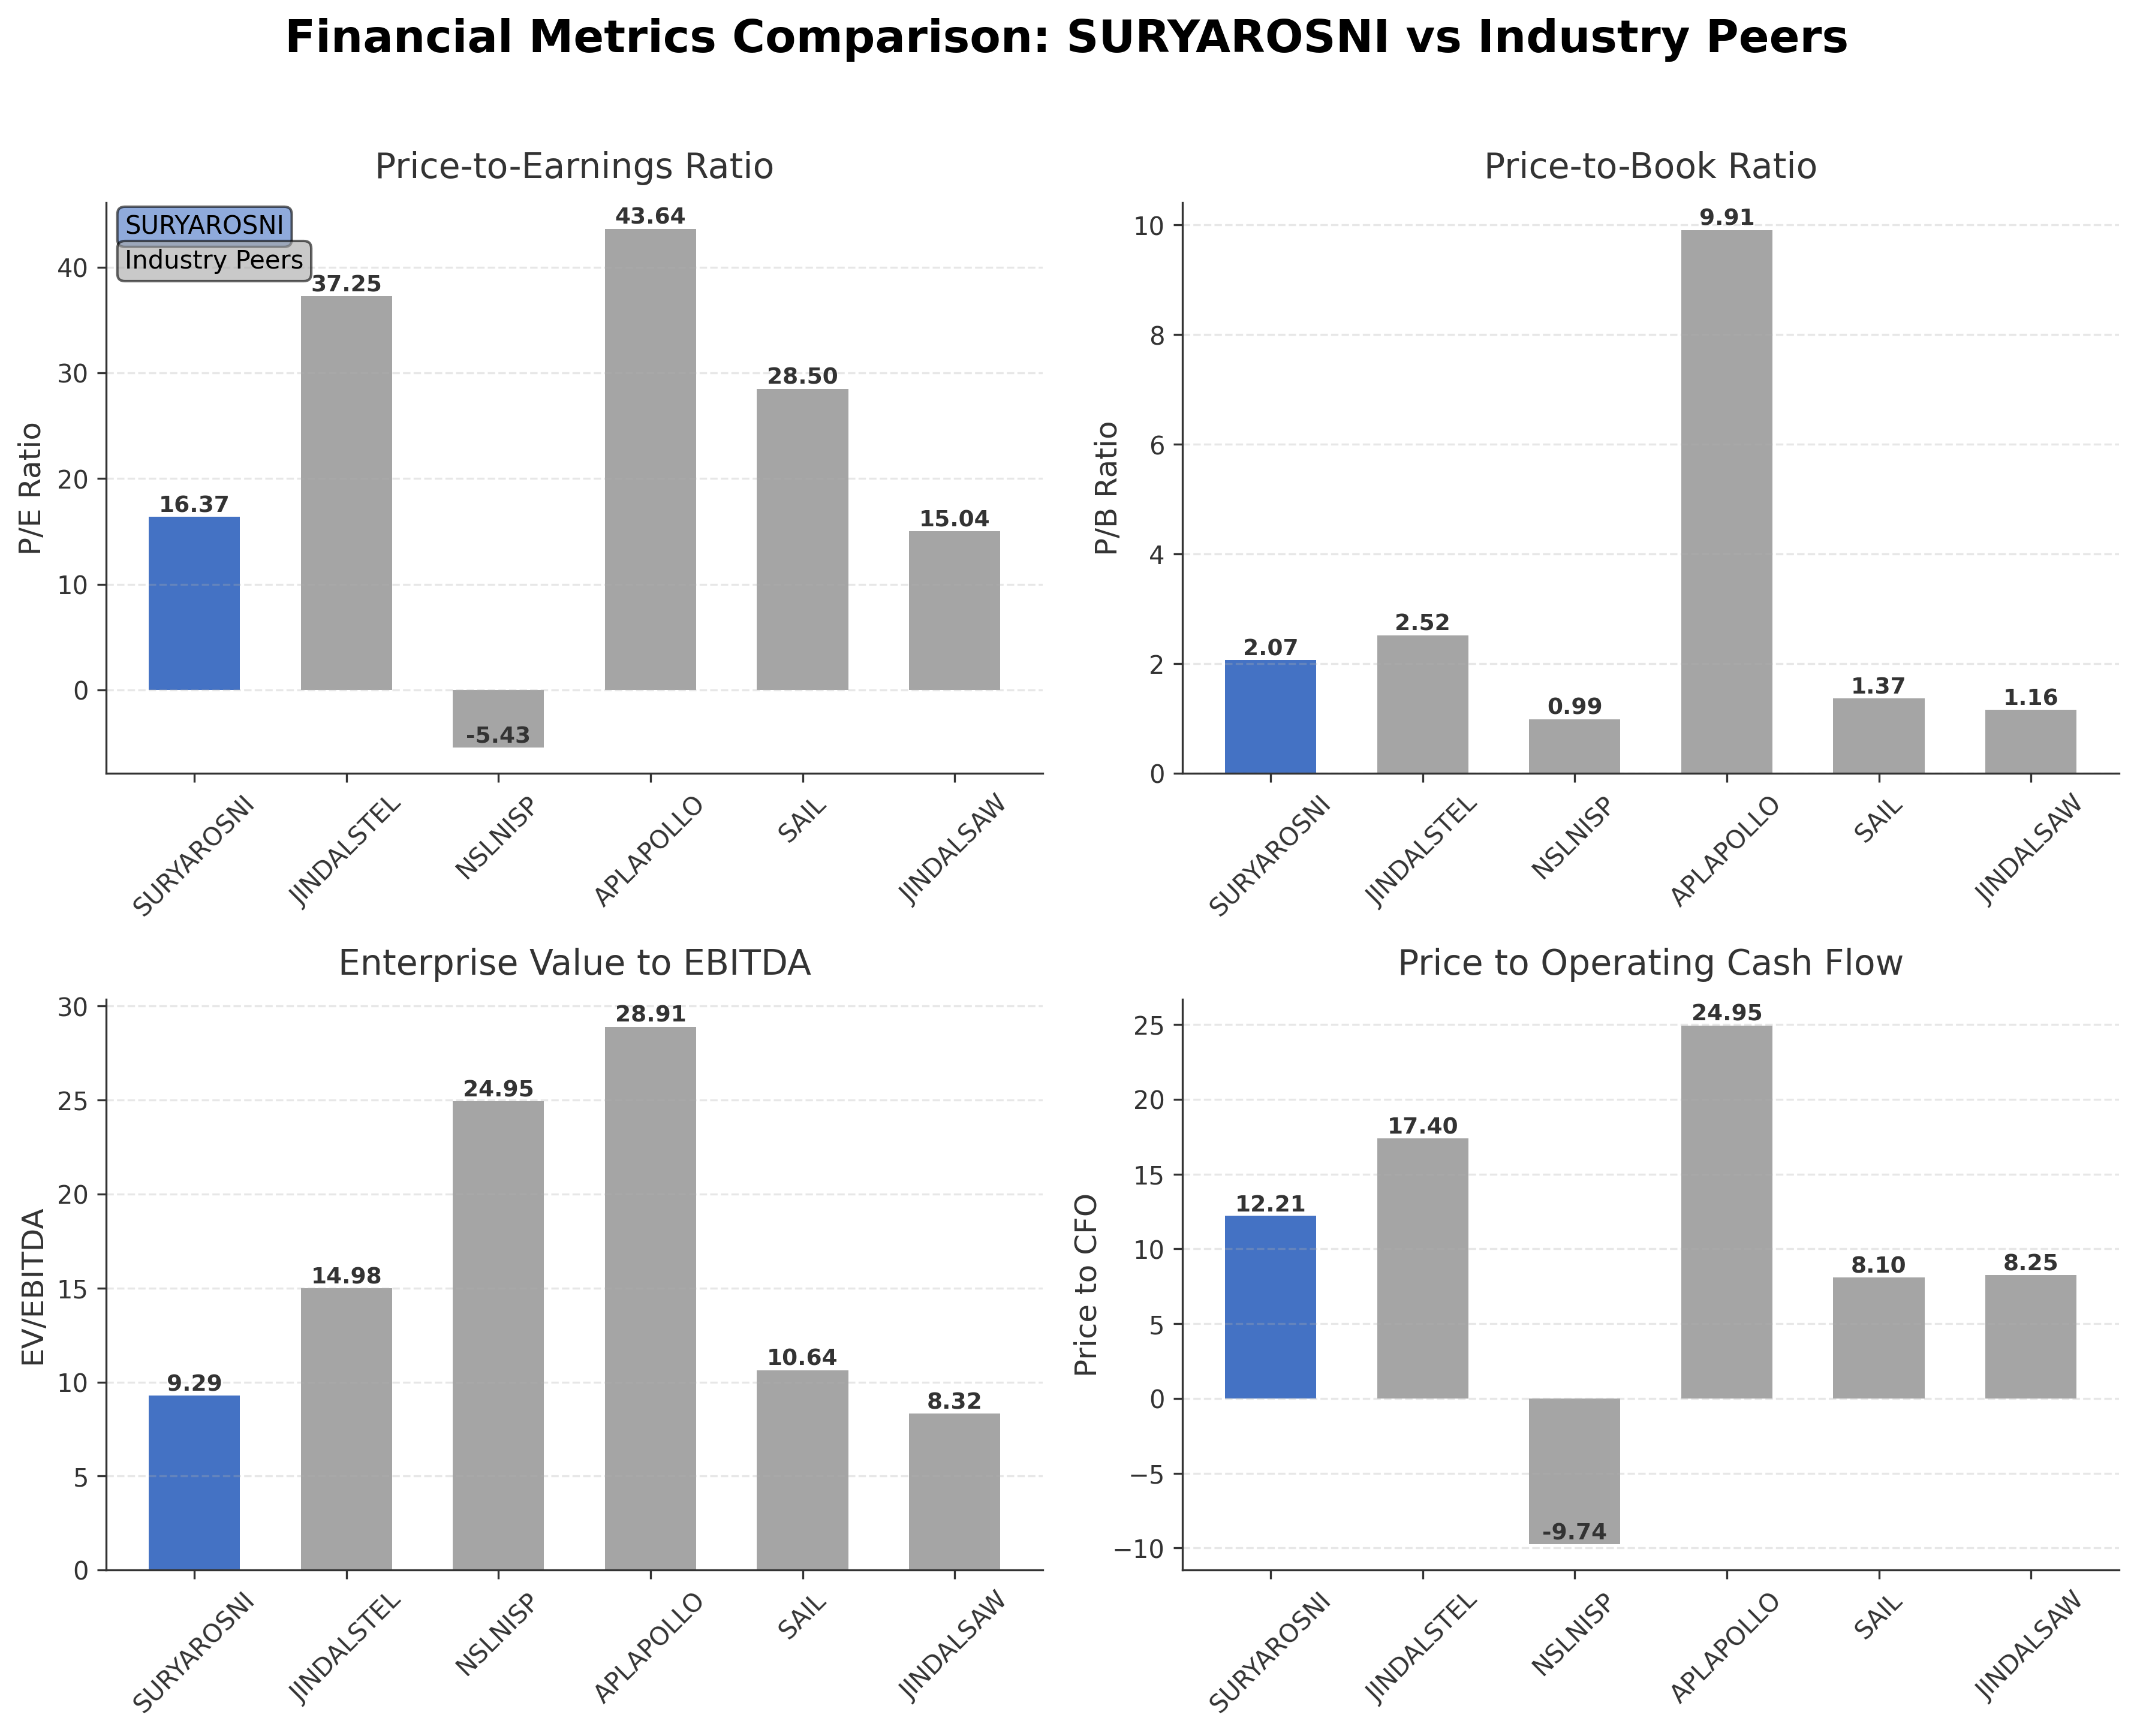
Comparison Analysis: Surya Roshni Ltd. trades at a moderate valuation with a P/E ratio of 16.37, which is significantly lower than larger peers like Jindal Steel & Power Ltd. (37.25) and Apl Apollo Tubes Ltd. (43.64), but higher than Jindal Saw Ltd. (15.04). Its price-to-book ratio of 2.07 is higher than Steel Authority of India Limited (1.37) and Jindal Saw Ltd. (1.16), indicating a relatively premium valuation on book value. The EV/EBITDA multiple of 9.29 is below the peer average, suggesting better operational valuation compared to peers such as Apl Apollo Tubes Ltd. (28.91) and Nmdc Steel Ltd. (24.95). Surya Roshni’s return on equity of 14.06% is robust relative to most peers except Apl Apollo Tubes Ltd., which reports 25%. Overall, Surya Roshni presents a balanced profile with moderate valuation and solid profitability metrics within its regional steel sector peer group.
Financial Metrics Comparison with Peers
Financial Statements
Comprehensive financial data including income, balance sheet, and cash flow metrics
Income Statement
| fiscal_date | 2025-03-31 | 2024-03-31 | 2023-03-31 | 2022-03-31 | 2021-03-31 |
|---|---|---|---|---|---|
| Sales | 73.85B | 77.62B | 79.75B | 77.12B | 55.43B |
| Cost Of Goods | 56.83B | 61.26B | 62.70B | 62.35B | 43.77B |
| Gross Profit | 17.02B | 16.36B | 17.04B | 14.76B | 11.66B |
| Operating Expense Selling General And Administrative | 4.38B | 3.93B | 4.54B | 4.55B | 2.68B |
| Operating Expense Other Operating Expenses | 2.92B | 3.00B | 2.81B | 2.46B | 2.22B |
| Operating Income | 4.59B | 4.58B | 5.00B | 3.39B | 2.81B |
| Non Operating Interest Income | 239.30M | 85.00M | 52.40M | 55.80M | 40.70M |
| Non Operating Interest Expense | 189.80M | 219.00M | 380.50M | 546.70M | 636.90M |
| Pretax Income | 4.65B | 4.45B | 4.59B | 2.77B | 2.11B |
| Income Tax | 1.19B | 1.16B | 1.24B | 717.30M | 531.60M |
| Net Income | 3.47B | 3.29B | 3.36B | 2.05B | 1.58B |
| Eps Basic | 15.95 | 15.26 | 31.39 | 19.20 | 14.68 |
| Eps Diluted | 15.93 | 15.12 | 30.83 | 18.83 | 14.55 |
| Basic Shares Outstanding | 217.31M | 215.76M | 106.88M | 106.73M | 107.90M |
| Diluted Shares Outstanding | 217.31M | 215.76M | 106.88M | 106.73M | 107.90M |
| Ebit | 4.84B | 4.67B | 4.97B | 3.31B | 2.75B |
| Ebitda | 6.04B | 5.83B | 6.13B | 4.44B | 3.82B |
| Net Income Continuous Operations | 4.65B | 4.45B | 4.59B | 2.77B | 2.11B |
| Minority Interests | 0.00 | 0.00 | 0.00 | 0.00 | N/A |
| Preferred Stock Dividends | 0.00 | 0.00 | 0.00 | 0.00 | 0.00 |
Source: Financial statements and regulatory filings
Balance Sheet
| fiscal_date | 2025-03-31 | 2024-03-31 | 2023-03-31 | 2022-03-31 | 2021-03-31 |
|---|---|---|---|---|---|
| Cash And Cash Equivalents | 199.60M | 349.90M | 11.10M | 2.60M | 2.60M |
| Accounts Receivable | 8.97B | 7.18B | 7.47B | 8.88B | 7.56B |
| Total Assets | 32.34B | 29.22B | 30.57B | 31.15B | 29.41B |
| Total Liabilities | 7.69B | 7.55B | 11.94B | 15.67B | 15.74B |
| Long Term Debt | 80.00M | 64.60M | 68.20M | 676.90M | 1.86B |
| Shareholders Equity | 24.65B | 21.66B | 18.64B | 15.48B | 13.67B |
Source: Financial statements and regulatory filings
Cash Flow Statement
| fiscal_date | 2025-03-31 | 2024-03-31 | 2023-03-31 | 2022-03-31 | 2021-03-31 |
|---|---|---|---|---|---|
| Operating Activities Net Income | 4.65B | 4.45B | 4.59B | 2.77B | 2.11B |
| Operating Activities Stock Based Compensation | 16.00M | 63.80M | 70.10M | 65.30M | 13.70M |
| Operating Activities Other Non Cash Items | 48.80M | 175.00M | 380.40M | 636.50M | 698.60M |
| Operating Activities Accounts Receivable | -1.79B | 287.80M | 1.41B | -1.33B | -630.80M |
| Operating Activities Other Assets Liabilities | 1.33B | 948.10M | -1.41B | -708.80M | 937.70M |
| Operating Activities Operating Cash Flow | 4.26B | 5.92B | 5.04B | 1.43B | 3.13B |
| Investing Activities Capital Expenditures | -1.40B | -514.60M | -331.80M | -536.20M | -658.80M |
| Investing Activities Investing Cash Flow | -1.40B | -514.60M | -331.80M | -536.20M | -658.80M |
| Financing Activities Short Term Debt Issuance | -6.50M | -4.00B | -1.15B | 262.90M | -2.69B |
| Financing Activities Common Stock Issuance | 23.80M | 175.50M | 120.10M | -234.00M | -138.30M |
| Financing Activities Common Dividends | -544.10M | -489.70M | -380.90M | -81.60M | -190.40M |
| Financing Activities Financing Cash Flow | -526.80M | -4.32B | -2.02B | -1.93B | -4.20B |
| End Cash Position | 199.60M | 349.90M | 11.10M | 2.60M | 2.60M |
| Free Cash Flow | 2.44B | 4.78B | 2.44B | 2.27B | 4.72B |
| Financing Activities Long Term Debt Payments | N/A | 0.00 | -606.70M | -1.63B | -1.30B |
| Financing Activities Long Term Debt Issuance | N/A | N/A | 0.00 | 0.00 | 250.00M |
| Financing Activities Common Stock Repurchase | N/A | N/A | N/A | -245.60M | -138.30M |
| Investing Activities Net Acquisitions | N/A | N/A | N/A | N/A | 0.00 |
| Financing Activities Other Financing Charges | N/A | N/A | N/A | N/A | N/A |
Source: Financial statements and regulatory filings
Technical Analysis
Key Insights
- The current trend shows a mild upward momentum with the stock price trading above the 50-day moving average (₹226.99) but below the 200-day moving average (₹258.54), indicating a potential consolidation phase.
- Key support levels are identified near ₹187.35 (52-week low) and ₹225, while resistance is observed around ₹259 and the 52-week high of ₹359.
- The stock is positioned above the 10-day moving average, suggesting short-term bullishness, but remains under the longer-term 200-day average, indicating mixed medium-term signals.
- Momentum indicators show an RSI near neutral levels, MACD reflecting a recent crossover signaling potential momentum shift, and Stochastic oscillators indicating neither overbought nor oversold conditions.
- Multi-timeframe analysis reveals daily charts showing consolidation, weekly charts indicating sideways movement, and monthly charts suggesting a longer-term uptrend with intermittent corrections.
- Potential market scenarios include a breakout above the 200-day moving average triggering renewed buying interest or a fallback to support levels if momentum weakens, warranting close monitoring of volume and momentum shifts.
Trending News
1. Headline: Small-cap stock Surya Roshni share price jumps over 2.5% amid reports of business demerger | Stock Market News
Summary: Surya RoshniDemergerIndian Stock MarketStock Market TodayGet Latest real-time updates · Catch all the Business News , Market News , Breaking News Events and Latest News Updates on Live Mint.
Sentiment: positive
2. Headline: Surya Roshni Ltd Shares Rise Amid Buzz Around Proposed Business Demerger - www.lokmattimes.com
Summary: Surya Roshni Ltd Shares Rise Amid Buzz Around Proposed Business Demerger - New Delhi [India], May 14: Shares of Surya Roshni Ltd have witnessed a sharp rally in recent trading sessions ... Get Latest News on Business only on lokmattimes.com
Sentiment: positive
3. Headline: Lokmattimes
Summary: New Delhi [India], May 14: Shares of Surya Roshni Ltd have witnessed a sharp rally in recent trading sessions amid market speculation that the company may be planning a demerger of its business operations into two separate entities.
Sentiment: positive
4. Headline: Surya Roshni Stock Rallies 25% Amid Buzz Over Demerger of Steel Pipe and Lighting Businesses | Republic World
Summary: Shares of Surya Roshni Ltd have rallied in recent trading sessions, fueled by growing market buzz regarding a major corporate restructuring. Investors are flocking to the stock amid speculation that the company may be planning to demerge its core operations into two distinct entities.
Sentiment: positive
5. Headline: Surya Roshni Ltd is Rated Sell
Summary: The 'Sell' rating assigned to Surya Roshni Ltd indicates a cautious stance for investors, suggesting that the stock may underperform relative to the broader market or its sector peers. This rating is derived from a comprehensive evaluation of four key parameters: Quality, Valuation, Financial ...
Sentiment: negative
Recent Updates
News Summary
As of 2026-05-19. Surya Roshni Ltd has experienced a notable share price increase following reports of a potential business demerger that would separate its lighting and consumer products segment from the steel pipes and strips business. This restructuring aims to create two independently managed entities to enhance strategic focus and growth opportunities. Additionally, the company secured two export orders from the United States, including a significant $1.9 million contract for ERW Carbon Steel Pipes, reinforcing its export growth strategy. These developments underscore Surya Roshni's efforts to optimize its business structure and expand international sales, contributing positively to market sentiment.
News Sentiment
The overall sentiment from recent updates is predominantly positive, driven by investor enthusiasm around the proposed business demerger and the securing of substantial export orders from the US. The demerger speculation has sparked a rally in the stock price, reflecting market optimism about operational focus and value unlocking. Meanwhile, the export contracts highlight the company’s growing international footprint, supporting revenue growth prospects. However, some caution is noted from external ratings assigning a 'Sell' stance due to valuation concerns, indicating a mixed but generally constructive outlook based on current business developments.
Source List
- https://www.livemint.com/market/stock-market-news/small-cap-stock-surya-roshni-share-price-jumps-over-2-5-amid-reports-of-business-demerger-11779167071851.html
- https://whalesbook.com/corporate-news/English/industrial-goodsservices/Surya-Roshni-Secures-dollar19-Million-US-Order-for-Steel-Pipes/69ef4e205a43f6b807c0fee0
Analytical Overview
Analysis Summary
Surya Roshni's valuation metrics, including a trailing P/E of 16.37 and forward P/E of 12.07, are below the industry average P/E of 16.37, suggesting the stock is reasonably priced relative to its earnings potential. The PEG ratio of 0.21 further indicates undervaluation relative to growth prospects. The company exhibits a steady growth trajectory with a quarterly revenue growth rate of 3.2% and positive operating and free cash flow trends, reflecting operational stability and efficient cash management. Financial health appears solid with a low total debt to equity ratio of 4.93 and a strong current ratio of 2.97, indicating ample liquidity and manageable leverage. Sector-specific opportunities include expanding infrastructure demand and export growth, while challenges involve competitive pressures and regulatory risks in the steel and lighting markets. Considering India-specific factors, the company benefits from favorable government infrastructure initiatives and growing domestic consumption, though it must navigate evolving regulatory frameworks and commodity price volatility.
Overall Business and Market Assessment
Supporting Factors: Surya Roshni’s reasonable valuation relative to peers, consistent revenue growth, and strong liquidity position
Risk Factors: sector cyclicality, competitive dynamics, and the impact of any corporate restructuring such as the proposed demerger
SWOT Analysis
Strengths
- Established market presence with diversified product portfolio in lighting and steel pipes.
- Strong liquidity position with a current ratio of 2.97 and cash reserves near ₹5 billion.
- Moderate valuation metrics with a trailing P/E of 16.37 and PEG ratio of 0.21 indicating growth potential.
- Robust return on equity of 14.06% reflecting efficient capital utilization.
Weaknesses
- Relatively low institutional ownership at 2.76%, limiting broader market support.
- Declining quarterly earnings growth of -11.4% indicating recent profitability pressures.
- High promoter shareholding concentration may limit external governance influence.
- Operating margin of 5.8% suggests moderate operational efficiency compared to peers.
Opportunities
- Potential business demerger could unlock value and enhance strategic focus.
- Growing export orders, including significant US contracts, support international expansion.
- Increasing demand in Indian infrastructure and urban development sectors.
- Expansion of value-added product lines such as 3LPE coated and alkyd pipes.
Threats
- Volatility in steel prices and raw material costs impacting margins.
- Intense competition within the steel and lighting industries.
- Regulatory changes affecting manufacturing and export operations.
- Macroeconomic uncertainties potentially dampening infrastructure spending.
Company Description
Surya Roshni Ltd. is a prominent Indian company specializing in the manufacturing of lighting products and steel pipes. The primary function of the company is to provide energy-efficient lighting solutions and high-quality steel pipes, catering to both domestic and international markets. Surya Roshni plays a crucial role in the steel and lighting sectors, offering a wide array of products such as LED and conventional lighting systems, ERW steel pipes, and cold rolled steel strips. These products are pivotal in various industries, including construction, energy, and urban infrastructure development. Established in 1973, Surya Roshni has grown to become a leading player with a significant market presence and a strong distribution network. Known for its commitment to innovation and quality, the company continues to contribute to India's infrastructure growth and development through its diverse and high-performing product lines.