
Super Micro Computer Inc (SMCI)
Stock Analysis Report
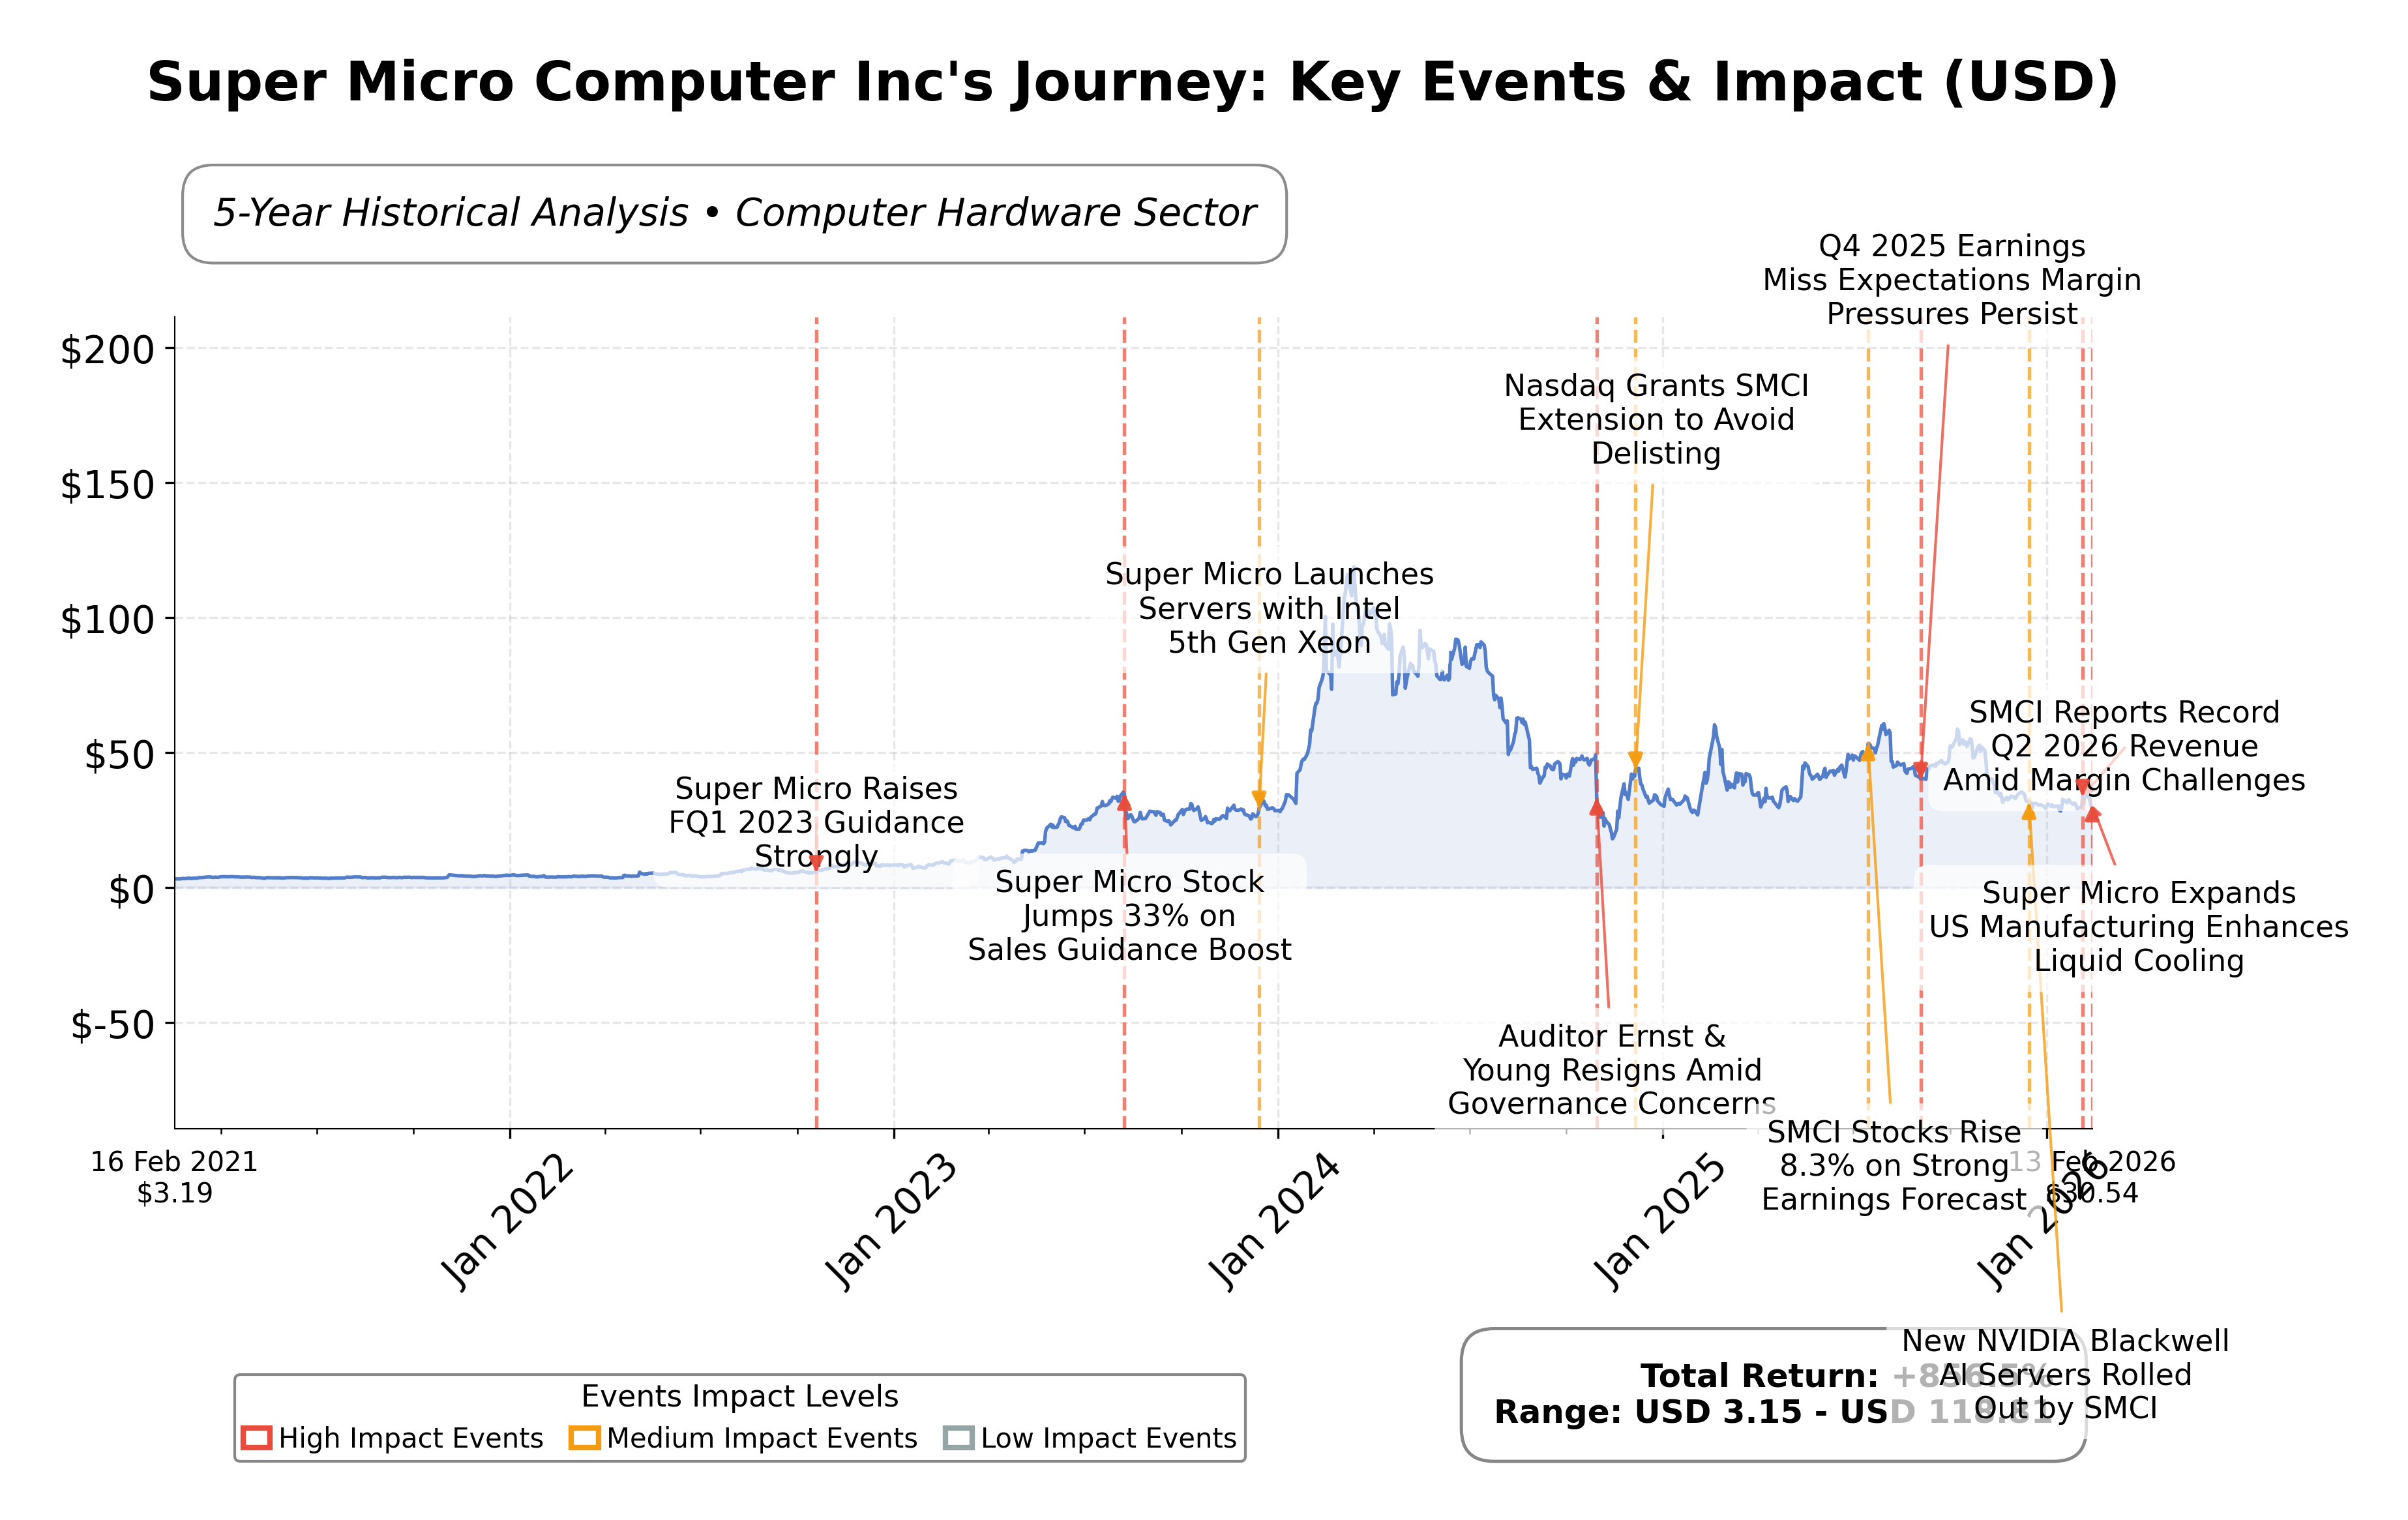
Stock Journey
Key Positives and Key Risks
Pros
- Revenue growth of 23.4% quarterly and earnings growth of 24.9% year-over-year demonstrate strong operational momentum.
- Forward P/E ratio of 10.31 suggests potential for earnings expansion relative to current valuation.
- Institutional ownership at 56.01% indicates substantial professional investor confidence and governance support.
Cons
- Debt-to-equity ratio of 75.28% reflects moderate leverage, posing financial risk under adverse conditions.
- Profit margin of 3.11% is relatively thin, highlighting potential vulnerability to cost pressures.
- Stock price has declined significantly from its 52-week high, with a downside risk of 54.02%, indicating elevated volatility.
Disclosure: This information is for general awareness and does not constitute investment advice
Report Summary
Super Micro Computer Inc (SMCI) operates as a prominent player in the computer hardware industry, focusing on high-performance server and storage solutions tailored for enterprise data centers, cloud computing, AI, 5G, and edge computing. Founded in 1993 and headquartered in San Jose, California, the company is well-positioned in the technology hardware sector, serving global markets including the United States, Asia, and Europe. Its product portfolio spans rackmount servers, GPU and twin servers, modular blade servers, and comprehensive rack-scale solutions, supported by global installation and maintenance services. Financially, SMCI reported a market capitalization of approximately $18.29 billion with a trailing P/E ratio of 22.29 and a forward P/E of 10.31, indicating potential valuation adjustments ahead. The companyâs revenue for the trailing twelve months reached about $28.06 billion, with a profit margin of 3.11% and a return on equity of 13.19%. The enterprise value to EBITDA ratio stands at 17.73, reflecting moderate valuation relative to earnings. The balance sheet shows a current ratio of 1.70 and a debt-to-equity ratio of 75.28%, with cash reserves exceeding $4.1 billion. From a strategic and technical perspective, SMCI has recently undergone a 10-for-1 stock split and maintains a beta of 1.52, suggesting higher volatility relative to the market. Institutional ownership is significant at 56.01%, with insider holdings at 16.44%. Recent news highlights mixed institutional activity, including stake increases by some funds and reductions by others. The companyâs strengths include its diversified product range and global footprint, while risks involve margin pressures and competitive challenges in the AI and server markets. Peer analysis within the U.S. computer hardware sector reveals that SMCIâs valuation metrics are moderate compared to larger peers like Arista Networks and Dell Technologies. While Arista commands a much higher market cap and P/E ratio, Dell shows a lower P/E but negative return on equity. SMCIâs price-to-book and EV/EBITDA ratios position it between these peers, reflecting a balanced valuation stance in its competitive landscape. Super Micro Computer stands at a pivotal juncture, leveraging its technological expertise and market reach amid evolving industry demands for AI and cloud infrastructure. The companyâs recent earnings growth and strategic initiatives underscore its capacity to capitalize on these trends, though it faces ongoing margin and competitive pressures. The current market environment presents both opportunities and challenges, with the companyâs trajectory dependent on execution and market dynamics. Observers evaluating the stock may find a nuanced profile warranting close monitoring, balancing growth potential against valuation and sector-specific risks.",
Company and Industry Overview
Company Basics
Price Performance
Company Size
Shareholding Pattern
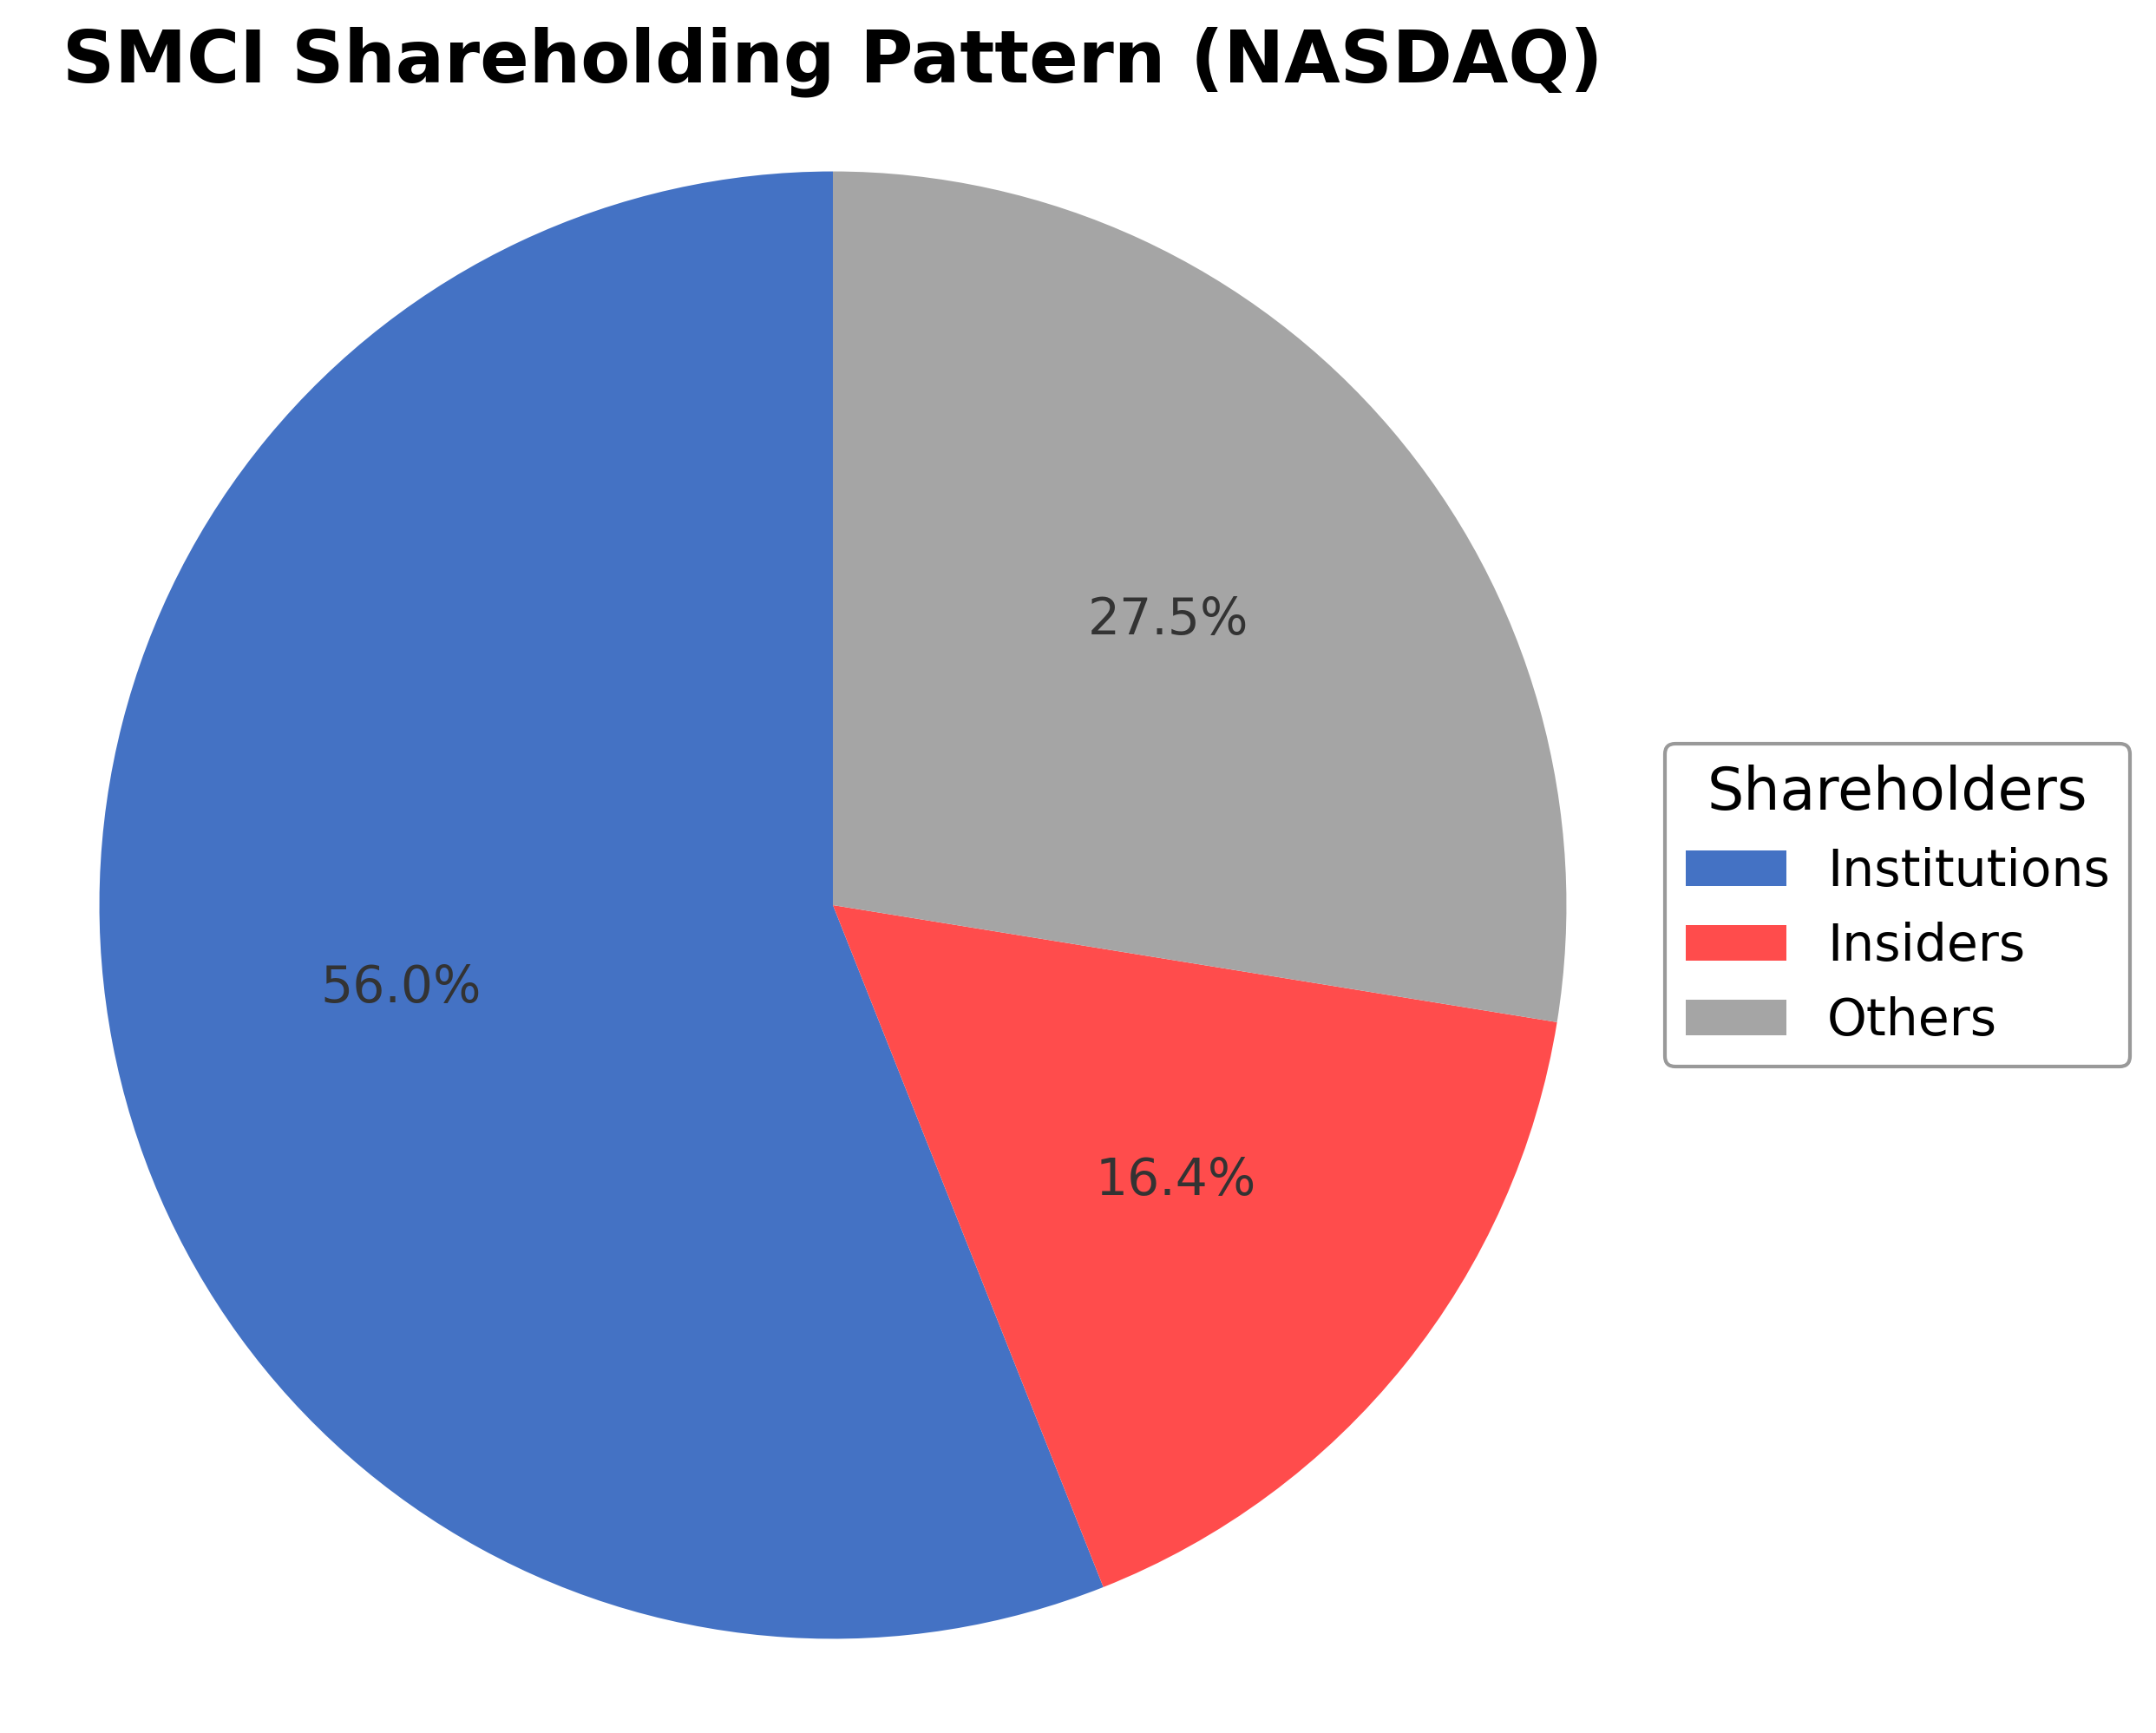
Super Micro Computer Inc's ownership structure is characterized by 16.44% held by insiders including executives and board members, while institutional investors hold a majority stake at 56.01%, reflecting strong institutional interest and confidence. The remaining 27.55% is held by public shareholders, comprising retail investors and employee stock plans. Over the past 12-24 months, institutional ownership has seen mixed activity with some funds increasing positions, such as Avantis U.S. Quality ETF, while others like ING Groep NV and Cibc World Market Inc. have reduced stakes. This pattern indicates a nuanced market sentiment balancing optimism with caution. The substantial institutional presence suggests governance and strategic decisions are likely influenced by professional investors, which may impact future corporate actions and strategic direction. Overall, the shareholding pattern reflects a well-distributed ownership base with active institutional engagement in the competitive computer hardware sector.
Sector and Industry Analysis
Super Micro Computer Inc (SMCI) operates within the broader Technology sector, specifically in the computer hardware and server manufacturing industry. This sector is characterized by rapid innovation, significant capital investment, and a global customer base spanning enterprise, cloud service providers, and hyperscale data centers. The global server and storage market, a core segment for SMCI, is sizable—estimated in the tens of billions of dollars—and is projected to grow at a moderate compound annual growth rate (CAGR) driven by increasing data generation, cloud adoption, and edge computing deployments. Key players include industry giants such as Dell Technologies, Hewlett Packard Enterprise, Lenovo, and Cisco Systems, alongside specialized firms like SMCI that emphasize high-performance, customizable server solutions.
Industry trends are heavily influenced by technological advancements and shifting consumer demands. The proliferation of artificial intelligence (AI), machine learning, and big data analytics has heightened demand for high-density, energy-efficient, and scalable server architectures. Additionally, the rise of hybrid and multi-cloud strategies among enterprises is fueling demand for flexible, interoperable hardware solutions. Edge computing is emerging as a significant growth opportunity, requiring compact, low-latency server systems closer to data sources. Sustainability considerations are also increasingly shaping product development, with customers seeking energy-efficient and environmentally responsible hardware options. These dynamics compel manufacturers to innovate rapidly and tailor offerings to diverse, evolving workloads.
The regulatory landscape for computer hardware manufacturers is multifaceted, encompassing international trade policies, environmental regulations, and cybersecurity standards. Compliance with export controls, such as U.S. restrictions on technology transfers to certain countries, impacts supply chain and market access strategies. Environmental regulations, including the Restriction of Hazardous Substances (RoHS) directive and Waste Electrical and Electronic Equipment (WEEE) regulations in the EU, mandate responsible material usage and end-of-life product management. Additionally, data security and privacy regulations indirectly affect hardware providers by imposing requirements on the security features embedded in their products. Navigating this complex regulatory environment requires robust compliance frameworks and proactive engagement with policy developments.
Competitive dynamics in the server and hardware manufacturing industry are shaped by high capital intensity, rapid technological change, and strong customer relationships. Barriers to entry include the need for substantial R&D investment, established supply chain networks, and certifications for quality and interoperability. Market structure tends toward oligopolistic competition, with a few dominant players controlling significant market share, while niche firms like SMCI differentiate through specialization in customized, high-performance solutions. Competitive positioning hinges on innovation speed, product reliability, cost efficiency, and the ability to provide integrated solutions that meet specific customer requirements. Strategic partnerships and supply chain resilience are also critical competitive factors in this fast-evolving industry landscape.
Note: Analysis synthesized from industry research, market reports, and regulatory filings. Information is subject to change based on market conditions.
Illustrative Scenario Analysis
DCF Assumptions:
Method: Two-Stage EPS-Priority Model
Financials
Peer Analysis
| Company Name | Market Cap | P/E Ratio | P/B Ratio | EV/EBITDA | Price to CFO |
|---|---|---|---|---|---|
| Super Micro Computer Inc | $18.29B | 22.29 | 2.62 | 17.73 | 33.32 |
| Arista Networks, Inc. | $178.30B | 51.49 | 14.40 | 42.60 | 40.78 |
| Dell Technologies Inc. | $78.74B | 15.71 | -29.90 | 9.56 | 11.10 |
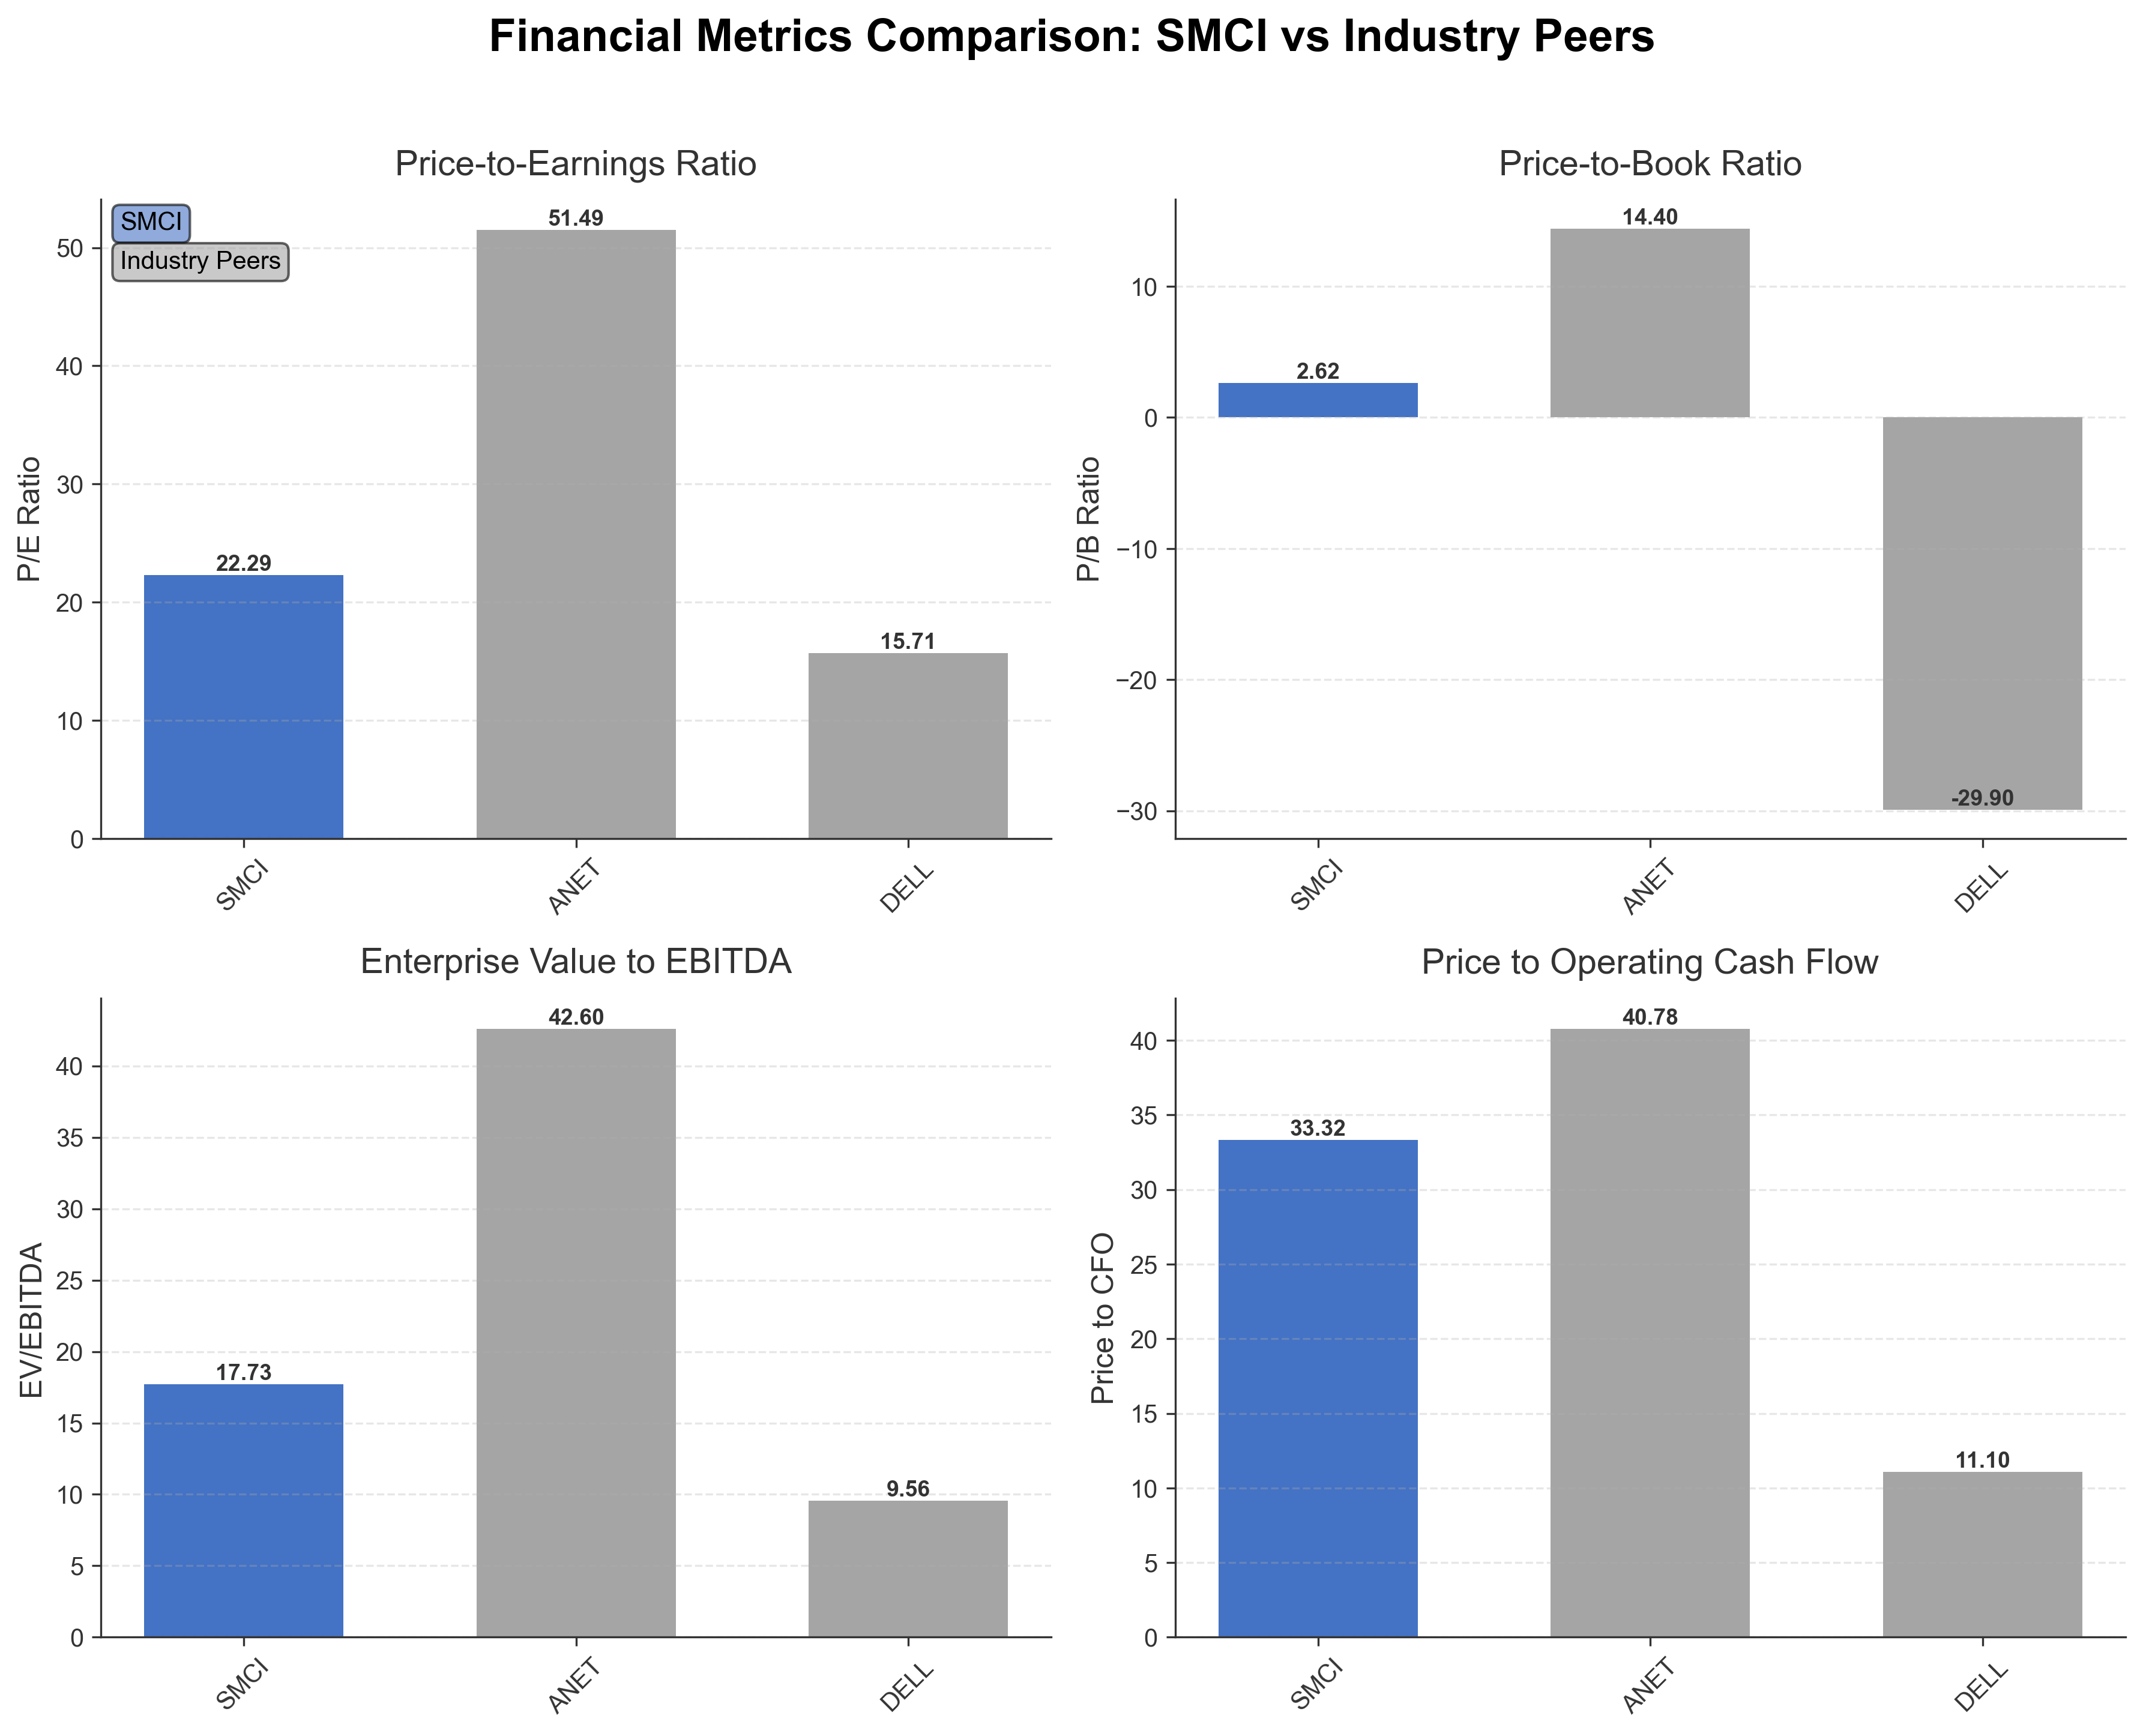
Comparison Analysis: Super Micro Computer Inc exhibits moderate valuation metrics relative to its U.S. computer hardware peers. Its P/E ratio of 22.29 is lower than Arista Networks' 51.49 but higher than Dell Technologies' 15.71, indicating a middle valuation tier. The price-to-book ratio at 2.62 is significantly lower than Arista's 14.40 and contrasts with Dell's negative figure, suggesting a more stable book value assessment. EV/EBITDA of 17.73 positions SMCI between the higher multiple of Arista (42.60) and the lower multiple of Dell (9.56). Return on equity at 13.19% reflects positive profitability, outperforming Dell's negative return but trailing Arista's 31%. Overall, SMCI maintains a balanced profile within its peer group, combining moderate valuation with solid profitability metrics.
Financial Metrics Comparison with Peers
Financial Statements
Comprehensive financial data including income, balance sheet, and cash flow metrics
Income Statement
| fiscal_date | 2025-06-30 | 2024-06-30 | 2023-06-30 | 2022-06-30 | 2021-06-30 |
|---|---|---|---|---|---|
| Sales | 21.97B | 14.99B | 7.12B | 5.20B | 3.56B |
| Cost Of Goods | 19.54B | 12.93B | 5.84B | 4.40B | 3.02B |
| Gross Profit | 2.43B | 2.06B | 1.28B | 800.00M | 534.54M |
| Operating Expense Research And Development | 636.55M | 463.55M | 307.26M | 272.27M | 224.37M |
| Operating Expense Selling General And Administrative | 540.38M | 387.09M | 214.61M | 192.56M | 186.22M |
| Operating Income | 1.25B | 1.21B | 761.14M | 335.17M | 123.95M |
| Non Operating Interest Expense | 59.57M | 19.35M | 10.49M | 6.41M | 2.48M |
| Other Income Expense | 18.50M | 22.72M | 3.65M | 8.08M | -2.83M |
| Pretax Income | 1.21B | 1.21B | 754.30M | 336.83M | 118.63M |
| Income Tax | 156.85M | 63.29M | 110.67M | 52.88M | 6.94M |
| Net Income | 1.05B | 1.15B | 640.00M | 285.16M | 111.86M |
| Eps Basic | 1.77 | 2.17 | 1.21 | 0.55 | 0.22 |
| Eps Diluted | 1.68 | 2.01 | 1.14 | 0.53 | 0.21 |
| Basic Shares Outstanding | 593.66M | 555.88M | 529.25M | 514.78M | 511.57M |
| Diluted Shares Outstanding | 593.66M | 555.88M | 529.25M | 514.78M | 511.57M |
| Ebit | 1.27B | 1.23B | 764.79M | 343.25M | 121.11M |
| Ebitda | 1.33B | 1.27B | 799.69M | 375.72M | 149.30M |
| Net Income Continuous Operations | 1.05B | 1.15B | 640.00M | 285.16M | 111.86M |
Data provided by Twelve Data
Balance Sheet
| fiscal_date | 2025-06-30 | 2024-06-30 | 2023-06-30 | 2022-06-30 | 2021-06-30 |
|---|---|---|---|---|---|
| Cash And Cash Equivalents | 5.17B | 1.67B | 440.46M | 267.40M | 232.27M |
| Accounts Receivable | 2.20B | 2.74B | 1.15B | 834.51M | 463.83M |
| Total Assets | 14.02B | 9.83B | 3.67B | 3.21B | 2.24B |
| Total Liabilities | 7.72B | 4.41B | 1.70B | 1.78B | 1.15B |
| Long Term Debt | 4.68B | 1.77B | 120.18M | 147.62M | 49.24M |
| Shareholders Equity | 6.30B | 5.42B | 1.97B | 1.43B | 1.10B |
Data provided by Twelve Data
Cash Flow Statement
| fiscal_date | 2025-06-30 | 2024-06-30 | 2023-06-30 | 2022-06-30 | 2021-06-30 |
|---|---|---|---|---|---|
| Operating Activities Net Income | 1.05B | 1.15B | 640.00M | 285.16M | 111.86M |
| Operating Activities Depreciation | 58.34M | 40.98M | 34.90M | 32.47M | 28.18M |
| Operating Activities Deferred Taxes | -214.64M | -168.50M | -92.97M | -6.82M | -8.39M |
| Operating Activities Stock Based Compensation | 314.45M | 231.51M | 54.43M | 32.82M | 28.55M |
| Operating Activities Other Non Cash Items | 7.19M | 12.34M | -668.00K | 368.00K | -1.04M |
| Operating Activities Accounts Receivable | 533.34M | -1.59B | -311.90M | -372.44M | -60.15M |
| Operating Activities Accounts Payable | -180.97M | 679.19M | 127.14M | 50.15M | 189.31M |
| Operating Activities Other Assets Liabilities | -37.69M | -2.78B | 166.21M | -483.65M | -195.14M |
| Operating Activities Operating Cash Flow | 1.53B | -2.42B | 617.14M | -461.95M | 93.19M |
| Investing Activities Capital Expenditures | -127.21M | -124.28M | -36.79M | -45.18M | -58.02M |
| Investing Activities Net Acquisitions | 0.00 | -296.00K | -2.19M | 0.00 | 0.00 |
| Investing Activities Purchase Of Investments | -56.00M | -69.67M | -500.00K | -1.10M | 0.00 |
| Investing Activities Investing Cash Flow | -183.21M | -194.25M | -39.49M | -46.28M | -58.02M |
| Financing Activities Long Term Debt Issuance | 2.94B | 1.70B | 1.09B | 1.15B | 127.06M |
| Financing Activities Long Term Debt Payments | -1.77B | -1.97B | -1.39B | -640.70M | -60.63M |
| Financing Activities Short Term Debt Issuance | -380.66M | 188.98M | N/A | 0.00 | 0.00 |
| Financing Activities Common Stock Issuance | 0.00 | 2.31B | N/A | N/A | N/A |
| Financing Activities Common Stock Repurchase | -200.00M | 0.00 | -150.00M | 0.00 | -130.00M |
| Financing Activities Other Financing Charges | -355.86M | -316.46M | -28.20M | -10.67M | -9.28M |
| Financing Activities Financing Cash Flow | 234.50M | 1.91B | -478.73M | 501.95M | -72.85M |
| End Cash Position | 5.17B | 1.67B | 440.96M | 268.56M | 233.45M |
| Income Tax Paid | 327.16M | 392.02M | 114.96M | 19.69M | 2.91M |
| Interest Paid | 25.49M | 16.02M | 8.54M | 5.49M | 1.95M |
| Free Cash Flow | 1.53B | -2.61B | 626.79M | -485.98M | 64.94M |
| Investing Activities Sale Of Investments | N/A | N/A | N/A | N/A | N/A |
Data provided by Twelve Data
Technical Analysis
Key Insights
- The current trend direction shows a downward price movement with the stock trading below its 200-day moving average at $41.70 but above the 50-day moving average at $31.38, indicating mixed momentum.
- Key support levels are near the 52-week low at $27.60, while resistance is observed around the 52-week high of $66.44 and the 200-day moving average at $41.70.
- The stock price is positioned slightly below the 200-day moving average but above the 50-day moving average, suggesting short-term support amid longer-term resistance.
- Momentum indicators show a neutral RSI around mid-range levels, a MACD that has recently flattened, and a stochastic oscillator indicating neither overbought nor oversold conditions.
- Across daily, weekly, and monthly timeframes, the stock exhibits consolidation with intermittent volatility, reflecting uncertainty in trend direction.
- Potential market scenarios include a continuation of consolidation near current levels or a test of support at $27.60, with resistance challenges near $41.70 and higher levels contingent on broader market conditions.
Trending News
1. Headline: Why Nvidia, AMD, and Super Micro Computer Are No Longer Moving in Sync
Summary: An analysis on the divergence in stock price movements among Nvidia, AMD, and Super Micro Computer highlights changing market dynamics within the semiconductor and hardware sectors. The report discusses factors influencing the decoupling of these companies' performances, including differing growth trajectories and market expectations.
Sentiment: Neutral
2. Headline: Avantis U.S. Quality ETF Buys 3,589 Shares of Super Micro Computer Inc (SMCI)
Summary: Avantis U.S. Quality ETF increased its holdings in Super Micro Computer Inc by 47.99%, acquiring 3,589 additional shares to hold a total of 11,067 shares. This move reflects growing confidence in SMCI's prospects and contributes to institutional accumulation trends.
Sentiment: Positive
3. Headline: Super Micro Computer, Inc. $SMCI Shares Sold by Herald Investment Management Ltd
Summary: Herald Investment Management Ltd reduced its stake in Super Micro Computer by 4.6% during the third quarter, holding 719,500 shares as per its latest SEC filing. This partial divestment indicates a slight shift in institutional positioning within the company.
Sentiment: Positive
4. Headline: Super Micro Computer, Inc. $SMCI Stake Cut by ING Groep NV
Summary: ING Groep NV decreased its holdings in Super Micro Computer by 67.1% in the third quarter, retaining 22,210 shares following the reduction. This significant stake cut may reflect changing investment priorities or risk assessments by the fund.
Sentiment: Negative
5. Headline: Cibc World Market Inc. Has $8.54 Million Stake in Super Micro Computer, Inc. $SMCI
Summary: Cibc World Market Inc. reduced its holdings in Super Micro Computer by 9.0% during the third quarter, owning 178,088 shares after selling 17,000 shares. This adjustment reflects a modest institutional distribution amid broader market activity.
Sentiment: Negative
Powered by Brave
Recent Updates
News Summary
Recent news coverage of Super Micro Computer Inc reflects a mixed institutional ownership landscape with notable stake increases by Avantis U.S. Quality ETF and partial reductions by funds such as Herald Investment Management Ltd, ING Groep NV, and Cibc World Market Inc. Market analyses highlight the divergence of SMCI's stock movement from peers Nvidia and AMD, underscoring evolving sector dynamics. The company’s recent earnings and strategic outlook have generated positive sentiment, although margin pressures and competitive challenges persist. Overall, the news cycle emphasizes active portfolio adjustments by institutional investors and cautious optimism regarding SMCI's growth prospects amid shifting market conditions.
News Sentiment
The sentiment across recent news items is mixed but leans slightly positive, with institutional buying activity and favorable earnings commentary balanced against some notable stake reductions by major funds. Neutral market analyses and technical observations contribute to a balanced sentiment profile, indicating neither strong bullish nor bearish consensus but rather a watchful stance by market participants.
Analytical Overview
Analysis Summary
Valuation Metrics: Super Micro Computer's trailing P/E of 22.29 aligns closely with the industry average of 22.29, while the forward P/E of 10.31 suggests anticipated earnings growth or re-rating potential relative to peers.
Growth Trajectory: The company demonstrates strong revenue growth with a quarterly revenue increase of 23.4% and positive earnings growth of 24.9% year-over-year, supported by expanding cash flow generation.
Financial Health: A current ratio of 1.70 indicates adequate short-term liquidity, though the debt-to-equity ratio of 75.28% reflects moderate leverage requiring monitoring alongside cash flow metrics including operating cash flow of approximately $549 million.
Sector-Specific Factors: The computer hardware sector faces competitive pressures and margin challenges, particularly in AI and cloud infrastructure markets, but also benefits from growing demand for high-performance computing solutions.
Market Positioning: Super Micro Computer holds a competitive position with diversified product offerings and significant institutional ownership, enabling strategic flexibility amid evolving technology trends.
Investment Conclusion
Supporting Factors: No data
Risk Factors: No data
SWOT Analysis
Strengths
- The company offers a diversified portfolio of high-performance computing hardware solutions.
- Strong institutional ownership supports strategic decision-making and governance.
- Consistent revenue and earnings growth demonstrate operational effectiveness.
- Global presence across key markets enhances competitive positioning.
Weaknesses
- Moderate debt levels increase financial risk and require careful management.
- Profit margins remain relatively thin compared to industry leaders.
- Stock price volatility is elevated, as indicated by a beta of 1.52.
- Lack of dividend payments may limit appeal to income-focused stakeholders.
Opportunities
- Growing demand for AI, cloud computing, and 5G infrastructure drives market expansion.
- Potential to leverage technological innovation to capture new customer segments.
- Strategic partnerships or acquisitions could enhance product offerings and market reach.
- Increasing institutional interest may provide capital support for growth initiatives.
Threats
- Intense competition from larger technology hardware firms may pressure margins.
- Supply chain disruptions could impact production and delivery schedules.
- Rapid technological changes require continuous investment in R&D.
- Regulatory changes in key markets may affect operational flexibility.
Company Description
Super Micro Computer, Inc. is a leading provider of application-optimized total IT solutions, specializing in accelerated compute platforms. Founded in 1993 and headquartered in San Jose, California, the company develops high-performance server and storage systems tailored for enterprise data centers, cloud computing, artificial intelligence, 5G telecommunications, and edge computing applications. Its comprehensive product portfolio includes rackmount servers, GPU servers, twin servers, storage servers, modular blade servers, workstations, full rack-scale solutions, networking devices, server subsystems, and management software, along with global support services for installation, upgrades, and maintenance. Super Micro Computer, Inc. operates across the United States, Asia, and Europe, employing over 5,600 people to deliver innovative hardware in the technology hardware, storage, and peripherals industry. The company plays a pivotal role in powering demanding computational workloads, supporting advancements in AI, hyperscale data processing, and distributed computing infrastructures worldwide.