


Sunshield Chemicals Ltd (SUNSHIEL)
Stock Analysis Report
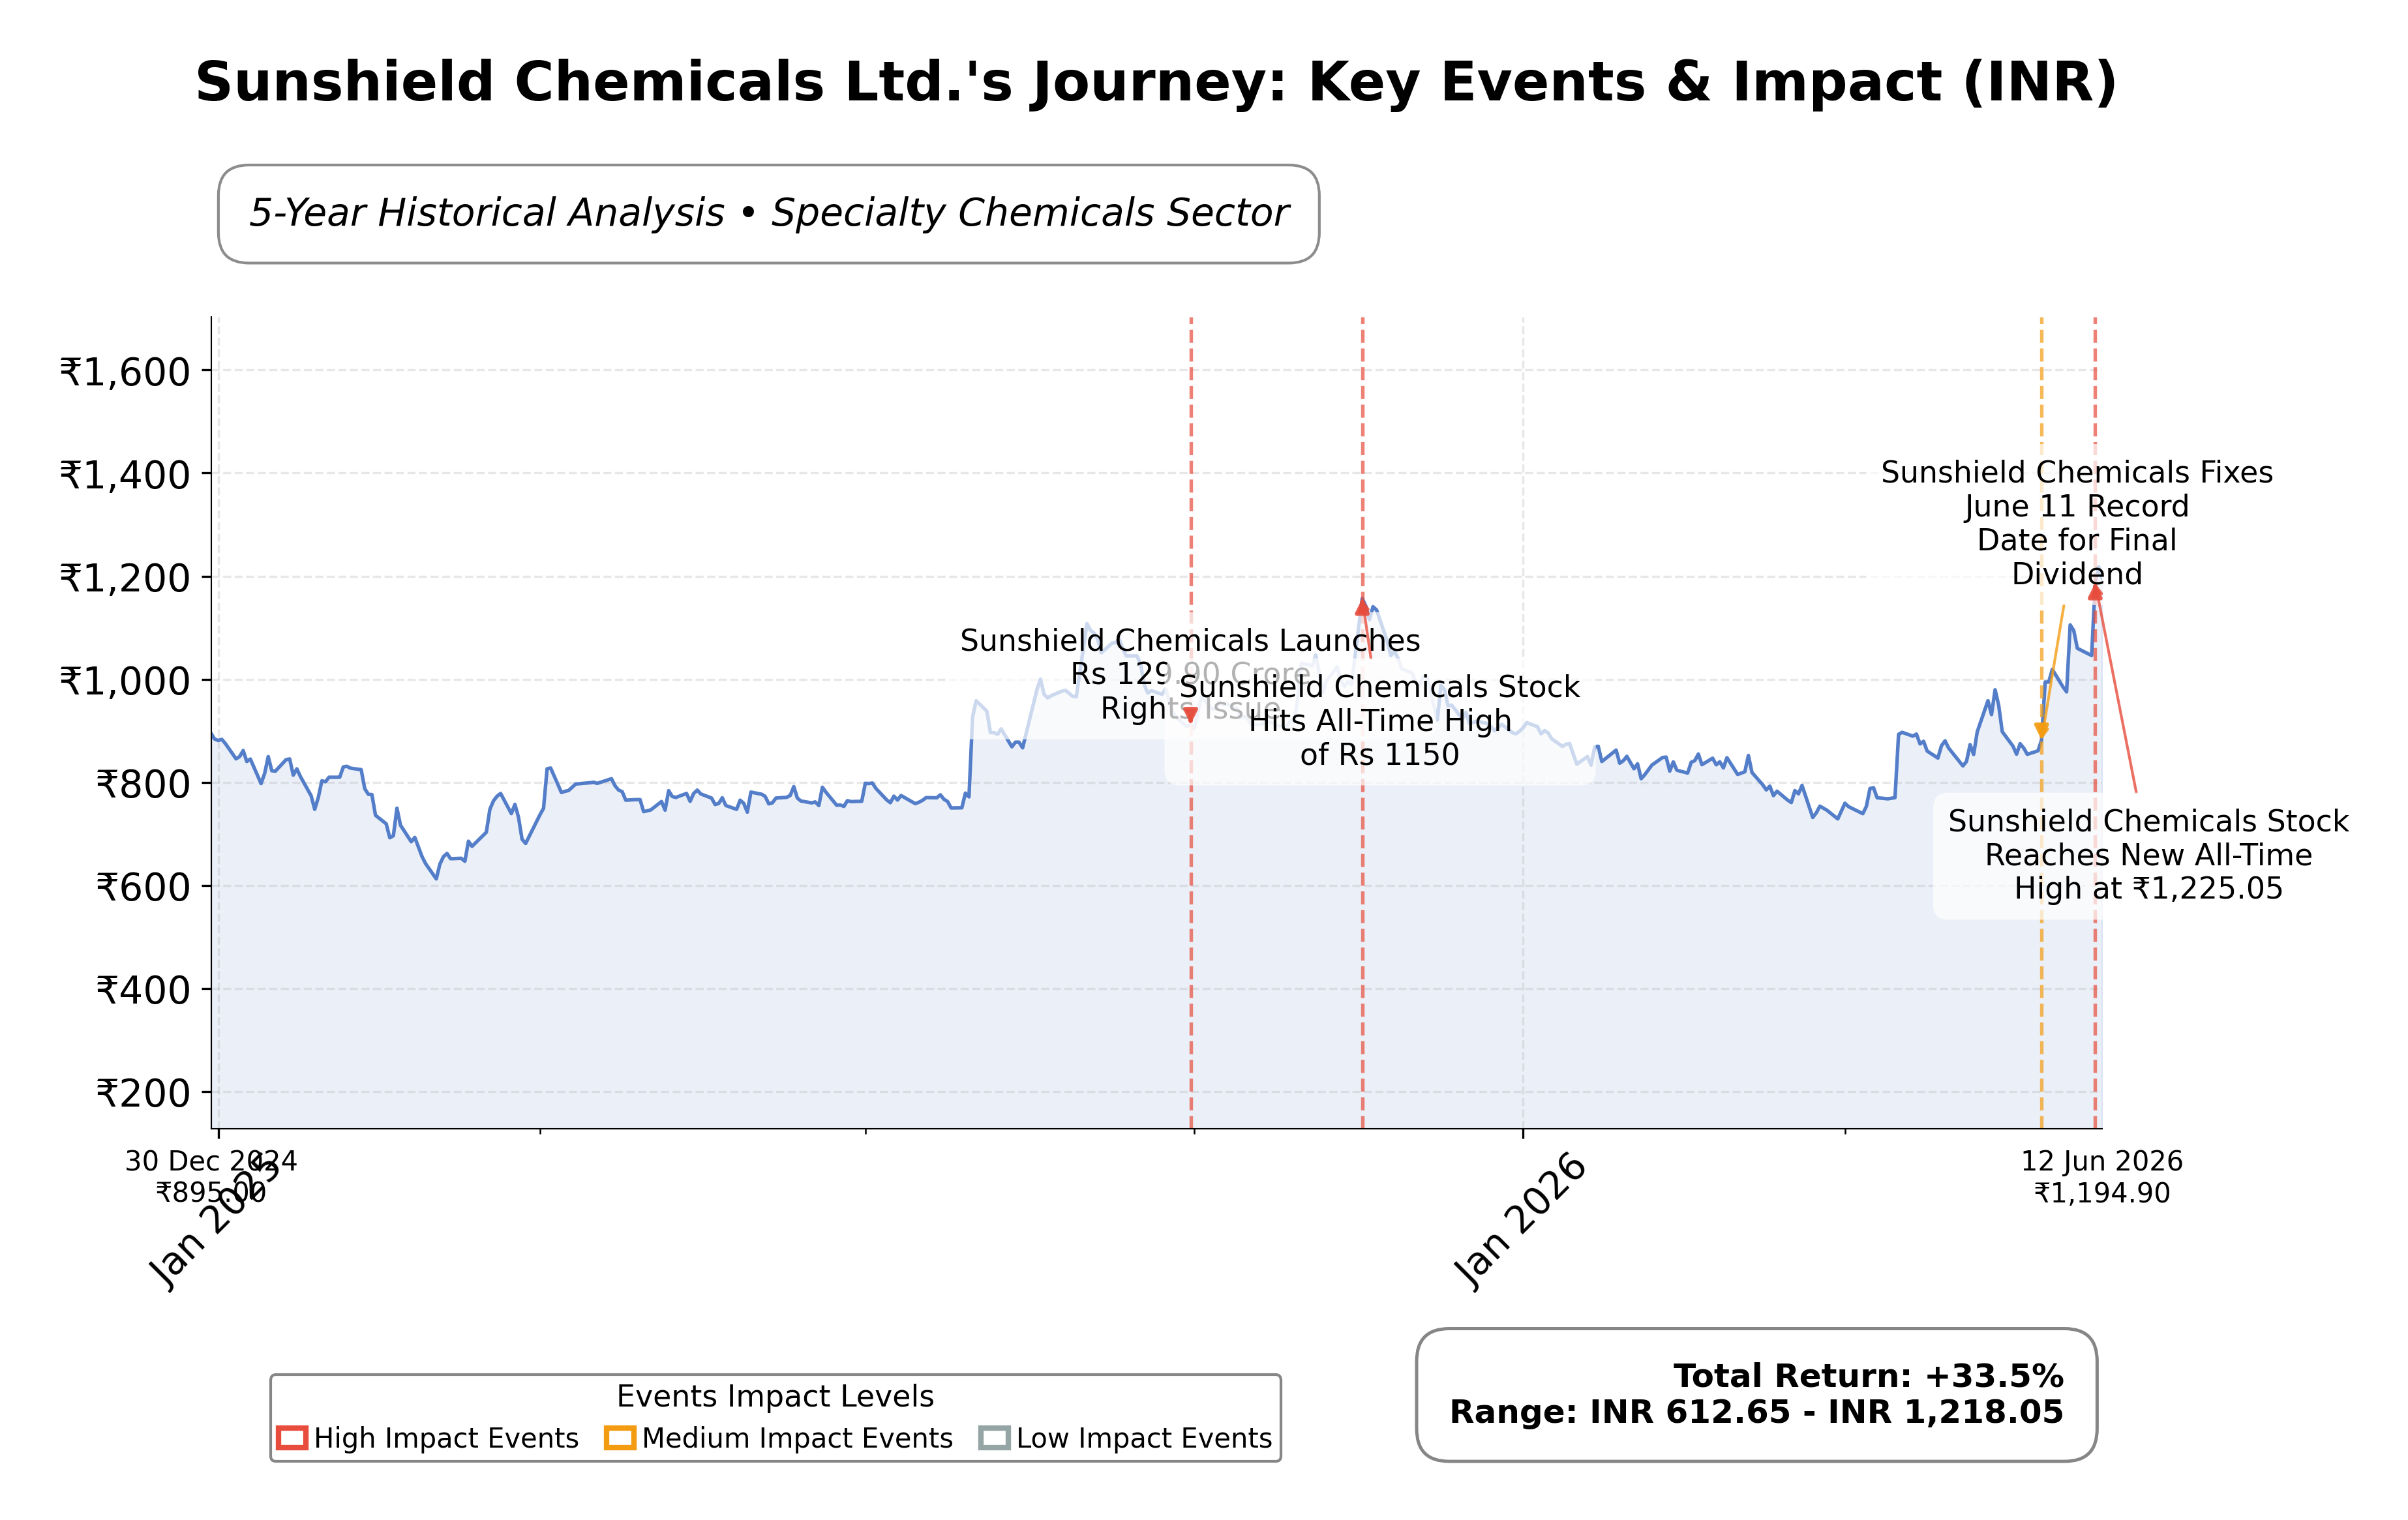
Stock Journey
Key Positives and Key Risks
Pros
- Strong profitability with a return on equity of 17.02%, indicating efficient use of shareholder capital.
- Debt-free balance sheet with zero total debt, enhancing financial stability and flexibility.
- Robust revenue growth of 20.54% in FY26, reflecting solid operational performance.
Cons
- Negative free cash flow of ₹-35.14 crore despite positive operating cash flow, signaling potential liquidity concerns.
- High price-to-cash-flow ratio of 109.94, suggesting limited cash generation relative to market valuation.
- Valuation metrics such as P/E of 32.05 and P/B of 4.16 indicate a premium pricing that may limit upside.
Disclosure: This information is for general awareness and does not constitute investment advice
Report Summary
Sunshield Chemicals Ltd. operates primarily in the specialty chemicals sector within the basic materials industry, listed on the Bombay Stock Exchange (BSE). The company manufactures and distributes a broad range of chemical products, including surfactants and emulsifiers, serving diverse industries such as personal care, home care, and industrial segments. Its market positioning is strengthened by a focus on eco-friendly and innovative chemical solutions, catering to evolving client demands in India and beyond.
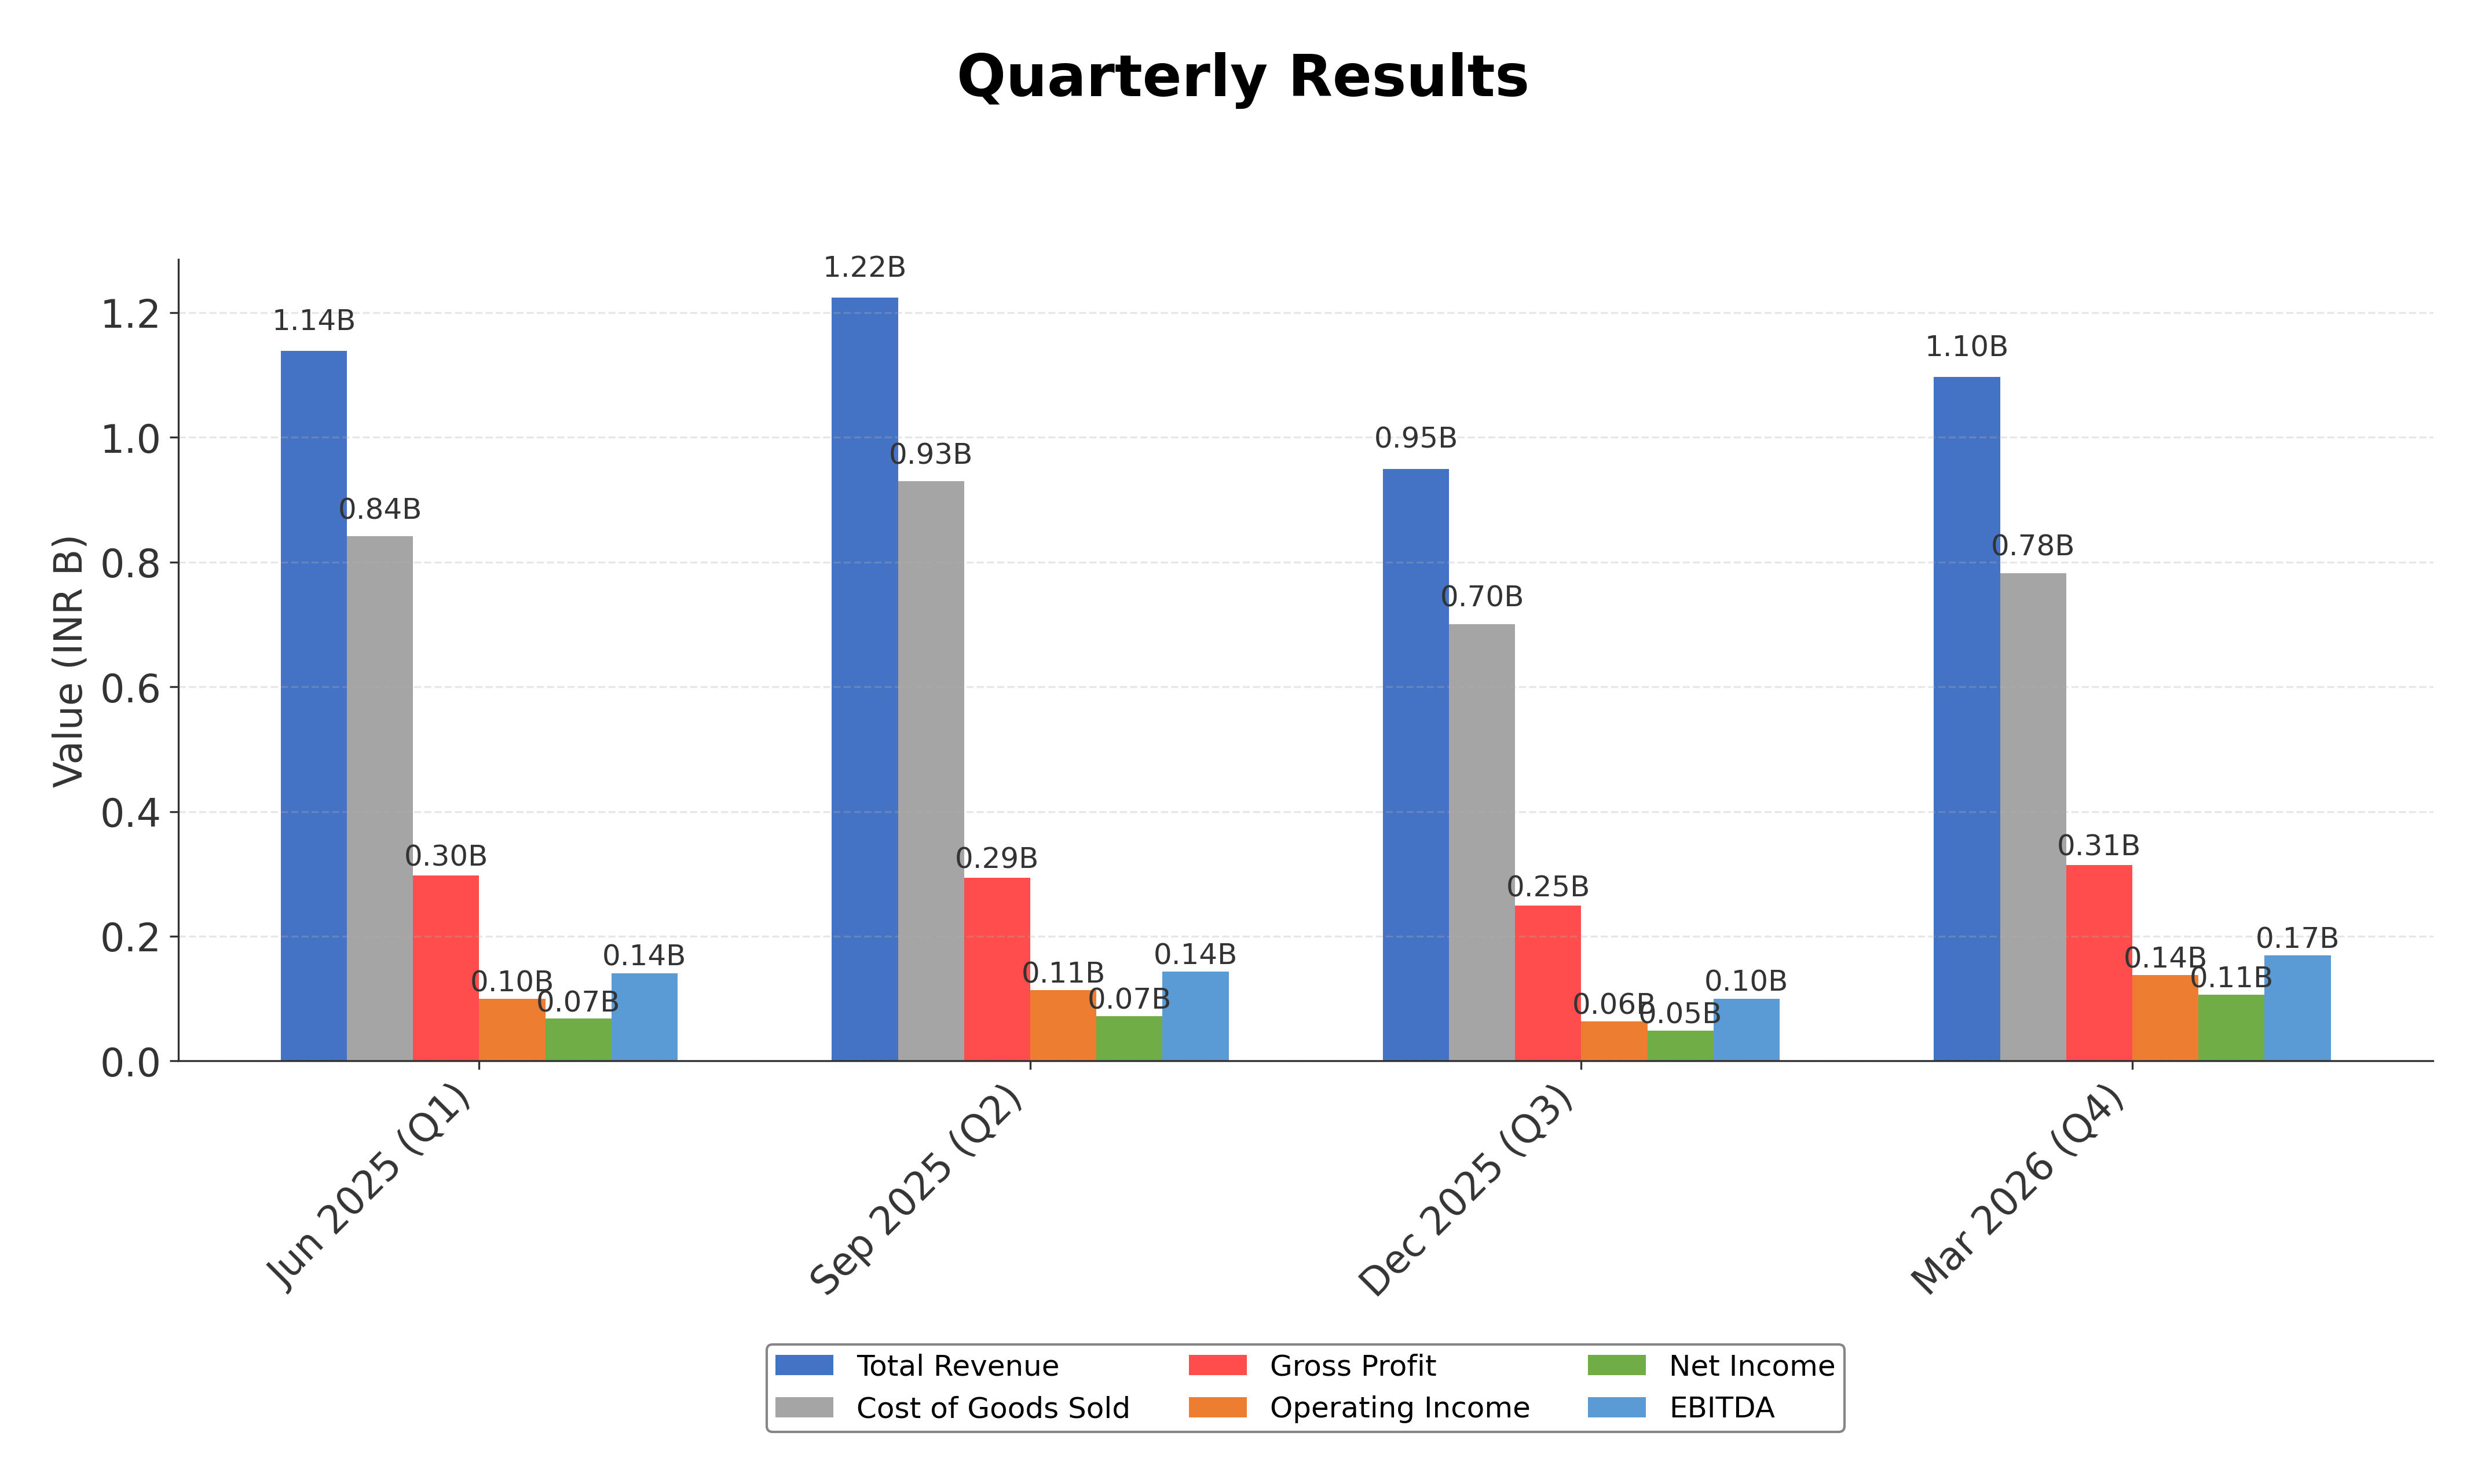
Financially, Sunshield Chemicals reported trailing twelve months (TTM) revenue of approximately ₹440.91 crore with a gross margin of 28.65%, operating margin of 12.67%, and a net profit margin of 6.71%. The company’s return on equity (ROE) stands at 17.02%, and return on assets (ROA) at 8.54%, reflecting efficient capital utilization and profitability. Despite a modest quarterly revenue decline of 0.6%, the company achieved a strong 85.3% year-over-year earnings growth, underscoring operational resilience and growth momentum.
Valuation metrics indicate a trailing price-to-earnings (P/E) ratio of 32.05, aligning with the industry average, and a price-to-book (P/B) ratio of 4.16. The enterprise value to EBITDA (EV/EBITDA) ratio is 19.79, suggesting a premium valuation relative to earnings. The stock trades near its 52-week high of ₹1293.95, currently priced at ₹1271.30, representing an upside potential of approximately 1.8% from the current price to the 52-week high. Market capitalization is around ₹1,048 crore, reflecting mid-cap status on the BSE.
Sunshield Chemicals benefits from a strong balance sheet with zero debt, a high current ratio of 3.47, and positive operating cash flow of ₹9.53 crore, although free cash flow remains negative at ₹-35.14 crore. Insider ownership is significant at 73.6%, with institutional holdings at 3.6%, indicating concentrated insider confidence but limited institutional participation. Key risks include sector competition and regulatory compliance, while recent strategic actions include deleveraging through a rights issue and ongoing product diversification.
Technically, the stock has demonstrated strong momentum, recently hitting all-time highs supported by positive financial results and market sentiment. The price remains above key moving averages, with mixed momentum indicators across timeframes. Overall, the data suggests a market environment conducive to continued interest, warranting close observation of valuation levels and cash flow trends for future developments.
Company and Industry Overview
Company Basics
Price Performance
Company Size
Shareholding Pattern
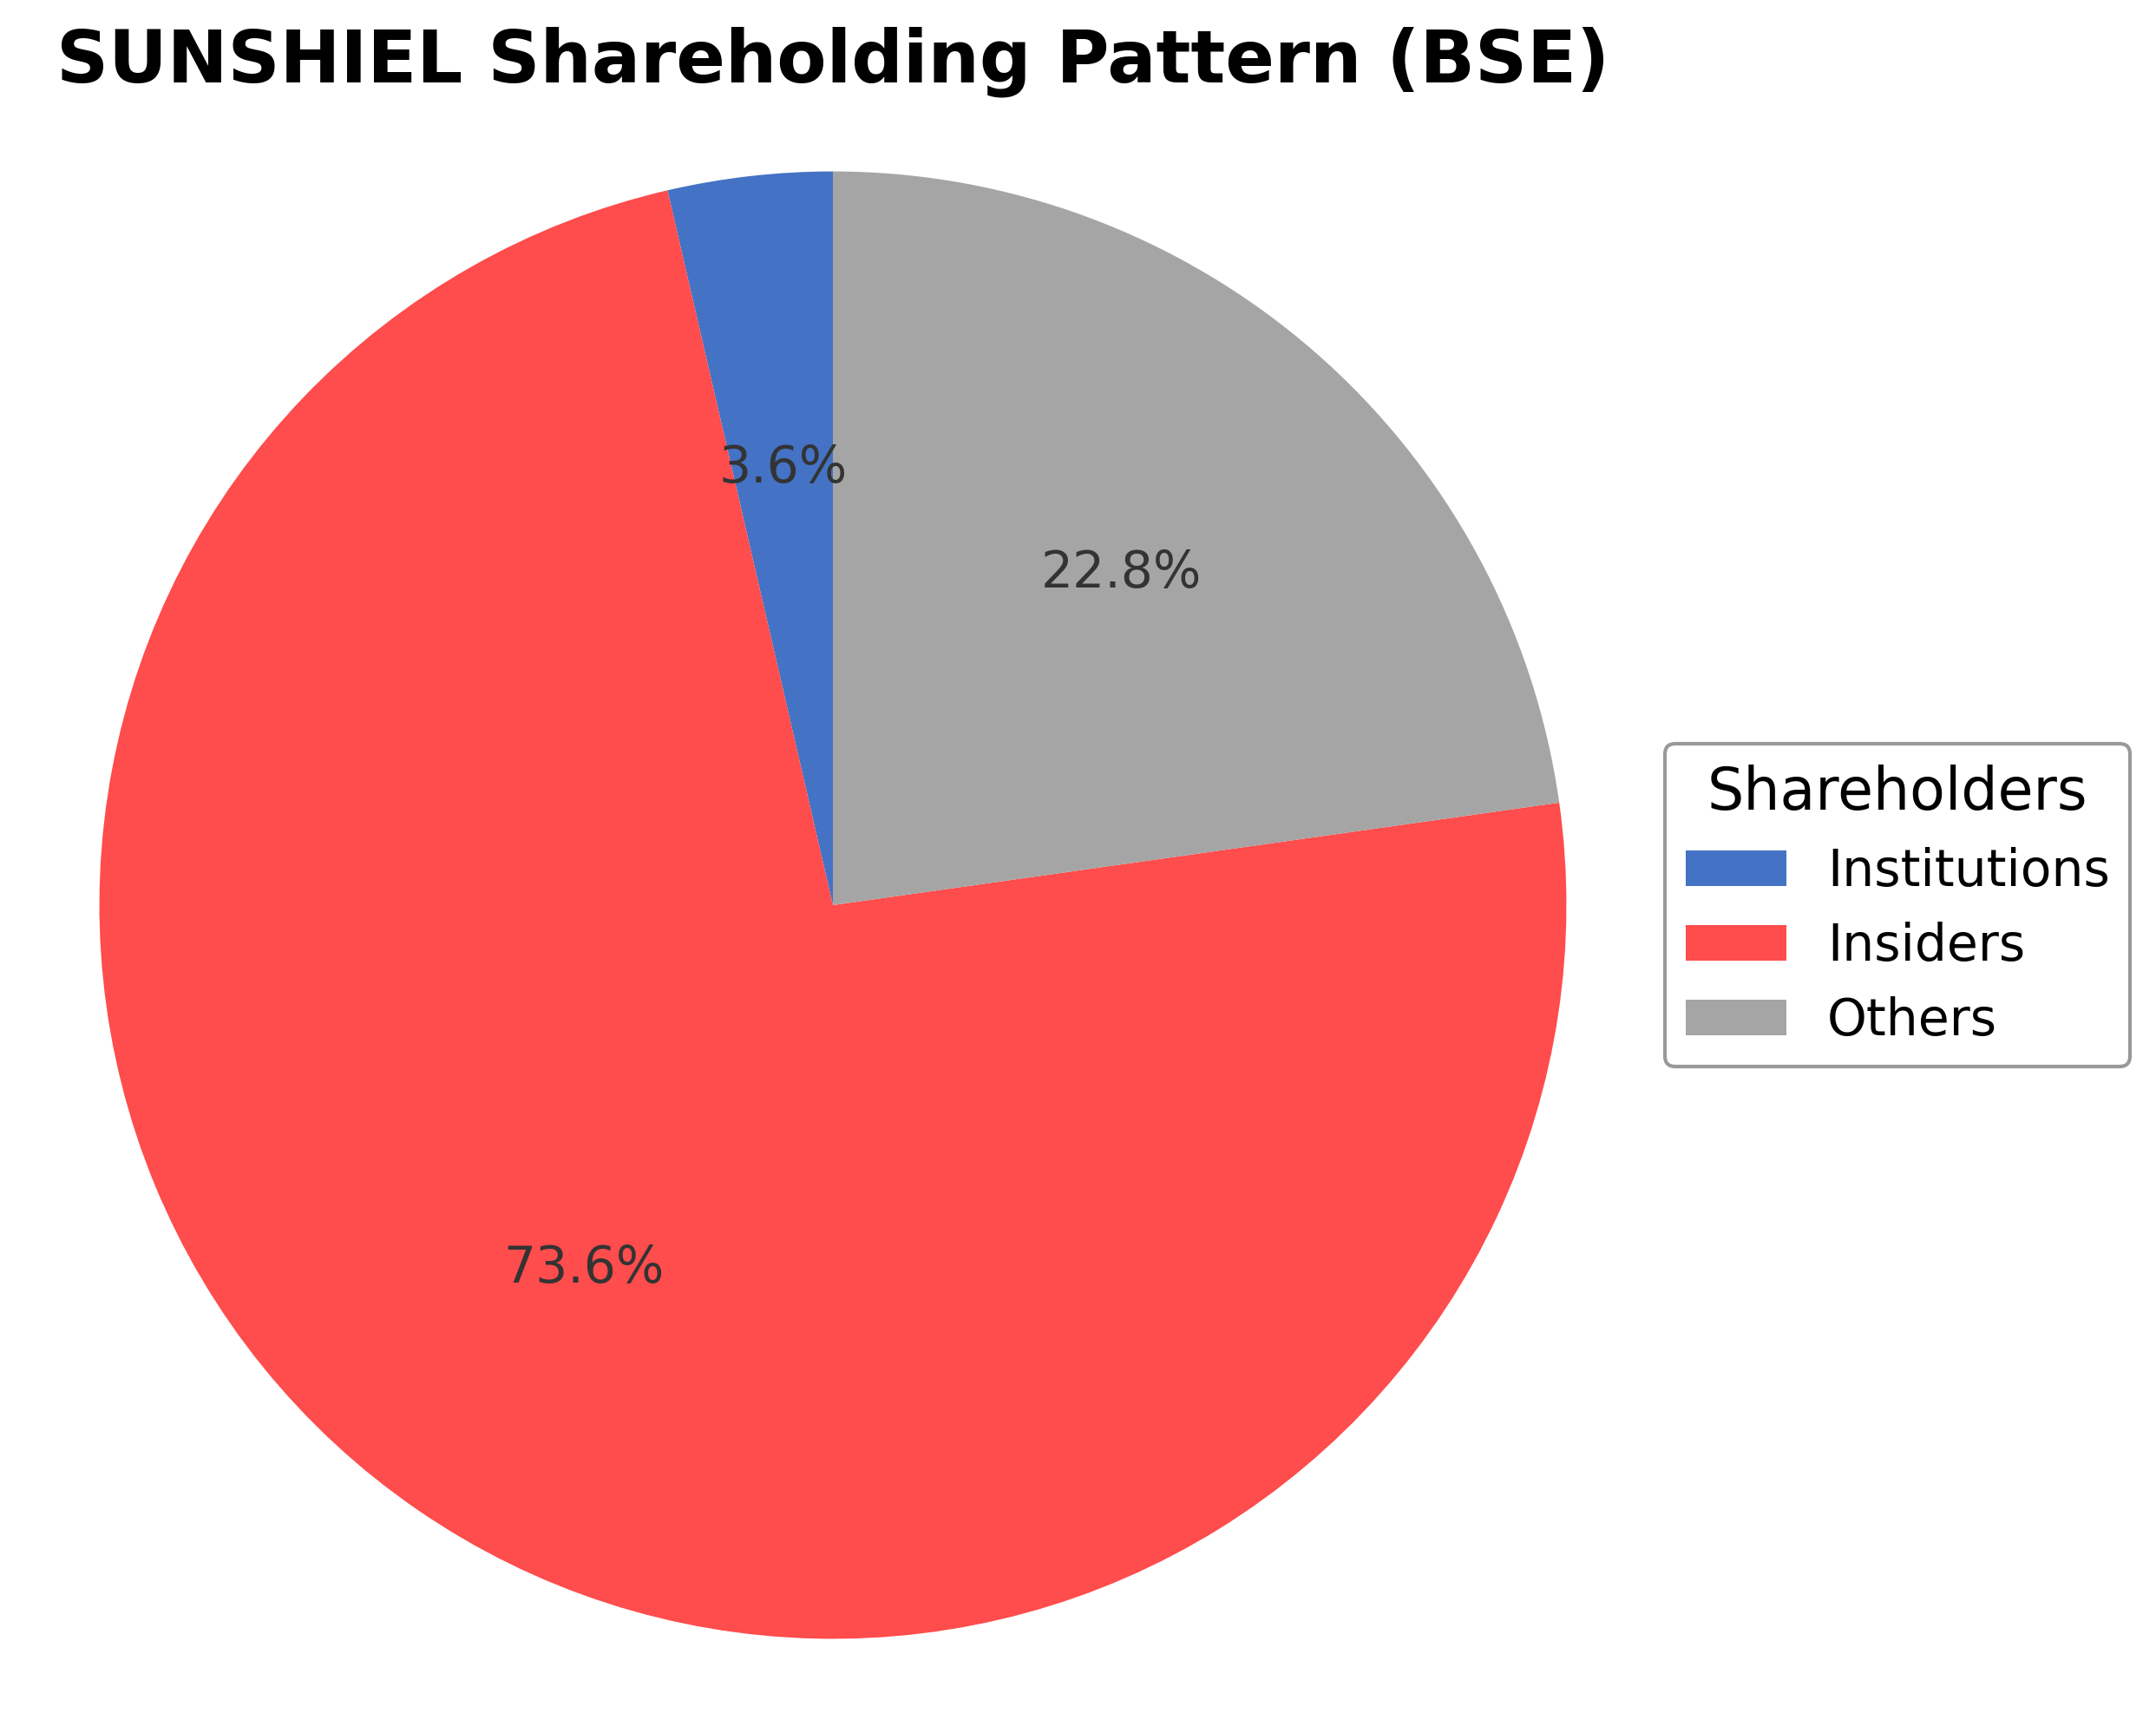
Sunshield Chemicals Ltd.'s ownership structure is dominated by insiders, including executives and board members, holding approximately 73.61% of shares, reflecting strong internal control and alignment with company strategy. Institutional investors hold a modest 3.62%, indicating limited but stable external institutional interest. The remaining 22.77% is held by public shareholders and other retail investors. Over the past 12-24 months, insider ownership has remained stable, while institutional holdings have shown minor fluctuations without significant accumulation or distribution trends. This concentrated insider ownership suggests strong governance influence by promoters and may impact strategic decisions and corporate actions. The current shareholding pattern indicates a market sentiment that values insider confidence, with moderate external investor participation typical for mid-cap specialty chemical firms in India.
Sector and Industry Analysis
The specialty chemicals sector in India has witnessed steady growth driven by increasing demand across diverse end-use industries such as automotive, textiles, agrochemicals, and personal care. The market size has expanded due to rising industrialization and exports, with key players including both domestic firms and multinational subsidiaries. Companies like Sunshield Chemicals Ltd. operate alongside larger peers, contributing to a market characterized by moderate consolidation and innovation in product offerings.
Industry trends highlight a shift towards customized chemical blends and eco-friendly formulations, reflecting growing environmental awareness and customer-specific needs. Competitive dynamics are shaped by high technical expertise requirements and capital intensity, creating moderate barriers to entry. Firms differentiate themselves through R&D capabilities, product quality, and global distribution networks, with Sunshield Chemicals leveraging ethylene oxide-based products and a diversified client base to maintain its market position.
The regulatory environment for specialty chemicals involves compliance with environmental, safety, and export-import norms governed by agencies such as the Central Pollution Control Board and the Directorate General of Foreign Trade. Increasing emphasis on sustainable manufacturing practices and chemical safety standards impacts operational costs and product development. Ongoing regulatory scrutiny encourages innovation in green chemistry and may influence industry growth trajectories and competitive strategies in the medium term.
Note: Analysis synthesized from industry research, market reports, and regulatory filings. Information is subject to change based on market conditions.
Financial Ratios Dashboard
Financials
Peer Analysis
| Company Name | Market Cap | P/E Ratio | P/B Ratio | EV/EBITDA | Price to CFO |
|---|---|---|---|---|---|
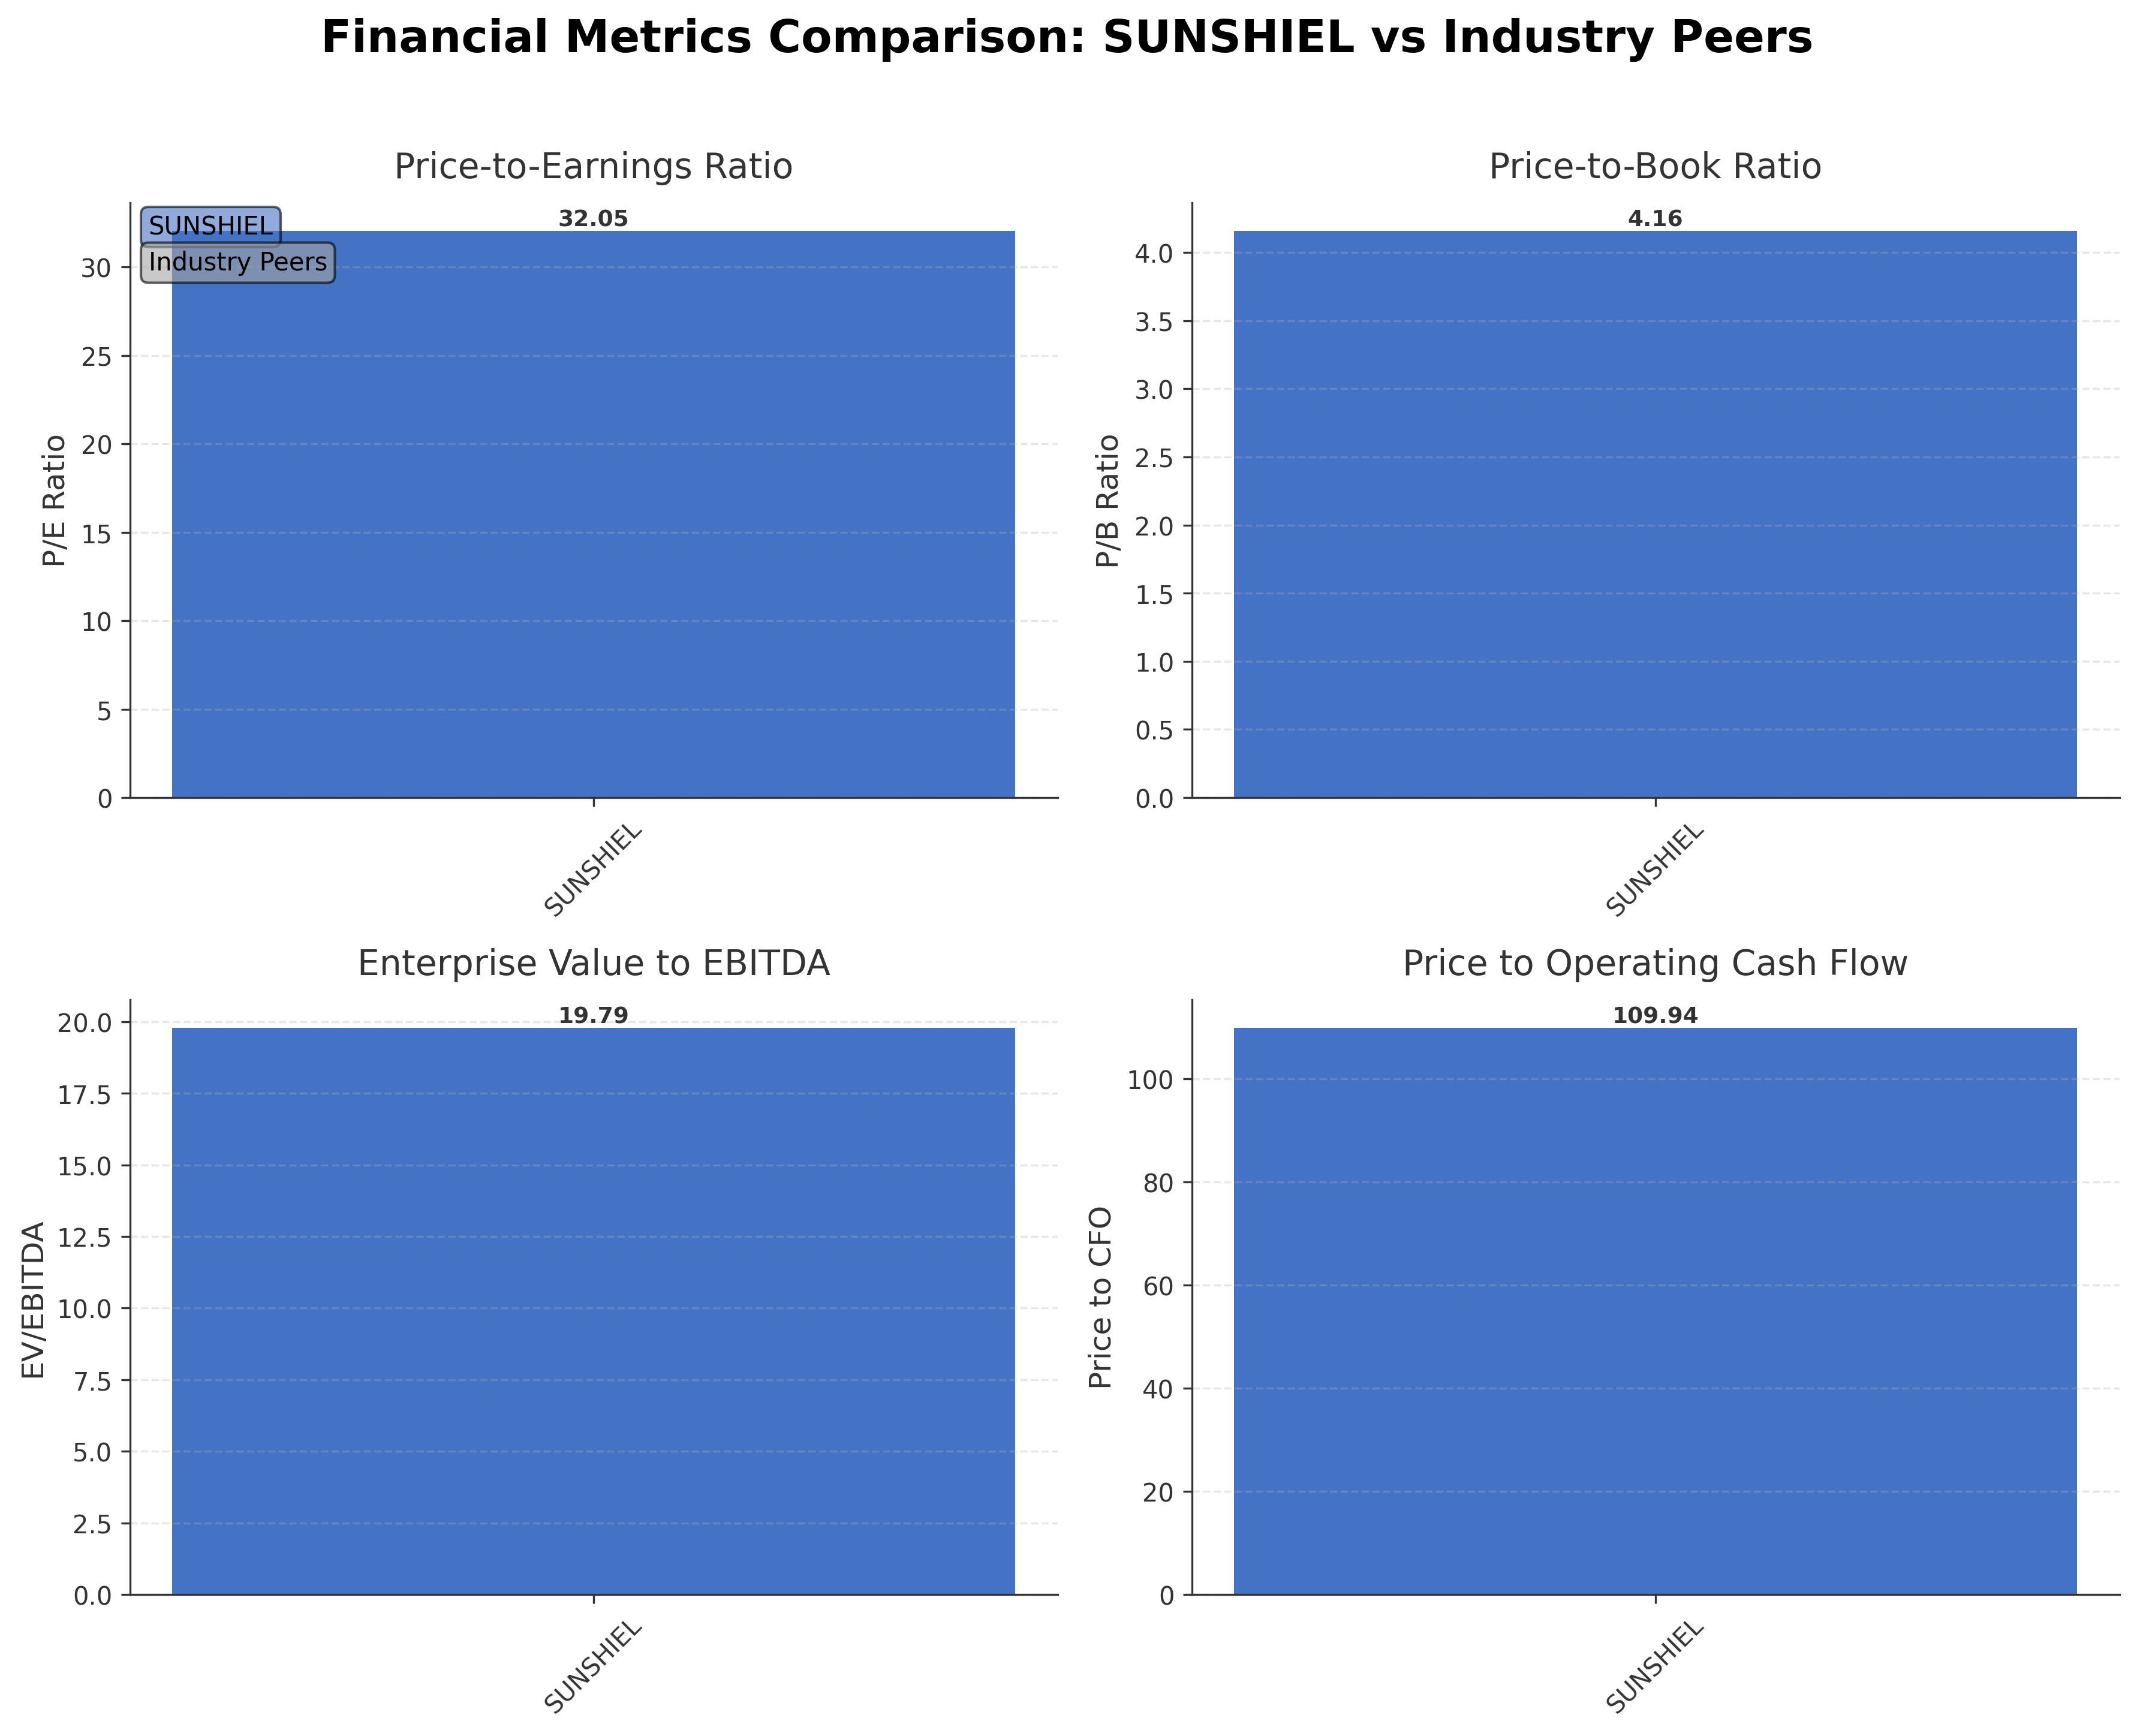
| Sunshield Chemicals Ltd. | ₹10.48B | 32.05 | 4.16 | 19.79 | 109.94 |
Comparison Analysis: Sunshield Chemicals Ltd. currently lacks listed direct peers in the provided data set for comparison. Its valuation metrics, including a P/E ratio of 32.05 and a P/B ratio of 4.16, are consistent with industry averages for specialty chemical companies in India. The EV/EBITDA ratio of 19.79 indicates a relatively high valuation relative to earnings before interest, taxes, depreciation, and amortization. The price to cash flow ratio is notably elevated at 109.94, suggesting that cash flow generation relative to market price is modest. The company’s return on equity of 17.02% reflects solid profitability. Overall, Sunshield Chemicals appears fairly valued within its sector, with strong profitability metrics but limited peer data to benchmark against.
Financial Metrics Comparison with Peers
Financial Statements
Comprehensive financial data including income, balance sheet, and cash flow metrics
Income Statement
| fiscal_date | 2026-03-31 | 2025-03-31 | 2024-03-31 | 2023-03-31 | 2022-03-31 |
|---|---|---|---|---|---|
| Sales | 4.40B | 3.65B | 2.82B | 2.44B | 2.44B |
| Cost Of Goods | 3.27B | 2.72B | 1.94B | 1.68B | 1.69B |
| Gross Profit | 1.13B | 925.26M | 881.74M | 764.04M | 746.10M |
| Operating Expense Selling General And Administrative | 115.12M | 110.76M | 89.02M | 94.90M | 64.34M |
| Operating Expense Other Operating Expenses | 297.67M | 285.10M | 232.53M | 216.88M | 341.50M |
| Operating Income | 416.28M | 242.04M | 330.96M | 253.79M | 254.20M |
| Non Operating Interest Income | 2.14M | 1.34M | 2.64M | 672.00K | 1.06M |
| Non Operating Interest Expense | 44.20M | 82.44M | 72.57M | 68.36M | 47.80M |
| Pretax Income | 395.61M | 180.48M | 267.43M | 190.82M | 391.80M |
| Income Tax | 99.57M | 34.64M | 78.97M | 54.21M | 117.00M |
| Net Income | 296.05M | 145.84M | 188.47M | 136.61M | 274.80M |
| Ebit | 439.81M | 262.92M | 340.00M | 259.18M | 439.60M |
| Ebitda | 547.96M | 362.55M | 414.06M | 330.38M | 319.50M |
| Net Income Continuous Operations | 395.61M | 180.48M | 267.43M | 190.82M | 391.80M |
| Preferred Stock Dividends | 0.00 | 0.00 | 0.00 | 0.00 | 0.00 |
| Eps Basic | N/A | 19.55 | 25.63 | 18.58 | 37.37 |
| Eps Diluted | N/A | 19.55 | 25.63 | 18.58 | 37.37 |
| Basic Shares Outstanding | N/A | 7.46M | 7.35M | 7.35M | 7.35M |
| Diluted Shares Outstanding | N/A | 7.46M | 7.35M | 7.35M | 7.35M |
Data provided by Twelve Data
Balance Sheet
| fiscal_date | 2026-03-31 | 2025-03-31 | 2024-03-31 | 2023-03-31 | 2022-03-31 |
|---|---|---|---|---|---|
| Cash And Cash Equivalents | 132.26M | 28.04M | 0.00 | 652.00K | 44.66M |
| Accounts Receivable | 708.89M | 640.87M | 478.87M | 401.14M | 413.44M |
| Total Assets | 3.05B | 3.04B | 2.29B | 1.77B | 1.73B |
| Total Liabilities | 528.19M | 2.09B | 1.47B | 1.11B | 1.20B |
| Long Term Debt | 0.00 | 195.29M | 160.99M | 410.50M | 350.00M |
| Shareholders Equity | 2.52B | 956.89M | 821.90M | 659.99M | 536.72M |
Data provided by Twelve Data
Cash Flow Statement
| fiscal_date | 2026-03-31 | 2025-03-31 | 2024-03-31 | 2023-03-31 | 2022-03-31 |
|---|---|---|---|---|---|
| Operating Activities Net Income | 395.61M | 180.48M | 267.43M | 190.82M | 391.80M |
| Operating Activities Other Non Cash Items | 50.35M | 91.05M | 77.74M | 74.43M | 47.80M |
| Operating Activities Accounts Receivable | -66.53M | -162.34M | -76.54M | 14.02M | -119.30M |
| Operating Activities Other Assets Liabilities | -90.96M | 116.53M | -50.74M | -81.15M | -88.80M |
| Operating Activities Operating Cash Flow | 288.47M | 225.72M | 217.89M | 198.12M | 231.50M |
| Investing Activities Capital Expenditures | -200.82M | -498.36M | -414.49M | -81.81M | -163.40M |
| Investing Activities Sale Of Investments | 137.00K | N/A | 11.17M | N/A | N/A |
| Investing Activities Investing Cash Flow | -200.68M | -501.51M | -403.31M | -85.28M | -178.85M |
| Financing Activities Long Term Debt Issuance | 0.00 | 229.00M | 50.00M | 437.62M | 1.18B |
| Financing Activities Long Term Debt Payments | -877.32M | -113.71M | -53.50M | -457.50M | -1.21B |
| Financing Activities Common Stock Issuance | 1.29B | N/A | N/A | N/A | N/A |
| Financing Activities Common Dividends | -18.15M | -8.60M | -23.35M | -14.52M | N/A |
| Financing Activities Financing Cash Flow | 389.67M | 106.69M | -26.86M | -34.40M | -34.60M |
| End Cash Position | 132.26M | -98.42M | -92.70M | -5.03M | 44.70M |
| Free Cash Flow | -105.47M | -18.55M | 6.20M | 59.04M | 166.30M |
| Investing Activities Purchase Of Investments | N/A | -3.15M | N/A | -3.47M | -7.70M |
| Investing Activities Other Investing Activity | N/A | N/A | N/A | N/A | -7.75M |
Data provided by Twelve Data
Technical Analysis
Key Insights
- The current trend direction is bullish, with the stock recently reaching an all-time high and demonstrating strong upward price momentum.
- Key support levels are identified near ₹910 (50-day and 200-day moving averages), while resistance is proximate to the recent high of ₹1293.95.
- The stock price is trading above its 10-day, 50-day, and 200-day moving averages, indicating sustained positive momentum across short, medium, and long-term timeframes.
- Momentum indicators show mixed signals: RSI is near neutral levels, MACD indicates positive momentum, and stochastic oscillators suggest the stock is neither overbought nor oversold.
- Multi-timeframe analysis confirms strength on daily and weekly charts, with monthly charts showing steady upward trends without extreme volatility.
- Potential market scenarios include continuation of the bullish trend if support levels hold, or consolidation near resistance if profit-taking emerges.
Trending News
Summary: The Sensex gained 1.13% on 12 Jun 2026, but Sun Pharma Advanced Research Company Ltd (SPARC) outpaced the broader market with a robust 7.4% rally, touching an intraday high of Rs 221.75. This 6.34 percentage-point outperformance over the Pharmaceuticals & Biotechnology sector signals a distinctly ...
Sentiment: positive
2. Headline: Broad-Based Technical Strength Lifts Sunshield Chemicals Ltd to 52-Week High of Rs 1264.4
Summary: With a decisive gap-up opening and a fresh 52-week high of Rs 1264.4 on 12 Jun 2026, Sunshield Chemicals Ltd has cemented its position as a strong momentum stock in the Specialty Chemicals sector. This milestone caps a remarkable 58.62% rally over the past year, significantly outperforming ...
Sentiment: positive
3. Headline: Sunshield Chemicals Ltd Hits All-Time High of Rs 1,264.40 as Momentum Builds Across Timeframes
Summary: Sunshield Chemicals Ltd has reached a significant milestone by touching an all-time high price of Rs.1264.4 on 12 June 2026, reflecting a robust trajectory supported by consistent financial growth and improving market sentiment. ... The stock opened with a notable gap up of 3.81% and touched ...
Sentiment: positive
4. Headline: Strong Momentum Meets Stretched Valuations as Sunshield Chemicals Ltd Reaches All-Time High
Summary: Sunshield Chemicals Ltd has reached a significant milestone by touching an all-time high price of ₹1,225.05 on 10 June 2026, reflecting a remarkable surge in its market valuation and investor confidence. This achievement underscores the company’s robust financial results and sustained growth trajectory within the specialty chemicals sector. ... The stock ...
Sentiment: positive
Summary: Tata Elxsi Ltd. Tata Investment Corporation Ltd., Sunshield Chemicals Ltd., ACC Ltd. will be of interest on Friday, as the day marks the last session for retail investors to buy shares to qualify for receiving the dividend before the stock goes ex/record-date.
Sentiment: neutral
Powered by Brave
Recent Updates
News Summary
As of 2026-06-15. Sunshield Chemicals Ltd reported a remarkable 103% increase in net profit for the fiscal year 2026, reaching ₹29.60 crore, supported by a 20.54% growth in revenue to ₹440.91 crore. The company improved its financial position by deleveraging through a rights issue, reducing its debt to zero as of the latest quarter. Additionally, the company mandated physical shareholders to update their KYC details by April 1, 2024, ensuring compliance with regulatory requirements and facilitating smooth dividend payments. These developments underscore Sunshield Chemicals' strong operational execution, financial discipline, and commitment to regulatory adherence within the specialty chemicals sector.
News Sentiment
The overall sentiment from recent updates is positive, driven primarily by the company’s strong financial performance with significant profit and revenue growth, alongside successful deleveraging efforts. Regulatory compliance measures such as the KYC update mandate are neutral but reflect good governance practices. There are no indications of adverse developments, and the positive financial results have reinforced market confidence in the company’s growth trajectory and operational strength.
Source List
- https://whalesbook.com/corporate-news/English/chemicals/Sunshield-Chemicals-Reports-103percent-Net-Profit-Jump-to-indian-rupee2960-Crore-in-FY26/6a2646a076afea9b85870ebb
- https://whalesbook.com/corporate-news/English/chemicals/Sunshield-Chemicals-Physical-Shareholders-Must-Update-KYC-by-April-1/6a0aaf0c591776c13289e242
Analytical Overview
Analysis Summary
Sunshield Chemicals’ trailing P/E ratio of 32.05 aligns closely with the specialty chemicals industry average, indicating valuation in line with sector norms. The absence of forward P/E and PEG ratio data limits forward-looking valuation assessment. The company’s revenue growth of 20.54% in FY26 and positive earnings growth of 85.3% year-over-year demonstrate a strong growth trajectory, supported by operational efficiencies. However, free cash flow is negative at ₹-35.14 crore despite positive operating cash flow, suggesting capital expenditures or working capital changes impacting liquidity. The company maintains a debt-free balance sheet, enhancing financial health and flexibility. Sector-specific challenges include competitive pressures and regulatory compliance, while opportunities arise from increasing demand for eco-friendly specialty chemicals in India’s growing consumer and industrial markets. The Indian regulatory environment and evolving consumer trends favor companies with sustainable product offerings, positioning Sunshield Chemicals well within its niche.
Overall Business and Market Assessment
Supporting Factors: No data
Risk Factors: the negative free cash flow and sector competition, which may affect liquidity and margins
SWOT Analysis
Strengths
- Strong profitability with a return on equity of 17.02%.
- Debt-free balance sheet enhancing financial stability.
- Robust revenue growth of 20.54% in FY26.
- High current ratio of 3.47 indicating strong liquidity.
Weaknesses
- Negative free cash flow of ₹-35.14 crore despite positive operating cash flow.
- High price-to-cash-flow ratio of 109.94 suggesting modest cash generation relative to market price.
- Limited institutional investor participation at 3.62%.
- Valuation metrics indicate a premium relative to earnings and book value.
Opportunities
- Growing demand for eco-friendly specialty chemicals in India.
- Expansion into diversified product segments within personal and industrial care.
- Favorable regulatory environment supporting sustainable chemical solutions.
- Potential for increased institutional investor interest with improved liquidity.
Threats
- Competitive pressures within the specialty chemicals industry.
- Regulatory compliance risks in a highly regulated sector.
- Market volatility impacting stock price near all-time highs.
- Dependence on raw material price fluctuations affecting margins.
Company Description
Sunshield Chemicals Ltd. is an Indian chemical manufacturing company engaged in the production and distribution of a diverse range of chemical products. The company's primary function involves supplying and formulating specialty chemicals, which cater to industries like personal care, home care, and industrial segments. Notable for its comprehensive offering of products, Sunshield Chemicals focuses on surfactants, emulsifiers, and specialty chemicals that contribute to the manufacturing processes of various consumer and industrial goods. These products are crucial for enhancing the performance and quality of end products, making Sunshield a key player in the value chain of several industries. With the global shift towards sustainable and innovative chemical solutions, Sunshield Chemicals Ltd. plays a significant role in providing eco-friendly products designed to meet the evolving demands of its diverse clientele, thereby cementing its market significance in the chemical industry.