
Suncor Energy Inc (SU)
Stock Analysis Report
Stock Journey

Key Positives and Key Risks
Pros
- Strong operating cash flow of $9.37 billion and free cash flow of $4.67 billion support financial stability and growth potential.
- Return on equity of 13.2% indicates effective capital utilization relative to peers.
- Valuation metrics such as a trailing P/E of 15.69 and PEG ratio of 0.18 suggest reasonable valuation with growth prospects.
Cons
- Quarterly revenue growth declined by 3.9%, indicating potential near-term operational headwinds.
- Debt-to-equity ratio of 32.14% reflects moderate leverage, which may constrain financial flexibility.
- Minimal insider ownership (0.01%) could reduce alignment between management and shareholders.
Disclosure: This information is for general awareness and does not constitute investment advice
Report Summary
Suncor Energy Inc. is a leading integrated energy company primarily operating in Canada, specializing in the extraction and refining of oil sands. Its core business spans exploration, production, refining, and distribution of petroleum and petrochemical products, including gasoline, diesel, and asphalt. Positioned within the Oil & Gas Integrated industry, Suncor leverages vertical integration to enhance operational efficiency and maintain significant influence in North American energy markets.
Financially, Suncor reported a market capitalization of approximately $68.7 billion with a trailing P/E ratio of 15.69 and a forward P/E of 16.61, reflecting valuation metrics close to industry averages. The company generated trailing twelve months (TTM) revenues of about $35.86 billion, with a profit margin of 12.1% and operating margin of 15.7%. Return on equity (ROE) stood at 13.2%, supported by solid operating cash flow of $9.37 billion and free cash flow of $4.67 billion. The dividend yield is near 2.9%, with a payout ratio of 47.6%, indicating a balanced approach to shareholder returns.
Technically, Suncorâs stock trades near its 52-week high of $57.13, currently at $56.81, with a beta of 0.75 suggesting moderate volatility relative to the market. Recent strategic initiatives include leadership changes and institutional investment activity, with notable strengths in vertical integration and cash flow generation. Risks include exposure to commodity price fluctuations and regulatory challenges inherent to the energy sector. Market sentiment shows mixed signals with significant options volume and institutional trading activity.
Peer analysis within the North American Oil & Gas Integrated sector reveals Suncorâs valuation metrics are moderate compared to larger peers like Chevron and ExxonMobil, which have higher P/E ratios and market caps. Suncorâs EV/EBITDA ratio of 4.96 is lower than some peers, indicating potentially more attractive operational earnings relative to enterprise value. Return on equity is competitive, though some peers exhibit stronger cash flow metrics. This positions Suncor as a mid-sized player with solid fundamentals but facing competitive pressures.
Suncor Energy navigates a complex industry landscape marked by evolving energy demands, environmental considerations, and market volatility. Recent achievements include record production levels and operational efficiencies, while challenges persist in maintaining growth amid fluctuating oil prices and regulatory scrutiny. The company stands at a pivotal juncture where its integrated business model and strategic decisions will influence its ability to capitalize on market opportunities or face downside risks. Given the current data and market context, a measured stance reflecting ongoing evaluation of operational and market developments may be appropriate for those assessing the stock.
Company and Industry Overview
Company Basics
Price Performance
Company Size
Shareholding Pattern
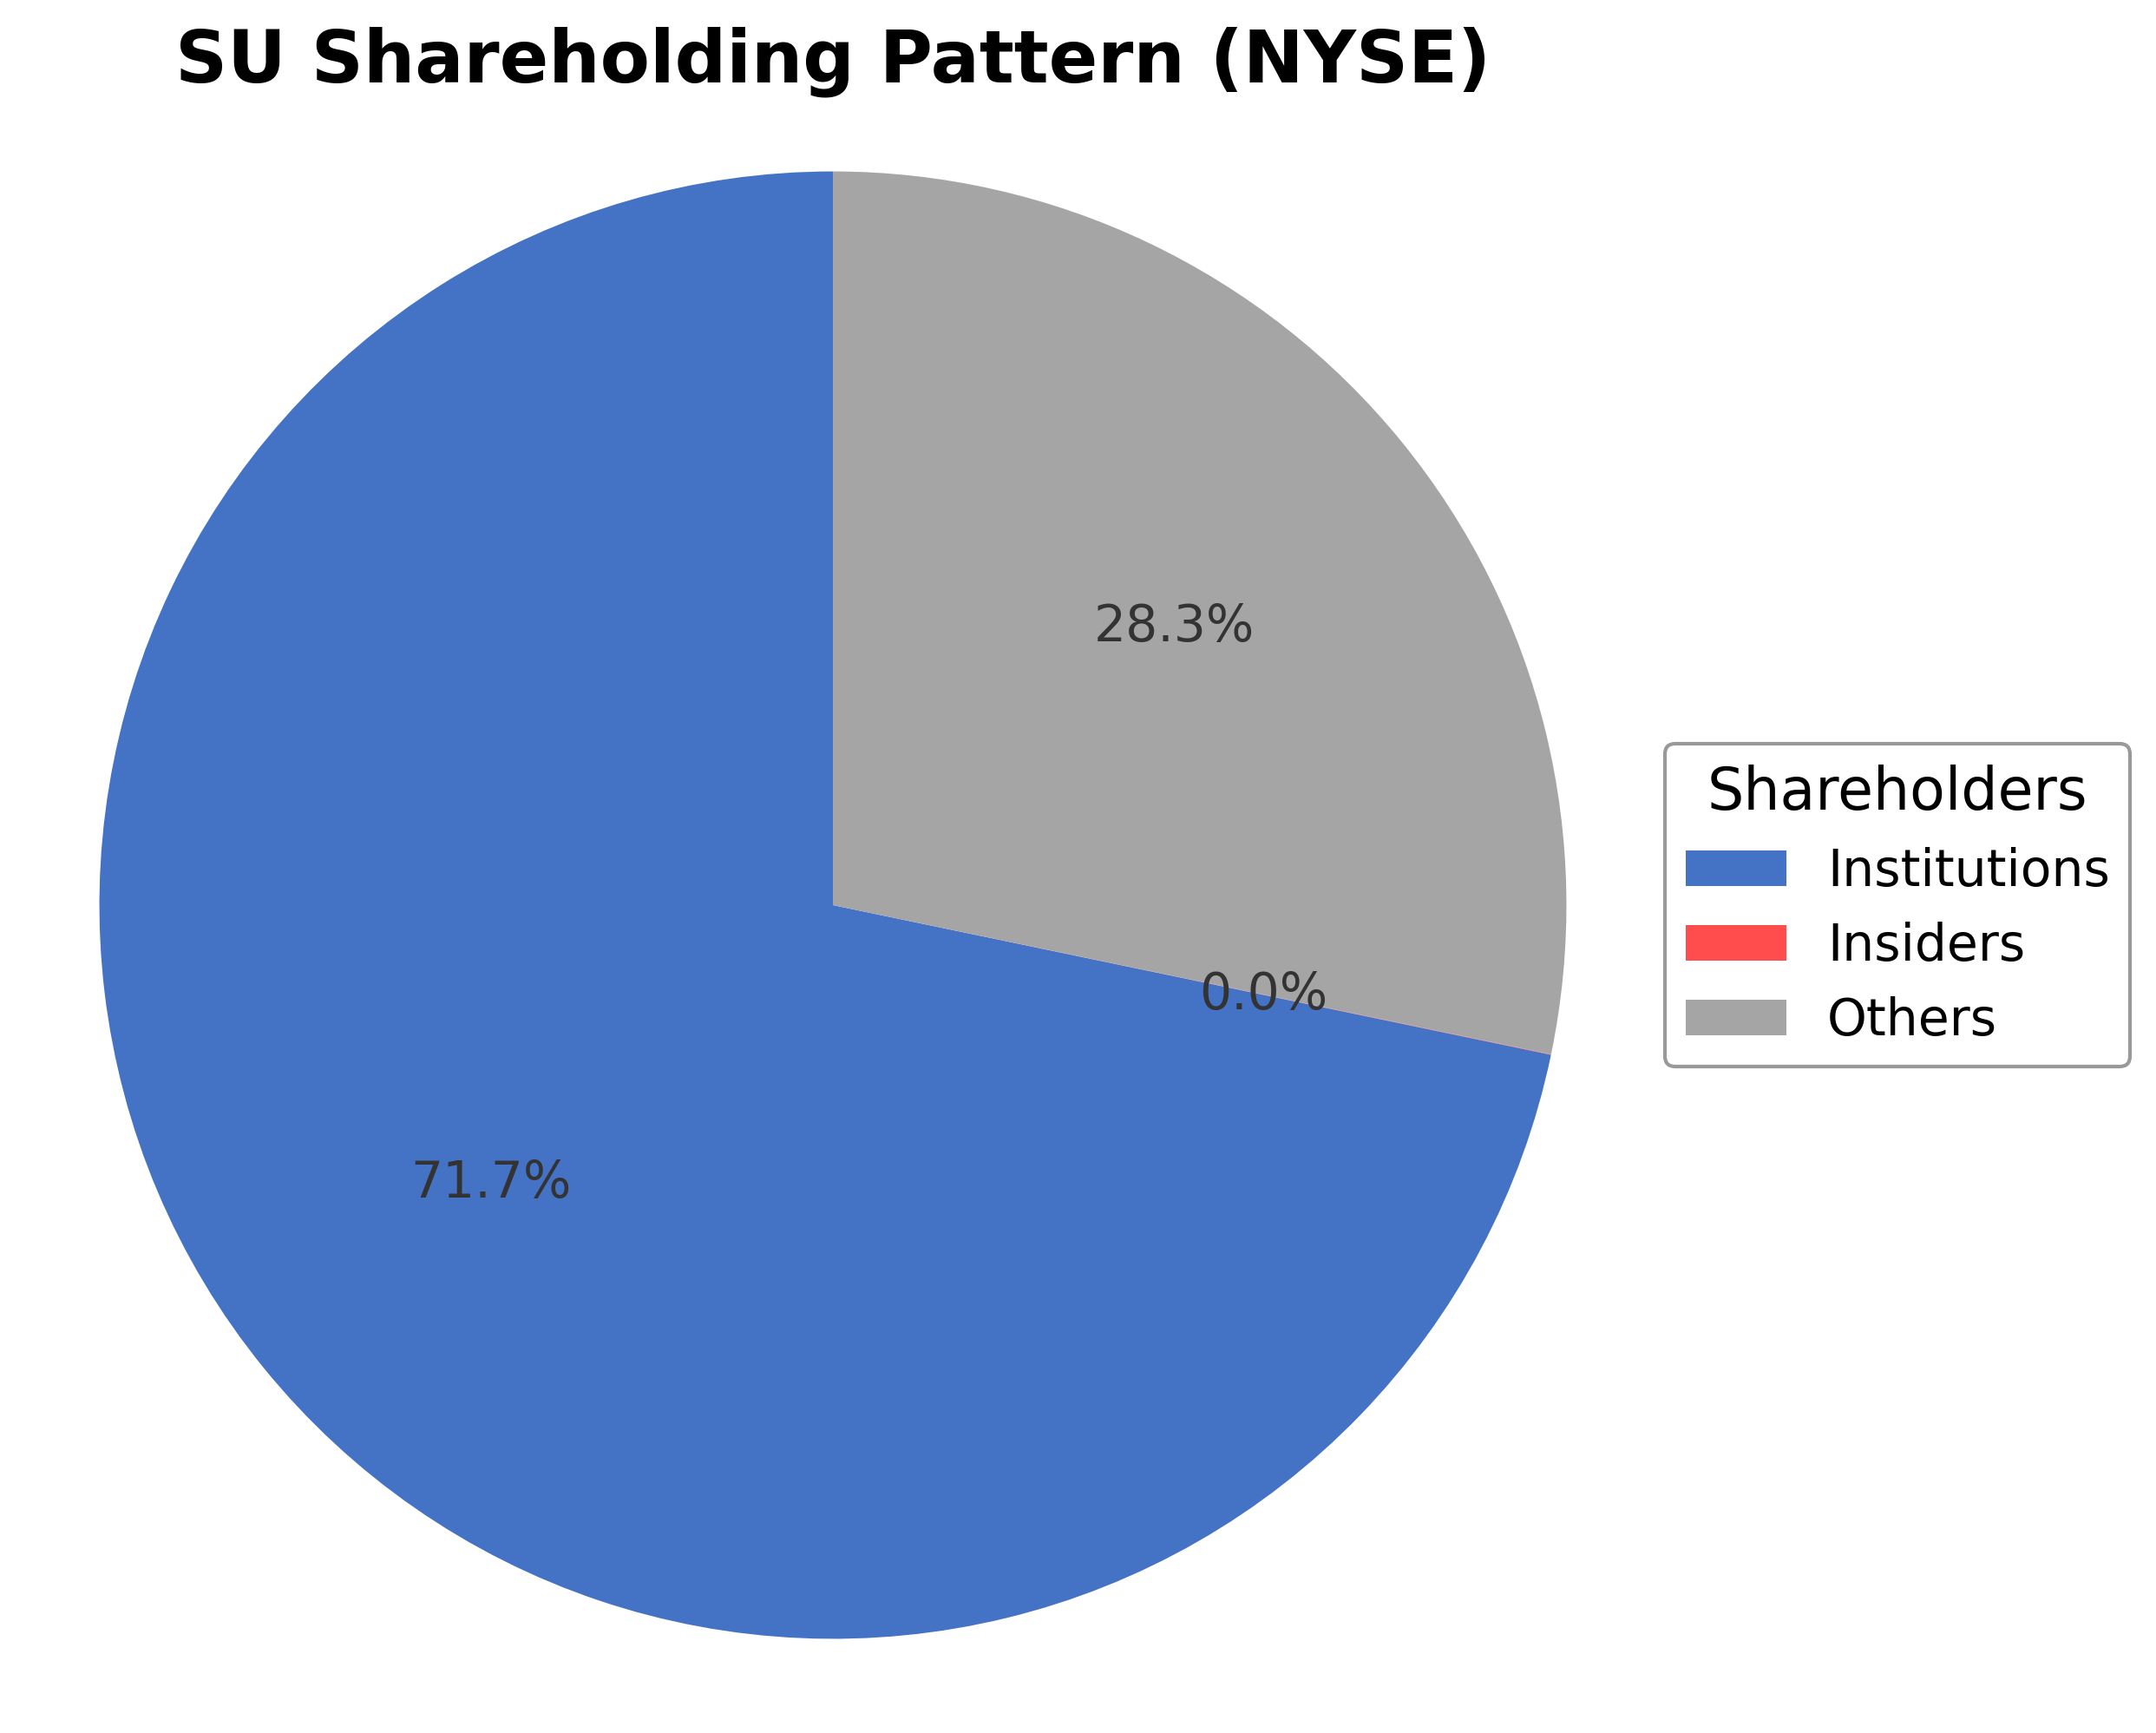
Suncor Energy Inc.'s ownership structure is characterized by a minimal insider holding of approximately 0.01%, reflecting limited direct executive and board member equity stakes. Institutional investors hold a substantial 71.73% of shares, indicating strong institutional interest and influence, while other shareholders, including retail investors and employee stock plans, constitute about 28.26%. Over the past 12-24 months, institutional accumulation appears steady with some notable new positions taken by funds such as SCP Investment LP, while others like Shell Asset Management Co. have reduced holdings. These patterns suggest a generally positive market sentiment towards Suncor, with governance and strategic direction likely influenced by institutional priorities. The ownership distribution supports a governance framework aligned with large-scale investors, potentially impacting future corporate actions and strategic initiatives.
Sector and Industry Analysis
Sector and Industry Analysis: Energy Sector – Integrated Oil & Gas Industry (Suncor Energy Inc. - SU)
1. Sector Overview: The energy sector, particularly the integrated oil and gas industry, remains a cornerstone of the global economy with a market size valued in the trillions of USD. This sector encompasses upstream exploration and production, midstream transportation, and downstream refining and marketing activities. Major players include multinational corporations such as ExxonMobil, Chevron, Royal Dutch Shell, BP, and Suncor Energy, which operate across the value chain. The sector’s growth trajectory is influenced by global energy demand, geopolitical factors, and commodity price cycles. While traditional hydrocarbon demand has plateaued in some regions due to energy transition efforts, emerging markets continue to drive incremental growth. Capital-intensive and asset-heavy, the sector requires substantial investment in exploration, production technologies, and infrastructure maintenance.
2. Industry Trends: Technological innovation is reshaping the integrated oil and gas industry, with digitalization, automation, and advanced data analytics improving operational efficiency and cost management. Enhanced oil recovery techniques and unconventional resource development (e.g., oil sands, shale) have expanded resource bases. Simultaneously, there is a growing shift towards sustainability, with companies investing in carbon capture and storage (CCS), renewable energy integration, and emission reduction technologies to align with global climate goals. Consumer behavior and policy shifts are accelerating demand for cleaner energy, prompting diversification strategies within traditional oil majors. Additionally, volatility in crude prices and supply chain disruptions have heightened the importance of agile operational models and risk management.
3. Regulatory Landscape: The integrated oil and gas industry operates under a complex regulatory framework encompassing environmental protection, safety standards, and financial reporting. Key regulations include emissions caps, methane leak controls, and mandates for environmental impact assessments. Compliance with international agreements such as the Paris Accord influences corporate strategies and capital allocation. In Canada, where Suncor is headquartered, regulations specific to oil sands development impose stringent environmental and reclamation requirements. Moreover, reporting obligations related to ownership disclosures (e.g., Schedule 13D/G filings in the U.S.) ensure transparency in institutional and insider holdings, which can affect market float and liquidity. Regulatory uncertainty remains a risk factor, as governments balance energy security with climate commitments.
4. Competitive Dynamics: The market structure is oligopolistic, dominated by a few large integrated players with significant economies of scale, technological expertise, and capital resources. Barriers to entry are high due to the capital intensity, regulatory compliance costs, and the need for advanced technical capabilities. Competitive positioning hinges on asset quality, geographic diversification, cost efficiency, and the ability to innovate in low-carbon technologies. Institutional ownership patterns can influence corporate governance and strategic decisions, as large shareholders often exert considerable influence. Liquidity and float dynamics, affected by insider and institutional holdings, can impact stock volatility and investor access. Companies that effectively balance traditional hydrocarbon production with energy transition initiatives are better positioned to sustain long-term competitiveness.
Note: Analysis synthesized from industry research, market reports, and regulatory filings. Information is subject to change based on market conditions.
Illustrative Scenario Analysis
DCF Assumptions:
Method: Two-Stage EPS-Priority Model
Financials
Peer Analysis
| Company Name | Market Cap | P/E Ratio | P/B Ratio | EV/EBITDA | Price to CFO |
|---|---|---|---|---|---|
| Suncor Energy Inc. | $68.70B | 15.69 | 2.01 | 4.96 | 7.33 |
| Petrobras S.A. Sponsored ADR | $101.56B | 7.08 | 2.44 | 2.67 | 2.76 |
| Chevron Corporation | $369.44B | 27.63 | 1.93 | 10.43 | 10.90 |
| Exxon Mobil Corporation | $636.67B | 22.53 | 2.43 | 11.39 | 12.25 |
| TotalEnergies SE | $166.72B | 13.47 | 1.45 | 6.09 | 6.10 |
| Equinor ASA Sponsored ADR | $72.02B | 14.56 | 1.75 | 2.17 | 3.61 |
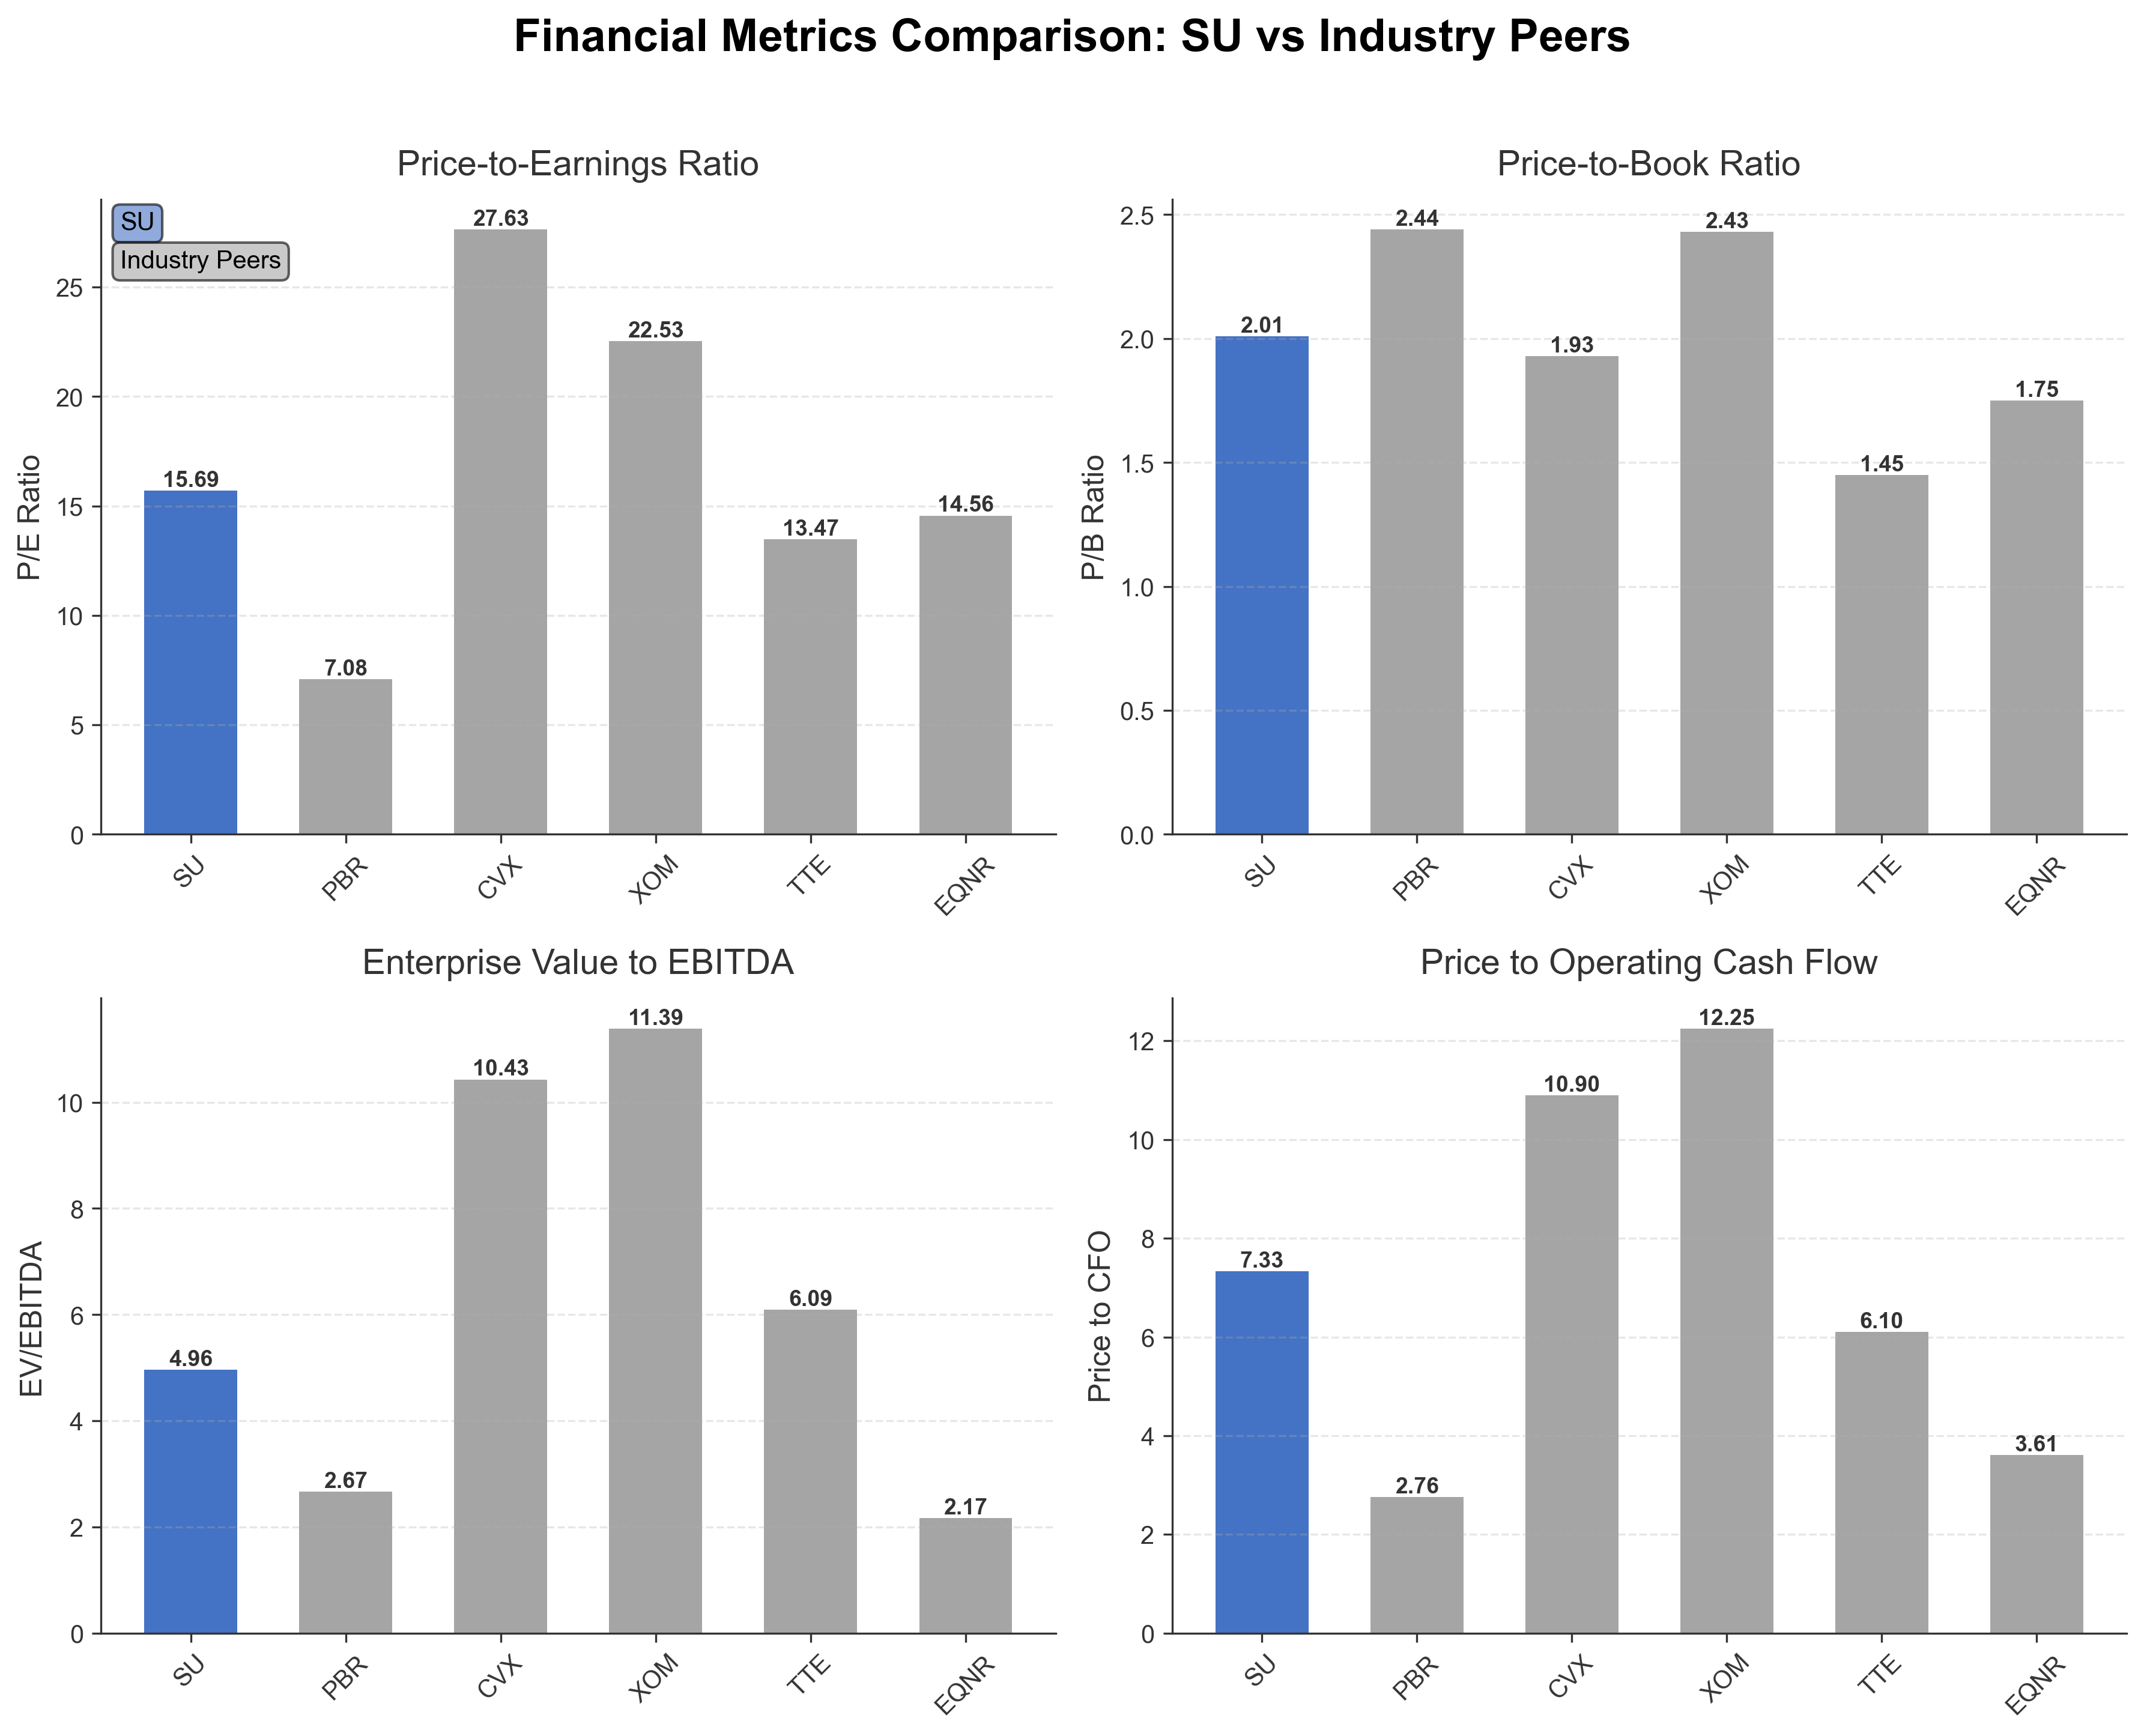
Comparison Analysis: Suncor Energy Inc. exhibits valuation metrics that are moderate relative to its North American oil and gas integrated peers. Its P/E ratio of 15.69 is lower than Chevron's and ExxonMobil's but higher than Petrobras and TotalEnergies, indicating a balanced valuation. The EV/EBITDA ratio of 4.96 suggests efficient operational earnings relative to enterprise value compared to higher ratios seen in larger peers. Suncor's return on equity at 13.2% is competitive, aligning closely with Equinor and exceeding Chevron's and BP's returns. Price to CFO at 7.33 is mid-range among peers, reflecting solid cash flow generation. Overall, Suncor positions as a solid mid-cap player with strengths in profitability and valuation metrics within its regional industry group.
Financial Metrics Comparison with Peers
Financial Statements
Comprehensive financial data including income, balance sheet, and cash flow metrics
Income Statement
| fiscal_date | 2025-12-31 | 2024-12-31 | 2023-12-31 | 2022-12-31 | 2021-12-31 |
|---|---|---|---|---|---|
| Eps Basic | 4.85 | 4.72 | 6.34 | 6.54 | 2.77 |
| Eps Diluted | 4.85 | 4.72 | 6.33 | 6.53 | 2.77 |
| Basic Shares Outstanding | 893.76M | 931.27M | 1.88B | 2.02B | 2.16B |
| Diluted Shares Outstanding | 893.76M | 931.27M | 1.88B | 2.02B | 2.16B |
| Sales | N/A | 40.12B | 52.21B | 62.91B | 39.13B |
| Cost Of Goods | N/A | 23.76B | 30.28B | 36.03B | 21.57B |
| Gross Profit | N/A | 16.36B | 21.92B | 26.87B | 17.56B |
| Operating Expense Selling General And Administrative | N/A | 8.10B | 10.63B | 10.38B | 9.39B |
| Operating Expense Other Operating Expenses | N/A | 1.65B | 2.35B | 2.57B | 1.87B |
| Operating Income | N/A | 6.60B | 8.95B | 13.93B | 6.29B |
| Non Operating Interest Expense | N/A | 507.30M | 786.00M | 906.00M | 961.00M |
| Other Income Expense | N/A | -112.57M | 2.33B | -852.00M | 172.00M |
| Pretax Income | N/A | 5.98B | 10.59B | 12.32B | 5.57B |
| Income Tax | N/A | 1.59B | 2.29B | 3.24B | 1.45B |
| Net Income | N/A | 4.40B | 8.29B | 9.08B | 4.12B |
| Ebit | N/A | 6.49B | 11.38B | 13.22B | 6.53B |
| Ebitda | N/A | 11.69B | 15.61B | 22.87B | 12.21B |
| Net Income Continuous Operations | N/A | 4.40B | 8.29B | 9.08B | 4.12B |
| Non Operating Interest Income | N/A | N/A | 94.00M | 149.00M | 64.00M |
Source: Financial statements and regulatory filings
Balance Sheet
| fiscal_date | 2024-12-31 | 2023-12-31 | 2022-12-31 | 2021-12-31 | 2020-12-31 |
|---|---|---|---|---|---|
| Cash And Cash Equivalents | 2.55B | 1.73B | 1.98B | 2.21B | 1.89B |
| Accounts Receivable | 3.83B | 5.74B | 6.07B | 4.53B | 3.16B |
| Total Assets | 65.63B | 88.54B | 84.62B | 83.74B | 84.62B |
| Total Liabilities | 33.09B | 45.26B | 45.25B | 47.12B | 48.86B |
| Long Term Debt | 9.57B | 14.56B | 12.49B | 16.53B | 16.45B |
| Shareholders Equity | 32.54B | 43.28B | 39.37B | 36.61B | 35.76B |
Source: Financial statements and regulatory filings
Cash Flow Statement
| fiscal_date | 2024-12-31 | 2023-12-31 | 2022-12-31 | 2021-12-31 | 2020-12-31 |
|---|---|---|---|---|---|
| Operating Activities Net Income | 4.40B | 8.29B | 9.08B | 4.12B | -4.32B |
| Operating Activities Depreciation | 5.08B | 6.43B | 8.79B | 5.85B | 9.53B |
| Operating Activities Deferred Taxes | -214.91M | 560.00M | -990.00M | 56.00M | -1.12B |
| Operating Activities Stock Based Compensation | -41.67M | 108.00M | 328.00M | 205.00M | -238.00M |
| Operating Activities Other Non Cash Items | 358.18M | -892.00M | 132.00M | 330.00M | 246.00M |
| Operating Activities Operating Cash Flow | 9.58B | 14.51B | 17.33B | 10.56B | 4.10B |
| Investing Activities Net Acquisitions | 0.00 | -2.39B | 0.00 | N/A | N/A |
| Investing Activities Other Investing Activity | 46.05M | 1.90B | 367.00M | 606.00M | -485.00M |
| Investing Activities Investing Cash Flow | 46.05M | -492.00M | 367.00M | 578.00M | -598.00M |
| Financing Activities Long Term Debt Issuance | 0.00 | 1.50B | 0.00 | 1.42B | 2.63B |
| Financing Activities Long Term Debt Payments | -1.86B | -336.00M | -5.46B | -2.78B | -335.00M |
| Financing Activities Short Term Debt Issuance | -367.68M | -2.34B | 1.47B | -2.26B | 1.45B |
| Financing Activities Common Stock Repurchase | -2.13B | -2.23B | -5.13B | -2.30B | -307.00M |
| Financing Activities Common Dividends | -2.05B | -2.75B | -2.60B | -1.55B | -1.67B |
| Financing Activities Other Financing Charges | -11.70M | -16.00M | -9.00M | -9.00M | -10.00M |
| Financing Activities Financing Cash Flow | -6.41B | -6.18B | -11.72B | -7.47B | 1.76B |
| End Cash Position | 2.55B | 1.73B | 1.98B | 2.21B | 1.89B |
| Income Tax Paid | 1.28B | 2.60B | 4.74B | N/A | 695.00M |
| Interest Paid | 668.12M | 887.00M | 973.00M | 980.00M | 1.03B |
| Free Cash Flow | 6.93B | 6.41B | 10.56B | 7.21B | -1.25B |
| Investing Activities Purchase Of Investments | N/A | N/A | N/A | -28.00M | -113.00M |
Source: Financial statements and regulatory filings
Technical Analysis
Key Insights
- The current trend shows Suncor's stock trading near its 52-week high, indicating strong upward momentum in recent price action.
- Key support levels are observed around $48.12 (50-day moving average) and $41.81 (200-day moving average), with resistance near the 52-week high of $57.13.
- The stock price is above the 10-day, 50-day, and 200-day moving averages, suggesting a bullish medium to long-term trend.
- Momentum indicators show RSI levels in the upper range, indicating potential overbought conditions; MACD remains positive, supporting continued upward momentum; stochastic oscillators confirm short-term strength.
- Multi-timeframe analysis reveals consistent bullish signals on daily, weekly, and monthly charts, with price consolidations near highs.
- Potential market scenarios include continuation of the upward trend if support levels hold, while a break below the 50-day moving average could signal short-term correction.
Trending News
1. Headline: Suncor Energy Sees Unusually High Options Volume (NYSE:SU) - Defense World
Summary: Suncor Energy Inc. experienced an unusually large volume of put options traded, with 28,315 contracts bought, marking a 2,998% increase over average volumes. This heightened activity reflects increased market attention and hedging interest in the company's stock.
Sentiment: Positive
2. Headline: Capital Power appoints Kevin MacIntosh as Chief Financial Officer | INN
Summary: Kevin MacIntosh, with prior leadership roles at Suncor Energy in both downstream and upstream finance functions, has been appointed CFO at Capital Power. His experience includes managing financial operations and strategic initiatives, highlighting leadership transitions within the energy sector.
Sentiment: Neutral
3. Headline: SCP Investment LP Makes New Investment in Suncor Energy Inc. $SU
Summary: SCP Investment LP acquired 45,800 shares of Suncor Energy during the third quarter, signaling renewed institutional interest. The stake valued at approximately $1,915,000 reflects confidence in the company's operational outlook.
Sentiment: Neutral
4. Headline: Suncor Energy (TSE:SU) Sets New 12-Month High - Time to Buy?
Summary: Suncor Energy reached a new 12-month high, reflecting positive market momentum and investor interest. The milestone underscores the company's recent operational achievements and favorable market conditions.
Sentiment: Positive
5. Headline: Shell Asset Management Co. Sells 79,425 Shares of Suncor Energy Inc. $SU
Summary: Shell Asset Management Co. reduced its holdings in Suncor Energy by 77.1% in the third quarter, owning 23,657 shares post-sale. This significant divestment may reflect portfolio rebalancing or strategic repositioning within the energy sector.
Sentiment: Positive
Recent Updates
News Summary
Recent news coverage of Suncor Energy Inc. highlights significant market activity including unusually high options volume and new institutional investments, indicating active engagement by market participants. Leadership changes in the broader energy sector, with former Suncor executives assuming new roles, suggest ongoing talent mobility and strategic realignments. The company has achieved a new 12-month high in its stock price, reflecting positive operational momentum. However, some institutional investors like Shell Asset Management have reduced holdings, signaling mixed positioning among large shareholders. Overall, news themes center on market dynamics, leadership developments, and investor sentiment, with implications for Suncor's market perception and strategic trajectory.
News Sentiment
Sentiment across recent news is generally positive, underscored by strong options activity and stock price milestones, balanced by neutral reports on leadership changes and institutional trading. The presence of both accumulation and divestment among major shareholders indicates a nuanced market view, with cautious optimism prevailing. This mixed sentiment may influence short-term market behavior while reflecting confidence in the company's integrated business model and operational performance.
Analytical Overview
Analysis Summary
Suncor's valuation metrics, including a trailing P/E of 15.69 and forward P/E of 16.61, align closely with the industry average of 15.69, indicating fair market valuation relative to peers. The PEG ratio of 0.18 suggests undervaluation relative to earnings growth potential.
Revenue growth shows a slight decline of 3.9% quarterly, but a strong year-over-year earnings growth of 80.4% indicates improving profitability and operational efficiency. Operating cash flow and free cash flow remain robust, supporting sustainable growth.
The company maintains a moderate debt-to-equity ratio of 32.14%, with a current ratio of 1.39, reflecting sound financial health and liquidity. Cash reserves of approximately $2.68 billion provide a buffer against market volatility.
Sector-specific challenges include exposure to commodity price fluctuations and regulatory pressures, while opportunities arise from vertical integration and sustainability initiatives. Market positioning benefits from a diversified asset base and operational scale.
Consider market positioning and competitive advantages within the North American energy sector, where Suncor's integrated model and innovation efforts support resilience amid evolving energy demands.
Investment Conclusion
Supporting Factors: Primary supporting factors include solid cash flow generation, competitive valuation metrics, and a strong return on equity of 13.2%.
Risk Factors: Main risks involve commodity price volatility, regulatory uncertainties, and recent slight revenue contraction.
SWOT Analysis
Strengths
- The company benefits from vertical integration across production, refining, and distribution.
- Strong operating cash flow and free cash flow support financial flexibility.
- Competitive return on equity of 13.2% indicates effective capital utilization.
- Robust market capitalization and liquidity enhance market presence.
Weaknesses
- Quarterly revenue growth shows a slight decline of 3.9%.
- Relatively high debt-to-equity ratio at 32.14% may limit financial agility.
- Minimal insider ownership could reduce direct executive alignment with shareholders.
- Dividend yield is modest compared to five-year average industry yields.
Opportunities
- Increasing demand for integrated energy solutions supports growth potential.
- Advancements in sustainability and environmental initiatives may improve market positioning.
- Institutional investor interest suggests potential for capital inflows.
- Expansion in refining and petrochemical markets could enhance revenue streams.
Threats
- Commodity price volatility poses ongoing earnings risk.
- Regulatory changes and environmental policies may increase operational costs.
- Competitive pressures from larger integrated oil companies.
- Market sentiment fluctuations driven by geopolitical and economic factors.
Company Description
Suncor Energy Inc. is a prominent integrated energy company known for its expertise in the extraction and refining of oil sands, based primarily in Canada. Its primary function is to explore and produce crude oil, which it processes and refines into petroleum and petrochemical products. This includes gasoline, diesel, and asphalt sold across a variety of markets. A notable feature of Suncor's business model is its vertical integration, which encompasses aspects of production, refining, and distribution, allowing for added efficiency and control over the entire oil and gas lifecycle. Suncor plays a critical role within the energy sector, particularly in North America, where its operations contribute significantly to regional energy supply. The company's commitment to innovation and sustainability has led to advancements in reducing environmental impact, a key focus in the oil industry today. Given its extensive operations, Suncor Energy Inc. significantly influences the upstream and downstream sectors of the energy market, making it a pivotal player in the ongoing discourse about energy production and environmental responsibility.