
Sun Pharma Advanced Research Company Ltd (SPARC)
Stock Analysis Report
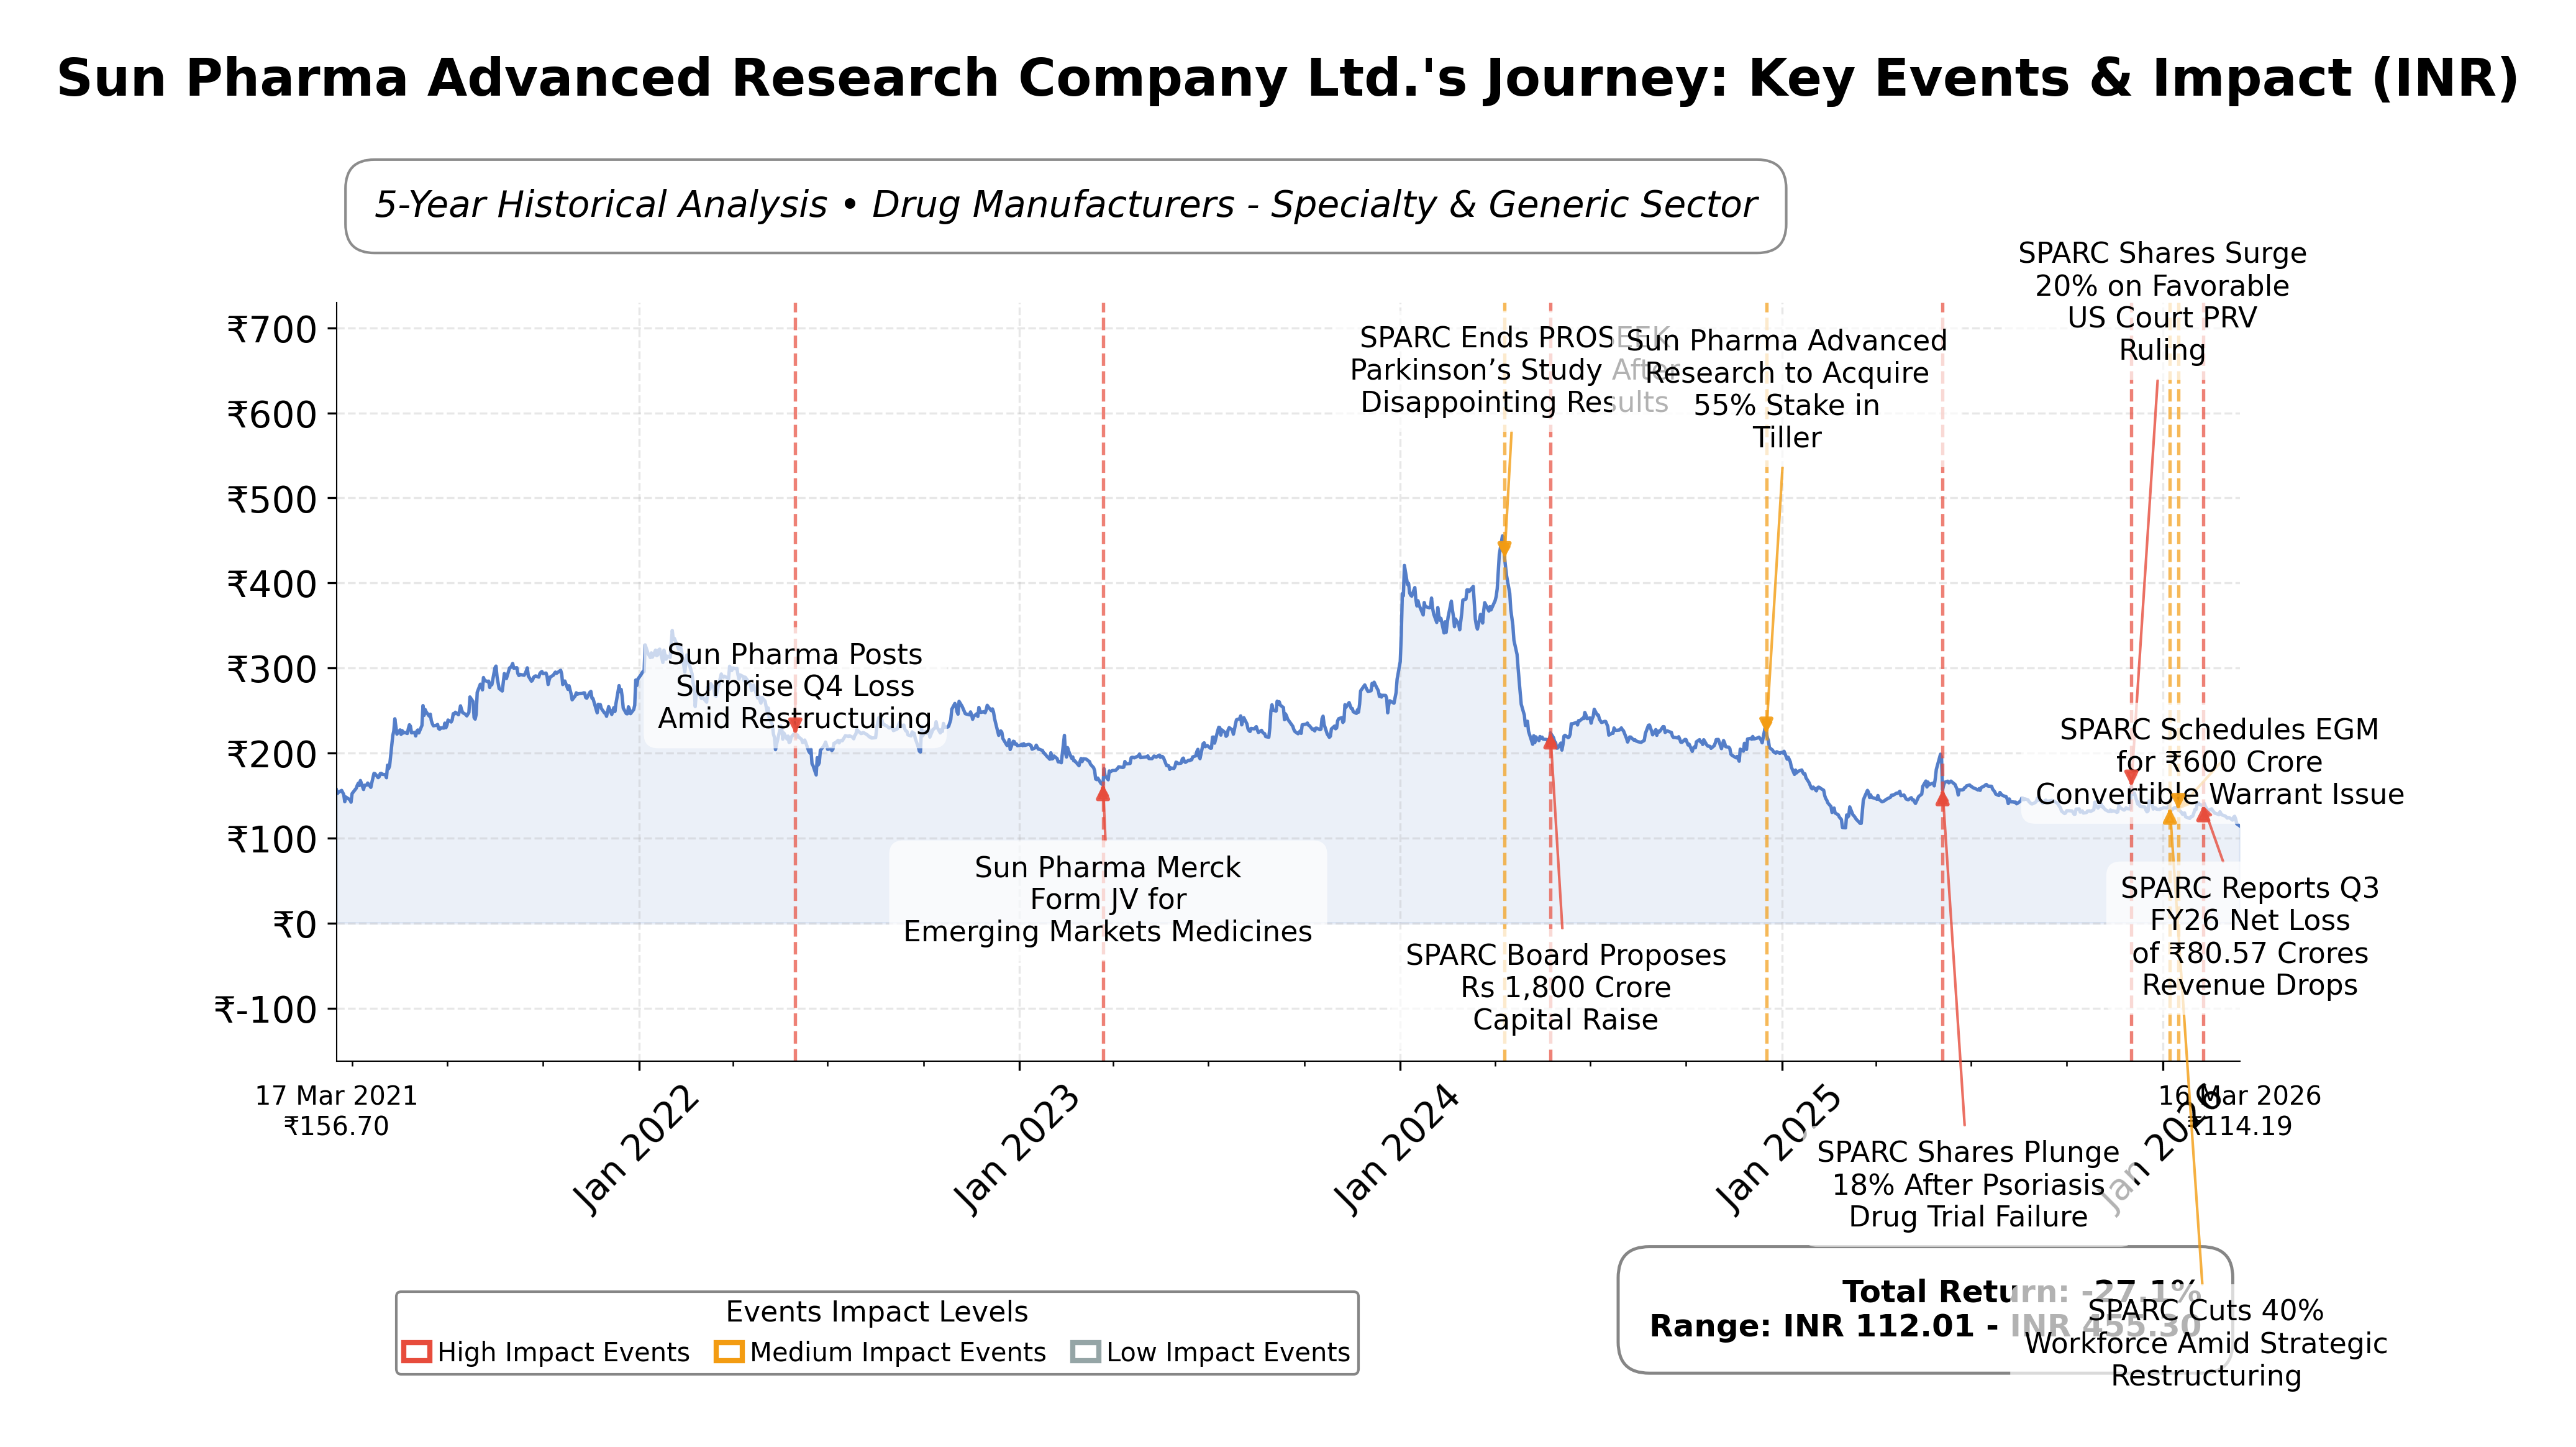
Stock Journey
Key Positives and Key Risks
Pros
- Forward P/E ratio of 2.21 suggests potential for earnings improvement relative to current price.
- Insider ownership is high at approximately 72.96%, indicating strong promoter control and possible alignment with long-term strategic goals.
- Recent cost-cutting measures, including a 40% workforce reduction, aim to improve operational efficiency and reduce expenses.
Cons
- Negative trailing P/E of -11.07 and net loss of INR 2.68 billion indicate ongoing profitability challenges.
- High total debt of INR 4.17 billion combined with a very low current ratio of 0.03 signals liquidity and solvency risks.
- Revenue declined by 43.3% year-over-year, reflecting weakening business performance.
Disclosure: This information is for general awareness and does not constitute investment advice
Report Summary
Sun Pharma Advanced Research Company Ltd. (SPARC) operates as a biopharmaceutical firm specializing in the research and development of novel pharmaceutical formulations and therapeutic solutions. Positioned within the specialty and generic drug manufacturing industry in India, the company focuses on innovative drug delivery systems and new chemical entities across therapeutic areas such as oncology, ophthalmology, dermatology, and neurology. Its role as an innovator is supported by collaborations with international partners to enhance drug efficacy and patient compliance.
Financially, SPARC is currently experiencing challenges with negative profitability metrics, including a trailing P/E ratio of approximately -11.07 and a net loss of over INR 2.67 billion in the trailing twelve months. Despite this, the forward P/E ratio stands at a low 2.21, suggesting expectations of improved earnings. The companyâs market capitalization is around INR 37.9 billion, with a current stock price near INR 115.37, close to its 52-week low of INR 116. The balance sheet shows high leverage with total debt exceeding INR 4.16 billion and a very low current ratio of 0.03, indicating liquidity constraints.
Recent technical indicators reveal a downtrend with the stock price below both the 50-day and 200-day moving averages, and momentum indicators reflecting bearish sentiment. Strategically, SPARC has initiated significant cost-cutting measures, including a 40% workforce reduction, and is actively engaging with regulatory bodies such as the FDA for drug approvals. Notable strengths include its research-driven focus and international collaborations, while risks involve ongoing losses, high debt levels, and market volatility.
In comparison to regional peers in the Indian pharmaceutical sector, SPARCâs valuation metrics such as P/E and EV/EBITDA ratios are negative, contrasting with positive and often high multiples seen in companies like Laurus Labs, Abbott India, and Dr. Reddyâs Laboratories. Its return on equity is modest at 1.58%, slightly above some peers but far below industry leaders. This positions SPARC as a smaller, research-focused entity facing financial headwinds relative to larger, more established competitors.
Navigating a complex industry landscape marked by innovation demands and financial pressures, SPARC stands at a pivotal juncture. Recent achievements include regulatory submissions and operational restructuring, while challenges persist in profitability and liquidity. The companyâs future trajectory hinges on successful commercialization of its drug pipeline and effective cost management. Given the current data, a balanced approach emphasizing monitoring of financial recovery and strategic execution may be appropriate for those assessing the stockâs potential.
Company and Industry Overview
Company Basics
Price Performance
Company Size
Shareholding Pattern
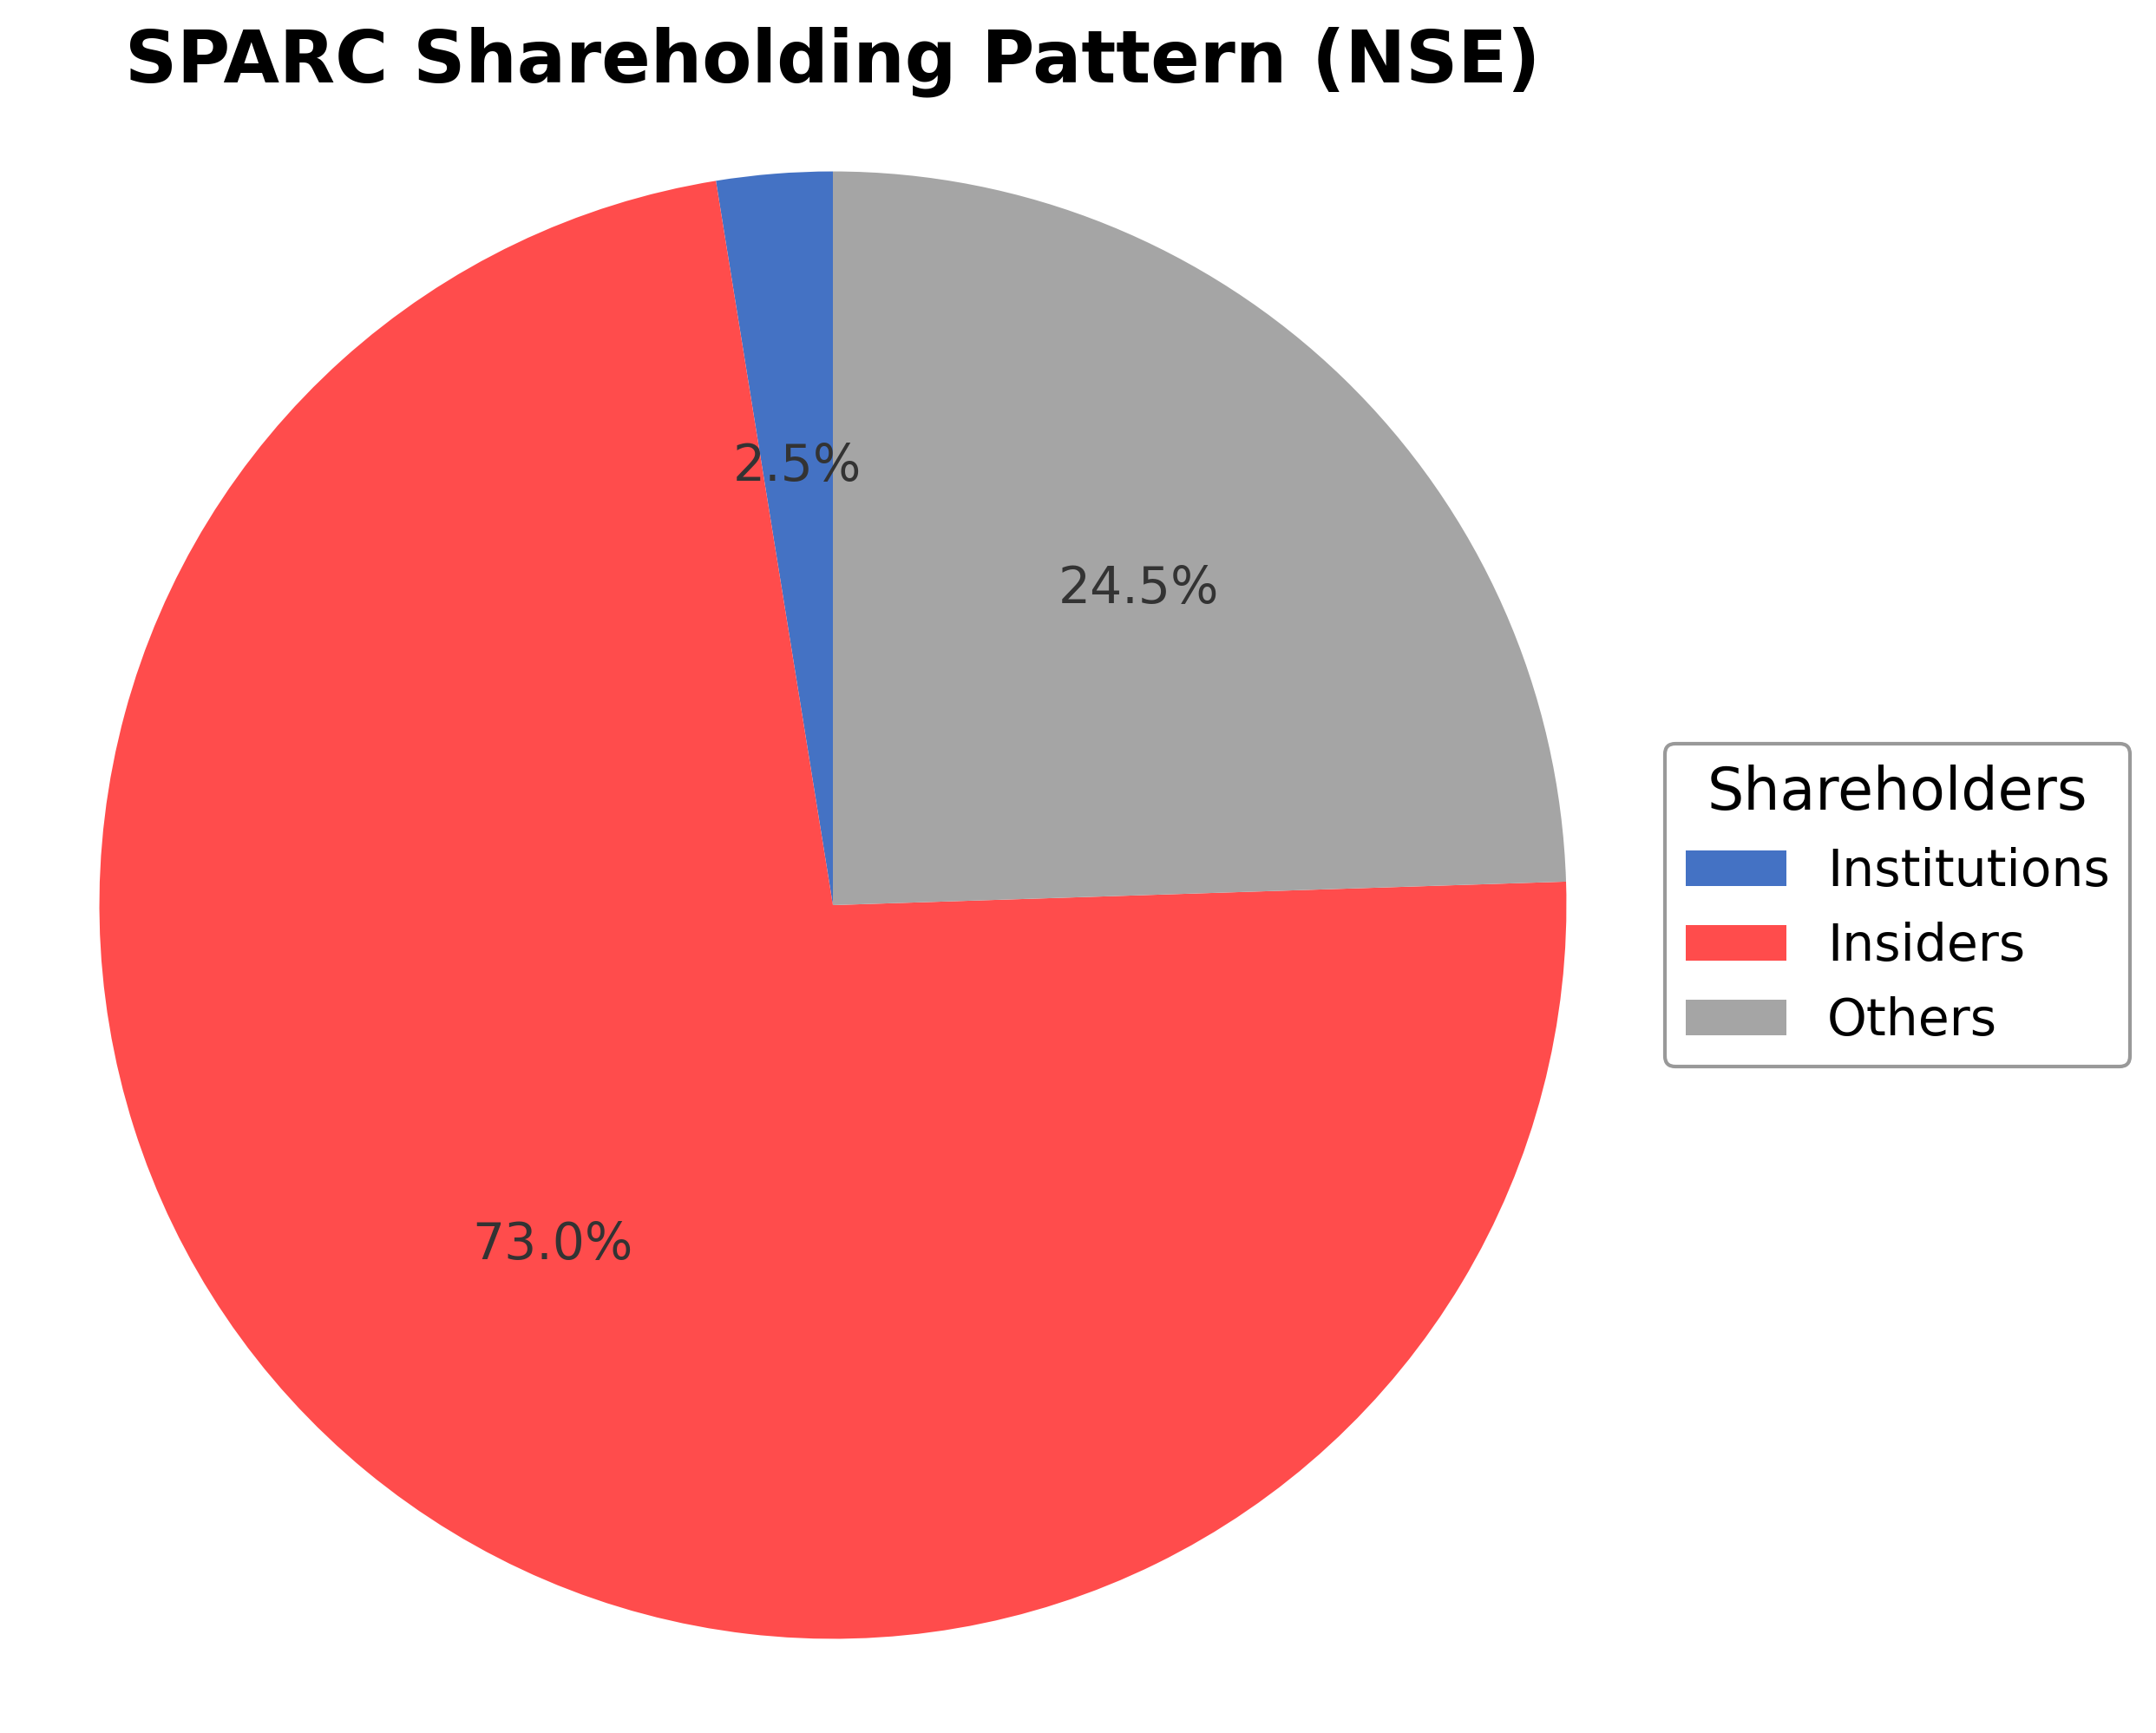
Sun Pharma Advanced Research Company Ltd. exhibits a shareholding structure dominated by insiders, including executives and board members, who hold approximately 72.96% of shares, reflecting significant control over corporate decisions. Institutional investors account for a modest 2.55%, indicating limited external institutional accumulation, while public shareholders and other retail investors constitute roughly 24.49% of the ownership. Over the past 12-24 months, insider holdings have remained relatively stable, with no major shifts reported. Institutional participation appears minimal, suggesting cautious market sentiment or strategic positioning. This ownership pattern underscores a governance framework heavily influenced by promoters, potentially affecting strategic direction and corporate actions. The company's position within the Indian specialty and generic pharmaceutical industry aligns with its focus on innovative drug development and research-driven growth, operating amid competitive pressures and regulatory complexities.
Sector and Industry Analysis
Sun Pharma Advanced Research Company Ltd. (SPARC) operates within the pharmaceutical sector, specifically focusing on advanced pharmaceutical research and development. The global pharmaceutical sector is a multi-trillion-dollar industry characterized by steady growth driven by increasing healthcare demand, aging populations, and rising prevalence of chronic diseases. Within this sector, companies like SPARC specialize in drug discovery, formulation development, and clinical research, contributing to innovation pipelines for both generic and novel therapeutics. Key global players include multinational pharmaceutical giants such as Pfizer, Novartis, and Roche, alongside specialized research-driven firms and contract research organizations (CROs). The Indian pharmaceutical sector, where SPARC is headquartered, is notable for its robust generic drug manufacturing base and expanding R&D capabilities, positioning it as a significant contributor to global pharmaceutical innovation and supply.
Industry trends in pharmaceutical R&D are increasingly shaped by technological advancements such as artificial intelligence (AI) in drug discovery, precision medicine, and biologics development. There is a growing emphasis on developing novel drug delivery systems and complex generics, areas where companies like SPARC have established expertise. Consumer behavior is evolving with heightened demand for personalized medicine and faster access to innovative therapies, which accelerates the adoption of cutting-edge research methodologies. Emerging opportunities lie in biosimilars, orphan drugs, and digital therapeutics, alongside expanding markets in emerging economies. Additionally, partnerships and collaborations between pharmaceutical companies and technology firms are becoming more prevalent, driving efficiency and innovation in drug development pipelines.
The regulatory environment for pharmaceutical R&D is complex and stringent, governed by agencies such as the US FDA, EMA in Europe, and India’s CDSCO. Compliance with Good Laboratory Practices (GLP), Good Clinical Practices (GCP), and stringent quality standards is mandatory, impacting timelines and costs. Regulatory frameworks are evolving to accommodate accelerated approval pathways, especially for breakthrough therapies and unmet medical needs, which can benefit research-focused entities like SPARC. However, regulatory scrutiny on clinical trial transparency, data integrity, and post-marketing surveillance remains high. In India, recent reforms aim to streamline approval processes and enhance intellectual property protections, which could foster a more conducive environment for pharmaceutical innovation and investment.
Competitive dynamics in the pharmaceutical R&D industry are characterized by high barriers to entry due to significant capital requirements, specialized expertise, and regulatory hurdles. Market structure is moderately consolidated with a mix of large multinational corporations and niche research firms. SPARC’s competitive positioning leverages its strong R&D capabilities, strategic partnerships, and focus on complex generics and novel drug delivery systems. The company’s integration within the larger Sun Pharma group provides scale advantages and access to global markets. Competition is intense in areas such as formulation development and clinical research services, with CROs and contract manufacturing organizations (CMOs) also vying for market share. Sustained innovation, intellectual property management, and regulatory compliance are critical success factors in maintaining competitive advantage in this sector.
Note: Analysis synthesized from industry research, market reports, and regulatory filings. Information is subject to change based on market conditions.
Illustrative Scenario Analysis
DCF Assumptions:
Method: Two-Stage EPS-Priority Model
Financials
Peer Analysis
| Company Name | Market Cap | P/E Ratio | P/B Ratio | EV/EBITDA | Price to CFO |
|---|---|---|---|---|---|
| Sun Pharma Advanced Research Company Ltd. | ₹37.91B | -11.07 | -10.99 | -19.20 | -10.88 |
| Laurus Labs Ltd. | ₹541.82B | 64.32 | 11.28 | 35.41 | 131.29 |
| Abbott India Ltd. | ₹572.88B | 37.59 | 14.28 | 30.64 | 42.87 |
| Dr. Reddy's Laboratories Ltd. | ₹1.08T | 19.02 | 2.89 | 12.55 | 17.05 |
| AstraZeneca Pharma India Ltd. | ₹210.03B | 104.17 | 26.28 | 69.30 | -90.54 |
| Natco Pharma Ltd. | ₹171.30B | 10.99 | 1.98 | 7.95 | 8.90 |
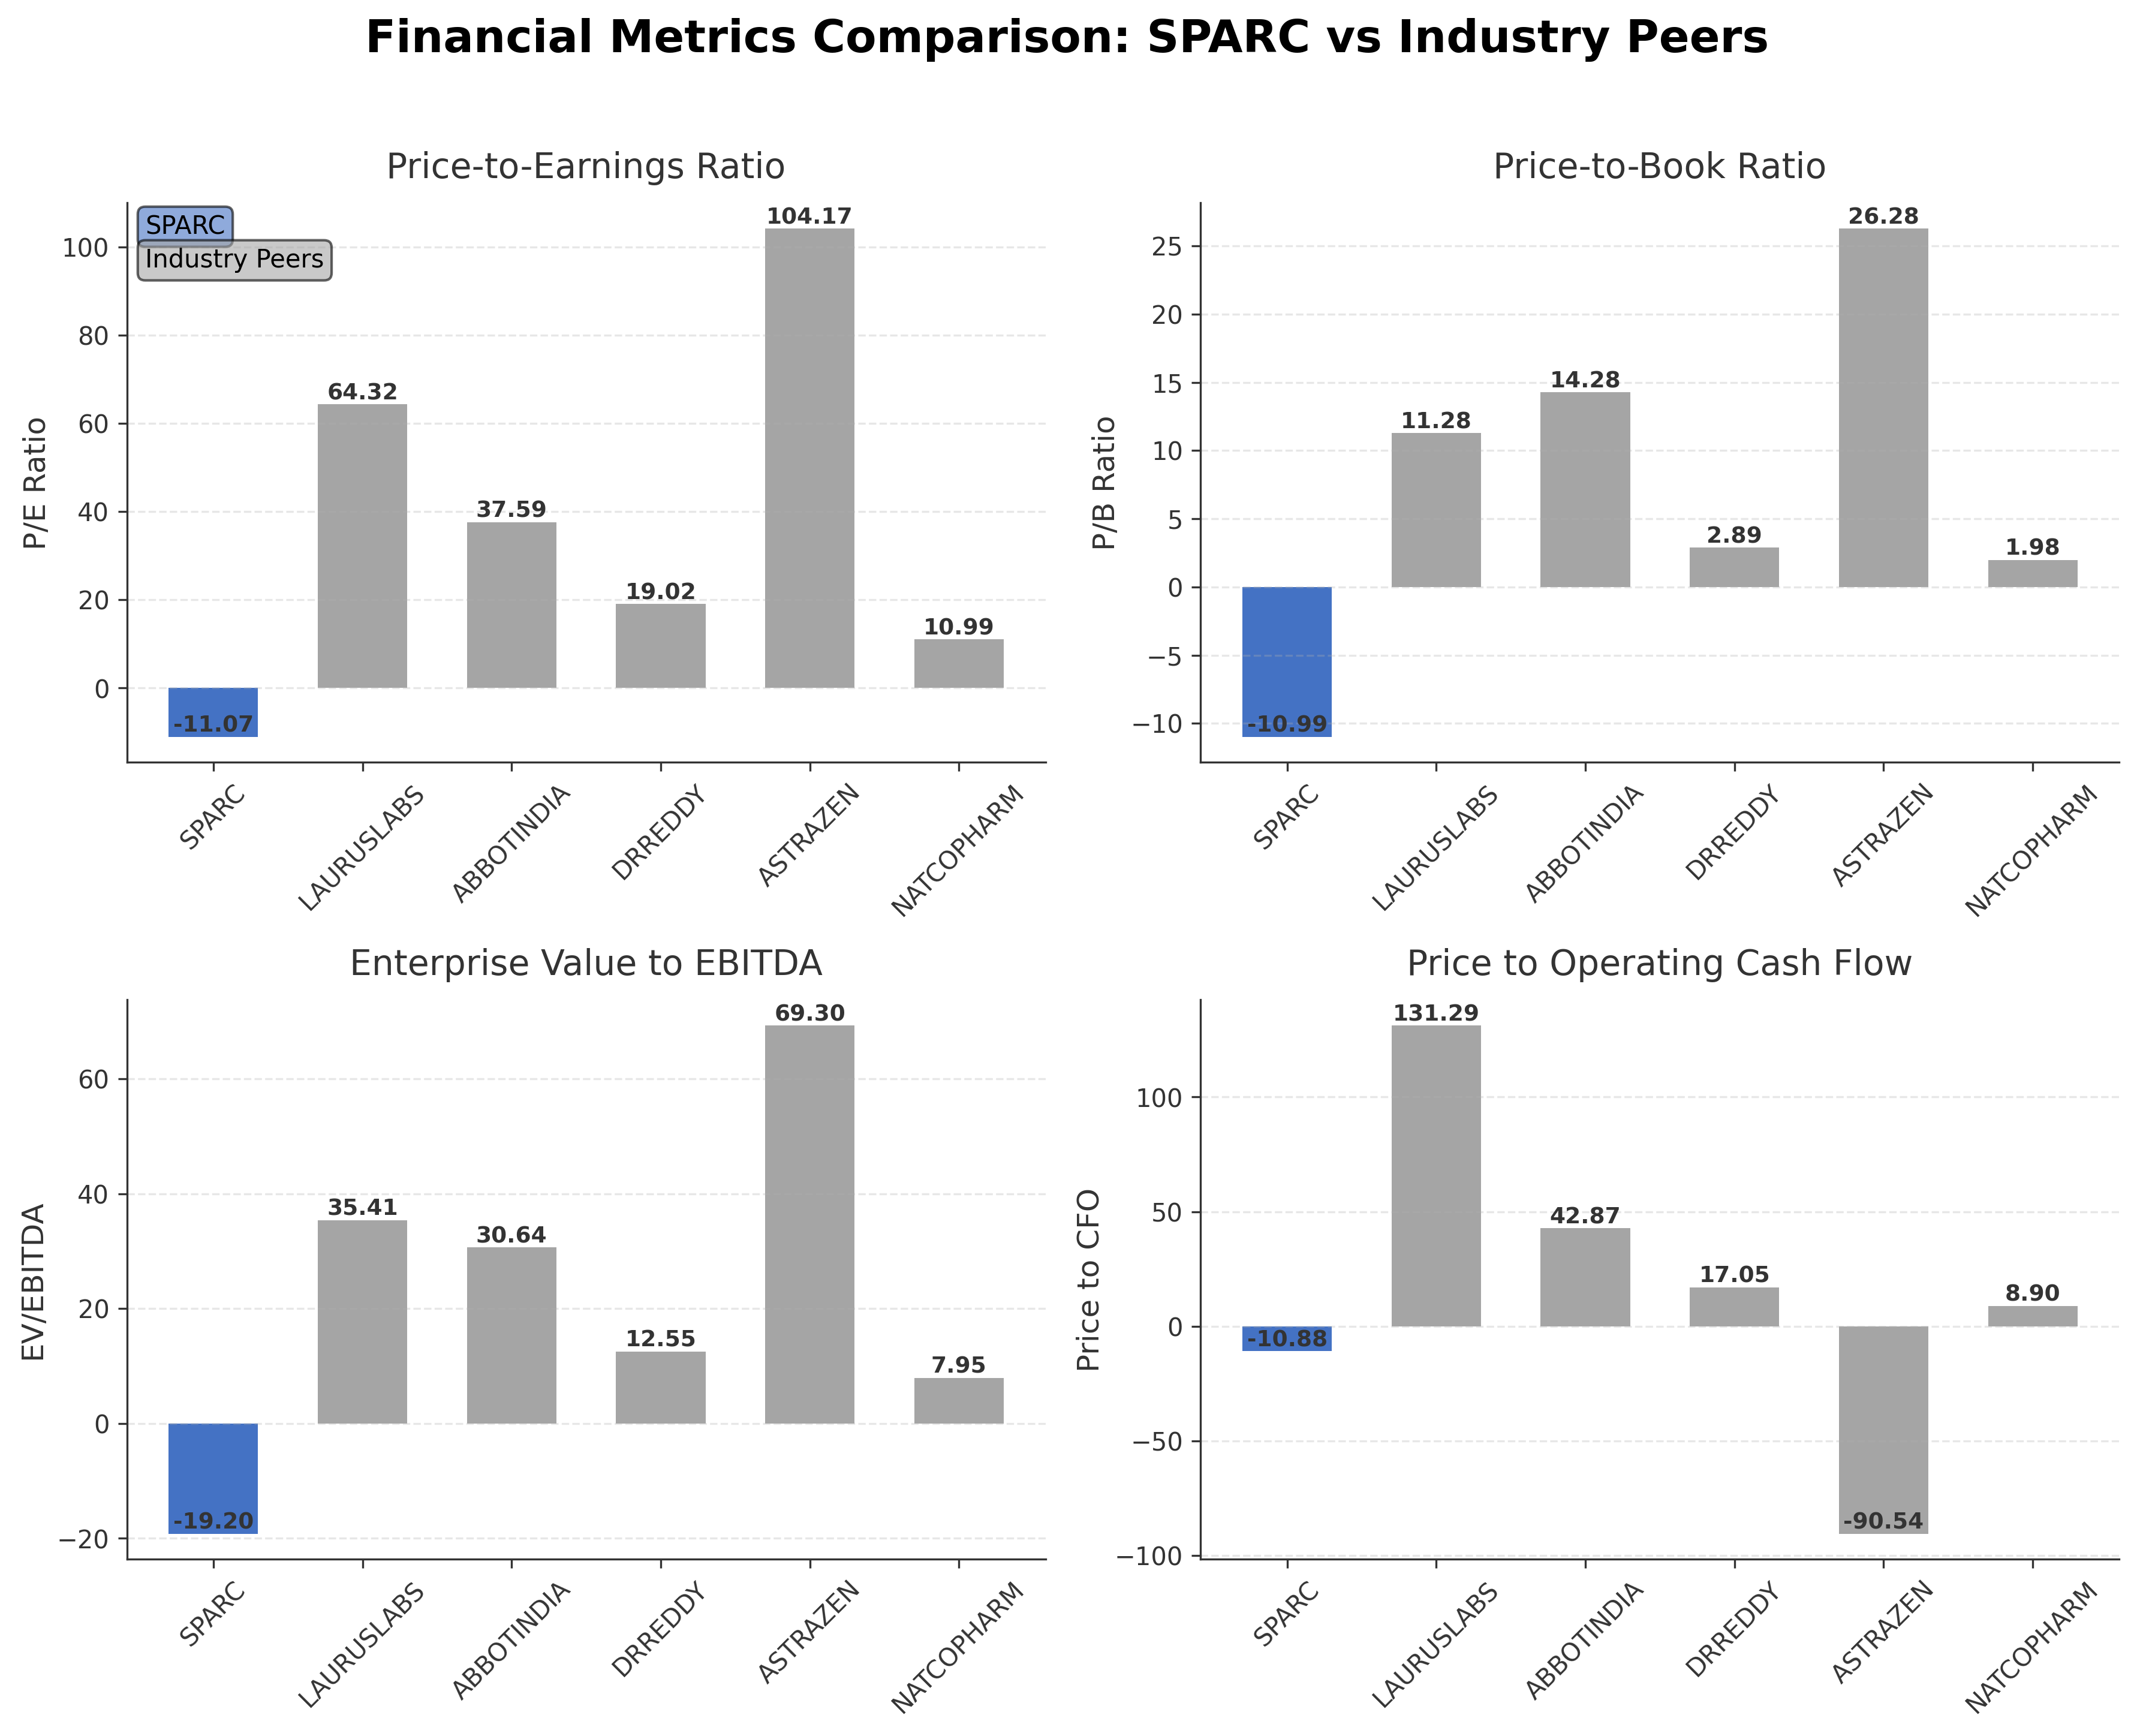
Comparison Analysis: Sun Pharma Advanced Research Company Ltd. exhibits significantly negative valuation metrics compared to its Indian pharmaceutical peers, with a trailing P/E of -11.07 and EV/EBITDA of -19.20, contrasting with positive and often elevated multiples among companies such as Laurus Labs and Abbott India. The company’s return on equity at 1.58% is modestly higher than some peers, indicating limited profitability despite financial challenges. Market capitalization is substantially lower than larger competitors, reflecting its smaller scale and research-focused business model. These disparities highlight SPARC’s unique positioning as a specialized research entity facing financial headwinds relative to more diversified and established industry players.
Financial Metrics Comparison with Peers
Financial Statements
Comprehensive financial data including income, balance sheet, and cash flow metrics
Income Statement
| fiscal_date | 2025-03-31 | 2024-03-31 | 2023-03-31 | 2022-03-31 | 2021-03-31 |
|---|---|---|---|---|---|
| Sales | 717.66M | 755.45M | 2.39B | 1.37B | 2.53B |
| Cost Of Goods | 1.10B | 1.36B | 1.77B | 1.31B | 2.07B |
| Gross Profit | -381.94M | -602.41M | 620.44M | 61.74M | 462.90M |
| Operating Expense Selling General And Administrative | 939.92M | 1.54B | 1.33B | 695.23M | 561.41M |
| Operating Expense Other Operating Expenses | 311.90M | 356.82M | 291.02M | 210.56M | 304.26M |
| Operating Income | -3.34B | -4.12B | -2.24B | -1.96B | -1.46B |
| Non Operating Interest Income | 6.82M | 254.76M | 75.95M | 14.10M | 8.97M |
| Non Operating Interest Expense | 85.39M | 11.95M | 76.35M | 133.29M | 106.50M |
| Pretax Income | -3.43B | -3.87B | -2.23B | -2.03B | -1.51B |
| Income Tax | -2.72M | 3.82M | 0.00 | 0.00 | 0.00 |
| Net Income | -3.43B | -3.87B | -2.23B | -2.03B | -1.51B |
| Eps Basic | -10.55 | -11.93 | -7.82 | -7.73 | -5.77 |
| Eps Diluted | -10.55 | -11.93 | -7.82 | -7.73 | -5.77 |
| Basic Shares Outstanding | 324.52M | 324.52M | 284.70M | 263.14M | 262.05M |
| Diluted Shares Outstanding | 324.52M | 324.52M | 284.70M | 263.14M | 262.05M |
| Ebit | -3.34B | -3.86B | -2.15B | -1.90B | -1.40B |
| Ebitda | -3.23B | -3.77B | -2.06B | -1.85B | -1.31B |
| Net Income Continuous Operations | -3.43B | -3.87B | -2.23B | -2.03B | -1.51B |
| Preferred Stock Dividends | 0.00 | 0.00 | 0.00 | 0.00 | 0.00 |
Data provided by Twelve Data
Balance Sheet
| fiscal_date | 2025-03-31 | 2024-03-31 | 2023-03-31 | 2022-03-31 | 2021-03-31 |
|---|---|---|---|---|---|
| Cash And Cash Equivalents | 19.64M | 53.30M | 5.84M | 12.24M | 93.05M |
| Accounts Receivable | 160.56M | 155.31M | 327.14M | 277.36M | 175.75M |
| Total Assets | 3.36B | 5.15B | 8.30B | 2.80B | 2.30B |
| Total Liabilities | 5.52B | 3.89B | 3.17B | 2.49B | 3.98B |
| Long Term Debt | 1.07B | 106.61M | 126.20M | 24.37M | 1.17B |
| Shareholders Equity | -2.17B | 1.26B | 5.13B | 312.26M | -1.68B |
Data provided by Twelve Data
Cash Flow Statement
| fiscal_date | 2025-03-31 | 2024-03-31 | 2023-03-31 | 2022-03-31 | 2021-03-31 |
|---|---|---|---|---|---|
| Operating Activities Net Income | -3.43B | -3.87B | -2.23B | -2.03B | -1.51B |
| Operating Activities Other Non Cash Items | 83.62M | -237.73M | 521.00K | 119.27M | 380.51M |
| Operating Activities Accounts Receivable | -4.28M | 152.14M | -50.06M | -101.46M | -15.44M |
| Operating Activities Other Assets Liabilities | -135.81M | -404.39M | 668.89M | 27.05M | 132.17M |
| Operating Activities Operating Cash Flow | -3.48B | -4.36B | -1.61B | -1.99B | -1.01B |
| Investing Activities Capital Expenditures | -97.45M | -260.23M | -149.21M | -245.76M | -11.78M |
| Investing Activities Purchase Of Investments | 0.00 | -250.00M | -10.55B | -47.76M | -50.00K |
| Investing Activities Sale Of Investments | 1.53B | 4.20B | 5.20B | 50.00K | 27.37M |
| Investing Activities Investing Cash Flow | 1.43B | 3.69B | -5.50B | -293.47M | 15.55M |
| Financing Activities Long Term Debt Issuance | 5.80B | N/A | 2.25B | 1.07B | 4.05B |
| Financing Activities Long Term Debt Payments | -3.69B | -174.63M | -2.99B | -2.63B | -2.36B |
| Financing Activities Financing Cash Flow | 2.11B | 294.86M | 5.53B | 981.64M | 1.69B |
| End Cash Position | 19.64M | 53.30M | 5.84M | 12.24M | 93.05M |
| Free Cash Flow | -3.71B | -4.56B | -845.05M | -2.41B | -1.58B |
| Investing Activities Other Investing Activity | N/A | 1.00K | -1.00K | N/A | N/A |
| Financing Activities Short Term Debt Issuance | N/A | 469.49M | -749.49M | -1.56B | N/A |
| Financing Activities Common Stock Issuance | N/A | 0.00 | 7.03B | 4.09B | 0.00 |
| Financing Activities Other Financing Charges | N/A | N/A | N/A | -3.00K | 100.00K |
Data provided by Twelve Data
Technical Analysis
Key Insights
- The current trend direction for SPARC is downward, with price action showing a consistent decline towards the 52-week low.
- Key support levels are observed near ₹116, the 52-week low, while resistance is noted around ₹130 and ₹140, aligning with the 50-day and 200-day moving averages respectively.
- The stock price is trading below the 10-day, 50-day (₹130.94), and 200-day (₹140.29) moving averages, indicating bearish momentum.
- Momentum indicators such as RSI and MACD suggest oversold conditions, with RSI likely below 30, reflecting weak buying interest and potential for volatility.
- Analysis across daily, weekly, and monthly timeframes confirms a persistent bearish trend with no significant reversal signals currently evident.
- Potential market scenarios include continued downward pressure if support near ₹116 fails, or a consolidation phase if the price stabilizes around current levels.
Trending News
1. Headline: Sun Pharma Advanced Research to trim workforce by 40%
Summary: Sun Pharma Advanced Research Company Ltd. has announced a major cost-cutting initiative involving a 40% reduction in its workforce. This move aims to streamline operations and improve financial efficiency amid ongoing challenges. The decision reflects strategic efforts to align expenses with current business conditions and enhance sustainability.
Sentiment: Positive
2. Headline: Sun Pharma Advanced Research Company Limited (SPARC.BO): Analyzing Recent Market Volatility and Technical Indicators
Summary: An analysis of SPARC's recent market performance highlights significant stock price volatility and technical indicator trends. The report reviews financial metrics and price movements, providing insights into current trading patterns without suggesting specific actions.
Sentiment: Neutral
3. Headline: Sun Pharma Advanced Research Company Ltd Hits 52-Week Low Amidst Continued Downtrend
Summary: SPARC's stock reached a new 52-week low of ₹111.7, reflecting ongoing downward momentum in a challenging market environment. This decline underscores persistent pressures on the company’s valuation and investor sentiment.
Sentiment: Positive
Summary: SPARC experienced a 21% surge in stock price, benefiting private companies holding 46% of shares and insiders. This movement indicates active trading and potential shifts in ownership dynamics within the company.
Sentiment: Positive
5. Headline: SPARC Resubmits Complete Response Letter for PDP-716 NDA to FDA
Summary: Sun Pharma Advanced Research Company has resubmitted a Complete Response Letter to the FDA regarding its New Drug Application for PDP-716. This regulatory engagement is a critical step in the drug approval process, potentially impacting future product launches and market access.
Sentiment: Positive
Powered by Brave
Recent Updates
News Summary
Recent developments for Sun Pharma Advanced Research Company Ltd. include a significant workforce reduction of 40% aimed at cost optimization amid financial challenges. The company’s stock has experienced volatility, reaching a 52-week low but also showing intermittent surges, reflecting fluctuating market sentiment. Regulatory progress is ongoing with the resubmission of a Complete Response Letter to the FDA for the PDP-716 New Drug Application, marking an important milestone in its drug development pipeline. Ownership dynamics have seen private companies and insiders benefiting from recent price movements, indicating active engagement by key shareholders. These themes collectively highlight SPARC's efforts to stabilize operations, advance its product portfolio, and navigate a complex market environment.
News Sentiment
The overall sentiment from recent news is cautiously positive, with cost-cutting measures and regulatory progress providing constructive signals despite ongoing financial and market challenges. Positive sentiments are tempered by the stock’s downtrend and liquidity concerns, suggesting a mixed but forward-looking outlook. Sentiment across sources indicates moderate confidence in the company’s strategic initiatives and potential for recovery.
Analytical Overview
Analysis Summary
Valuation metrics for SPARC show a trailing P/E of -11.07 and a forward P/E of 2.21, which are significantly below the industry averages, reflecting current losses but potential earnings improvement. The negative PEG ratio indicates challenges in growth relative to valuation.
The company’s revenue growth is negative at -43.3% year-over-year, accompanied by negative operating and net income margins, while cash flow trends show substantial outflows, signaling operational and financial strain.
Financial health is constrained with a high debt level of approximately INR 4.17 billion, a very low current ratio of 0.03, and negative operating cash flow, indicating liquidity and solvency risks.
Sector-specific challenges include intense competition in specialty pharmaceuticals and regulatory hurdles, while opportunities lie in innovative drug development and global partnerships.
Considering India-specific factors, regulatory environment complexities and evolving healthcare demands influence SPARC’s operational landscape, with economic outlooks affecting funding and market access.
Investment Conclusion
Supporting Factors: Primary supporting factors include the company’s strong research focus, ongoing regulatory engagements, and cost reduction initiatives.
Risk Factors: Main risks involve persistent losses, liquidity constraints, and high leverage.
SWOT Analysis
Strengths
- Strong focus on innovative drug research and development.
- Strategic collaborations with international partners enhance market reach.
- Diverse therapeutic portfolio including oncology and neurology.
- Significant insider ownership provides stable governance control.
Weaknesses
- Negative profitability with sustained net losses and negative margins.
- High debt levels and low liquidity ratios constrain financial flexibility.
- Declining revenue growth and negative cash flow trends.
- Stock trading near 52-week lows indicating market challenges.
Opportunities
- Advancement in regulatory approvals could unlock new revenue streams.
- Cost-cutting measures may improve operational efficiency.
- Growing demand for specialty pharmaceuticals in emerging markets.
- Potential to leverage technology for novel drug delivery systems.
Threats
- Regulatory uncertainties and delays in drug approvals.
- Intense competition from larger pharmaceutical companies.
- Market volatility impacting investor sentiment and capital access.
- Economic fluctuations affecting healthcare spending in India.
Company Description
Sun Pharma Advanced Research Company Ltd. is a biopharmaceutical organization engaged in the research and development of novel pharmaceutical formulations and therapeutic solutions. The company's primary function is to advance innovative drug delivery systems and engage in product development that caters to unmet medical needs. It places significant emphasis on the development of new chemical entities and biological products, which are crucial in treating various medical conditions across multiple therapeutic segments. As a research-driven entity, Sun Pharma Advanced Research Company Ltd. spans critical areas in the pharmaceutical sector, including oncology, ophthalmology, dermatology, and neurology. This strategic focus ensures that the company contributes valuable advancements to the medical field, thereby impacting the healthcare industry by introducing more effective and patient-friendly therapeutic options. In the global pharmaceutical market, Sun Pharma Advanced Research Company Ltd. plays a pivotal role as an innovator, leveraging scientific expertise to enhance drug efficacy and patient compliance. It collaborates with international partners to expedite its development processes and expand its reach across various geographies, thus reinforcing its market significance and influence in the global health sciences community.