
Sumedha Fiscal Services Ltd (SUMEDHA)
Stock Analysis Report
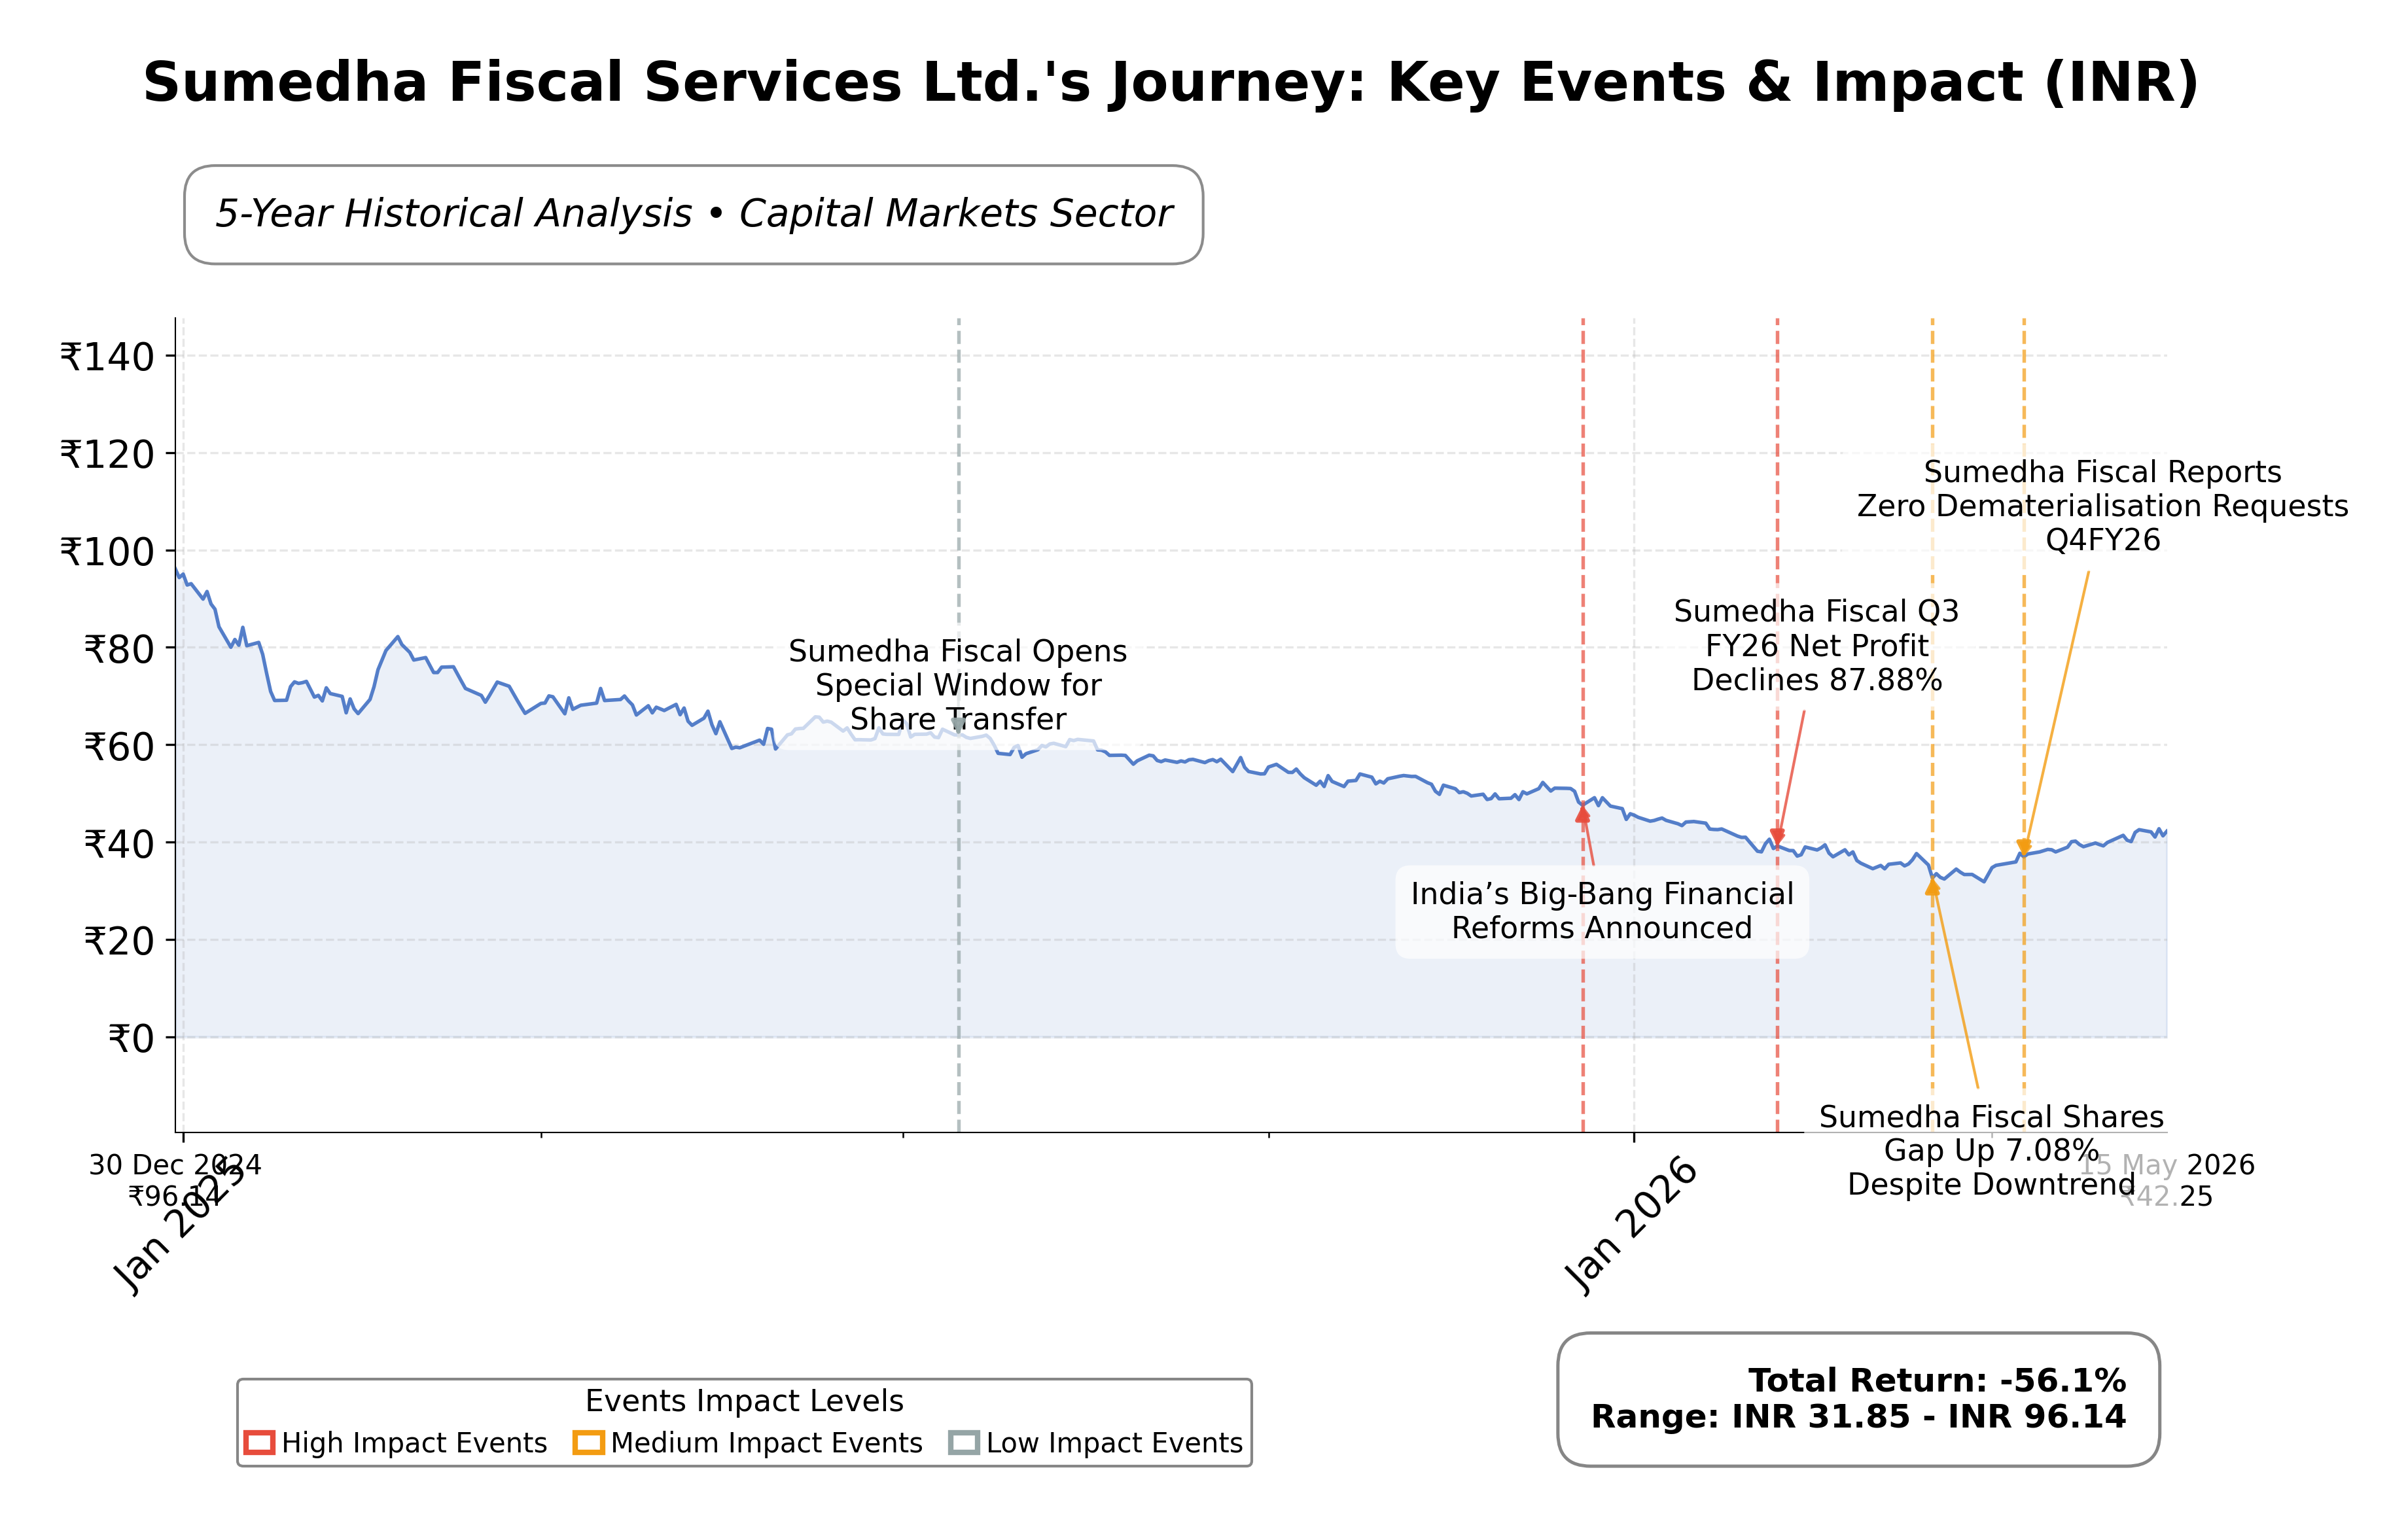
Stock Journey
Key Positives and Key Risks
Pros
- Trailing P/E ratio of 6.75 is significantly below the industry average of 33.1, indicating potential undervaluation.
- Debt-free balance sheet with ₹11.23 crore in cash reserves supports financial stability and operational flexibility.
- Quarterly revenue growth of 61.1% demonstrates strong top-line momentum.
Cons
- Operating margin is low at 1.25%, limiting profitability.
- Negative EV/EBITDA ratio (-8.15) reflects recent EBITDA challenges.
- Quarterly earnings declined 87.8% year-over-year, indicating margin pressures and earnings volatility.
Disclosure: This information is for general awareness and does not constitute investment advice
Report Summary
Sumedha Fiscal Services Ltd. is a diversified financial services company based in India, listed on the Bombay Stock Exchange (BSE) under the financial services sector. The company provides a broad range of financial advisory services including capital market operations, corporate financial advisory, investment banking, debt syndication, mergers and acquisitions, and equity placements. It operates across multiple Indian cities and serves various sectors such as real estate, manufacturing, and services, positioning itself as a key intermediary in India's capital markets ecosystem.
Financially, Sumedha Fiscal Services reported trailing twelve months (TTM) revenue of approximately ₹97.7 crore with a gross margin of 6.22%, operating margin of 1.25%, and a net profit margin of 5.11%. The company’s return on equity (ROE) stands at 11.29%, and return on assets (ROA) at 10.74%, indicating moderate profitability and efficient asset utilization. The operating cash flow for the TTM period was ₹7.81 crore, with a levered free cash flow of ₹7.28 crore, reflecting positive cash generation despite modest margins.
Valuation metrics show a trailing price-to-earnings (P/E) ratio of 6.75 and a price-to-book (P/B) ratio of 0.49, suggesting the stock trades at a discount relative to its book value. The enterprise value to EBITDA ratio is negative at -8.15, indicating EBITDA was zero or negative in the recent period. The market capitalization is approximately ₹33.7 crore, with the current stock price at ₹42.25, trading well below its 52-week high of ₹68.90 but above the 52-week low of ₹30.95, reflecting a 52-week downside risk of about 38.3%.
Sumedha Fiscal Services benefits from a debt-free balance sheet with zero total debt and substantial cash reserves of ₹11.23 crore. The company’s strengths include strong cash flow generation, a diversified service portfolio, and a significant insider ownership of 57.7%, which may align management interests with shareholders. Risks include low operating margins, a highly competitive financial services sector, and exposure to regulatory changes in India’s capital markets. Recent strategic actions include approvals for issuance of equity shares and convertible warrants on a preferential basis, signaling potential capital raising initiatives.
Technically, the stock price is currently below its 200-day moving average of ₹47.22 but above the 50-day moving average of ₹37.37, indicating mixed momentum. The stock has shown a recent positive price change of 2.32% on moderate volume. Given the current financial and technical data, the stock appears to be in a consolidation phase with potential for volatility, warranting a cautious and observant approach to market developments.
Company and Industry Overview
Company Basics
Price Performance
Company Size
Shareholding Pattern
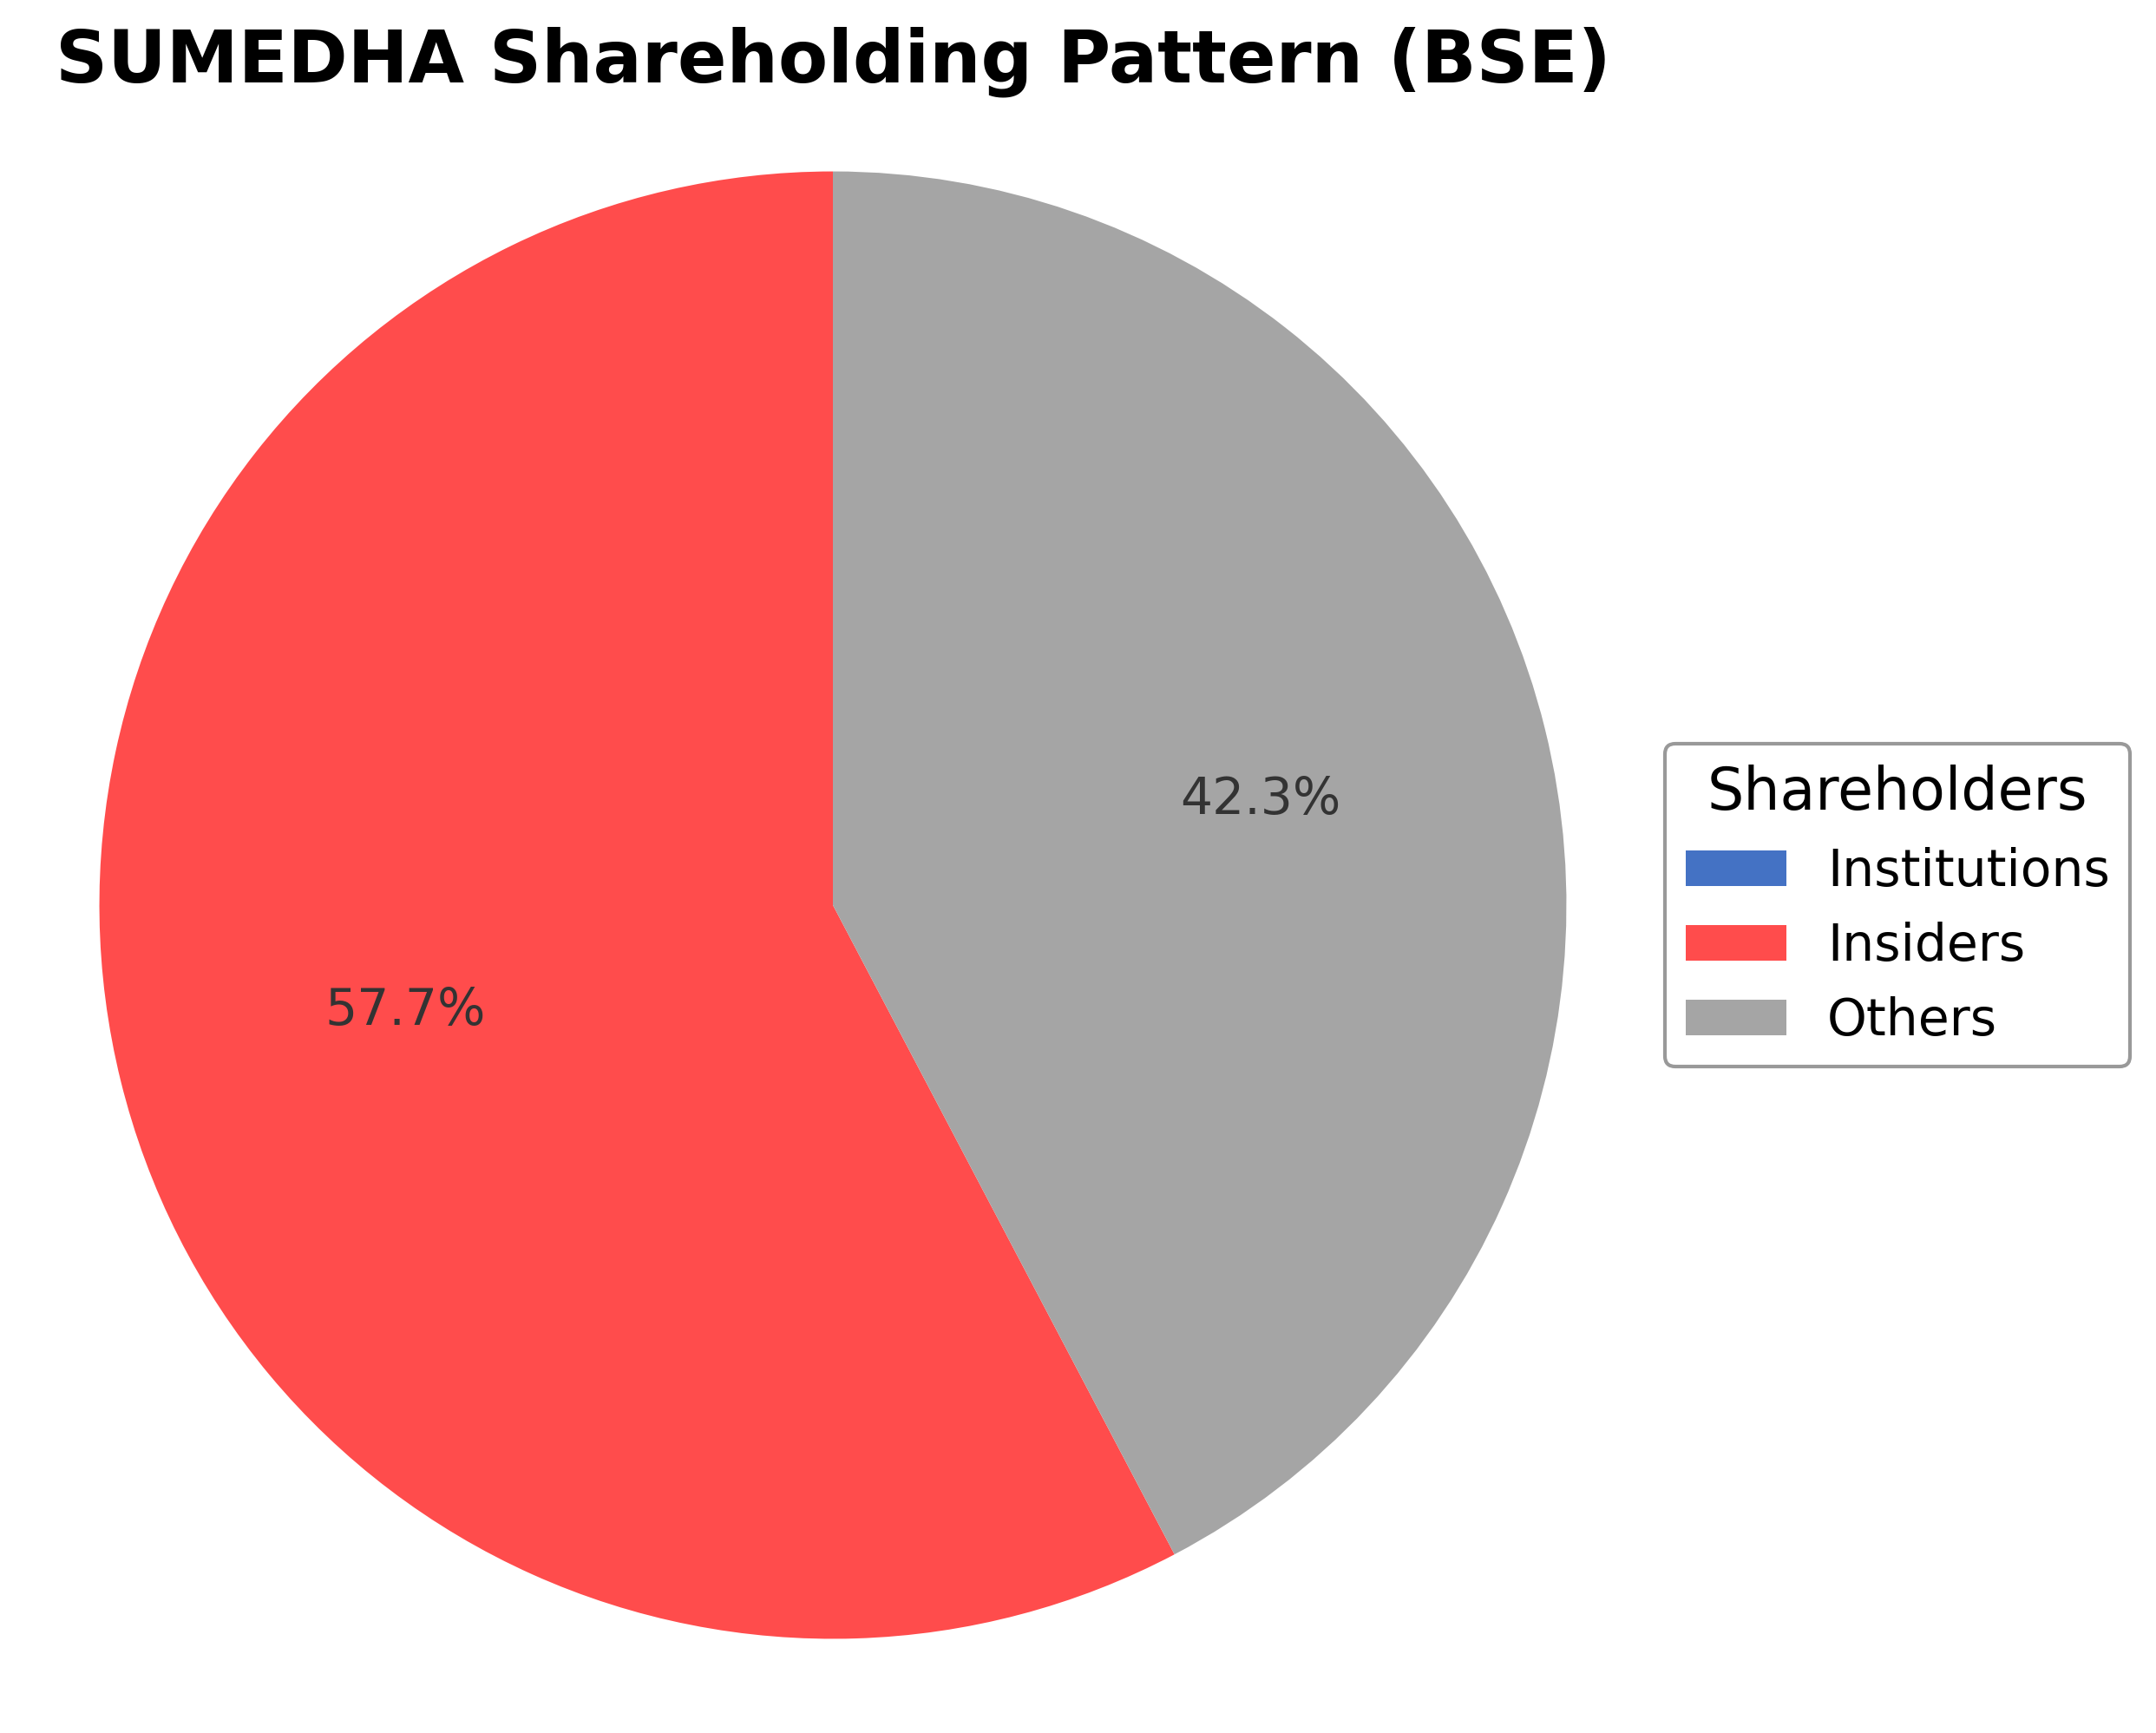
Sumedha Fiscal Services Ltd. exhibits a concentrated ownership structure with promoters holding approximately 57.71% of shares, reflecting significant insider control. Institutional investors hold no reported stake, while public shareholders account for 42.29%. Over the past 12-24 months, there have been no notable changes in institutional ownership, indicating limited external accumulation or distribution. The high promoter holding suggests strong governance influence by insiders and may impact strategic decisions. This ownership pattern is typical for mid-sized Indian financial services firms, balancing control with public market participation.
Sector and Industry Analysis
The financial services sector in India encompasses a broad range of activities including banking, non-banking financial companies (NBFCs), insurance, and capital markets. It is a significant contributor to the country’s GDP and has witnessed steady growth driven by increasing financial inclusion, digital adoption, and rising consumer credit demand. Key players range from large banks and NBFCs to smaller fiscal service providers like Sumedha Fiscal Services Ltd, operating in niche segments with varied market capitalizations.
Within the non-banking financial services industry, there is a growing emphasis on technology-driven solutions and diversification of product offerings to cater to retail and SME customers. Competitive dynamics are shaped by factors such as credit risk management, cost efficiency, and customer acquisition capabilities. Barriers to entry include regulatory compliance, capital requirements, and the need for robust risk assessment frameworks, positioning established players with strong balance sheets and operational expertise favorably.
The regulatory environment for financial services in India is governed by bodies such as the Reserve Bank of India (RBI) and the Securities and Exchange Board of India (SEBI), which enforce prudential norms, capital adequacy, and consumer protection standards. Recent regulations have focused on enhancing transparency, tightening credit norms, and promoting digital payments. These measures aim to strengthen sector stability but also require firms to invest in compliance and risk management infrastructure, impacting operational strategies and growth prospects.
Note: Analysis synthesized from industry research, market reports, and regulatory filings. Information is subject to change based on market conditions.
Financial Ratios Dashboard
Financials
Peer Analysis
| Company Name | Market Cap | P/E Ratio | P/B Ratio | EV/EBITDA | Price to CFO |
|---|---|---|---|---|---|
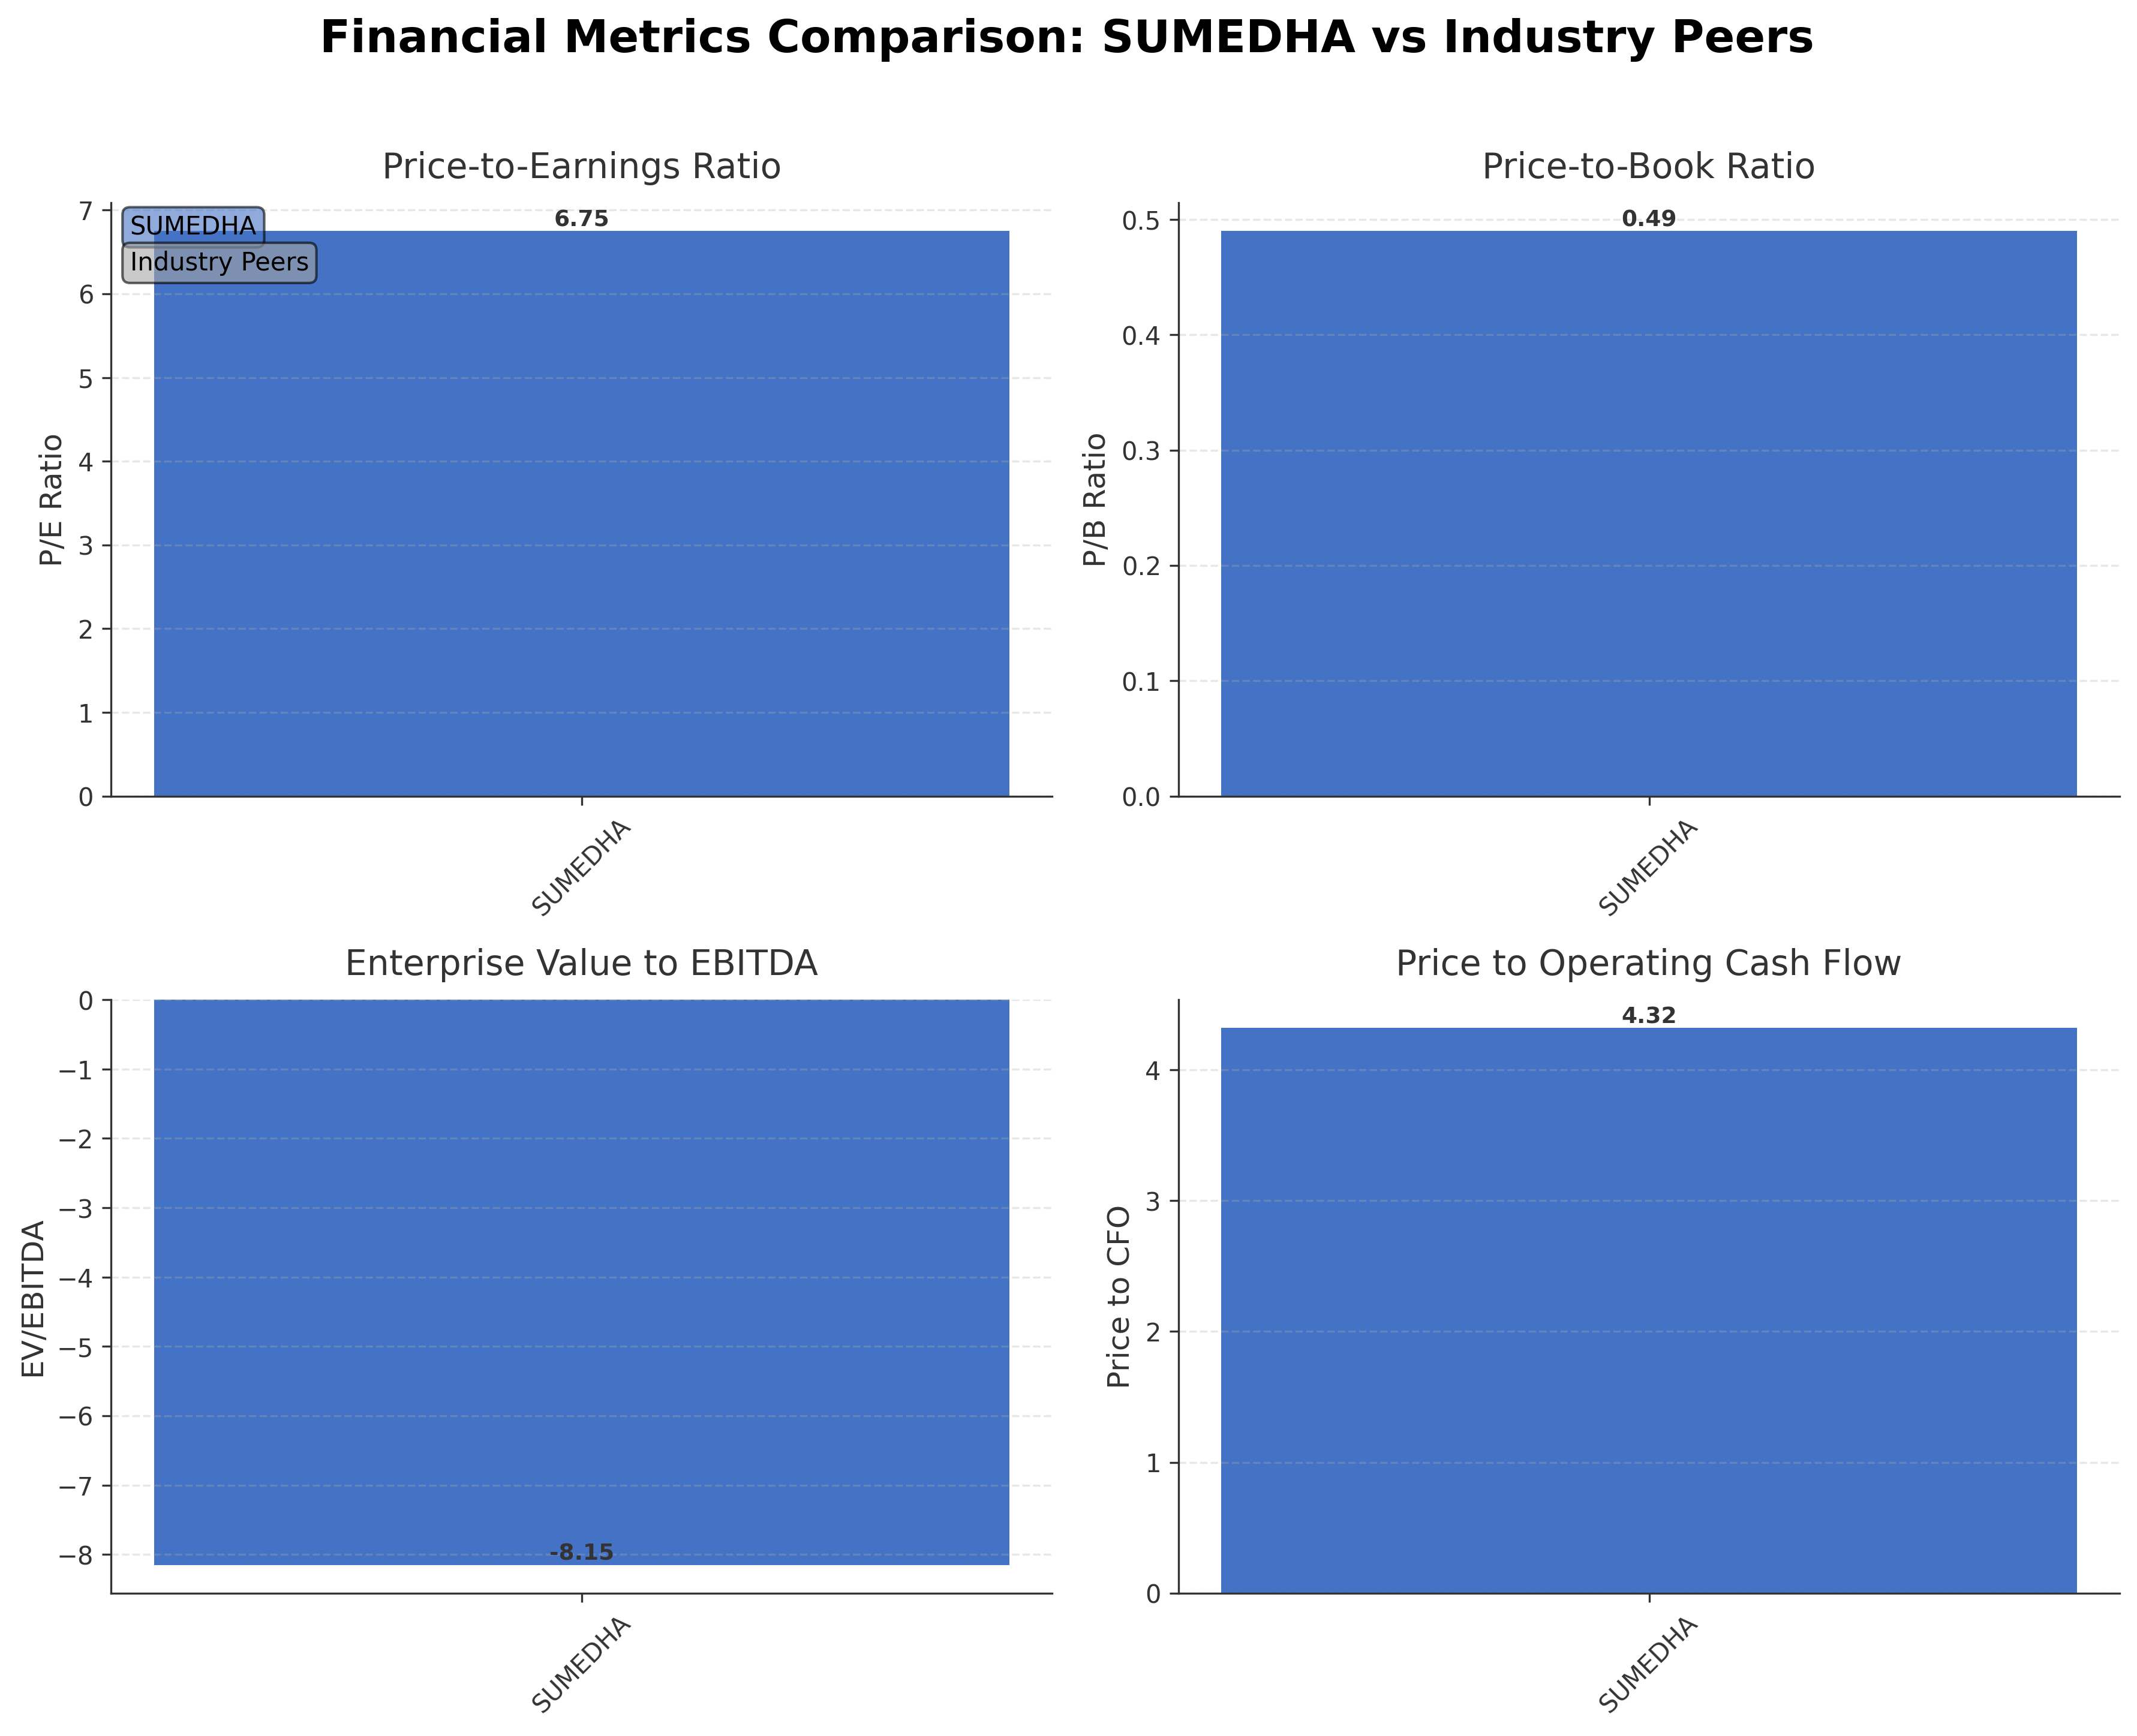
| Sumedha Fiscal Services Ltd. | ₹0.34B | 6.75 | 0.49 | -8.15 | 4.32 |
Comparison Analysis: Sumedha Fiscal Services Ltd. operates with a market capitalization of approximately ₹337 million and exhibits a low P/E ratio of 6.75 and P/B ratio of 0.49, indicating valuation below book value. The negative EV/EBITDA ratio suggests recent EBITDA challenges. Its return on equity of 11.29% reflects moderate profitability relative to its size. Due to the absence of listed peers in the dataset, direct comparative analysis is limited; however, the company’s valuation metrics imply it trades at a discount relative to typical industry standards.
Financial Metrics Comparison with Peers
Financial Statements
Comprehensive financial data including income, balance sheet, and cash flow metrics
Income Statement
| fiscal_date | 2025-03-31 | 2024-03-31 | 2023-03-31 | 2022-03-31 | 2021-03-31 |
|---|---|---|---|---|---|
| Sales | 979.24M | 932.94M | 596.85M | 561.23M | 192.71M |
| Cost Of Goods | 911.11M | 832.91M | 547.54M | 485.60M | 71.25M |
| Gross Profit | 68.13M | 100.03M | 49.31M | 75.63M | 121.46M |
| Operating Expense Selling General And Administrative | 10.40M | 4.47M | 5.41M | 3.49M | 3.21M |
| Operating Expense Other Operating Expenses | 20.29M | 20.75M | 23.84M | 15.04M | 11.07M |
| Operating Income | 24.08M | 82.09M | 14.14M | 48.37M | 98.65M |
| Non Operating Interest Income | 4.32M | 2.83M | 2.70M | 3.52M | 2.31M |
| Pretax Income | 92.11M | 91.97M | 19.47M | 50.98M | 99.56M |
| Income Tax | 19.31M | 15.45M | 4.19M | 20.37M | 13.01M |
| Net Income | 72.80M | 76.53M | 15.28M | 30.61M | 86.55M |
| Eps Basic | 9.12 | 9.58 | 1.91 | 3.83 | 10.84 |
| Eps Diluted | 9.12 | 9.58 | 1.91 | 3.83 | 10.84 |
| Basic Shares Outstanding | 7.98M | 7.98M | 7.98M | 7.98M | 7.98M |
| Diluted Shares Outstanding | 7.98M | 7.98M | 7.98M | 7.98M | 7.98M |
| Ebit | 24.08M | 91.97M | 19.48M | 51.08M | 100.14M |
| Ebitda | -27.91M | 94.22M | 29.19M | 62.42M | 108.72M |
| Net Income Continuous Operations | 92.11M | 91.97M | 19.47M | 50.98M | 99.56M |
| Minority Interests | -363.00 | -261.00 | -372.00 | -104.00 | -152.00 |
| Preferred Stock Dividends | 0.00 | 0.00 | 0.00 | 0.00 | 0.00 |
| Non Operating Interest Expense | N/A | 0.00 | 6.26K | 92.51K | 576.07K |
Source: Financial statements and regulatory filings
Balance Sheet
| fiscal_date | 2025-03-31 | 2024-03-31 | 2023-03-31 | 2022-03-31 | 2021-03-31 |
|---|---|---|---|---|---|
| Cash And Cash Equivalents | 7.07M | 13.02M | 5.49M | 15.26M | 4.73M |
| Accounts Receivable | 28.30M | 9.23M | 19.84M | 18.26M | 37.76M |
| Total Assets | 677.54M | 597.84M | 532.14M | 523.75M | 482.63M |
| Total Liabilities | 32.68M | 23.68M | 24.15M | 20.63M | 13.37M |
| Long Term Debt | N/A | N/A | 0.00 | 300.00K | 300.27K |
| Shareholders Equity | 644.85M | 574.16M | 507.99M | 503.12M | 469.26M |
Source: Financial statements and regulatory filings
Cash Flow Statement
| fiscal_date | 2025-03-31 | 2024-03-31 | 2023-03-31 | 2022-03-31 | 2021-03-31 |
|---|---|---|---|---|---|
| Operating Activities Net Income | 92.11M | 91.97M | 19.47M | 50.98M | 99.56M |
| Operating Activities Other Non Cash Items | -7.74M | -5.74M | -5.79M | -5.10M | -2.91M |
| Operating Activities Accounts Receivable | -19.88M | -4.03M | -2.11M | 13.58M | 24.60M |
| Operating Activities Other Assets Liabilities | 13.58M | -18.24M | 1.44M | -16.24M | -75.41M |
| Operating Activities Operating Cash Flow | 78.06M | 63.97M | 13.01M | 43.23M | 45.84M |
| Investing Activities Capital Expenditures | 44.05M | 4.96M | -17.05M | -9.14M | -27.12M |
| Investing Activities Purchase Of Investments | -214.13M | -133.69M | -146.42M | -82.56M | -105.50M |
| Investing Activities Sale Of Investments | 146.41M | 106.00M | 144.83M | 62.55M | 91.01M |
| Investing Activities Other Investing Activity | 3.42M | 3.03M | 2.70M | 915.00K | 420.00K |
| Investing Activities Investing Cash Flow | -20.25M | -19.71M | -15.94M | -28.25M | -41.19M |
| Financing Activities Common Dividends | -7.98M | -7.98M | -7.98M | -7.98M | -4.70M |
| Financing Activities Other Financing Charges | -132.08K | -76.13K | -158.44K | -96.94K | -106.82K |
| Financing Activities Financing Cash Flow | -8.12M | -8.06M | -8.44M | -8.65M | -5.32M |
| End Cash Position | 5.07M | 13.02M | 5.49M | 15.26M | 4.73M |
| Free Cash Flow | 12.61M | 20.11M | -7.34M | 34.13M | -3.24M |
| Financing Activities Long Term Debt Payments | N/A | 0.00 | -300.27K | -563.70K | -517.91K |
Source: Financial statements and regulatory filings
Technical Analysis
Key Insights
- Current trend shows consolidation with the stock price trading between the 50-day moving average (₹37.37) and below the 200-day moving average (₹47.22), indicating mixed momentum.
- Key support level is near ₹31, the 52-week low, while resistance is observed around ₹49, close to the 200-day moving average and recent highs.
- The price is above the 10-day and 50-day moving averages but below the 200-day moving average, suggesting short-term strength amid longer-term caution.
- Momentum indicators such as RSI and MACD are neutral to mildly positive, reflecting balanced buying and selling pressure without strong directional bias.
- Multi-timeframe analysis shows daily charts with sideways movement, weekly charts indicating consolidation, and monthly charts reflecting a longer-term downtrend from the 52-week high.
- Potential market scenarios include a breakout above the 200-day moving average for renewed upward momentum or a retest of support near ₹31 if selling pressure intensifies.
Trending News
1. Headline: Tata Consultancy Services Ltd stock (INE467B01029): recent results and share move in focus
Summary: Tata Consultancy Services has remained in the spotlight after recent quarterly results and a notable share price move on the National Stock Exchange of India, drawing renewed attention from global and US-based investors following the Indian IT major.
Sentiment: positive
2. Headline: CMS Info Systems approves ₹168 crore buyback, declares dividend; net profit falls - CNBC TV18
Summary: CMS Info Systems Ltd reported a mixed Q4 FY26 performance, with consolidated net profit declining 19% YoY to ₹79.06 crore, while revenue rose 2.2% to ₹632.93 crore. EBITDA increased 14.9% to ₹162 crore with margin expansion to 25.6%. Services revenue crossed ₹600 crore for the first ...
Sentiment: negative
3. Headline: JLR parent Tata Motors flags margin pressure from rising commodity costs | Reuters
Summary: Jaguar Land Rover parent Tata Motors Passenger Vehicles warned that rising commodity costs, exacerbated by the Iran war, will pressure margins across its lines, prompting cost cutting and a focus on more profitable high-end vehicles.
Sentiment: negative
4. Headline: VSH SWOT Analysis: Financial Resilience Amidst Market Challenges Revealed in 10-Q Filing
Summary: Understanding the strengths, weaknesses, opportunities, and threats for Vishay Intertechnology Inc.
Sentiment: negative
Summary: Q4 Results Today, 14th May 2026 Highlights: Find all the latest Q4 results 2026 updates of Allied Blenders and Distillers, Abhinav Capital Services, Akums Drugs and Pharmaceuticals, Alivus Life Sciences, Allcargo Logistics, Andhra Paper, Apollo Tyres, Ashish Polyplast, Atal Realtech, Atlas ...
Sentiment: negative
Recent Updates
News Summary
As of May 15, 2026. Sumedha Fiscal Services Ltd. held a Board meeting where key decisions included the approval for issuance of equity shares and convertible warrants on a preferential basis, signaling potential capital infusion plans. The Board also approved the issuance of a notice for an Extraordinary General Meeting to discuss these proposals. Earlier in April 2026, the company facilitated a special window for transfer and dematerialization of physical shares, enhancing shareholder convenience and regulatory compliance. Financially, the company reported a strong quarterly revenue growth of 61.1% for the quarter ending December 31, 2025, although earnings declined significantly year-over-year by 87.8%, indicating margin pressures. The company maintains a debt-free balance sheet with cash reserves of ₹11.23 crore, supporting operational flexibility.
News Sentiment
The overall sentiment from recent updates is cautiously positive, driven by proactive corporate actions such as capital raising initiatives and regulatory compliance efforts. The strong revenue growth reported contrasts with a sharp decline in earnings, reflecting operational challenges that temper enthusiasm. The company’s debt-free status and healthy cash reserves contribute positively to its financial stability. These mixed signals suggest a balanced outlook with opportunities for improvement alongside existing profitability pressures.
Source List
- https://economictimes.indiatimes.com/sumedha-fiscal-services-ltd/stocksupdate/companyid-7865.cms
- https://www.valueresearchonline.com/stocks/44651/sumedha-fiscal-services-ltd/
- https://www.indiainfoline.com/company/sumedha-fiscal-services-ltd/summary
Analytical Overview
Analysis Summary
Sumedha Fiscal Services Ltd. trades at a trailing P/E ratio of 6.75, significantly below the industry average of 33.1, indicating a potentially undervalued stock relative to peers. However, the negative EV/EBITDA ratio and low operating margin suggest caution in interpreting valuation metrics. The company’s revenue growth of 61.1% in the latest quarter demonstrates a strong top-line trajectory, although quarterly earnings declined sharply, highlighting margin and profitability challenges. Financial health is robust with zero debt and substantial cash reserves of ₹11.23 crore, supporting liquidity and operational stability. Sector-specific challenges include regulatory compliance in India’s capital markets and competitive pressures, while opportunities exist in expanding financial advisory services and capital market participation. The Indian regulatory environment and evolving consumer investment trends also influence the company’s strategic positioning.
Overall Business and Market Assessment
Supporting Factors: a debt-free balance sheet, positive cash flow generation, and significant insider ownership aligning management interests with shareholders
Risk Factors: earnings volatility, competitive dynamics in financial services, and regulatory changes in India
SWOT Analysis
Strengths
- Debt-free balance sheet with strong cash reserves enhances financial stability.
- Significant insider ownership (57.7%) aligns management and shareholder interests.
- Diversified financial services portfolio including investment banking and capital markets.
- Strong quarterly revenue growth of 61.1% indicates robust top-line momentum.
Weaknesses
- Low operating margin of 1.25% limits profitability.
- Negative EV/EBITDA ratio reflects recent EBITDA challenges.
- Quarterly earnings declined 87.8% year-over-year indicating margin pressures.
- Limited institutional investor participation may restrict liquidity.
Opportunities
- Potential capital raising through preferential issuance of equity and convertible warrants.
- Expansion in financial advisory and wealth management services in India’s growing market.
- Increasing demand for digital platforms for mutual fund transactions.
- Favorable regulatory environment supporting capital market development.
Threats
- Competitive pressures in India’s financial services sector.
- Regulatory changes impacting capital market operations and compliance costs.
- Macroeconomic volatility affecting client investment and capital raising activities.
- Market sentiment volatility due to earnings fluctuations.
Company Description
Sumedha Fiscal Services Ltd. is a diversified financial services company based in India, offering a comprehensive suite of financial solutions to meet varying client needs. Its primary function is to provide financial advisory services that include capital market operations, corporate financial advisory, and investment banking services. The company plays a significant role in facilitating capital formation and growth for businesses by assisting in mergers and acquisitions, debt syndication, and equity placements. Sumedha Fiscal Services Ltd. is deeply embedded in the financial eco-system, bridging the gap between investors and capital-requiring entities. With its expertise across sectors such as real estate, manufacturing, and services, Sumedha continues to support economic growth by enabling efficient capital distribution and providing strategic advice that helps businesses optimize their financial strategies. This positions Sumedha as a vital player in India's financial sector, contributing to market robustness and corporate financial advancements.