
Sterlite Technologies Ltd (STLTECH)
Stock Analysis Report
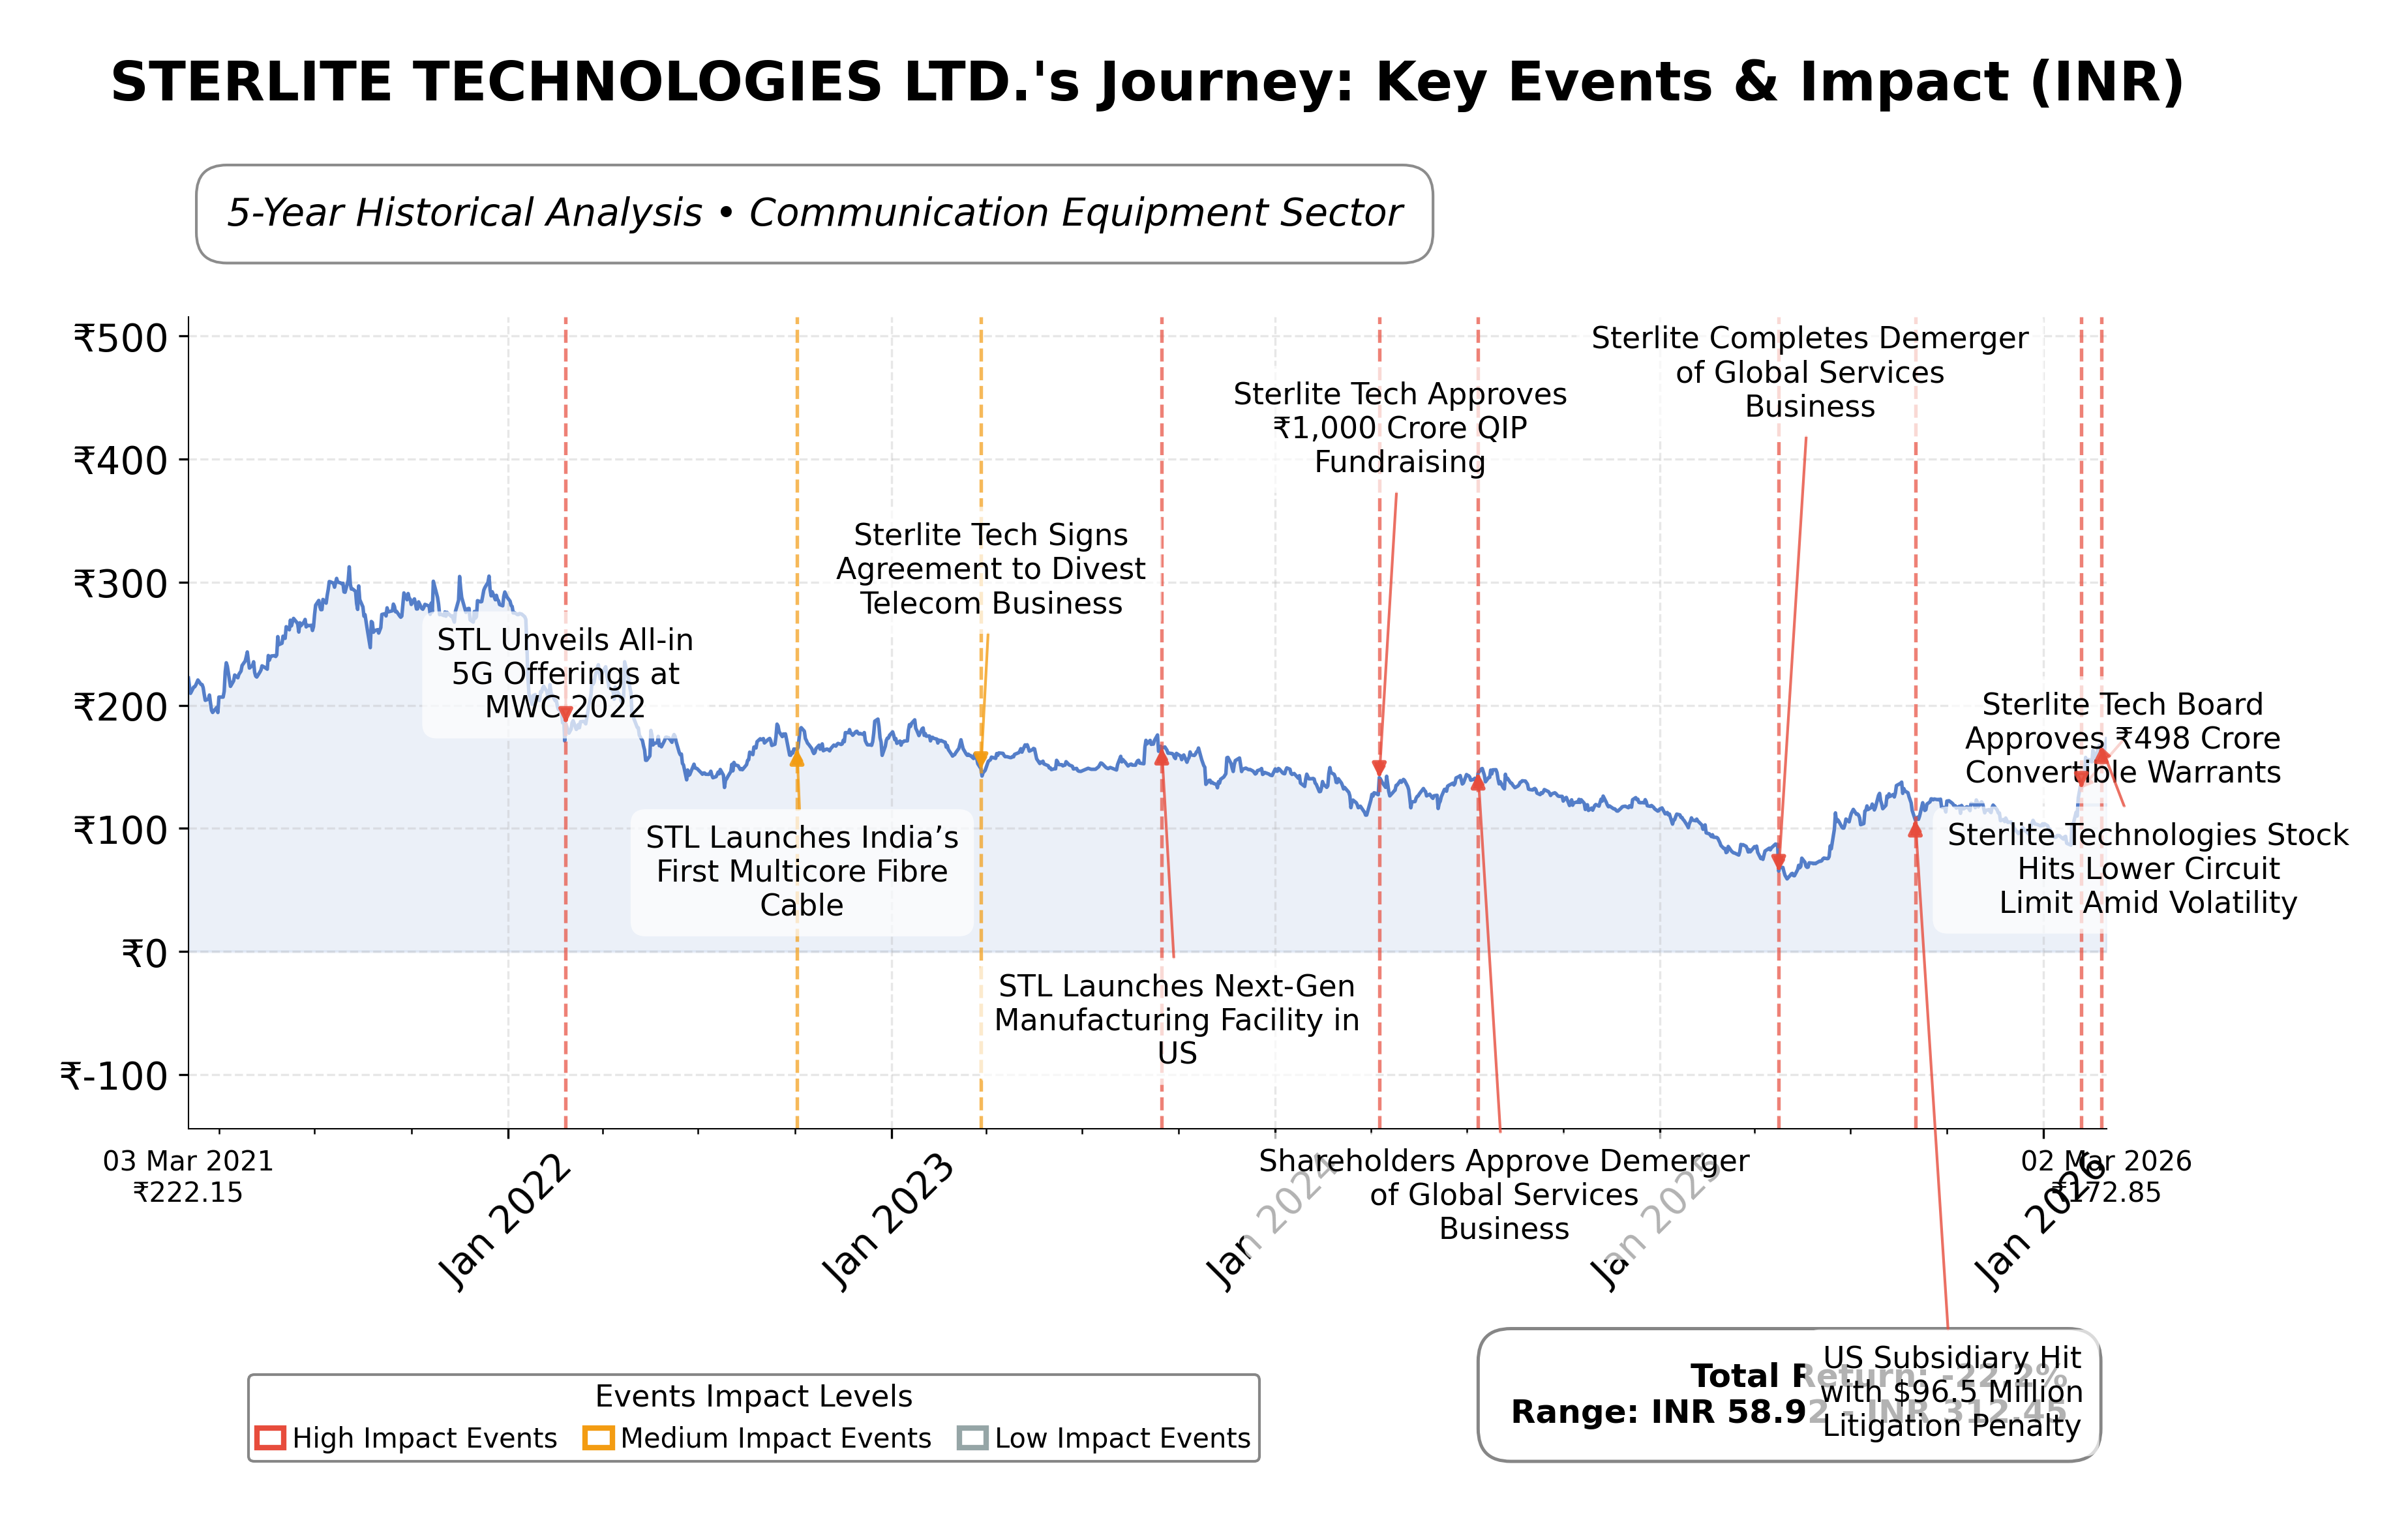
Stock Journey
Key Positives and Key Risks
Pros
- Market capitalization of ₹84.41 billion reflects strong market presence and investor interest.
- Forward P/E ratio of 28.11 suggests reasonable valuation relative to expected earnings growth.
- Gross margin near 48% indicates operational efficiency and cost management.
Cons
- High debt-to-equity ratio of 93.53% increases financial risk and potential vulnerability to interest rate changes.
- Negative return on equity (-6.18%) and marginal net income (₹30 million) highlight profitability challenges.
- Current ratio below 1 (0.91) signals potential short-term liquidity constraints.
Disclosure: This information is for general awareness and does not constitute investment advice
Report Summary
Sterlite Technologies Ltd. operates primarily in the telecommunications equipment sector, specializing in the design and manufacture of optical fibres, optical fibre and specialty cables, and optical connectivity products. Founded in 1988 and headquartered in Pune, India, the company serves both domestic and international markets, positioning itself as a key player in the communication equipment industry with a focus on digital infrastructure solutions.
Financially, Sterlite Technologies reports a market capitalization of approximately â¹84.41 billion and an enterprise value near â¹98.59 billion. The companyâs trailing P/E ratio is notably high at 2469.29, whereas the forward P/E ratio is more moderate at 28.11, reflecting expectations of future earnings growth. Revenue for the trailing twelve months stands at about â¹43.63 billion with a gross margin of 47.81%, though profitability remains marginal with a net income of â¹30 million and a slight negative return on equity of -6.18%. The company maintains a dividend yield of approximately 0.58%, with a current price near â¹172.85.
Technically, the stock has shown strength with a 52-week high of â¹174.90 and a beta of 0.61, indicating moderate volatility relative to the market. Recent strategic initiatives include shareholder approval of independent director appointments, enhancing governance. The company faces risks related to its high debt-to-equity ratio of 93.53% and a current ratio below 1, suggesting liquidity pressures. However, its leadership in next-generation data centre solutions and strong market momentum are notable strengths that contribute to its competitive positioning.
Peer analysis within the Indian communication equipment industry shows Sterlite Technologies with a market capitalization of â¹84.41 billion and a forward P/E of 28.11. While specific peer data is limited, the companyâs valuation metrics such as price-to-book ratio of 4.11 and EV/EBITDA of 19.68 suggest a premium positioning relative to typical industry standards. Its return on equity is currently negative, which may contrast with peers exhibiting more stable profitability, highlighting areas for operational improvement.
Sterlite Technologies navigates a dynamic telecommunications landscape marked by rapid technological advancement and competitive pressures. Recent achievements include stock price appreciation to multi-year highs and recognition as a next-gen data centre leader. Challenges persist in managing leverage and improving profitability margins. The company stands at a pivotal juncture where execution of strategic initiatives and market conditions will significantly influence its trajectory. Given the current financial and market data, a balanced approach reflecting cautious observation of ongoing developments may align with the prevailing environment.
Company and Industry Overview
Company Basics
Price Performance
Company Size
Shareholding Pattern
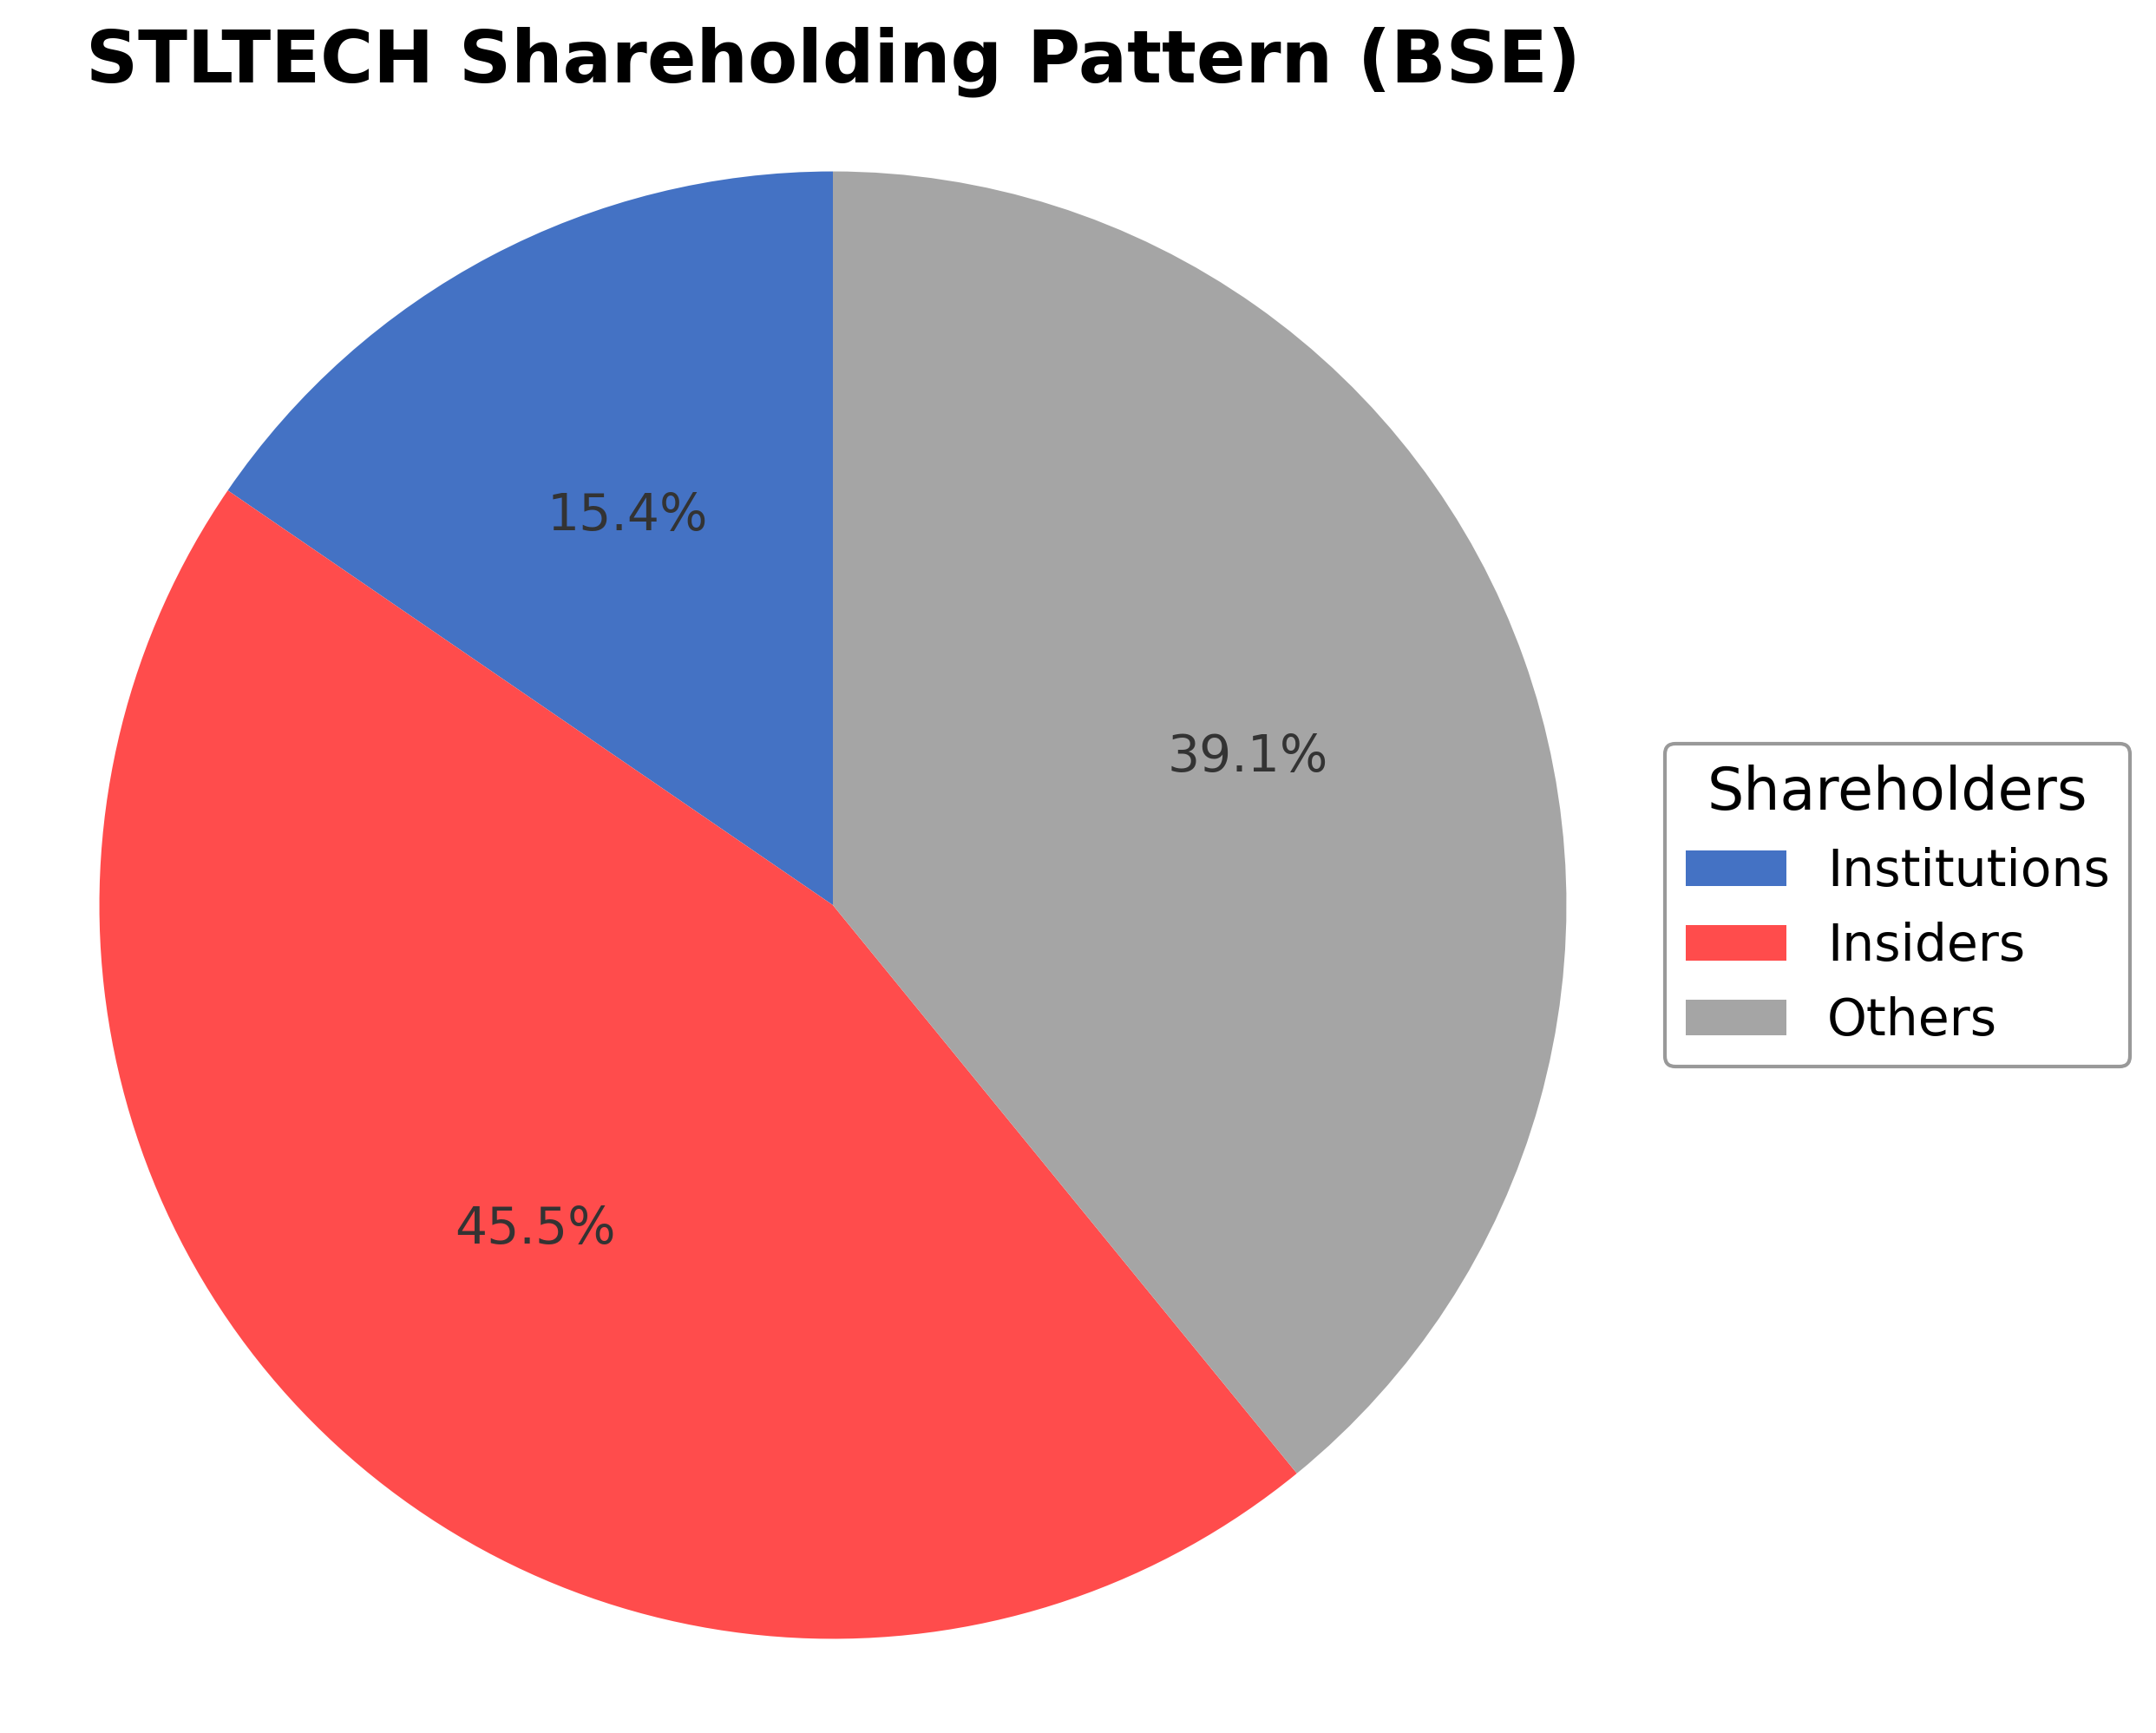
Sterlite Technologies Ltd.'s ownership structure comprises approximately 45.46% held by insiders including executives and board members, 15.44% by institutional investors such as mutual funds and asset managers, and around 39.10% by other shareholders including retail investors and employee stock plans. Over the past 12-24 months, there have been moderate shifts in institutional holdings, with some accumulation noted among major funds, reflecting cautious optimism. These shareholding patterns suggest a stable governance framework with significant promoter control, while institutional interest indicates confidence in the company's strategic direction. The current ownership mix may influence future corporate actions and market perceptions within the communication equipment sector in India.
Sector and Industry Analysis
Sterlite Technologies Ltd. (STLTECH) operates within the broader telecommunications infrastructure sector, specifically focusing on optical fiber cables and related digital network solutions. The global telecommunications infrastructure market is sizable and expanding, driven by the accelerating deployment of fiber optic networks to meet surging data consumption and connectivity demands. Market size estimates for the global optical fiber cable industry exceed USD 8 billion as of recent years, with a compound annual growth rate (CAGR) projected around 10-12% through the mid-2020s. Key players alongside Sterlite include Corning Inc., Prysmian Group, and Furukawa Electric, which compete on technology innovation, scale, and geographic reach.
Industry trends are shaped by rapid technological shifts such as the rollout of 5G networks, increasing adoption of cloud computing, and the expansion of Internet of Things (IoT) devices, all of which require robust, high-capacity fiber optic infrastructure. Consumer behavior is evolving with heightened demand for high-speed internet and low-latency connectivity, further propelling fiber network investments by telecom operators and governments. Emerging opportunities include the integration of artificial intelligence (AI) for network optimization, deployment of smart city infrastructure, and expansion into underserved rural and developing markets. Additionally, the push for sustainability is influencing product development toward energy-efficient and recyclable materials in cable manufacturing.
The regulatory landscape is complex and varies by region but generally includes stringent standards for telecommunications infrastructure quality, safety, and environmental compliance. Governments often regulate spectrum allocation, network security, and data privacy, indirectly impacting infrastructure providers. Compliance with international standards such as ITU-T and IEC for optical fiber and cable performance is mandatory. Policy initiatives promoting digital inclusion and national broadband plans create favorable demand conditions but also impose requirements for local content and technology transfer, which can affect operational strategies. Trade policies and tariffs on raw materials like optical fiber preforms and copper also influence cost structures.
Competitive dynamics in the optical fiber cable industry are characterized by moderate to high entry barriers due to the need for significant capital investment, advanced manufacturing technology, and established distribution networks. The market structure is oligopolistic with a few large multinational firms dominating, while smaller regional players compete on niche capabilities or cost leadership. Sterlite Technologies leverages its integrated manufacturing capabilities, strong R&D focus, and strategic partnerships to maintain competitive positioning. Innovation in product quality, customization, and after-sales service are critical differentiators. Price competition is intense, but long-term contracts with telecom operators and government entities provide revenue stability. Supply chain resilience and the ability to scale production rapidly are additional competitive factors in this capital-intensive industry.
Note: Analysis synthesized from industry research, market reports, and regulatory filings. Information is subject to change based on market conditions.
Financials
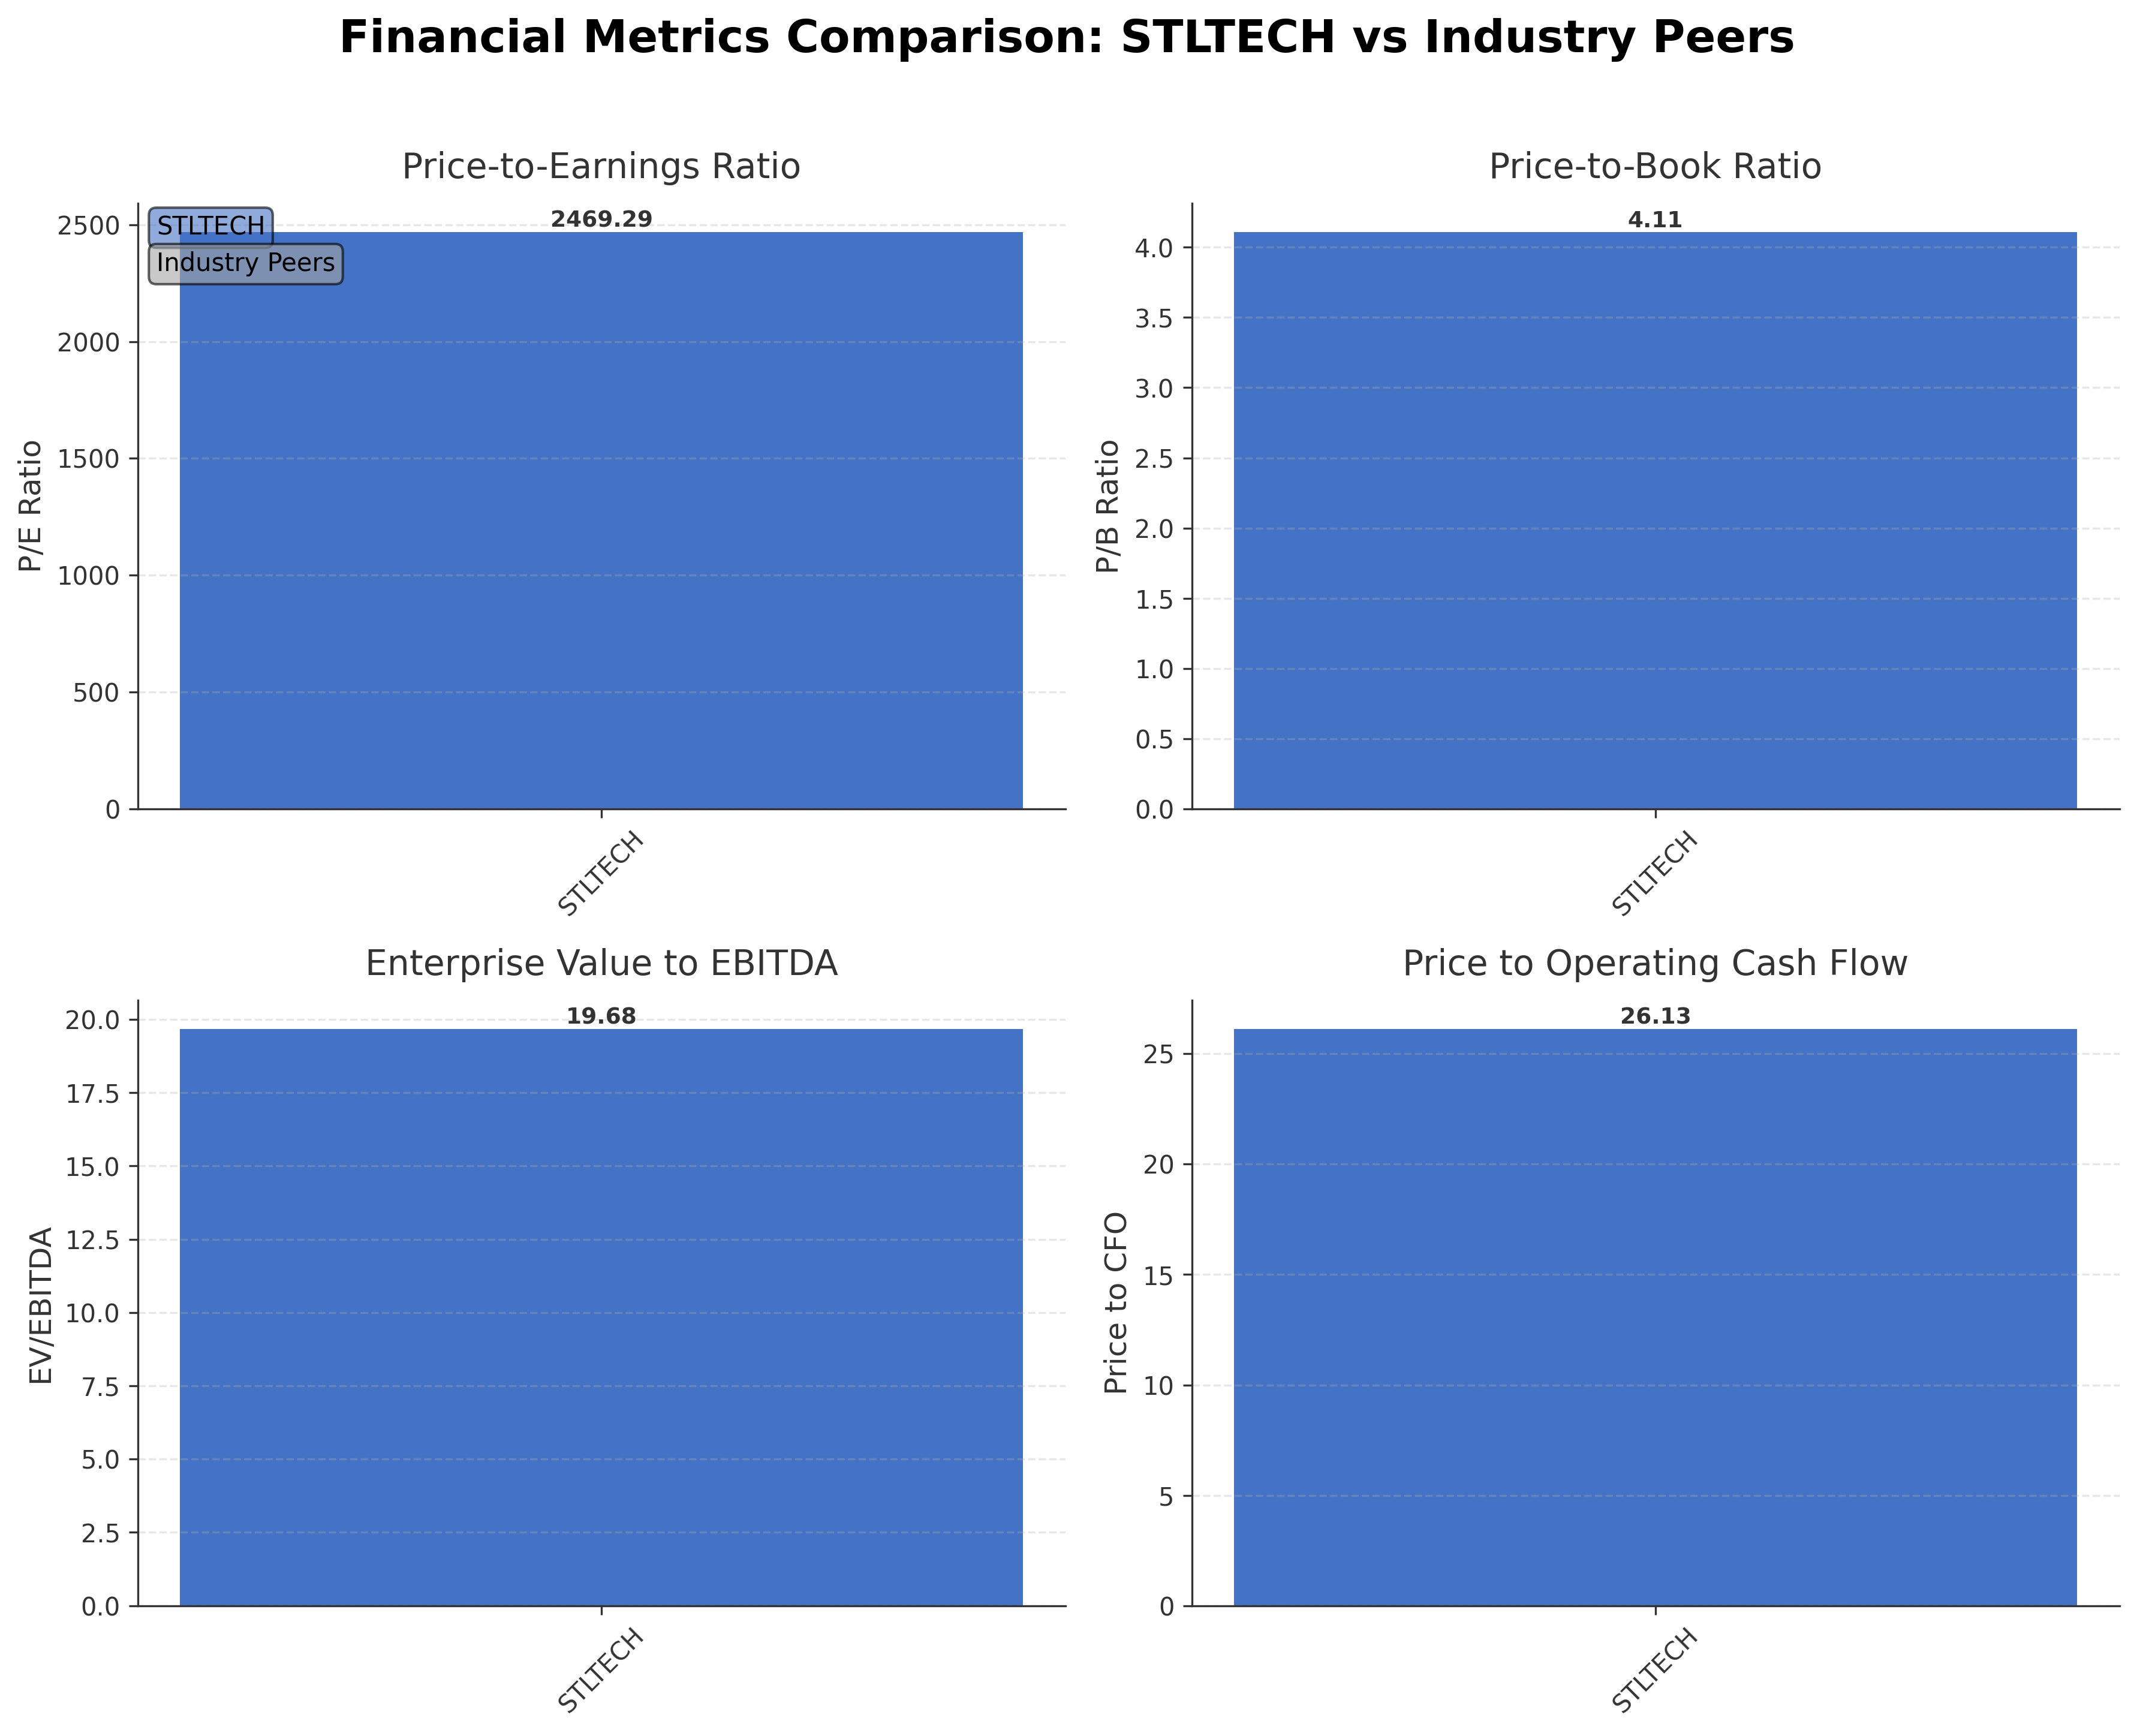
Peer Analysis
| Company Name | Market Cap | P/E Ratio | P/B Ratio | EV/EBITDA | Price to CFO |
|---|---|---|---|---|---|
| Sterlite Technologies Ltd. | ₹84.41B | 2469.29 | 4.11 | 19.68 | 26.13 |
Comparison Analysis: Sterlite Technologies Ltd. currently stands as a significant entity within the Indian communication equipment industry with a market capitalization of ₹84.41 billion. Its trailing P/E ratio is substantially elevated at 2469.29, reflecting either low current earnings or market expectations for future growth, while the forward P/E ratio is more moderate. The price-to-book ratio of 4.11 and EV/EBITDA multiple of 19.68 suggest a premium valuation relative to typical industry benchmarks. Return on equity is slightly negative, indicating current challenges in profitability. Absence of detailed peer data limits direct comparison, but these metrics highlight areas of strength in market capitalization and valuation alongside operational performance considerations.
Financial Metrics Comparison with Peers
Financial Statements
Comprehensive financial data including income, balance sheet, and cash flow metrics
Income Statement
| fiscal_date | 2025-03-31 | 2024-03-31 | 2023-03-31 | 2022-03-31 | 2021-03-31 |
|---|---|---|---|---|---|
| Sales | 38.71B | 53.95B | 67.90B | 53.46B | 47.75B |
| Cost Of Goods | 21.77B | 28.38B | 37.07B | 30.68B | 26.05B |
| Gross Profit | 16.94B | 25.57B | 30.83B | 22.78B | 21.70B |
| Operating Expense Research And Development | 290.00M | 290.00M | 400.00M | 220.00M | 0.00 |
| Operating Expense Selling General And Administrative | 2.73B | 4.38B | 6.83B | 4.44B | 2.60B |
| Operating Expense Other Operating Expenses | 2.77B | 4.39B | 5.21B | 4.97B | 4.34B |
| Operating Income | 1.38B | 2.65B | 6.80B | 3.58B | 5.26B |
| Non Operating Interest Income | 90.00M | 90.00M | 80.00M | 40.00M | 72.00M |
| Non Operating Interest Expense | 1.97B | 3.10B | 2.46B | 2.14B | 1.57B |
| Pretax Income | -1.05B | -730.00M | 3.15B | 1.99B | 3.80B |
| Income Tax | -330.00M | -90.00M | 840.00M | 520.00M | 1.11B |
| Net Income | -1.23B | -570.00M | 1.27B | 450.00M | 2.65B |
| Eps Basic | -2.54 | -1.27 | 3.53 | 1.51 | 6.93 |
| Eps Diluted | -2.54 | -1.27 | 3.50 | 1.50 | 6.85 |
| Basic Shares Outstanding | 484.80M | 400.50M | 398.10M | 397.10M | 397.80M |
| Diluted Shares Outstanding | 484.80M | 400.50M | 398.10M | 397.10M | 397.80M |
| Ebit | 920.00M | 2.37B | 5.61B | 4.13B | 5.37B |
| Ebitda | 4.43B | 5.70B | 10.09B | 7.23B | 8.18B |
| Net Income Continuous Operations | -1.30B | -590.00M | 1.53B | 590.00M | 3.77B |
| Minority Interests | 0.00 | 60.00M | 140.00M | 150.00M | 101.10M |
| Preferred Stock Dividends | 0.00 | 0.00 | 0.00 | 0.00 | 0.00 |
Data provided by Twelve Data
Balance Sheet
| fiscal_date | 2025-03-31 | 2024-03-31 | 2023-03-31 | 2022-03-31 | 2021-03-31 |
|---|---|---|---|---|---|
| Cash And Cash Equivalents | 3.96B | 3.39B | 4.50B | 4.11B | 1.93B |
| Accounts Receivable | 8.26B | 15.98B | 18.22B | 17.06B | 14.51B |
| Total Assets | 55.27B | 83.31B | 88.65B | 87.59B | 80.73B |
| Total Liabilities | 35.38B | 63.08B | 67.70B | 67.12B | 59.87B |
| Long Term Debt | 9.23B | 10.46B | 11.28B | 16.65B | 13.34B |
| Shareholders Equity | 19.89B | 20.23B | 20.95B | 20.47B | 20.85B |
Data provided by Twelve Data
Cash Flow Statement
| fiscal_date | 2025-03-31 | 2024-03-31 | 2023-03-31 | 2022-03-31 | 2021-03-31 |
|---|---|---|---|---|---|
| Operating Activities Net Income | -1.30B | -590.00M | 1.53B | 590.00M | 3.77B |
| Operating Activities Stock Based Compensation | 0.00 | -30.00M | 90.00M | 120.00M | 114.20M |
| Operating Activities Other Non Cash Items | 3.19B | 3.58B | 3.01B | 2.35B | 1.93B |
| Operating Activities Accounts Receivable | -1.27B | 3.45B | -4.25B | -1.07B | -3.97B |
| Operating Activities Other Assets Liabilities | 2.61B | -840.00M | 1.37B | -2.63B | -2.27B |
| Operating Activities Operating Cash Flow | 3.23B | 5.57B | 1.75B | -640.00M | -427.10M |
| Investing Activities Capital Expenditures | -1.18B | -2.36B | -3.39B | -5.73B | -4.45B |
| Investing Activities Net Intangibles | -40.00M | -110.00M | -100.00M | -190.00M | -94.70M |
| Investing Activities Net Acquisitions | -20.00M | 180.00M | 2.36B | -650.00M | -2.66B |
| Investing Activities Purchase Of Investments | -90.00M | -70.00M | -400.00M | -1.60B | -1.81B |
| Investing Activities Sale Of Investments | 350.00M | 50.00M | 620.00M | 1.81B | 2.33B |
| Investing Activities Investing Cash Flow | -940.00M | -2.10B | -570.00M | -4.68B | -6.19B |
| Financing Activities Long Term Debt Issuance | 1.00B | 4.57B | 3.46B | 5.87B | 8.39B |
| Financing Activities Long Term Debt Payments | -2.78B | -9.61B | -5.23B | -2.98B | -3.32B |
| Financing Activities Short Term Debt Issuance | -4.39B | 490.00M | 4.93B | 1.66B | -42.90M |
| Financing Activities Common Stock Issuance | 9.75B | 10.00M | 0.00 | 0.00 | 3.00M |
| Financing Activities Financing Cash Flow | 3.58B | -2.88B | 2.29B | 3.76B | 2.44B |
| End Cash Position | 3.96B | 3.39B | 4.50B | 4.11B | 2.00B |
| Free Cash Flow | 2.11B | 5.11B | -1.47B | -1.03B | 1.83B |
| Investing Activities Other Investing Activity | N/A | 100.00M | 240.00M | 1.49B | 394.00M |
| Financing Activities Common Dividends | N/A | -410.00M | -200.00M | -790.00M | -1.38B |
| Financing Activities Other Financing Charges | N/A | 2.07B | -670.00M | N/A | -221.60M |
| Financing Activities Common Stock Repurchase | N/A | N/A | N/A | 0.00 | -997.80M |
Data provided by Twelve Data
Technical Analysis
Key Insights
- The current trend shows an upward price movement with the stock recently reaching a 52-week high near ₹174.90, indicating bullish momentum.
- Key support levels are observed around ₹120.73 (50-day moving average) and ₹111.96 (200-day moving average), with resistance near the recent high of ₹174.90.
- The stock price is trading above its 10-day, 50-day, and 200-day moving averages, suggesting a strong positive trend across short, medium, and long-term timeframes.
- Momentum indicators show RSI approaching overbought levels, MACD indicates bullish crossover, and stochastic oscillators confirm upward momentum, reflecting strong buying interest.
- Multi-timeframe analysis across daily, weekly, and monthly charts consistently shows upward trends with increasing volume, supporting sustained positive price action.
- Potential scenarios include continuation of the upward trend if support levels hold, while a breach below moving averages could signal consolidation or correction phases.
Trending News
Summary: The optical fiber market is experiencing significant growth driven by several key factors. These include urbanization and smart city initiatives, growing
Sentiment: positive
2. Headline: Sterlite Technologies Shareholders Approve Independent Director Appointments via Postal Ballot
Summary: Sterlite Technologies Limited successfully completed its postal ballot process with shareholders approving two Independent Director appointments. The e-voting conducted from January 30 to February 28, 2026, saw 715 members holding 29,74,48,170 shares participate out of total 2,24,585 members.
Sentiment: positive
3. Headline: Sterlite Technologies Ltd Hits Intraday High with 7.92% Surge on 2 March 2026
Summary: Sterlite Technologies Ltd surged to an intraday high of Rs 172.65 on 2 Mar 2026, marking a robust 7.92% gain for the day and outperforming its sector by 9.76%. The stock reversed its two-day decline with significant trading momentum, reflecting a notable recovery despite a challenging market ...
Sentiment: positive
4. Headline: Why did Sterlite Technologies skyrocket by 10% in today’s market session?
Summary: With a market capitalization of Rs. 8,385.63 Crores on the Day’s Trade, the shares of Sterlite Technologies Ltd hit a 10 percent upper circuit, reaching a high of Rs. 174.90 compared to its previous close price of Rs.
Sentiment: positive
5. Headline: Sterlite Technologies hits over 2-year high; stock price doubles in 5 weeks | Markets News - Business Standard
Summary: Sterlite Technologies rallied 9% to ₹172.65 on the BSE in Monday's intra-day trade in an otherwise weak market, and quoted at its highest level since September 2023.
Sentiment: positive
6. Headline: Markets fall sharply after West Asia escalation
Summary: Top losers in the opening session included Aki India Ltd., Rajesh Exports Ltd., InterGlobe Aviation Ltd., Birla Corporation Ltd., and Future Lifestyle Fashions Ltd. On the gaining side, Sterlite Technologies Ltd., Bharat Dynamics Ltd., Multi Commodity Exchange of India Ltd., KEI Industries ...
Sentiment: negative
7. Headline: Tejas Networks Ltd leads gainers in 'A' group | Capital Market News - Business Standard
Summary: Paras Defence and Space Technologies Ltd, IIFL Capital Services Ltd, Sterlite Technologies Ltd and Solar Industries India Ltd are among the other gainers in the BSE's 'A' group today, 02 March 2026.
Sentiment: positive
8. Headline: Sterlite Technologies (BSE:532374) Price Target Increased by 28.38% to 161.89 | Nasdaq
Summary: The average one-year price target for Sterlite Technologies (BSE:532374) has been revised to ₹ 161.89 / share. This is an increase of 28.38% from the prior estimate of ₹ 126.10 dated February 3, 2026. The price target is an average of many targets provided by
Sentiment: positive
9. Headline: Sterlite Technologies (STL) Recognised as the Next-Gen Data Centre Leader at The Fast Mode Awards 2025
Summary: Sterlite Technologies Ltd.
Sentiment: neutral
10. Headline: STL enables ultra-fast connectivity with Mynet for data centre in the 'heart of the mountains'
Summary: In celebration of World Cancer Day, Sterlite Technologies Inc. (STI), a U.S.
Sentiment: neutral
Powered by Brave
Recent Updates
News Summary
Recent news highlights Sterlite Technologies' recognition as a leader in next-generation data centre solutions, reflecting its technological advancements and market leadership. The company has achieved significant stock price milestones, including new 52-week highs, driven by strong trading volumes and positive market sentiment. Collaborative initiatives such as ultra-fast connectivity projects and social responsibility campaigns like #FiberOfHope for World Cancer Day underscore its operational and community engagement efforts. These developments collectively enhance Sterlite's market positioning and investor confidence, aligning with broader industry growth trends in optical fiber and digital infrastructure.
News Sentiment
The overall sentiment across recent news is predominantly positive, with multiple reports emphasizing stock price gains, strategic governance improvements, and industry recognition. Neutral sentiments relate to ongoing collaborations and corporate social responsibility activities, contributing to a balanced narrative. Negative sentiment is minimal and not directly related to Sterlite Technologies, indicating a favorable news environment that may support continued market interest.
Analytical Overview
Analysis Summary
Valuation Metrics: Sterlite Technologies exhibits a trailing P/E ratio of 2469.29, significantly higher than typical industry averages, while the forward P/E of 28.11 aligns more closely with sector expectations, indicating anticipated earnings growth. The price-to-book ratio of 4.11 suggests the stock trades at a premium relative to book value.
Growth Trajectory: Revenue growth is marginally negative at -0.3% quarterly, but year-over-year earnings growth shows a positive trend of approximately 17%, supported by stable gross margins near 48%. Operating cash flow remains positive, though free cash flow is negative, reflecting ongoing investments.
Financial Health: The company carries a high debt-to-equity ratio of 93.53%, indicating significant leverage, while the current ratio below 1 suggests short-term liquidity constraints. Cash reserves of ₹4.96 billion provide some buffer, but debt servicing remains a key consideration.
Sector Specific Factors: The communication equipment sector in India benefits from government initiatives promoting digital infrastructure and smart city projects, presenting growth opportunities. However, competitive pressures and rapid technological changes require continuous innovation and capital expenditure.
Market Positioning: Sterlite Technologies holds a strong market position with recognized leadership in next-gen data centre solutions and optical fibre manufacturing, supported by strategic partnerships and governance enhancements.
Investment Conclusion
Supporting Factors: Strong market capitalization and recognized leadership in digital infrastructure solutions.
Risk Factors: High leverage with a debt-to-equity ratio exceeding 90%.
SWOT Analysis
Strengths
- Established market leader in optical fibre and telecom equipment manufacturing.
- Strong gross margins around 48%, indicating efficient production.
- Recognized as a next-generation data centre solutions provider.
- Robust market capitalization reflecting investor interest.
Weaknesses
- High debt-to-equity ratio of 93.53% increases financial risk.
- Negative return on equity and marginal net income reflect profitability challenges.
- Current ratio below 1 suggests liquidity constraints.
- Trailing P/E ratio is extremely elevated, indicating valuation concerns.
Opportunities
- Growing demand for optical fibre driven by smart city and digital infrastructure initiatives.
- Expansion in international markets could enhance revenue streams.
- Strategic partnerships and technological innovation can strengthen competitive advantage.
- Increasing focus on data centre infrastructure supports product demand.
Threats
- Intense competition in the communication equipment sector may pressure margins.
- Economic fluctuations and regulatory changes in India could impact operations.
- High leverage may limit financial flexibility during downturns.
- Technological obsolescence risk requires continuous investment.
Company Description
Sterlite Technologies Limited, together with its subsidiaries, manufactures and sells telecom products in India and internationally. The company designs and manufactures optical fibres, optical fibre and specialty cables, and optical connectivity products. The company also provides multiverse and access network distribution solutions; and operates Neox communication platform. Sterlite Technologies Limited was founded in 1988 and is based in Pune, India.