
State Bank of India (SBIN)
Stock Analysis Report
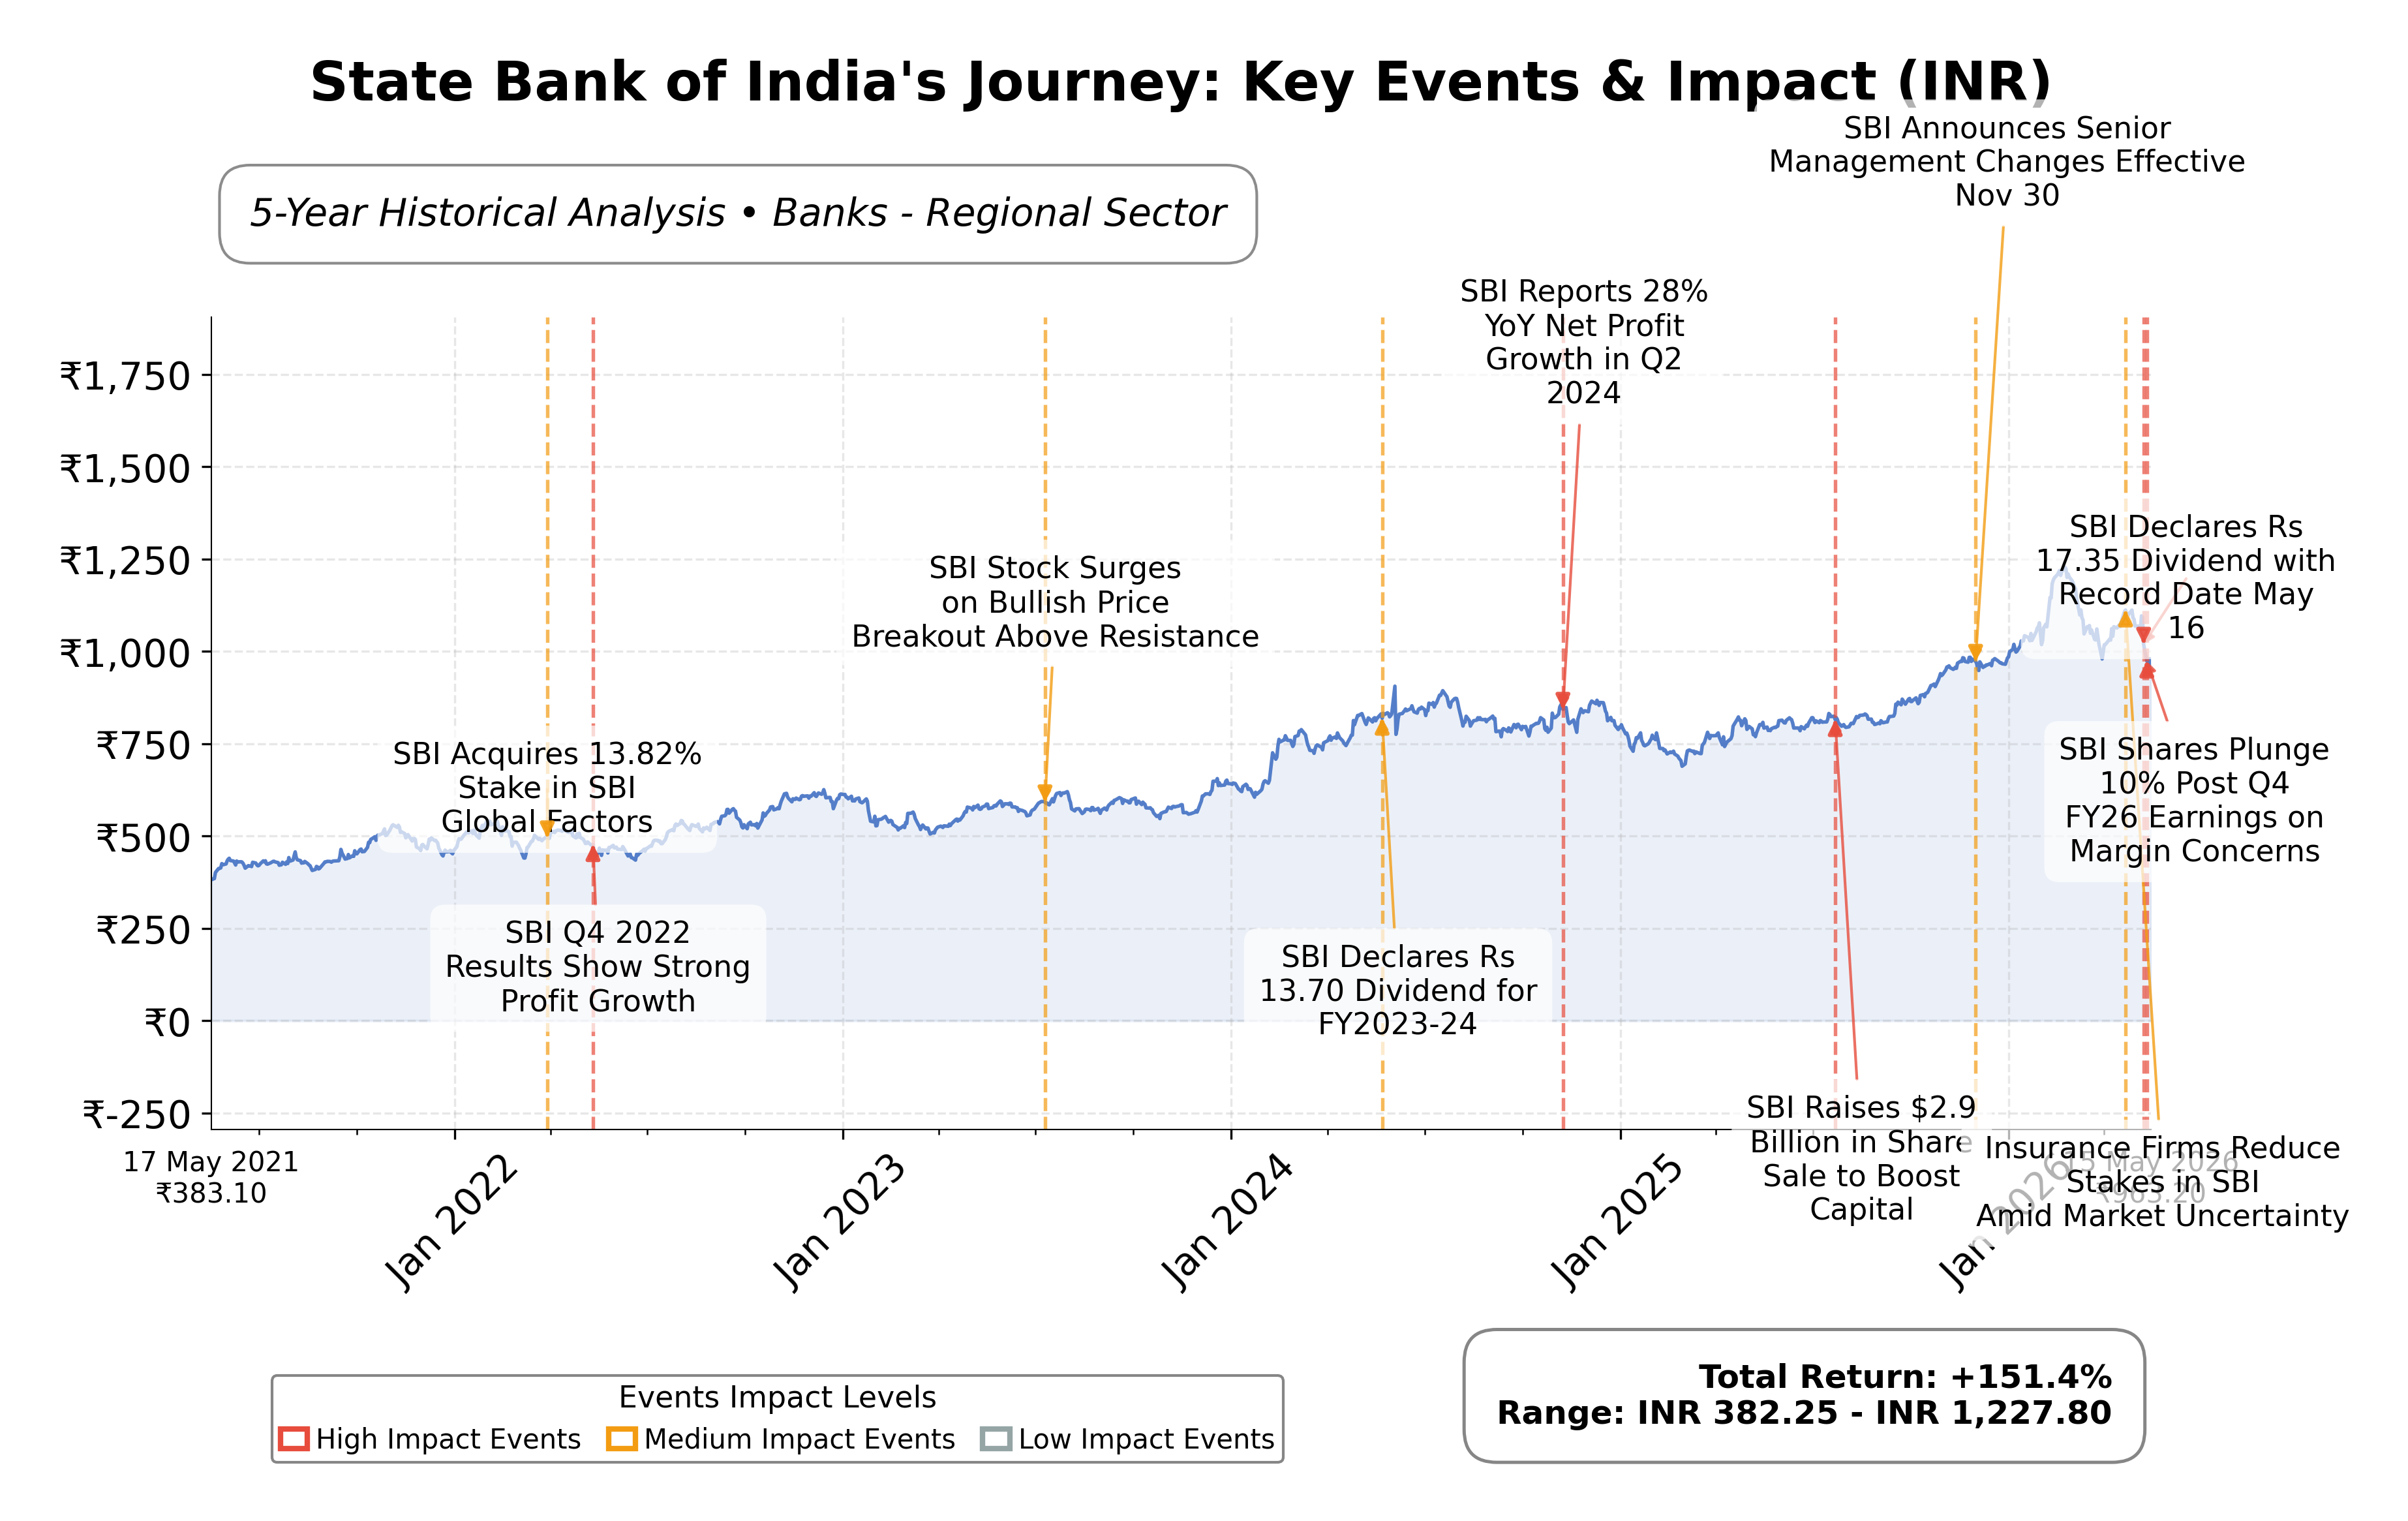
Stock Journey
Key Positives and Key Risks
Pros
- Market capitalization of ₹9.41 trillion establishes SBI as the largest regional bank, reflecting strong market presence.
- Return on equity of 15.36% indicates efficient use of shareholder capital and solid profitability.
- Operating cash flow of ₹1.94 trillion and free cash flow of ₹775.6 billion demonstrate robust cash generation supporting financial flexibility.
Cons
- Stock trading at a downside risk of approximately 22% from its 52-week high suggests recent price weakness.
- Declining net interest margin to 2.91% signals margin pressure that could impact future earnings.
- Debt-to-equity ratio of 1.12 indicates moderate leverage, which may constrain financial agility under stress.
Disclosure: This information is for general awareness and does not constitute investment advice
Report Summary
State Bank of India (SBI) is a leading public sector bank operating primarily in the Indian financial services sector. Listed on the NSE under the symbol SBIN, SBI provides a comprehensive range of banking and financial products including retail and corporate loans, savings and investment products, insurance, and digital banking services. It holds a dominant position in the regional banking industry with an extensive branch network and a significant market share, serving over 500 million customers. The bank’s core business segments include retail banking, corporate banking, treasury operations, and international banking, positioning it as a critical institution within India's banking ecosystem.
Financially, SBI reported trailing twelve months (TTM) revenue of approximately ₹3.7 trillion with a profit margin of 22.5%, operating margin of 29.7%, return on equity (ROE) of 15.36%, return on assets (ROA) of 1.06%, and a return on invested capital (ROIC) consistent with its ROE. These metrics indicate strong profitability and operational efficiency relative to its industry peers. The bank’s net income for the TTM stood at ₹832.6 billion, supported by a 14.5% quarterly revenue growth and a 13.1% year-over-year quarterly earnings growth, reflecting robust financial performance amid competitive pressures.
Valuation metrics show SBI trading at a trailing price-to-earnings (P/E) ratio of 11.10 and a forward P/E of 9.64, with a price-to-book (P/B) ratio of 1.59. The market capitalization is approximately ₹9.41 trillion, with an enterprise value of ₹13.32 trillion. The stock’s 52-week price range is ₹779.1 to ₹1,234.7, with the current price near ₹961.60, indicating a downside risk of about 22% from its 52-week high. These valuation figures suggest the stock is priced moderately relative to its fundamentals and sector averages.
SBI’s notable strengths include strong operating cash flow of ₹1.94 trillion, a healthy capital adequacy ratio of 15.40%, and a diversified loan portfolio with significant exposure to agriculture, SMEs, and corporate sectors. The bank maintains a manageable debt-to-equity ratio of 1.12 and a substantial cash reserve of ₹3.13 trillion. Key risks involve margin pressure due to declining net interest margins, potential asset quality challenges in SME and agricultural segments, and regulatory scrutiny inherent in the public sector banking environment. Recent strategic actions include digital banking expansion via the YONO platform and dividend announcements signaling shareholder returns.
Technically, SBI’s stock has experienced short-term correction and volatility, with momentum indicators approaching oversold levels, supported by a 50-day moving average near ₹1,077 and a 200-day moving average around ₹982. Recent news reflects mixed market sentiment with price fluctuations following quarterly earnings announcements. Overall, the data suggests a cautious stance with attention to evolving financial results and market dynamics, favoring close monitoring of the stock’s technical and fundamental developments.
Company and Industry Overview
Company Basics
Price Performance
Company Size
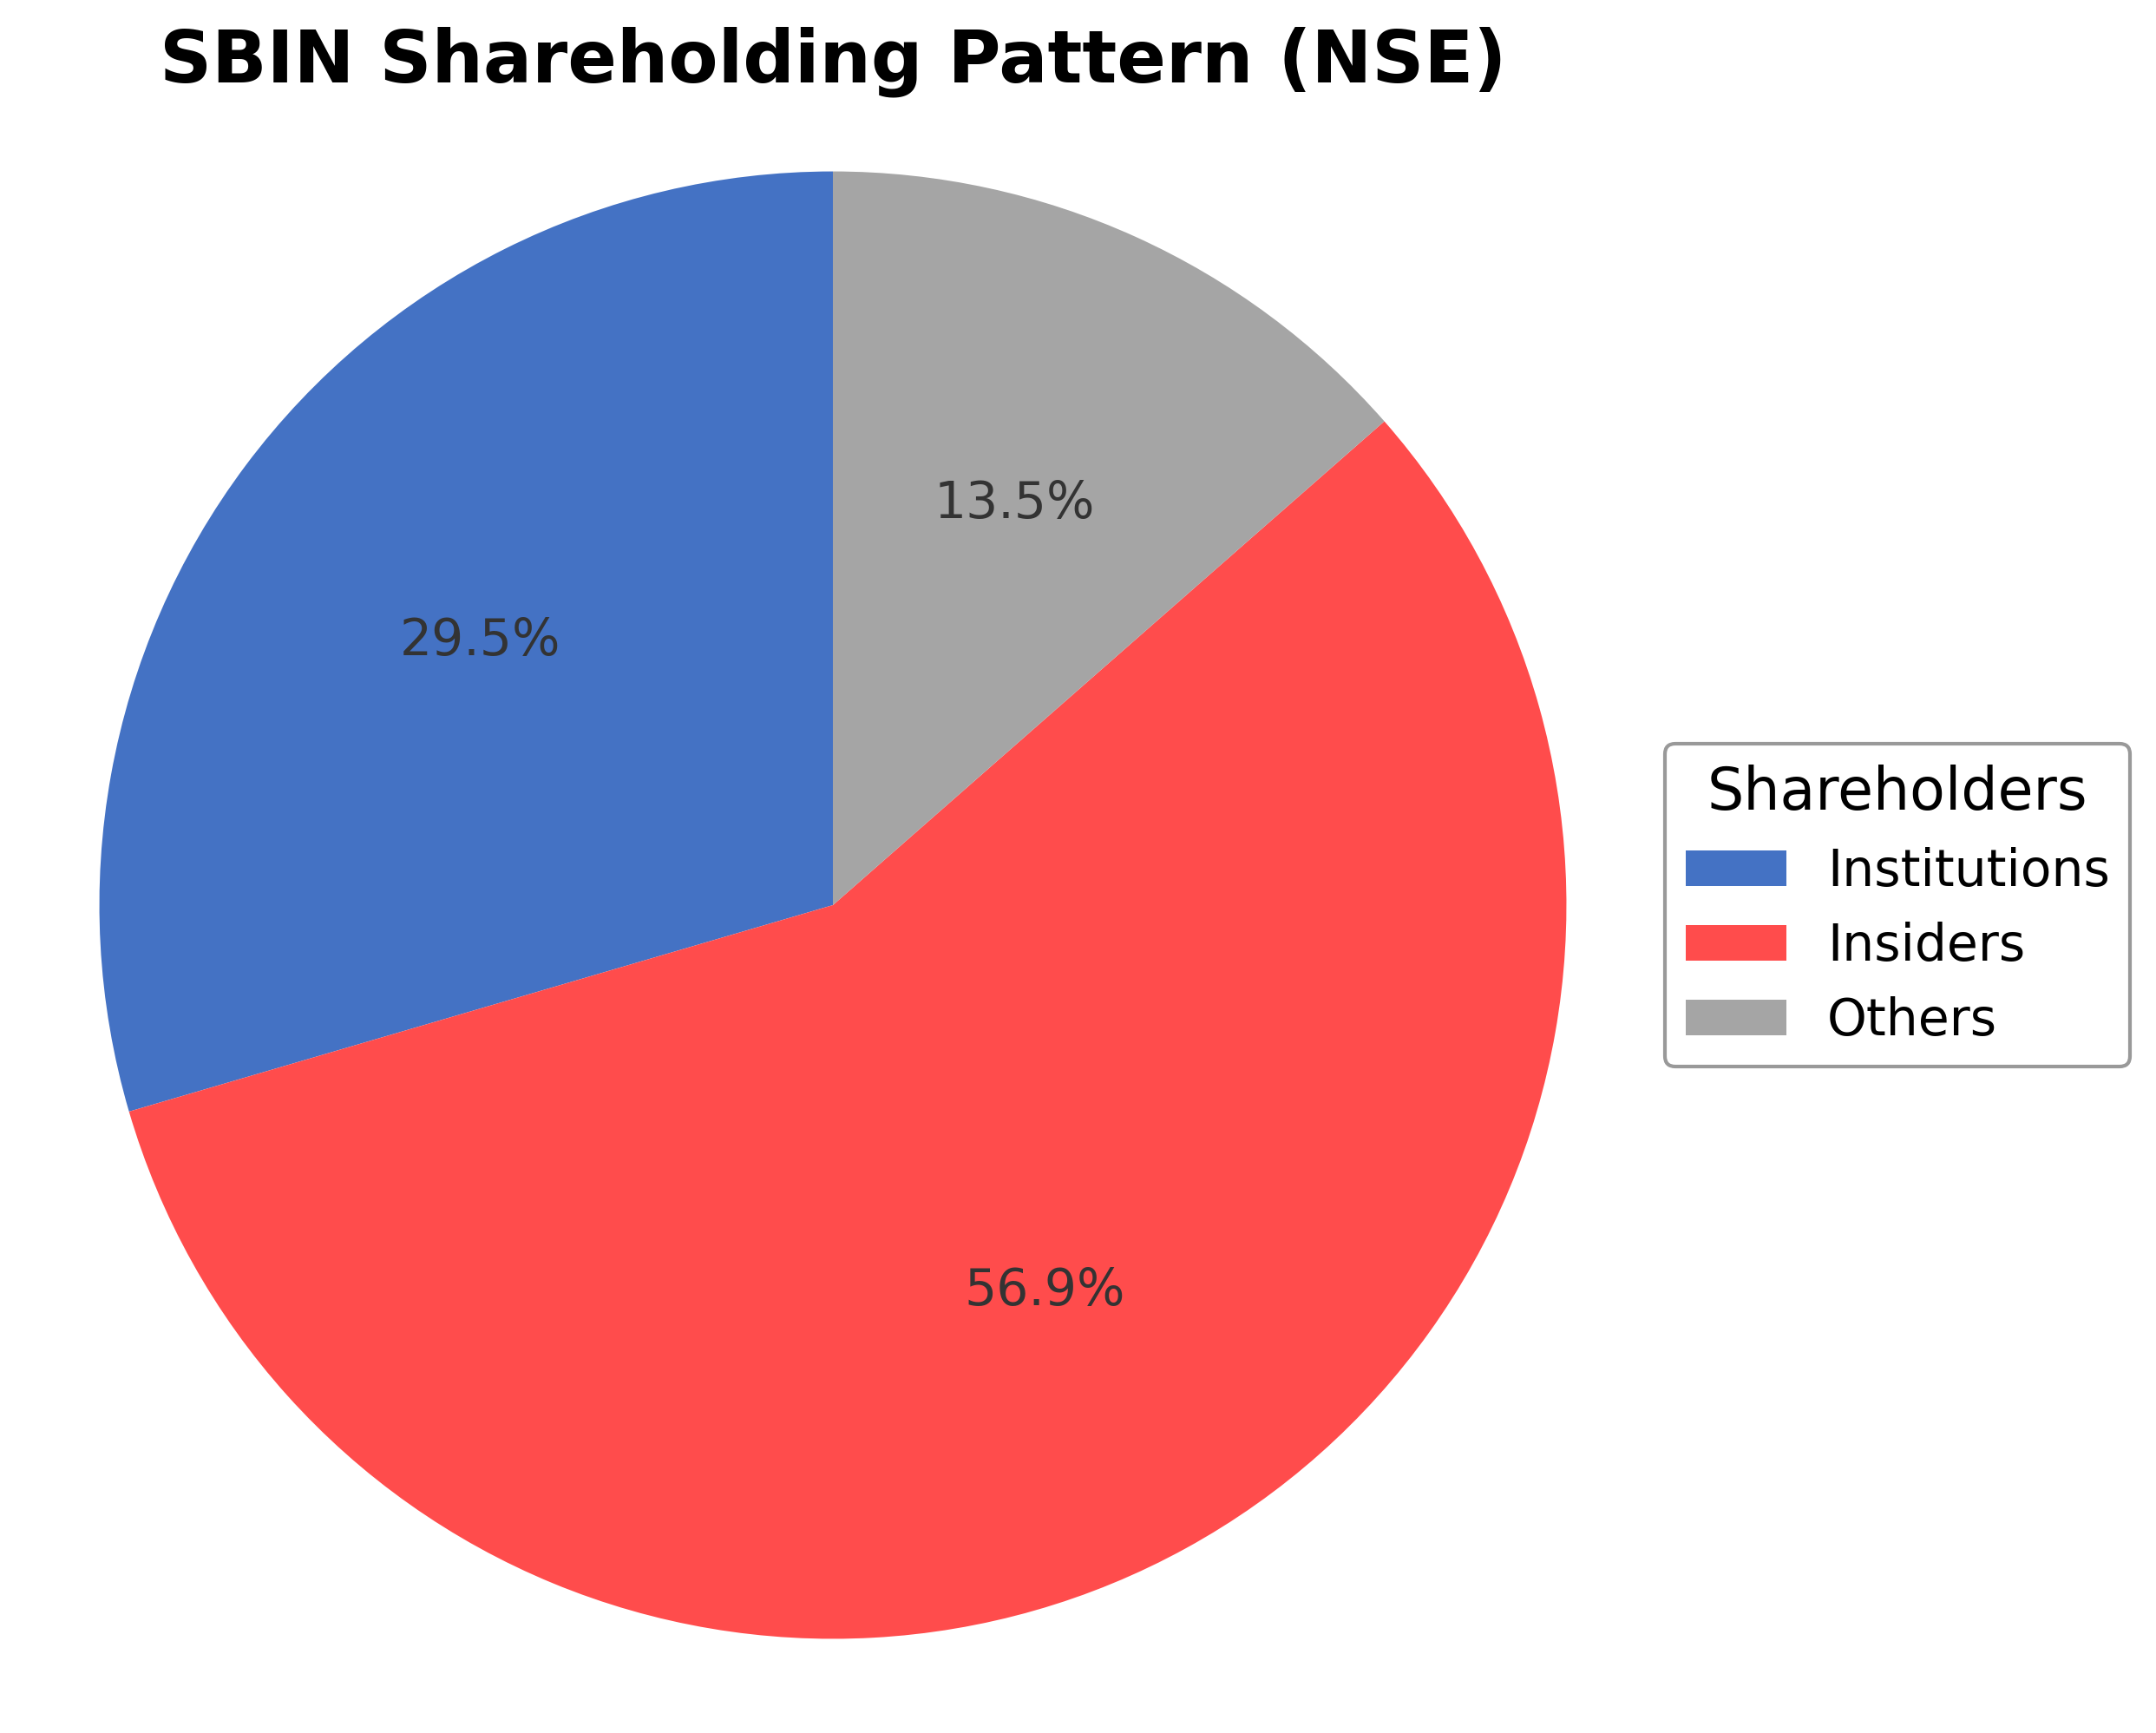
Shareholding Pattern
Sector and Industry Analysis
The Indian banking sector, valued at approximately USD 450 billion in 2023, has demonstrated steady growth from USD 400 billion in 2018, driven by a mix of public, private, and foreign banks. State Bank of India (SBI), HDFC Bank, and ICICI Bank dominate the market with extensive branch networks and strong digital capabilities. The sector benefits from a growing middle class and rising disposable incomes, which fuel demand for retail banking products such as loans, credit cards, and investment services.
Digital transformation is a defining trend, with widespread adoption of mobile and internet banking reshaping customer interactions and operational efficiency. Collaborations between banks and fintech firms, like Axis Bank’s AI-powered lending platform, are fostering innovation and financial inclusion. However, challenges such as high non-performing assets (NPAs), cybersecurity threats, and intense competition from fintech startups create barriers to entry and necessitate continuous investment in technology and risk management.
Regulatory frameworks play a critical role in shaping the sector, with initiatives like the Pradhan Mantri Jan Dhan Yojana significantly expanding financial inclusion by opening over 450 million bank accounts. The Reserve Bank of India’s tightening of compliance norms, including anti-money laundering and Basel III standards, increases operational rigor. Additionally, government programs such as the Digital India campaign and the Insolvency and Bankruptcy Code support sector stability and digital adoption, influencing the banking landscape’s future trajectory.
Note: Analysis synthesized from industry research, market reports, and regulatory filings. Information is subject to change based on market conditions.
Financial Ratios Dashboard
Illustrative Scenario Analysis
DCF Assumptions:
Method: Two-Stage EPS-Priority Model
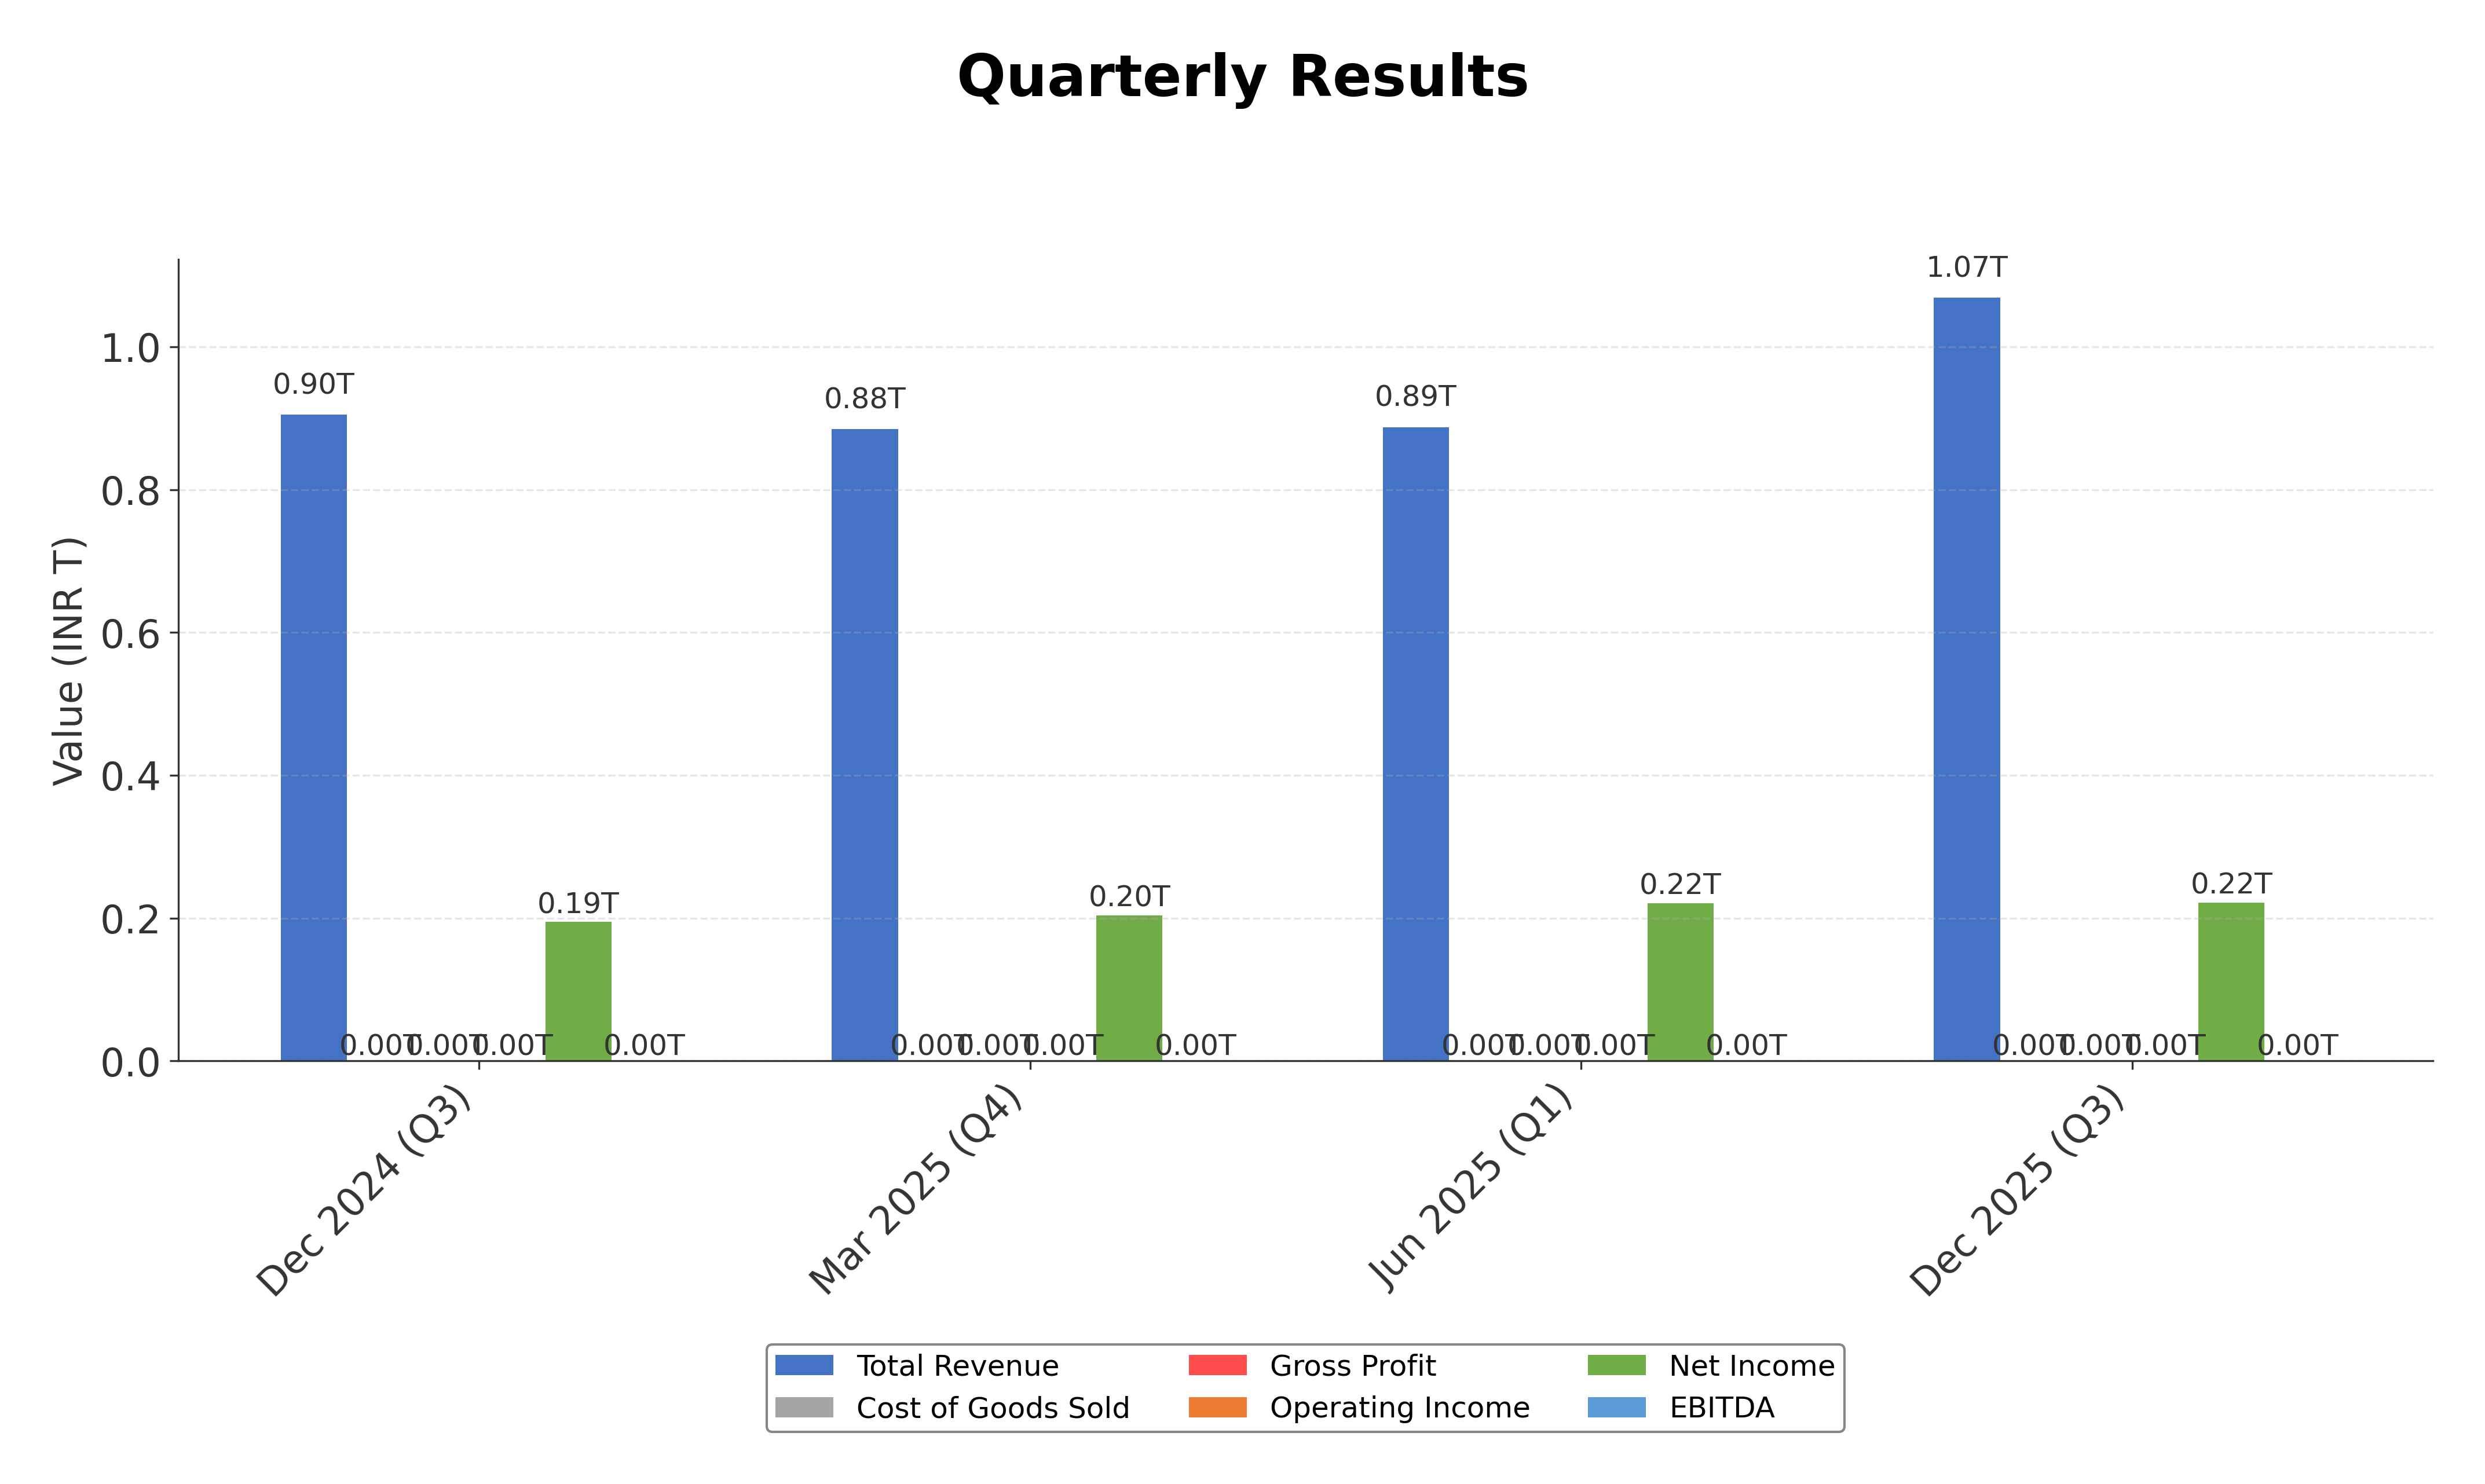
Financials
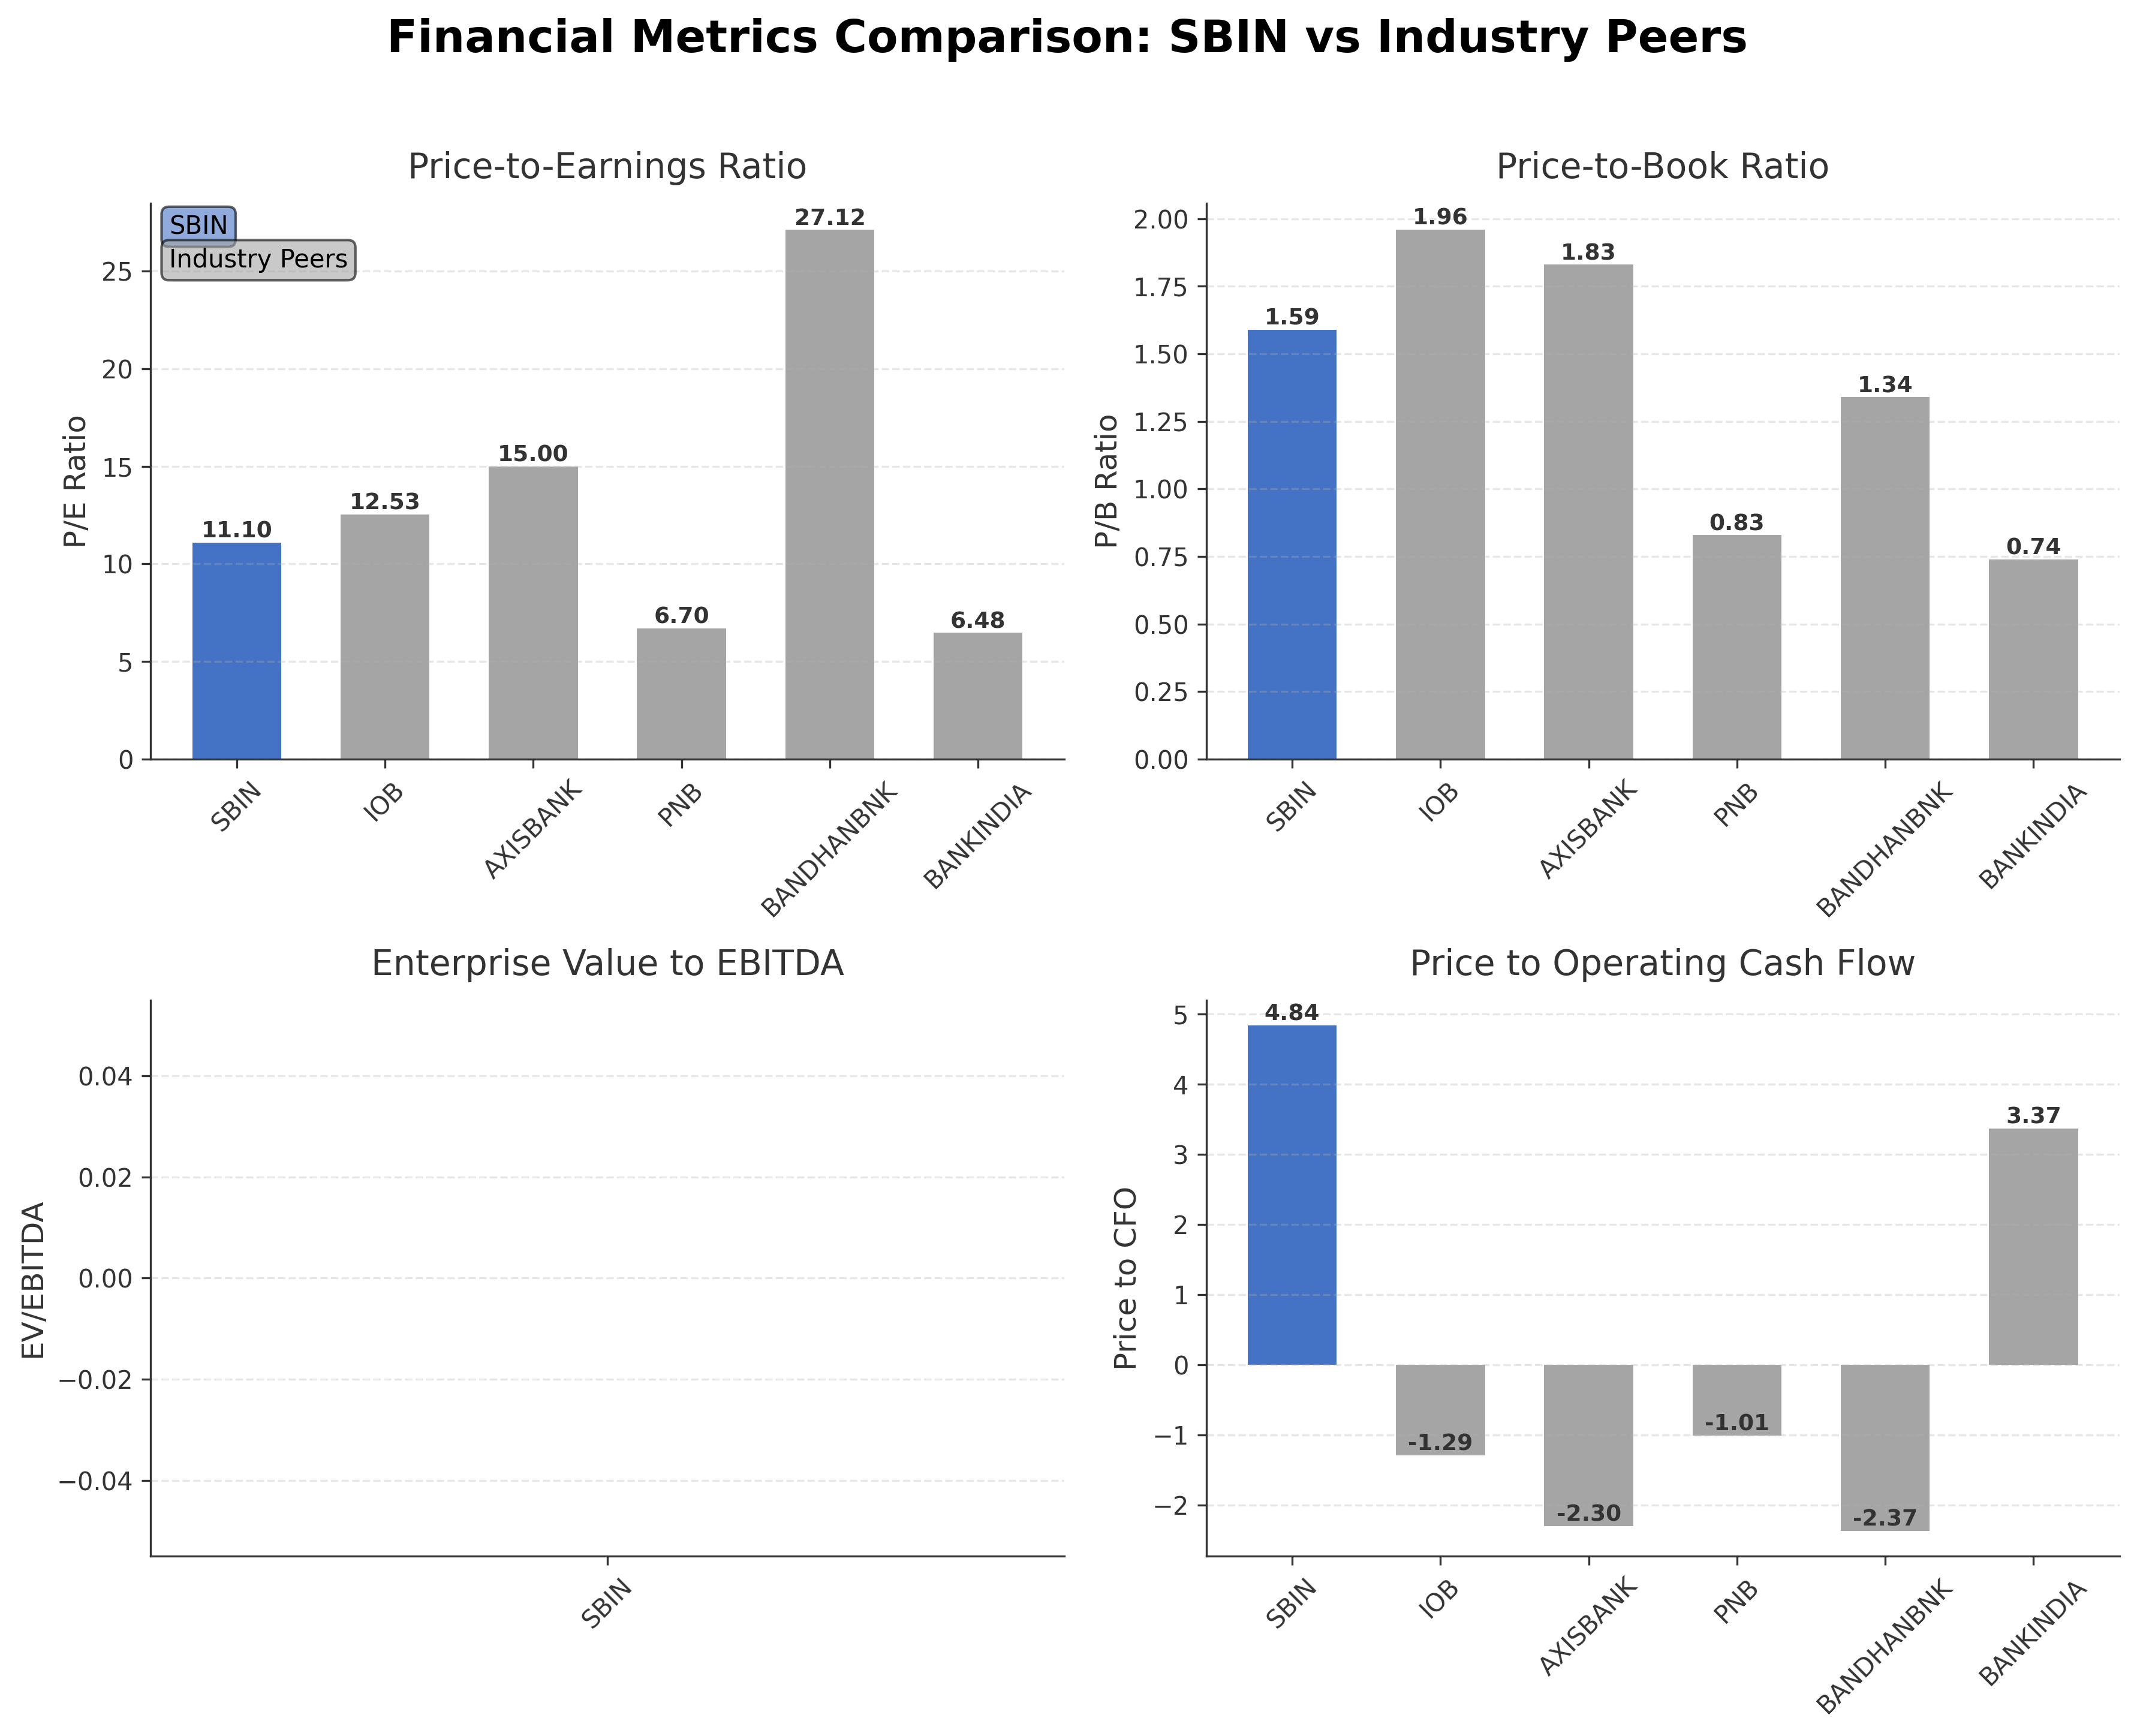
Peer Analysis
| Company Name | Market Cap | P/E Ratio | P/B Ratio | EV/EBITDA | Price to CFO |
|---|---|---|---|---|---|
| State Bank of India | ₹9.41T | 11.10 | 1.59 | N/A | 4.84 |
| Indian Overseas Bank | ₹670.51B | 12.53 | 1.96 | N/A | -1.29 |
| Axis Bank Ltd. | ₹3.94T | 15.00 | 1.83 | N/A | -2.30 |
| Punjab National Bank | ₹1.23T | 6.70 | 0.83 | N/A | -1.01 |
| Bandhan Bank Ltd. | ₹332.04B | 27.12 | 1.34 | N/A | -2.37 |
| Bank of India | ₹636.33B | 6.48 | 0.74 | N/A | 3.37 |
Comparison Analysis: State Bank of India stands as the largest regional bank by market capitalization at ₹9.41 trillion, significantly exceeding its peers. Its P/E ratio of 11.10 is moderate, lower than Axis Bank’s 15.00 and Bandhan Bank’s 27.12 but higher than Punjab National Bank and Bank of India, reflecting balanced valuation. The P/B ratio of 1.59 positions SBI between higher-valued peers like Indian Overseas Bank (1.96) and more undervalued banks such as Punjab National Bank (0.83). SBI’s return on equity of 15.36% is among the highest, indicating efficient capital utilization. Price to CFO ratio of 4.84 is positive compared to negative values for most peers, highlighting stronger cash flow generation. Overall, SBI exhibits a strong market position with solid profitability and reasonable valuation relative to its regional banking peers.
Financial Metrics Comparison with Peers
Financial Statements
Comprehensive financial data including income, balance sheet, and cash flow metrics
Income Statement
| fiscal_date | 2025-03-31 | 2024-03-31 | 2023-03-31 | 2022-03-31 | 2021-03-31 |
|---|---|---|---|---|---|
| Sales | 3495.23B | 3236.14B | 2703.37B | 2360.91B | 1873.94B |
| Operating Expense Selling General And Administrative | 47.84B | 44.23B | 42.21B | 34.26B | 31.46B |
| Operating Expense Other Operating Expenses | 1388.58B | 282.21B | 266.48B | 254.05B | 294.46B |
| Pretax Income | 1063.65B | 912.40B | 753.99B | 497.39B | 327.96B |
| Income Tax | 273.48B | 231.02B | 188.40B | 133.82B | 85.16B |
| Net Income | 805.23B | 695.43B | 577.50B | 371.83B | 238.88B |
| Eps Basic | 86.91 | 75.17 | 62.35 | 39.64 | 25.11 |
| Eps Diluted | 86.91 | 75.17 | 62.35 | 39.64 | 25.11 |
| Basic Shares Outstanding | 8.92B | 8.92B | 8.92B | 8.92B | 8.92B |
| Diluted Shares Outstanding | 8.92B | 8.92B | 8.92B | 8.92B | 8.92B |
| Net Income Continuous Operations | 1049.09B | 901.86B | 744.88B | 487.56B | 309.22B |
| Minority Interests | -29.61B | -24.59B | -21.02B | -18.09B | -14.82B |
Source: Financial statements and regulatory filings
Balance Sheet
| fiscal_date | 2025-03-31 | 2024-03-31 | 2023-03-31 | 2022-03-31 | 2021-03-31 |
|---|---|---|---|---|---|
| Cash And Cash Equivalents | 6208.49B | 5975.68B | 5369.03B | 5945.23B | 5318.00B |
| Accounts Receivable | N/A | N/A | N/A | N/A | N/A |
| Total Assets | 73141.85B | 67337.79B | N/A | N/A | N/A |
| Total Liabilities | 68091.23B | 63032.22B | N/A | N/A | N/A |
| Long Term Debt | 6181.25B | 5565.03B | 5220.93B | 4576.90B | 4265.69B |
| Shareholders Equity | 5050.63B | 4305.57B | 3717.68B | 3167.95B | 2851.87B |
Source: Financial statements and regulatory filings
Cash Flow Statement
| fiscal_date | 2025-03-31 | 2024-03-31 | 2023-03-31 | 2022-03-31 | 2021-03-31 |
|---|---|---|---|---|---|
| Operating Activities Net Income | 1049.09B | 901.86B | 744.88B | 487.56B | 309.22B |
| Operating Activities Other Non Cash Items | 119.23B | 96.62B | 65.44B | 55.88B | 59.00B |
| Operating Activities Other Assets Liabilities | 773.75B | 562.63B | 151.82B | 917.20B | 12.16B |
| Operating Activities Operating Cash Flow | 1942.07B | 1561.11B | 962.14B | 1460.64B | 380.38B |
| Investing Activities Capital Expenditures | -56.37B | -41.75B | -40.44B | -30.51B | -38.28B |
| Investing Activities Net Acquisitions | -65.19M | -821.61M | 0.00 | -5.71B | 885.98M |
| Investing Activities Investing Cash Flow | -56.44B | -42.57B | -40.44B | -36.22B | -37.39B |
| Financing Activities Long Term Debt Issuance | 215.00B | 201.65B | 195.33B | 140.74B | 274.31B |
| Financing Activities Long Term Debt Payments | -151.04B | -142.88B | -21.25B | -105.18B | -168.98B |
| Financing Activities Common Stock Issuance | 1.29M | 0.00 | 64.00K | 0.00 | 0.00 |
| Financing Activities Common Dividends | -122.27B | -100.85B | -63.37B | -35.70B | N/A |
| Financing Activities Other Financing Charges | 23.62B | 29.01B | 16.40B | 15.81B | 16.78B |
| Financing Activities Financing Cash Flow | -34.68B | -13.07B | 127.11B | 15.66B | 122.12B |
| End Cash Position | 3579.33B | 3265.72B | 3183.12B | 3989.05B | 3477.07B |
| Free Cash Flow | 428.49B | 174.57B | -900.57B | 543.90B | 860.09B |
| Financing Activities Common Stock Repurchase | N/A | N/A | N/A | 0.00 | 0.00 |
| Investing Activities Net Intangibles | N/A | N/A | N/A | N/A | -59.00K |
| Investing Activities Other Investing Activity | N/A | N/A | N/A | N/A | N/A |
Source: Financial statements and regulatory filings
Technical Analysis
Key Insights
- The current trend shows a short-term correction with the stock price declining from recent highs, exhibiting increased volatility and approaching oversold conditions.
- Key support levels are identified near ₹779, the 52-week low, while resistance is evident around the 50-day moving average at ₹1,077 and the 52-week high of ₹1,234.
- The stock is trading below the 50-day moving average but remains above the 200-day moving average at ₹982, indicating mixed momentum across timeframes.
- Momentum indicators show RSI near 31.4, close to the oversold threshold of 30, while MACD and Stochastic oscillators reflect weakening bullish momentum.
- Across daily, weekly, and monthly timeframes, the stock demonstrates consolidation with short-term bearish pressure but maintains longer-term support levels.
- Potential market scenarios include a continuation of the correction towards support levels or a rebound if momentum indicators improve, with volatility likely to persist in the near term.
Trending News
1. Headline: SBI shares face short term correction, approach oversold zone; right time to buy? - BusinessToday
Summary: Shares of State Bank of India (SBI) are in a short-term correction. The banking stock has approached the oversold zone with a RSI of 31.4. An RSI below 30 indicates a stock is oversold on charts. The largest bank in India saw its stock fall 18.29% in three months.
Sentiment: negative
2. Headline: State Bank Of India Dividend Record Date Tomorrow: Last Day To Buy Shares To Qualify May 15
Summary: State Bank of India announces dividend per share for FY ending March 2026. May 15 is the last day to buy shares to qualify for the dividend payable on June 4.
Sentiment: neutral
3. Headline: State Bank of India stock (INE062A01020): up 1.31% to Rs 982
Summary: State Bank of India shares rose 1.31% to Rs 982 amid high trading volume on NSE, reflecting positive momentum in India's largest public sector bank.
Sentiment: positive
4. Headline: State Bank of India stock (INE062A01020): Down 0.5% amid trading volatility
Summary: State Bank of India shares traded at ?970.1 on NSE, down 0.5% from prior close, with intraday range of ?961-?981 as of May 13, 2026.
Sentiment: negative
5. Headline: SBI Share Price Highlights: SBI Stock Price History - The Economic Times
Summary: Join us on the SBI Stock Liveblog, your hub for real-time updates and comprehensive analysis on a prominent stock. Stay in the know with the latest information about SBI, including: Last traded price 979.9, Market capitalization: 904508.22, Volume: 16487142, Price-to-earnings ratio 10.86, Earnings ...
Sentiment: neutral
Recent Updates
News Summary
As of 2026-05-12. State Bank of India reported a 5.6% year-on-year increase in net profit for Q4 FY25, reaching ₹19,684 crore, with full fiscal year FY26 net profit rising 12.88% to a record ₹80,032 crore. The bank’s advances grew 16.87% year-over-year, surpassing guidance, while deposits increased 11.03%. Asset quality improved with gross non-performing assets declining to 1.49%. Despite these positive fundamentals, the stock experienced a sharp 10% decline over two trading days post-results due to margin disappointment cited by brokerages. Dividend announcements include ₹17.35 per share for FY26 with a record date of May 16, 2026. The bank continues to expand its digital banking platform YONO, which now has over 10 crore registered users, enhancing non-interest income streams. Overall, SBI maintains a strong capital adequacy ratio of 15.40%, supporting its growth and risk management strategies.
News Sentiment
The overall sentiment from recent updates is mixed to neutral. Positive drivers include record annual profits, strong loan and deposit growth, and improved asset quality, which underscore operational resilience. However, market reaction has been tempered by concerns over margin compression and short-term stock price volatility following earnings announcements. Dividend declarations and digital platform expansion contribute to constructive outlook elements, while the share price correction reflects investor caution amid evolving macroeconomic and sectoral conditions. This balance of factors suggests a measured market response to SBI’s current performance and prospects.
Source List
Analytical Overview
Analysis Summary
State Bank of India’s valuation metrics, including a trailing P/E of 11.10 and forward P/E of 9.64, are broadly in line with industry averages, reflecting a reasonable market pricing relative to earnings. The PEG ratio of 2.67 suggests moderate growth expectations relative to earnings growth. Revenue growth of 14.5% quarterly and positive cash flow trends, with operating cash flow of ₹1.94 trillion and free cash flow of ₹775.6 billion, indicate a solid growth trajectory. The bank’s financial health is supported by a manageable debt-to-equity ratio of 1.12 and a strong capital adequacy ratio of 15.40%, though margin pressures from declining net interest margins present sector-specific challenges. Considering India’s regulatory environment, economic outlook, and increasing digital adoption, SBI is well-positioned to leverage growth opportunities while navigating competitive and macroeconomic risks.
Overall Business and Market Assessment
Supporting Factors: SBI’s robust loan and deposit growth, improved asset quality, and strong capital position, which underpin operational stability
Risk Factors: margin compression, potential asset quality deterioration in SME and agricultural portfolios, and regulatory changes impacting public sector banks
SWOT Analysis
Strengths
- Largest public sector bank in India with extensive branch network.
- Strong capital adequacy ratio of 15.40% supporting growth and risk management.
- Robust revenue growth of 14.5% quarterly and diversified financial services.
- Significant digital banking presence with over 10 crore YONO users.
Weaknesses
- Declining net interest margins exert pressure on profitability.
- Moderate debt-to-equity ratio of 1.12 indicating leverage.
- Relatively low insider ownership at 0.57% may limit alignment of interests.
- Price-to-earnings growth ratio of 2.67 suggests moderate growth expectations.
Opportunities
- Expanding SME and agricultural lending segments with high credit growth.
- Increasing digital adoption and monetization of digital platforms.
- Potential for further market share gains in retail and corporate banking.
- Favorable economic growth supporting credit demand in India.
Threats
- Regulatory and policy changes affecting public sector banks.
- Competitive pressures from private sector banks and fintech firms.
- Risks of asset quality deterioration in high-growth loan segments.
- Macroeconomic volatility impacting interest rates and credit demand.
Company Description
State Bank of India is a prominent public sector bank providing a comprehensive range of financial services in India. Its primary function is to offer banking and financial solutions that cater to the vast and diverse needs of the Indian economy and its populace. As one of the country's largest banks, it plays a crucial role in financing key sectors, including agriculture, infrastructure, and small- and medium-sized enterprises (SMEs). State Bank of India offers a wide array of products, such as personal and corporate loans, savings and investment options, insurance products, and digital banking services, thus supporting economic development and facilitating financial inclusion. The bank is integral to India's banking sector due to its expansive network and significant market share, reflecting its critical position in both national and international financial contexts. Founded in 1955 and headquartered in Mumbai, State Bank of India remains a leading institution, influencing banking norms and contributing to policy-making decisions across the financial spectrum.