
State Bank of India (SBIN)
Stock Analysis Report
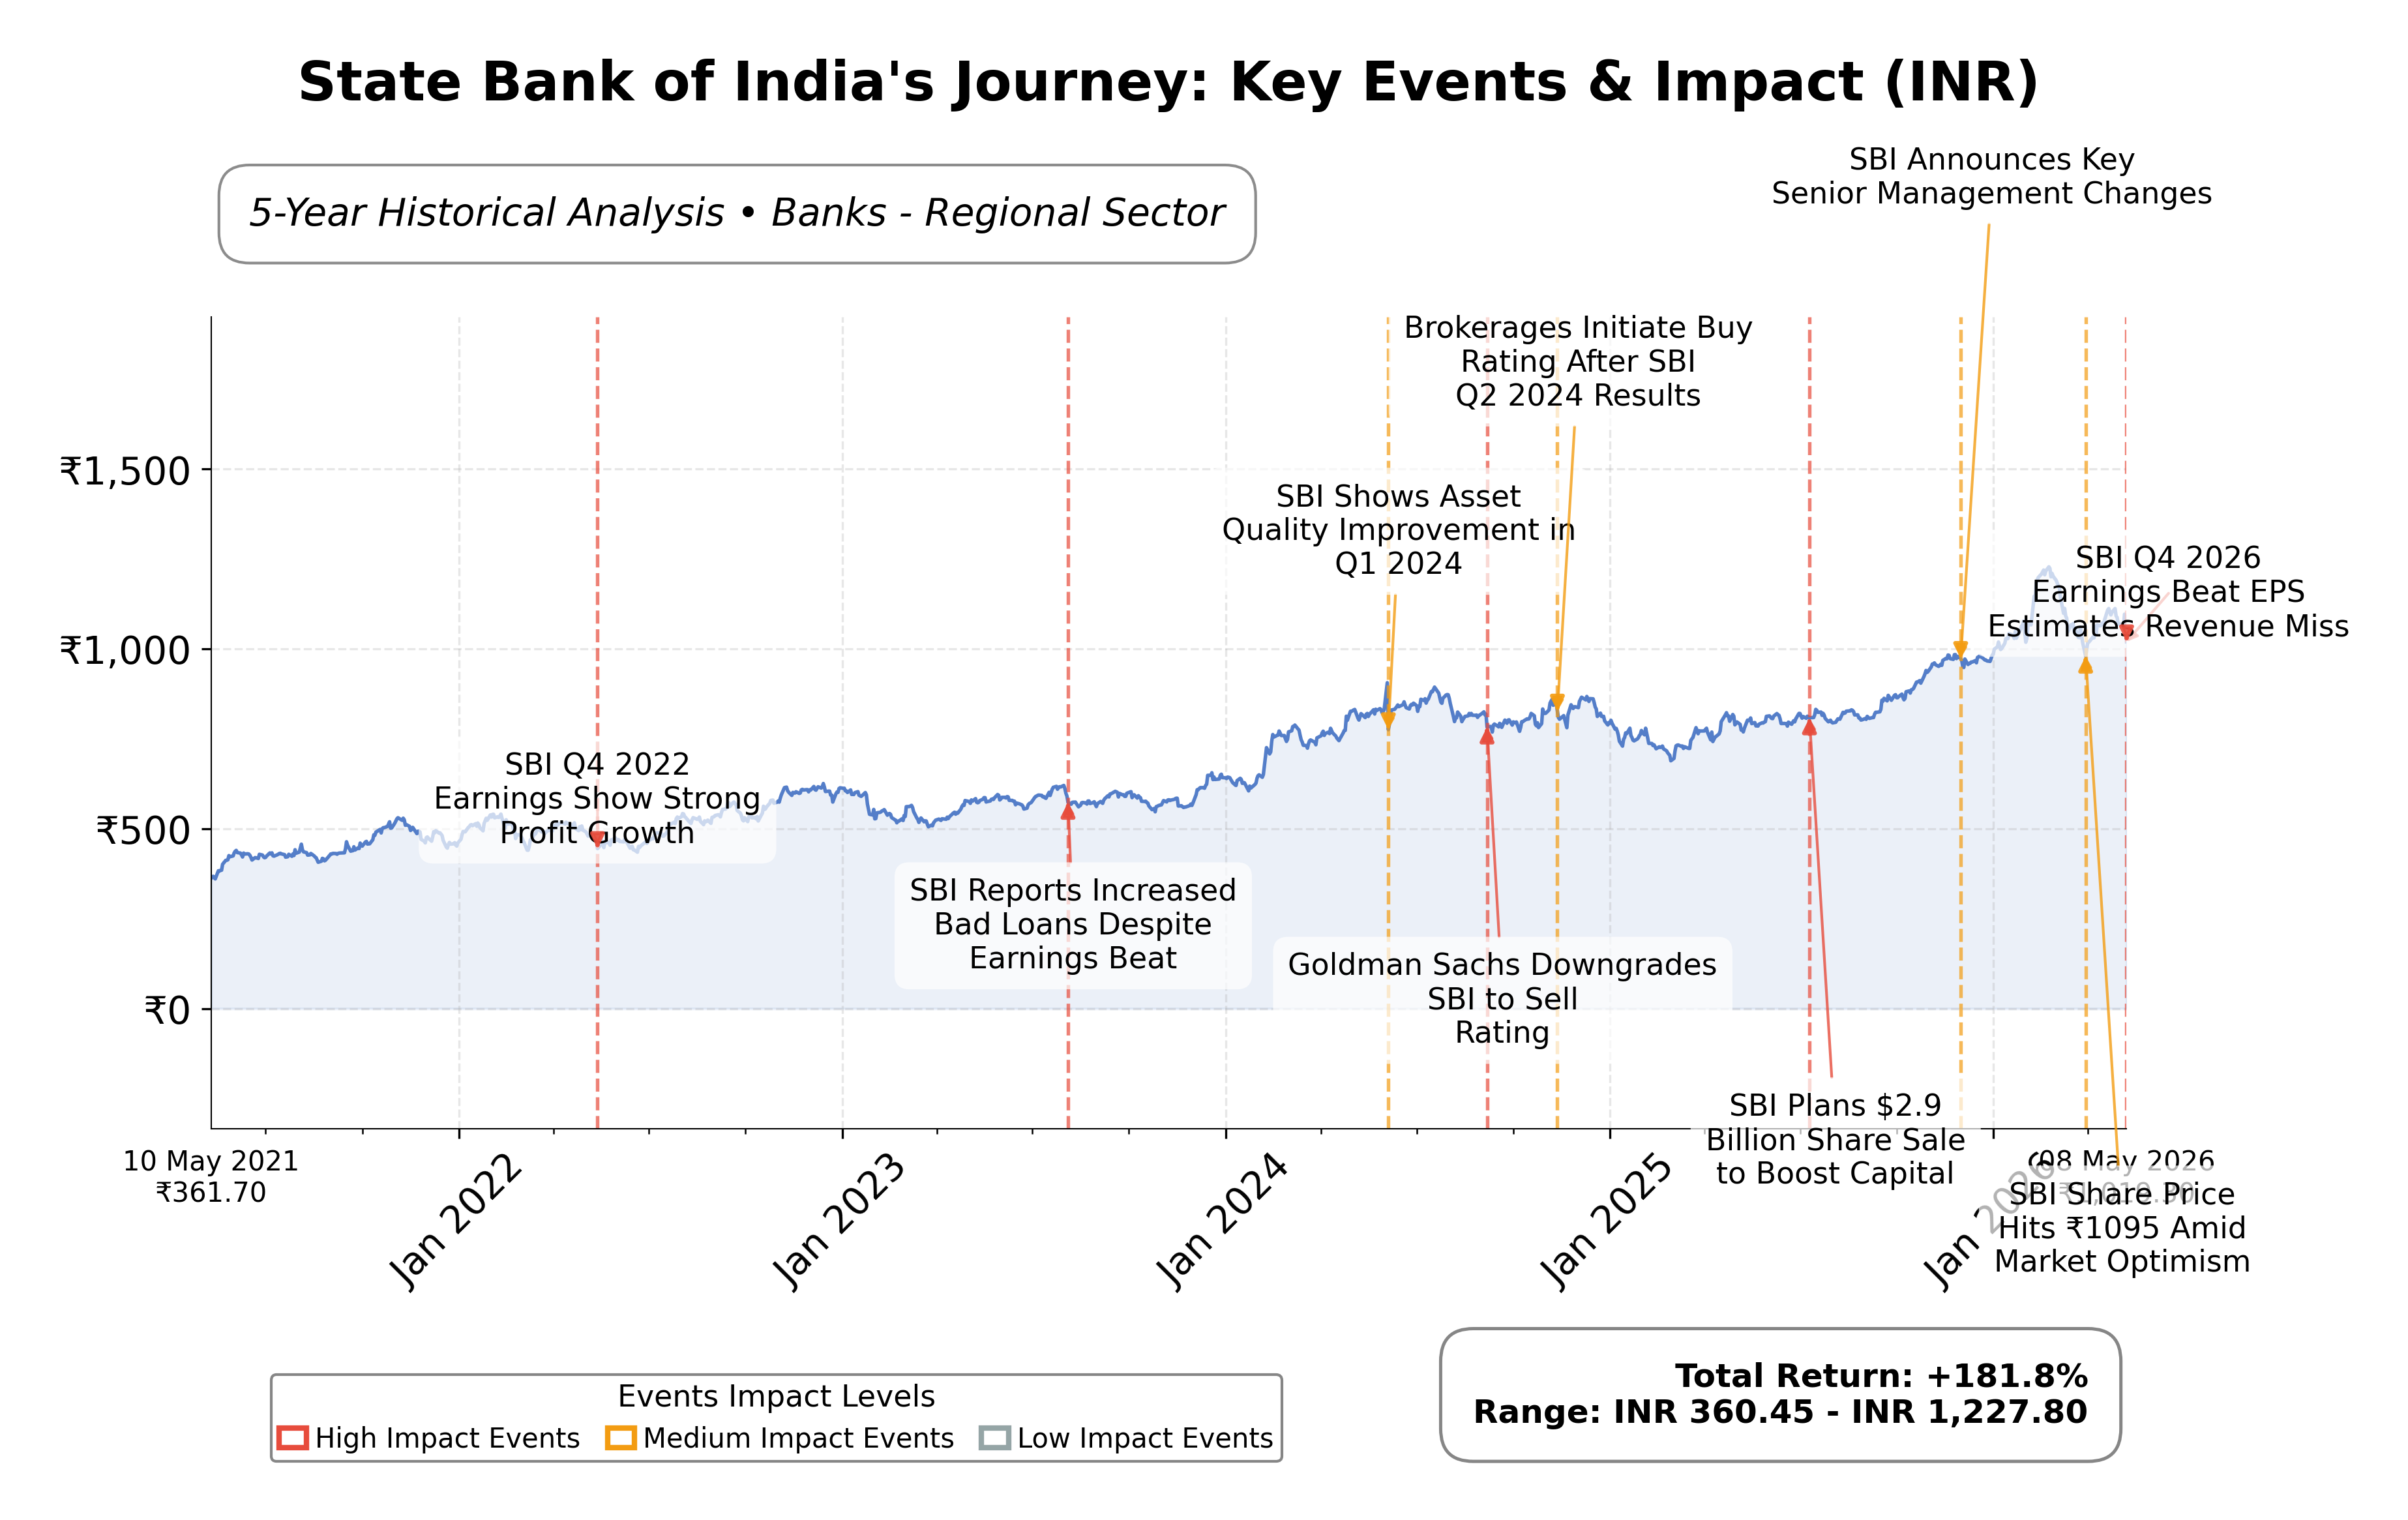
Stock Journey
Key Positives and Key Risks
Pros
- Market capitalization of ₹9.86 trillion reflects SBI’s dominant position in the Indian banking sector.
- Return on equity of 15.36% indicates strong profitability and efficient capital use.
- Quarterly revenue growth of 14.5% and net profit margin of 22.5% demonstrate robust earnings performance.
Cons
- Net interest margin compression and a debt-to-equity ratio of 1.12 highlight margin and leverage risks.
- Gross non-performing assets at 1.49% pose potential credit quality concerns amid economic uncertainties.
- Recent stock price volatility following earnings announcements suggests market caution.
Disclosure: This information is for general awareness and does not constitute investment advice
Report Summary
State Bank of India (SBI) is a leading public sector bank listed on the National Stock Exchange of India (NSE), operating within the financial services sector. It offers a broad range of banking and financial products including personal and corporate loans, savings and investment options, insurance, and digital banking services. As one of India’s largest banks, SBI holds a dominant market position with a significant presence in key sectors such as agriculture, infrastructure, and SMEs. The bank’s extensive network and role in national economic development underscore its critical importance in the Indian banking industry.
Financially, SBI reported trailing twelve months (TTM) revenue of approximately ₹3.7 trillion with a net profit margin of 22.5%, indicating solid profitability. The operating margin stands at 29.7%, reflecting efficient operational management. Return on equity (ROE) is 15.36% and return on assets (ROA) is 1.06%, demonstrating effective use of equity and assets to generate earnings. The bank’s operating cash flow for the TTM is ₹1.94 trillion, and free cash flow is ₹776 billion, highlighting strong cash generation capabilities.
Valuation metrics show a trailing price-to-earnings (P/E) ratio of 11.67 and a price-to-book (P/B) ratio of 1.67, which are in line with industry averages. The forward P/E is 11.65, suggesting market expectations of stable earnings. SBI’s market capitalization is approximately ₹9.86 trillion, with a 52-week price range from ₹755.5 to ₹1,234.7. The current price of ₹1,018.5 places the stock below its 52-week high, indicating potential upside relative to recent peak valuations.
SBI’s strengths include a robust capital adequacy ratio of 15.4%, stable asset quality with gross non-performing assets (NPAs) at 1.49%, and diversified loan growth across retail, SME, and corporate segments. The bank maintains a manageable debt-to-equity ratio of 1.12 and a healthy dividend payout ratio of 17.3%. Key risks involve potential credit quality pressures in SME and agricultural portfolios amid macroeconomic uncertainties and margin compression due to interest rate fluctuations. Recent strategic actions include digital expansion with YONO platform growth and consistent dividend declarations, reinforcing shareholder value.
Technically, SBI’s stock shows a positive trend supported by price action above its 50-day and 200-day moving averages, with momentum indicators signaling moderate strength. The stock is approaching a breakout zone of an inverse head and shoulders pattern, suggesting potential for further price appreciation. However, recent volatility following earnings announcements advises a cautious stance. Overall, the data suggests a balanced environment where market participants may consider accumulation or monitoring for confirmation of sustained momentum.
Company and Industry Overview
Company Basics
Price Performance
Company Size
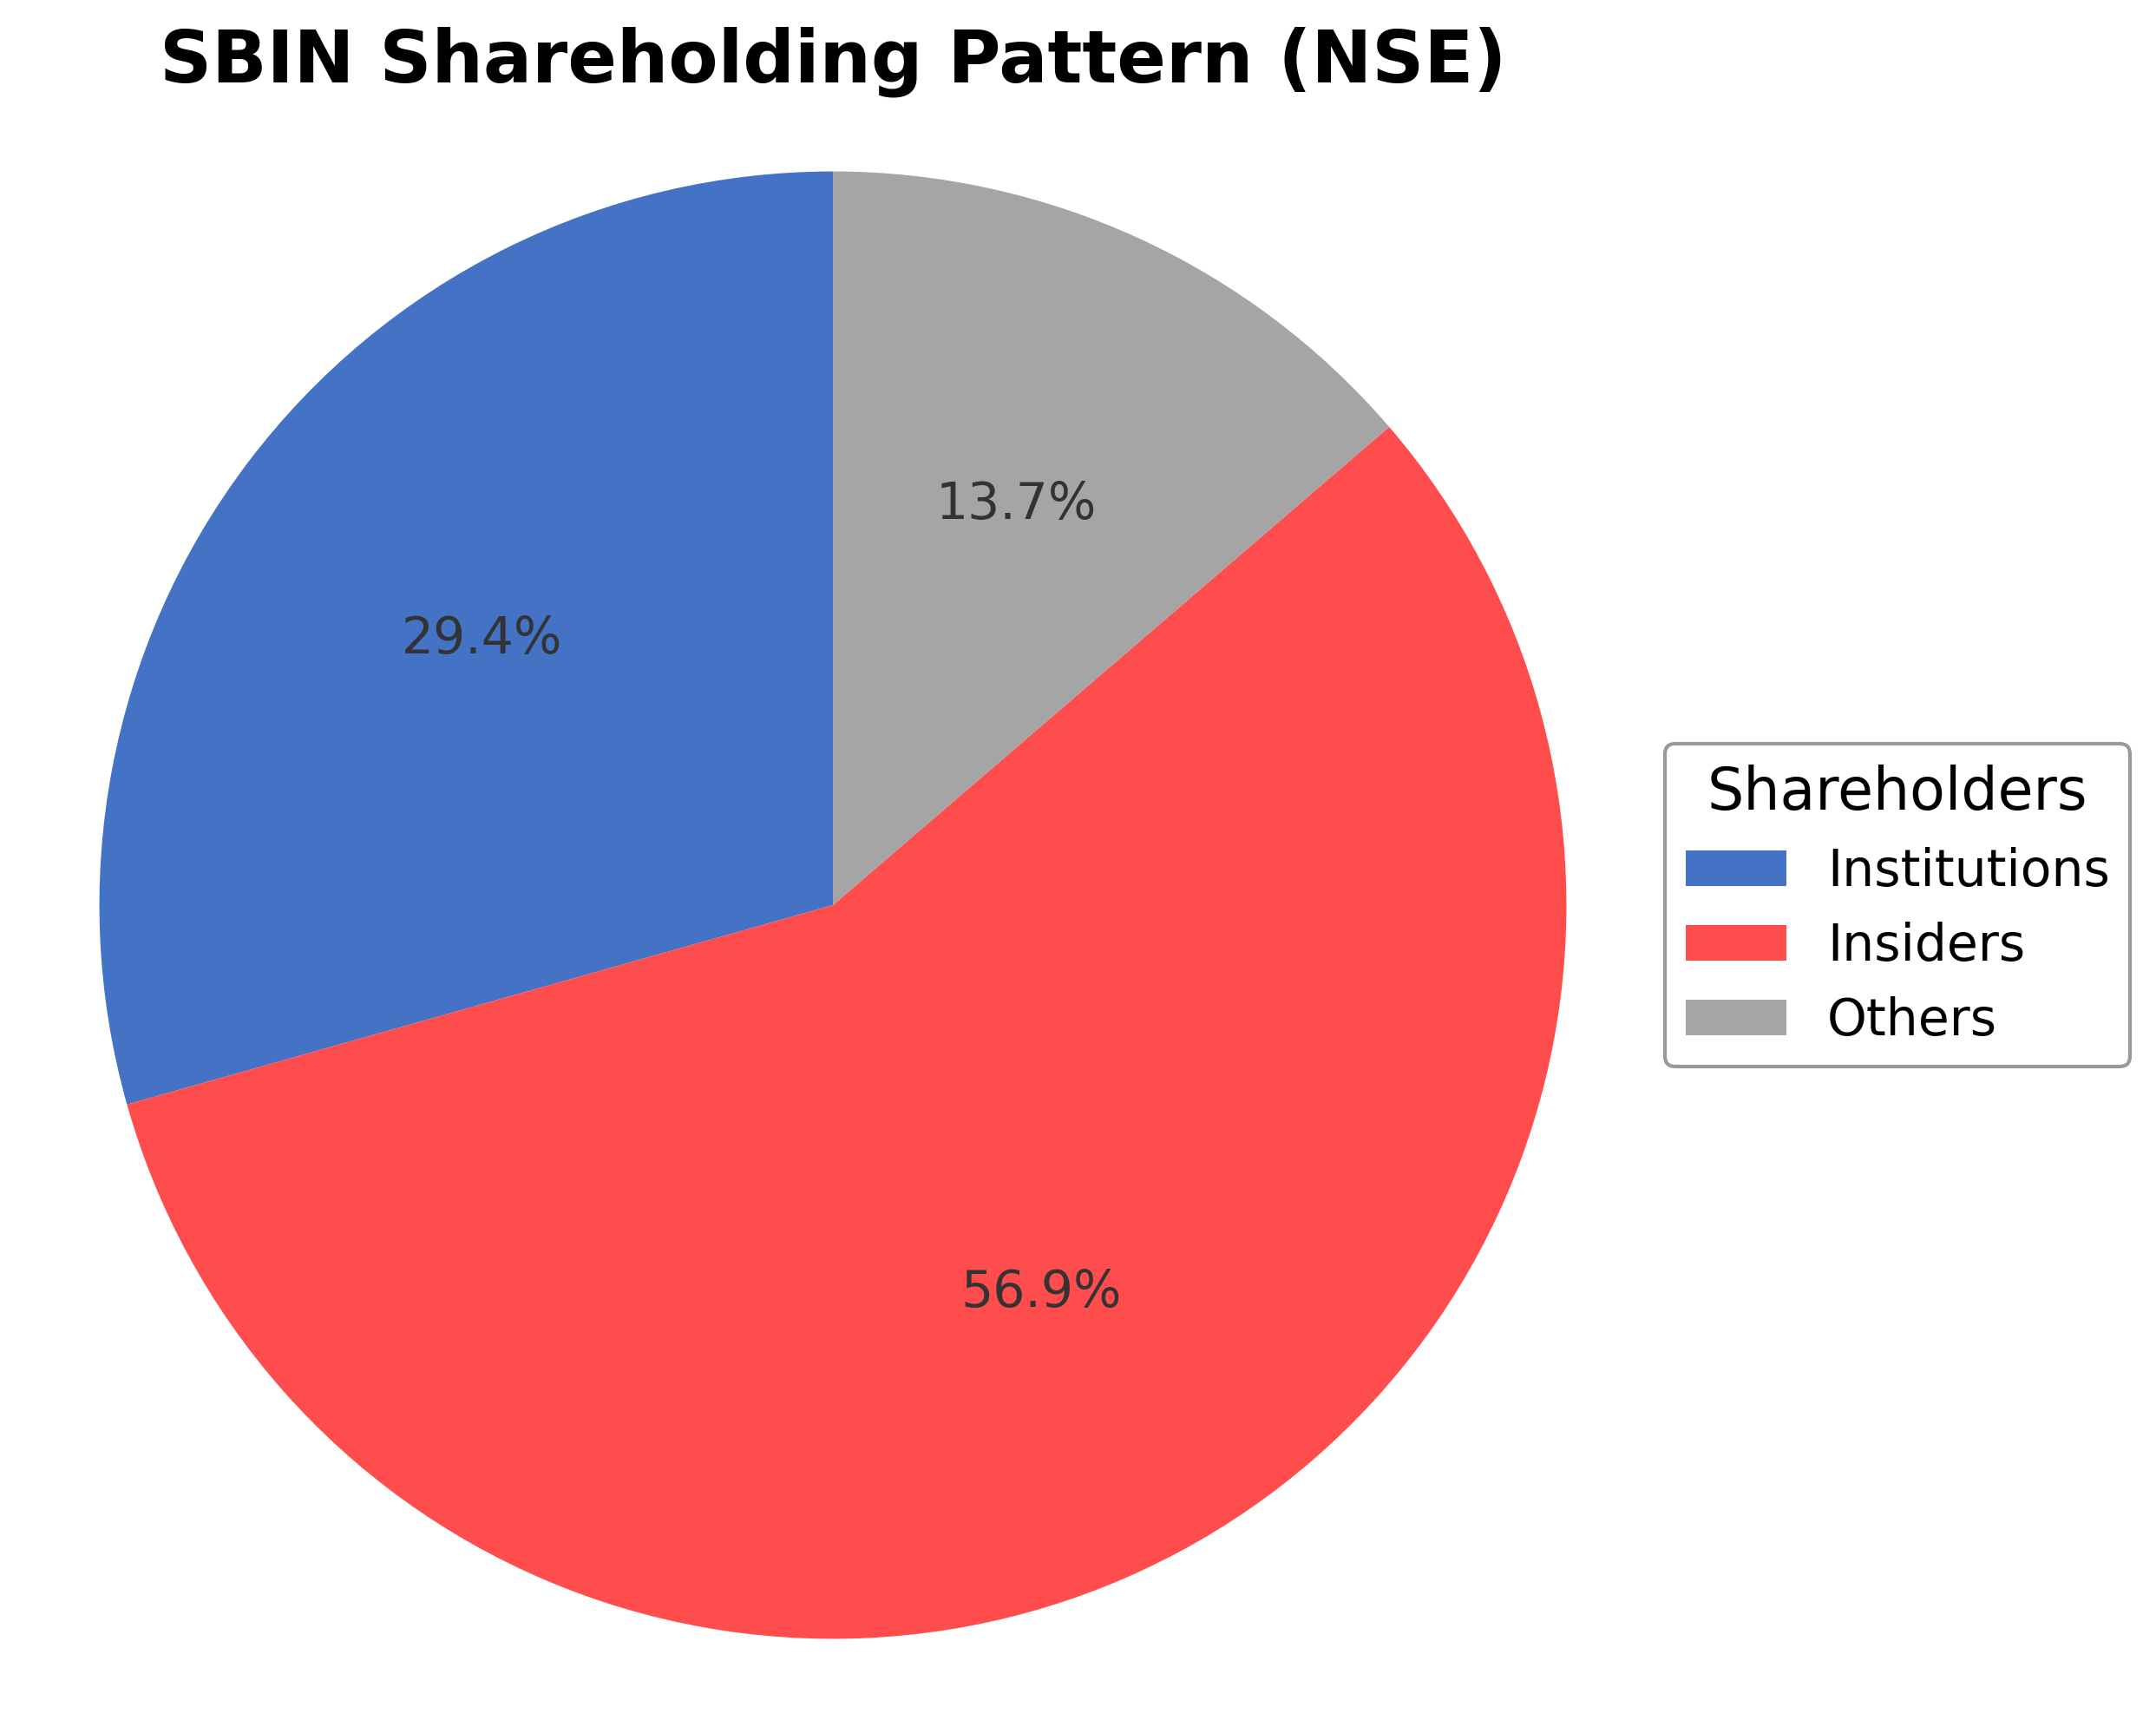
Shareholding Pattern
Sector and Industry Analysis
The Indian banking sector, valued at approximately USD 450 billion in 2023, has experienced steady growth driven by a combination of public, private, and foreign banks. Major players such as State Bank of India (SBI), HDFC Bank, and ICICI Bank dominate the market with extensive branch networks and strong digital capabilities. The sector benefits from a rapidly expanding middle class and increasing financial inclusion, supported by government initiatives that have significantly increased banking penetration across urban and rural areas.
Industry trends highlight a strong shift towards digital transformation, with mobile and internet banking services becoming central to customer engagement and operational efficiency. Collaborations between banks and fintech firms are fostering innovation, exemplified by AI-powered lending platforms targeting SMEs. Despite growth opportunities, challenges such as high non-performing assets (NPAs), cybersecurity risks, and intense competition create barriers that require robust risk management and technological investments for sustained competitiveness.
The regulatory environment is shaped by initiatives like the Pradhan Mantri Jan Dhan Yojana (PMJDY), which has expanded financial inclusion, and the Digital India campaign, which promotes digital banking adoption. The Insolvency and Bankruptcy Code (IBC) has improved resolution of stressed assets, enhancing sector stability. Recent tightening of compliance norms by the Reserve Bank of India (RBI) increases transparency and accountability but also raises operational complexities for banks.
Note: Analysis synthesized from industry research, market reports, and regulatory filings. Information is subject to change based on market conditions.
Financial Ratios Dashboard
Illustrative Scenario Analysis
DCF Assumptions:
Method: Two-Stage EPS-Priority Model
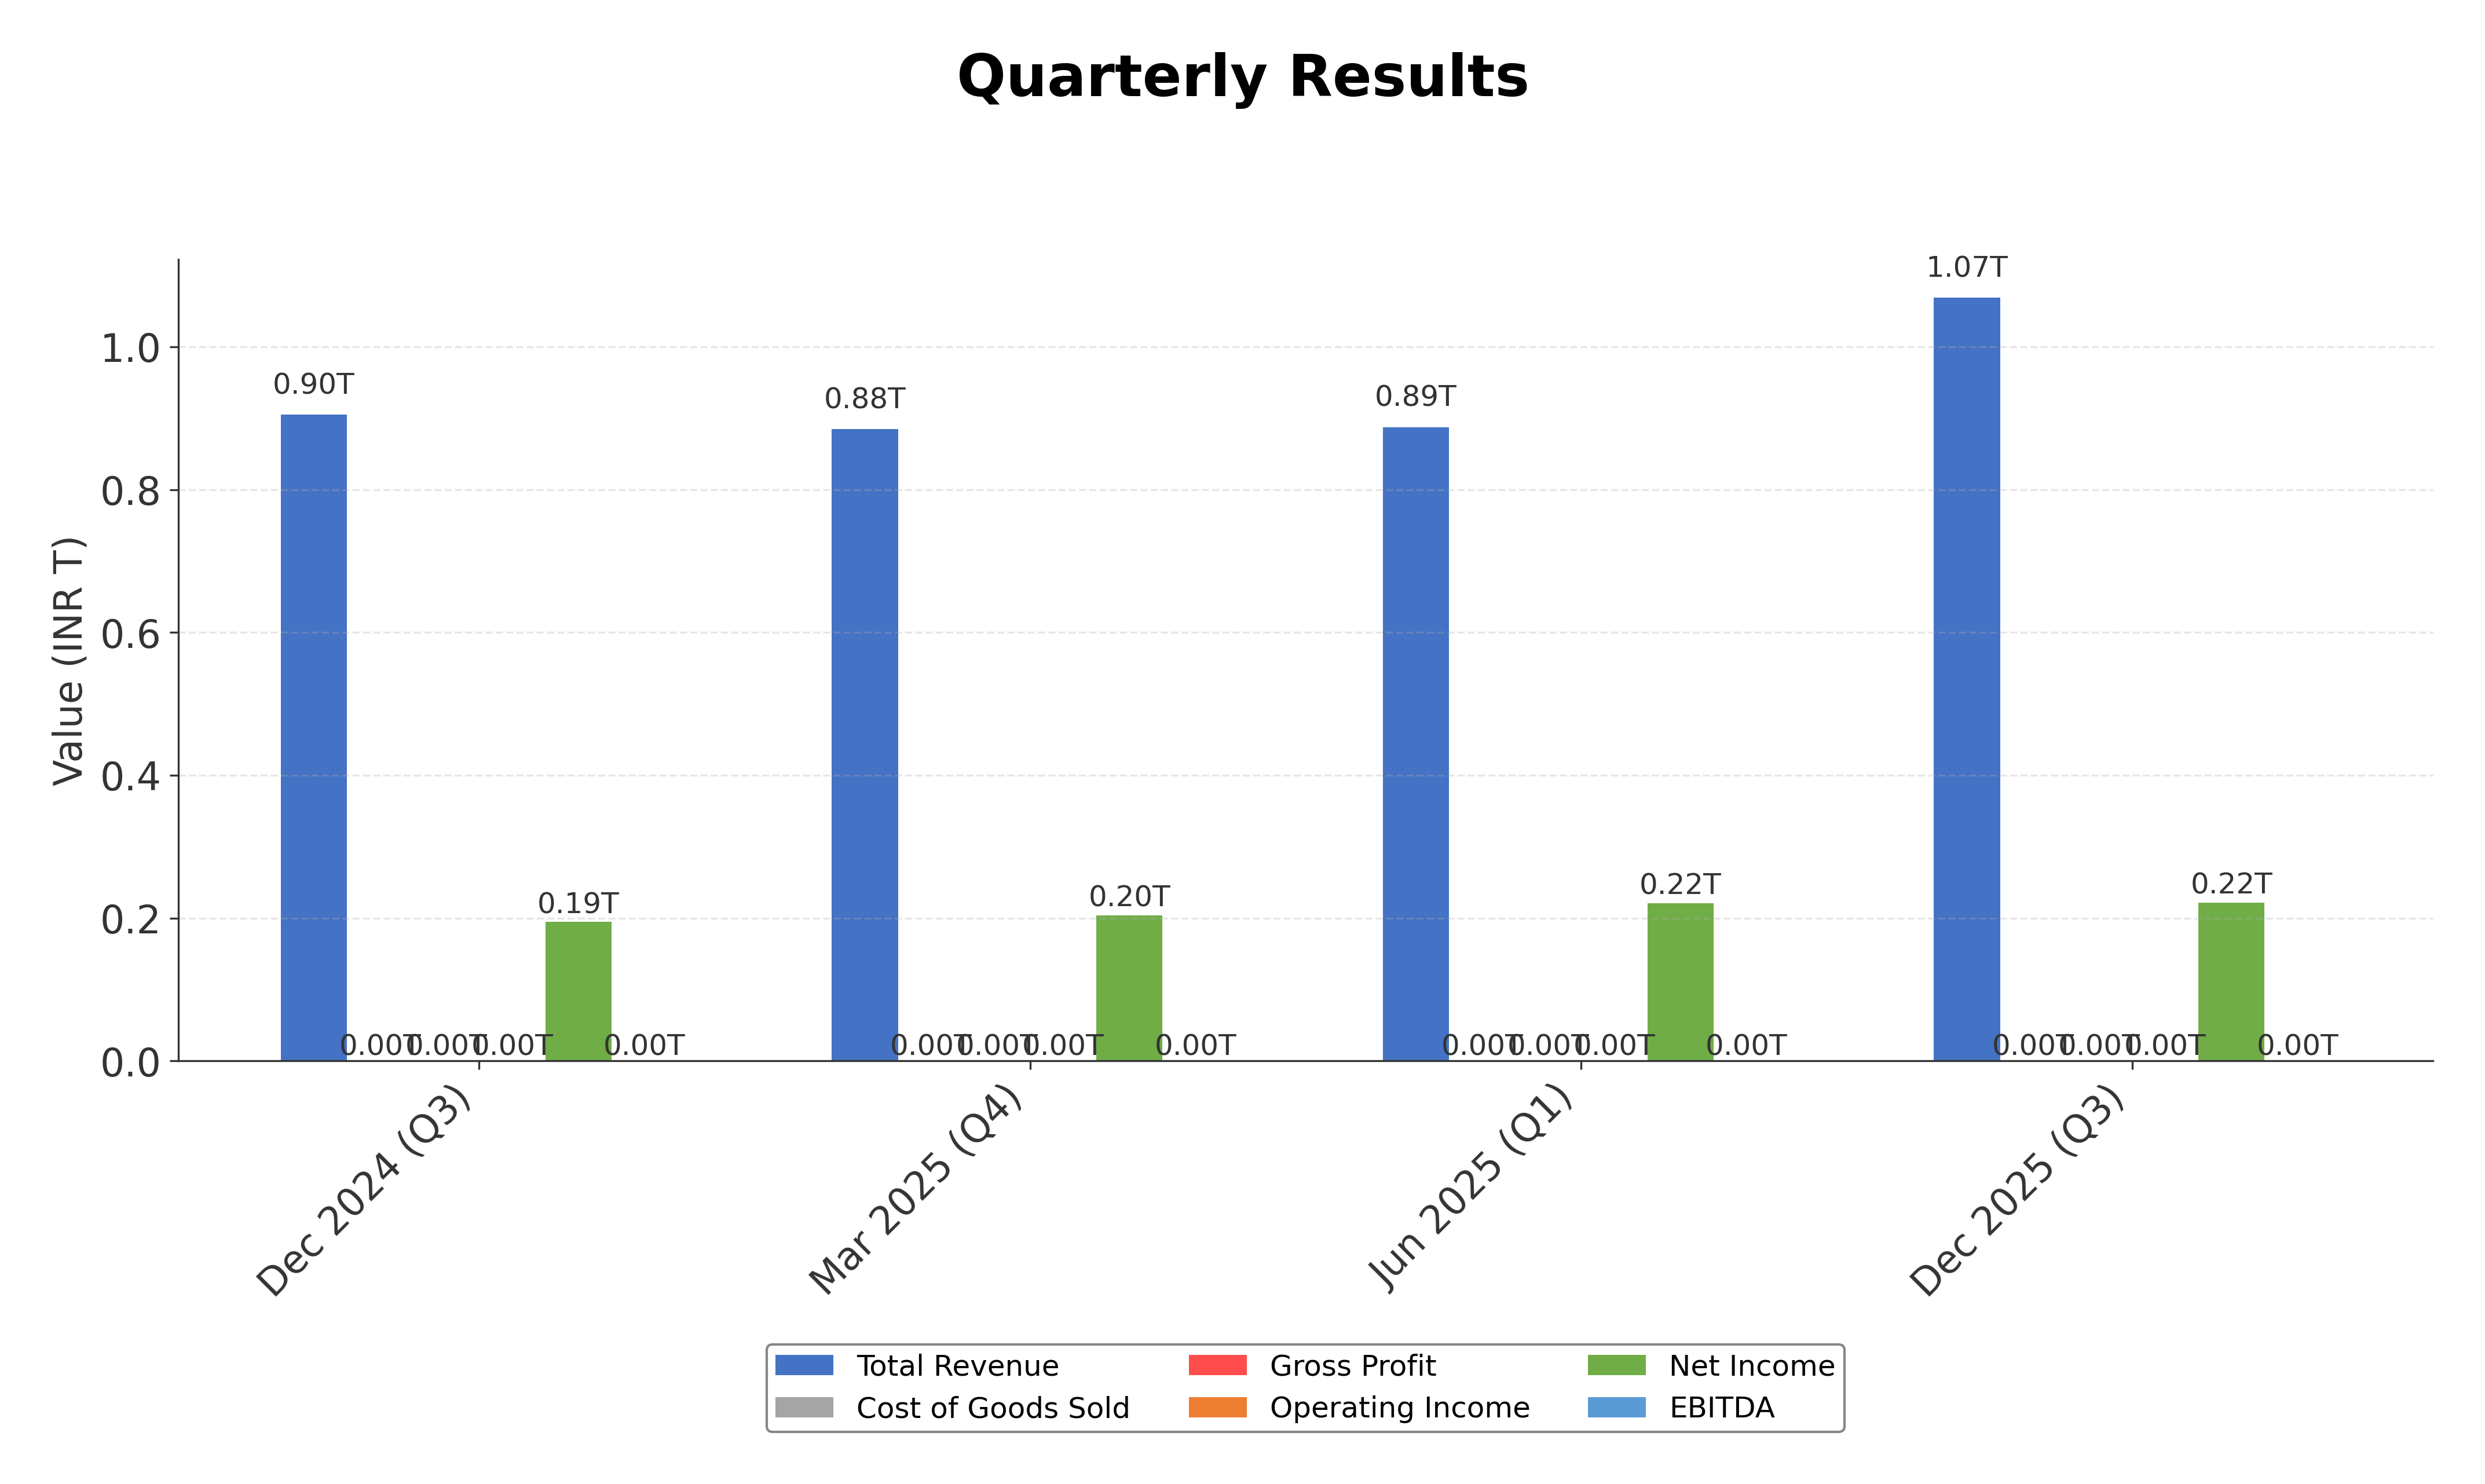
Financials
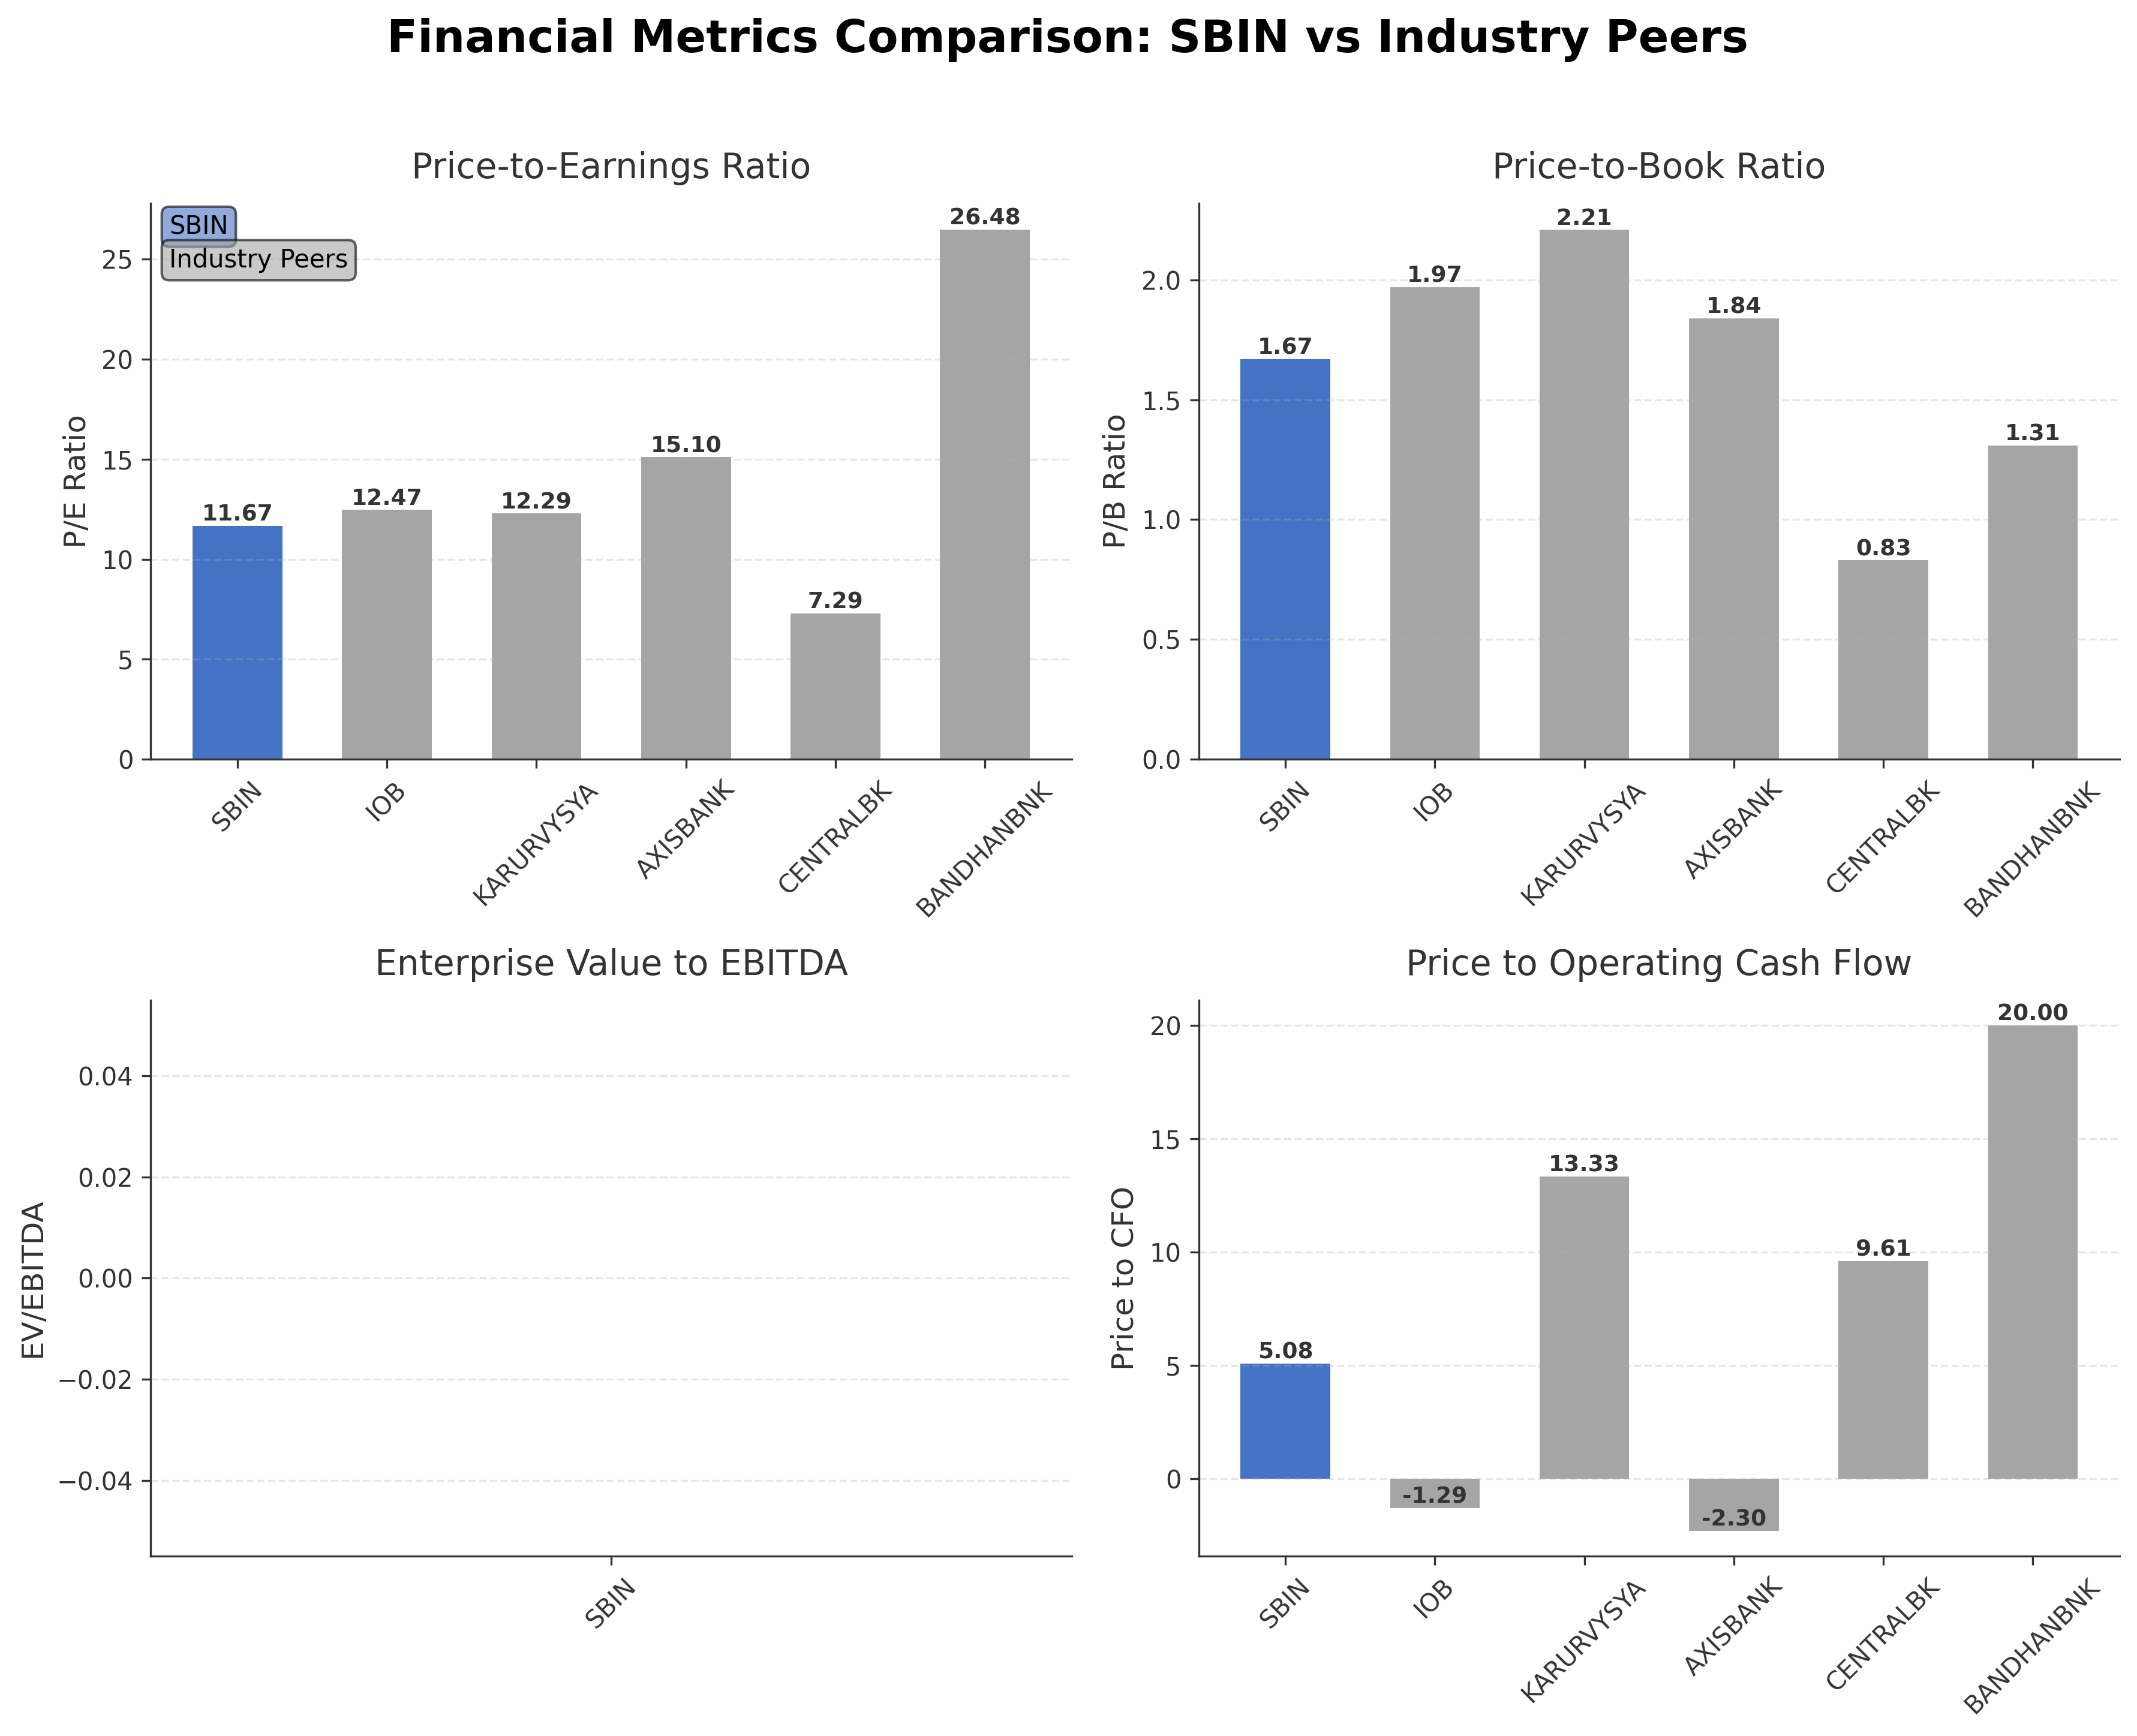
Peer Analysis
| Company Name | Market Cap | P/E Ratio | P/B Ratio | EV/EBITDA | Price to CFO |
|---|---|---|---|---|---|
| State Bank of India | ₹9.86T | 11.67 | 1.67 | N/A | 5.08 |
| Indian Overseas Bank | ₹673.98B | 12.47 | 1.97 | N/A | -1.29 |
| Karur Vysya Bank Ltd. | ₹283.70B | 12.29 | 2.21 | N/A | 13.33 |
| Axis Bank Ltd. | ₹3.94T | 15.10 | 1.84 | N/A | -2.30 |
| Central Bank of India | ₹329.65B | 7.29 | 0.83 | N/A | 9.61 |
| Bandhan Bank Ltd. | ₹321.74B | 26.48 | 1.31 | N/A | 20.00 |
Comparison Analysis: State Bank of India holds the largest market capitalization among its peers at ₹9.86 trillion, reflecting its dominant position in the regional banking sector. Its P/E ratio of 11.67 is moderate compared to peers, lower than Axis Bank’s 15.10 and Bandhan Bank’s 26.48, indicating relatively attractive valuation. The P/B ratio of 1.67 is higher than Central Bank of India’s 0.83 but lower than Karur Vysya Bank’s 2.21, suggesting balanced market pricing relative to book value. SBI’s return on equity at 15.36% is among the highest, demonstrating efficient capital utilization. Price to CFO at 5.08 is positive compared to negative values for some peers, indicating healthier cash flow generation. Overall, SBI’s scale and profitability metrics position it as a strong regional banking leader with competitive valuation.
Financial Metrics Comparison with Peers
Financial Statements
Comprehensive financial data including income, balance sheet, and cash flow metrics
Income Statement
| fiscal_date | 2025-03-31 | 2024-03-31 | 2023-03-31 | 2022-03-31 | 2021-03-31 |
|---|---|---|---|---|---|
| Sales | 3495.23B | 3236.14B | 2703.37B | 2360.91B | 1873.94B |
| Operating Expense Selling General And Administrative | 47.84B | 44.23B | 42.21B | 34.26B | 31.46B |
| Operating Expense Other Operating Expenses | 1388.58B | 282.21B | 266.48B | 254.05B | 294.46B |
| Pretax Income | 1063.65B | 912.40B | 753.99B | 497.39B | 327.96B |
| Income Tax | 273.48B | 231.02B | 188.40B | 133.82B | 85.16B |
| Net Income | 805.23B | 695.43B | 577.50B | 371.83B | 238.88B |
| Eps Basic | 86.91 | 75.17 | 62.35 | 39.64 | 25.11 |
| Eps Diluted | 86.91 | 75.17 | 62.35 | 39.64 | 25.11 |
| Basic Shares Outstanding | 8.92B | 8.92B | 8.92B | 8.92B | 8.92B |
| Diluted Shares Outstanding | 8.92B | 8.92B | 8.92B | 8.92B | 8.92B |
| Net Income Continuous Operations | 1049.09B | 901.86B | 744.88B | 487.56B | 309.22B |
| Minority Interests | -29.61B | -24.59B | -21.02B | -18.09B | -14.82B |
Source: Financial statements and regulatory filings
Balance Sheet
| fiscal_date | 2025-03-31 | 2024-03-31 | 2023-03-31 | 2022-03-31 | 2021-03-31 |
|---|---|---|---|---|---|
| Cash And Cash Equivalents | 6208.49B | 5975.68B | 5369.03B | 5945.23B | 5318.00B |
| Accounts Receivable | N/A | N/A | N/A | N/A | N/A |
| Total Assets | 73141.85B | 67337.79B | N/A | N/A | N/A |
| Total Liabilities | 68091.23B | 63032.22B | N/A | N/A | N/A |
| Long Term Debt | 6181.25B | 5565.03B | 5220.93B | 4576.90B | 4265.69B |
| Shareholders Equity | 5050.63B | 4305.57B | 3717.68B | 3167.95B | 2851.87B |
Source: Financial statements and regulatory filings
Cash Flow Statement
| fiscal_date | 2025-03-31 | 2024-03-31 | 2023-03-31 | 2022-03-31 | 2021-03-31 |
|---|---|---|---|---|---|
| Operating Activities Net Income | 1049.09B | 901.86B | 744.88B | 487.56B | 309.22B |
| Operating Activities Other Non Cash Items | 119.23B | 96.62B | 65.44B | 55.88B | 59.00B |
| Operating Activities Other Assets Liabilities | 773.75B | 562.63B | 151.82B | 917.20B | 12.16B |
| Operating Activities Operating Cash Flow | 1942.07B | 1561.11B | 962.14B | 1460.64B | 380.38B |
| Investing Activities Capital Expenditures | -56.37B | -41.75B | -40.44B | -30.51B | -38.28B |
| Investing Activities Net Acquisitions | -65.19M | -821.61M | 0.00 | -5.71B | 885.98M |
| Investing Activities Investing Cash Flow | -56.44B | -42.57B | -40.44B | -36.22B | -37.39B |
| Financing Activities Long Term Debt Issuance | 215.00B | 201.65B | 195.33B | 140.74B | 274.31B |
| Financing Activities Long Term Debt Payments | -151.04B | -142.88B | -21.25B | -105.18B | -168.98B |
| Financing Activities Common Stock Issuance | 1.29M | 0.00 | 64.00K | 0.00 | 0.00 |
| Financing Activities Common Dividends | -122.27B | -100.85B | -63.37B | -35.70B | N/A |
| Financing Activities Other Financing Charges | 23.62B | 29.01B | 16.40B | 15.81B | 16.78B |
| Financing Activities Financing Cash Flow | -34.68B | -13.07B | 127.11B | 15.66B | 122.12B |
| End Cash Position | 3579.33B | 3265.72B | 3183.12B | 3989.05B | 3477.07B |
| Free Cash Flow | 428.49B | 174.57B | -900.57B | 543.90B | 860.09B |
| Financing Activities Common Stock Repurchase | N/A | N/A | N/A | 0.00 | 0.00 |
| Investing Activities Net Intangibles | N/A | N/A | N/A | N/A | -59.00K |
| Investing Activities Other Investing Activity | N/A | N/A | N/A | N/A | N/A |
Source: Financial statements and regulatory filings
Technical Analysis
Key Insights
- The current trend for SBI is upward with price action maintaining above key moving averages, indicating bullish momentum.
- Key support levels are identified near ₹975 (200-day moving average) and ₹1,090 (50-day moving average), with resistance around the 52-week high of ₹1,234.7.
- The stock price is trading above the 10-day, 50-day, and 200-day moving averages, signaling sustained positive momentum across short and long-term frames.
- Momentum indicators show RSI in neutral to slightly bullish territory, MACD above signal line, and stochastic oscillators indicating potential continuation of upward movement.
- Multi-timeframe analysis reveals consistent strength on daily, weekly, and monthly charts, supporting the current positive trend.
- Potential market scenarios include a breakout above resistance leading to further gains or a pullback to support levels if profit-taking occurs.
Trending News
1. Headline: State Bank of India Releases Audio Recording of Post-Earnings Investor Meeting for Q4FY26
Summary: State Bank of India has released the audio recording of its post-earnings investor and analyst meeting held on 08.05.2026 at 05.15 pm, pertaining to financial results for the quarter and year ended 31.03.2026. The disclosure was made under Regulation 30 of the SEBI (Listing Obligations and ...
Sentiment: neutral
2. Headline: State Bank of India Sets Record Date and Payout Schedule for FY 2025-26 Dividend - TipRanks.com
Summary: State Bank of India ( ($IN:SBIN) ) has issued an announcement. State Bank of India’s Central Board has declared a dividend of ₹17.35 per fully paid equity share of ...
Sentiment: neutral
3. Headline: State Bank of India (SBI) Q4 earnings: Net profit rises 5.6% to ₹19,684 crore, NII advances 4% to ₹44,380 crore
Summary: SBI's net interest income rose 4% to ₹44,380 crore at the end of March quarter from ₹42,617.84 crore in the corresponding period last year.
Sentiment: positive
4. Headline: SBI dividend: India's largest lender announces ₹17.35/share dividend. Check record date | Stock Market News
Summary: Throughout her career, she has ... digital newsrooms has given her an edge in simplifying complex market concepts without losing analytical depth. Outside of work, Saloni enjoys reading books and spending time with her pet. State Bank Of IndiaSBIQ4 ResultsIndian Stock MarketDividendGet ...
Sentiment: positive
5. Headline: SBI Q4 Earnings: Analysts Bullish, Market Cautious | Whalesbook
Summary: State Bank of India faces Q4 earnings scrutiny amidst positive analyst ratings, but current stock underperformance and sector headwinds pose challenges.
Sentiment: negative
Recent Updates
News Summary
As of 2026-05-08. State Bank of India reported a 5.6% increase in net profit to ₹19,684 crore for Q4FY26, supported by a 4% rise in net interest income to ₹44,380 crore. The bank’s asset quality improved with gross NPAs declining to 1.49%. For the full fiscal year 2025-26, SBI posted a record net profit of ₹80,032 crore, growing 12.88% year-over-year. Advances crossed ₹49 trillion with strong growth in retail, SME, and corporate loan portfolios. The bank declared a dividend of ₹17.35 per share for FY26, reflecting robust financial health and shareholder returns. The post-earnings investor meeting highlighted stable capital adequacy at 15.4% and ongoing focus on digital banking expansion.
News Sentiment
The overall sentiment from recent updates is mixed to positive. Strong earnings growth and improved asset quality underpin a positive tone, supported by dividend announcements and record profit levels. However, market caution is evident due to margin compression and concerns about potential credit risks in certain loan segments. The balanced sentiment reflects confidence in core banking operations tempered by vigilance on macroeconomic and sector-specific challenges. The outlook remains cautiously optimistic based on current financial performance and strategic initiatives.
Source List
Analytical Overview
Analysis Summary
State Bank of India’s valuation metrics, including a trailing P/E of 11.67 and forward P/E of 11.65, are aligned with the banking industry average of approximately 11.67, suggesting fair market pricing relative to earnings. The P/B ratio of 1.67 is moderate, reflecting balanced valuation against book value.
The bank exhibits a positive growth trajectory with a quarterly revenue growth rate of 14.5% and a 13.1% year-over-year increase in quarterly earnings. Operating cash flow of ₹1.94 trillion and free cash flow of ₹776 billion demonstrate strong cash generation supporting sustainable growth.
Financial health is solid with a total debt-to-equity ratio of 1.12 and a capital adequacy ratio of 15.4%, indicating prudent leverage management. Stable asset quality with gross NPAs at 1.49% further supports credit risk control.
Sector challenges include margin compression due to declining interest rates and potential credit risks in SME and agricultural portfolios amid macroeconomic uncertainties. Opportunities arise from digital banking expansion and growing loan segments.
Considering India-specific factors, SBI benefits from a supportive regulatory environment, increasing financial inclusion, and a growing economy, which underpin demand for banking services and digital adoption.
Overall Business and Market Assessment
Supporting Factors: SBI’s strong profitability metrics with ROE above 15%, consistent revenue and earnings growth, and stable asset quality
Risk Factors: margin pressures from interest rate changes and credit quality in high-growth loan segments
SWOT Analysis
Strengths
- State Bank of India has a dominant market position with extensive branch and digital networks.
- The bank demonstrates strong profitability with a ROE of 15.36% and stable asset quality.
- Robust capital adequacy ratio of 15.4% supports financial stability and growth.
- Diverse loan portfolio with significant growth in retail, SME, and corporate segments.
Weaknesses
- Interest margin compression due to declining interest rates impacts profitability.
- High debt-to-equity ratio of 1.12 indicates leverage that requires careful management.
- Dividend payout ratio of 17.3% may limit retained earnings for reinvestment.
- Dependence on the Indian economy exposes the bank to regional macroeconomic risks.
Opportunities
- Expansion of digital banking through platforms like YONO can drive fee income growth.
- Growing financial inclusion in India offers a large untapped customer base.
- Increasing credit demand from SMEs and agriculture sectors supports loan growth.
- Potential to enhance cross-selling of insurance and investment products.
Threats
- Rising credit risk in SME and agricultural loan portfolios amid economic uncertainties.
- Regulatory changes and compliance costs could impact operational efficiency.
- Competitive pressures from private banks and fintech firms may affect market share.
- Volatility in interest rates could further compress net interest margins.
Company Description
State Bank of India is a prominent public sector bank providing a comprehensive range of financial services in India. Its primary function is to offer banking and financial solutions that cater to the vast and diverse needs of the Indian economy and its populace. As one of the country's largest banks, it plays a crucial role in financing key sectors, including agriculture, infrastructure, and small- and medium-sized enterprises (SMEs). State Bank of India offers a wide array of products, such as personal and corporate loans, savings and investment options, insurance products, and digital banking services, thus supporting economic development and facilitating financial inclusion. The bank is integral to India's banking sector due to its expansive network and significant market share, reflecting its critical position in both national and international financial contexts. Founded in 1955 and headquartered in Mumbai, State Bank of India remains a leading institution, influencing banking norms and contributing to policy-making decisions across the financial spectrum.