


Star Cement Ltd (STARCEMENT)
Stock Analysis Report
Stock Journey
Key Positives and Key Risks
Pros
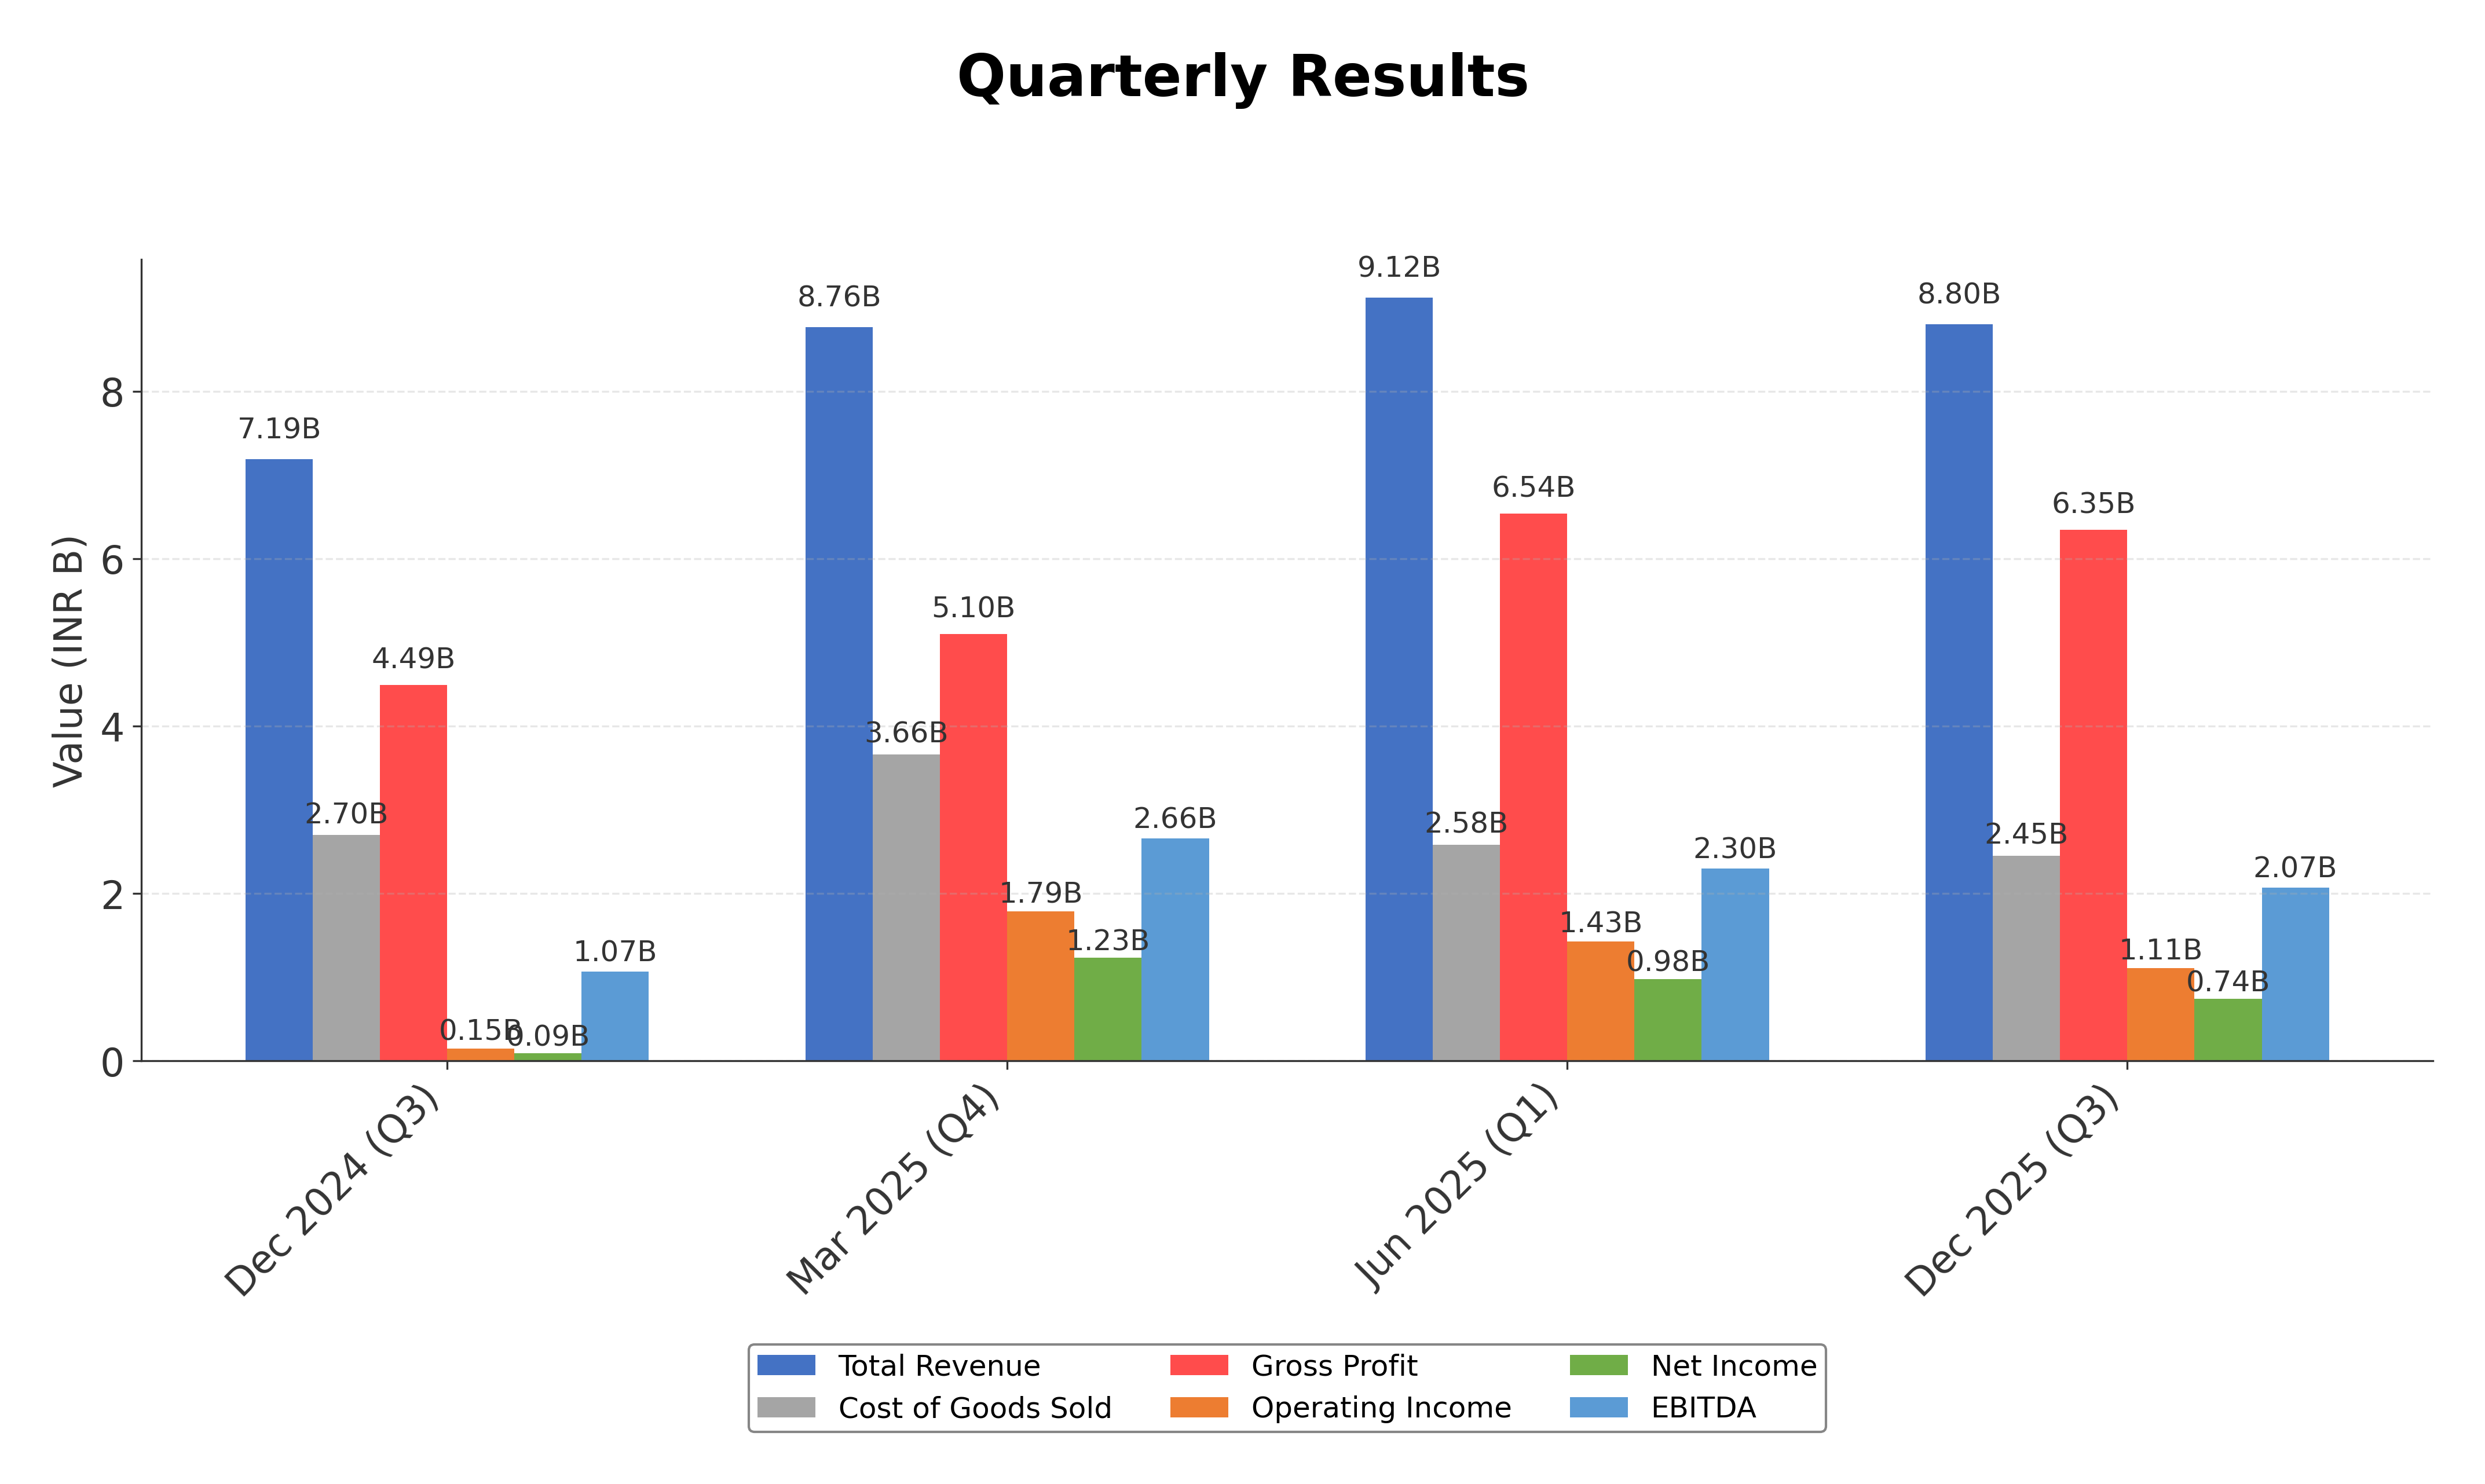
- Revenue growth of 22.4% quarter-over-quarter indicates strong business expansion potential.
- Positive free cash flow of ₹1.69 billion supports operational flexibility and investment capacity.
- Valuation metrics such as trailing P/E of 23.01 and forward P/E of 19.75 align with industry averages, suggesting balanced pricing.
Cons
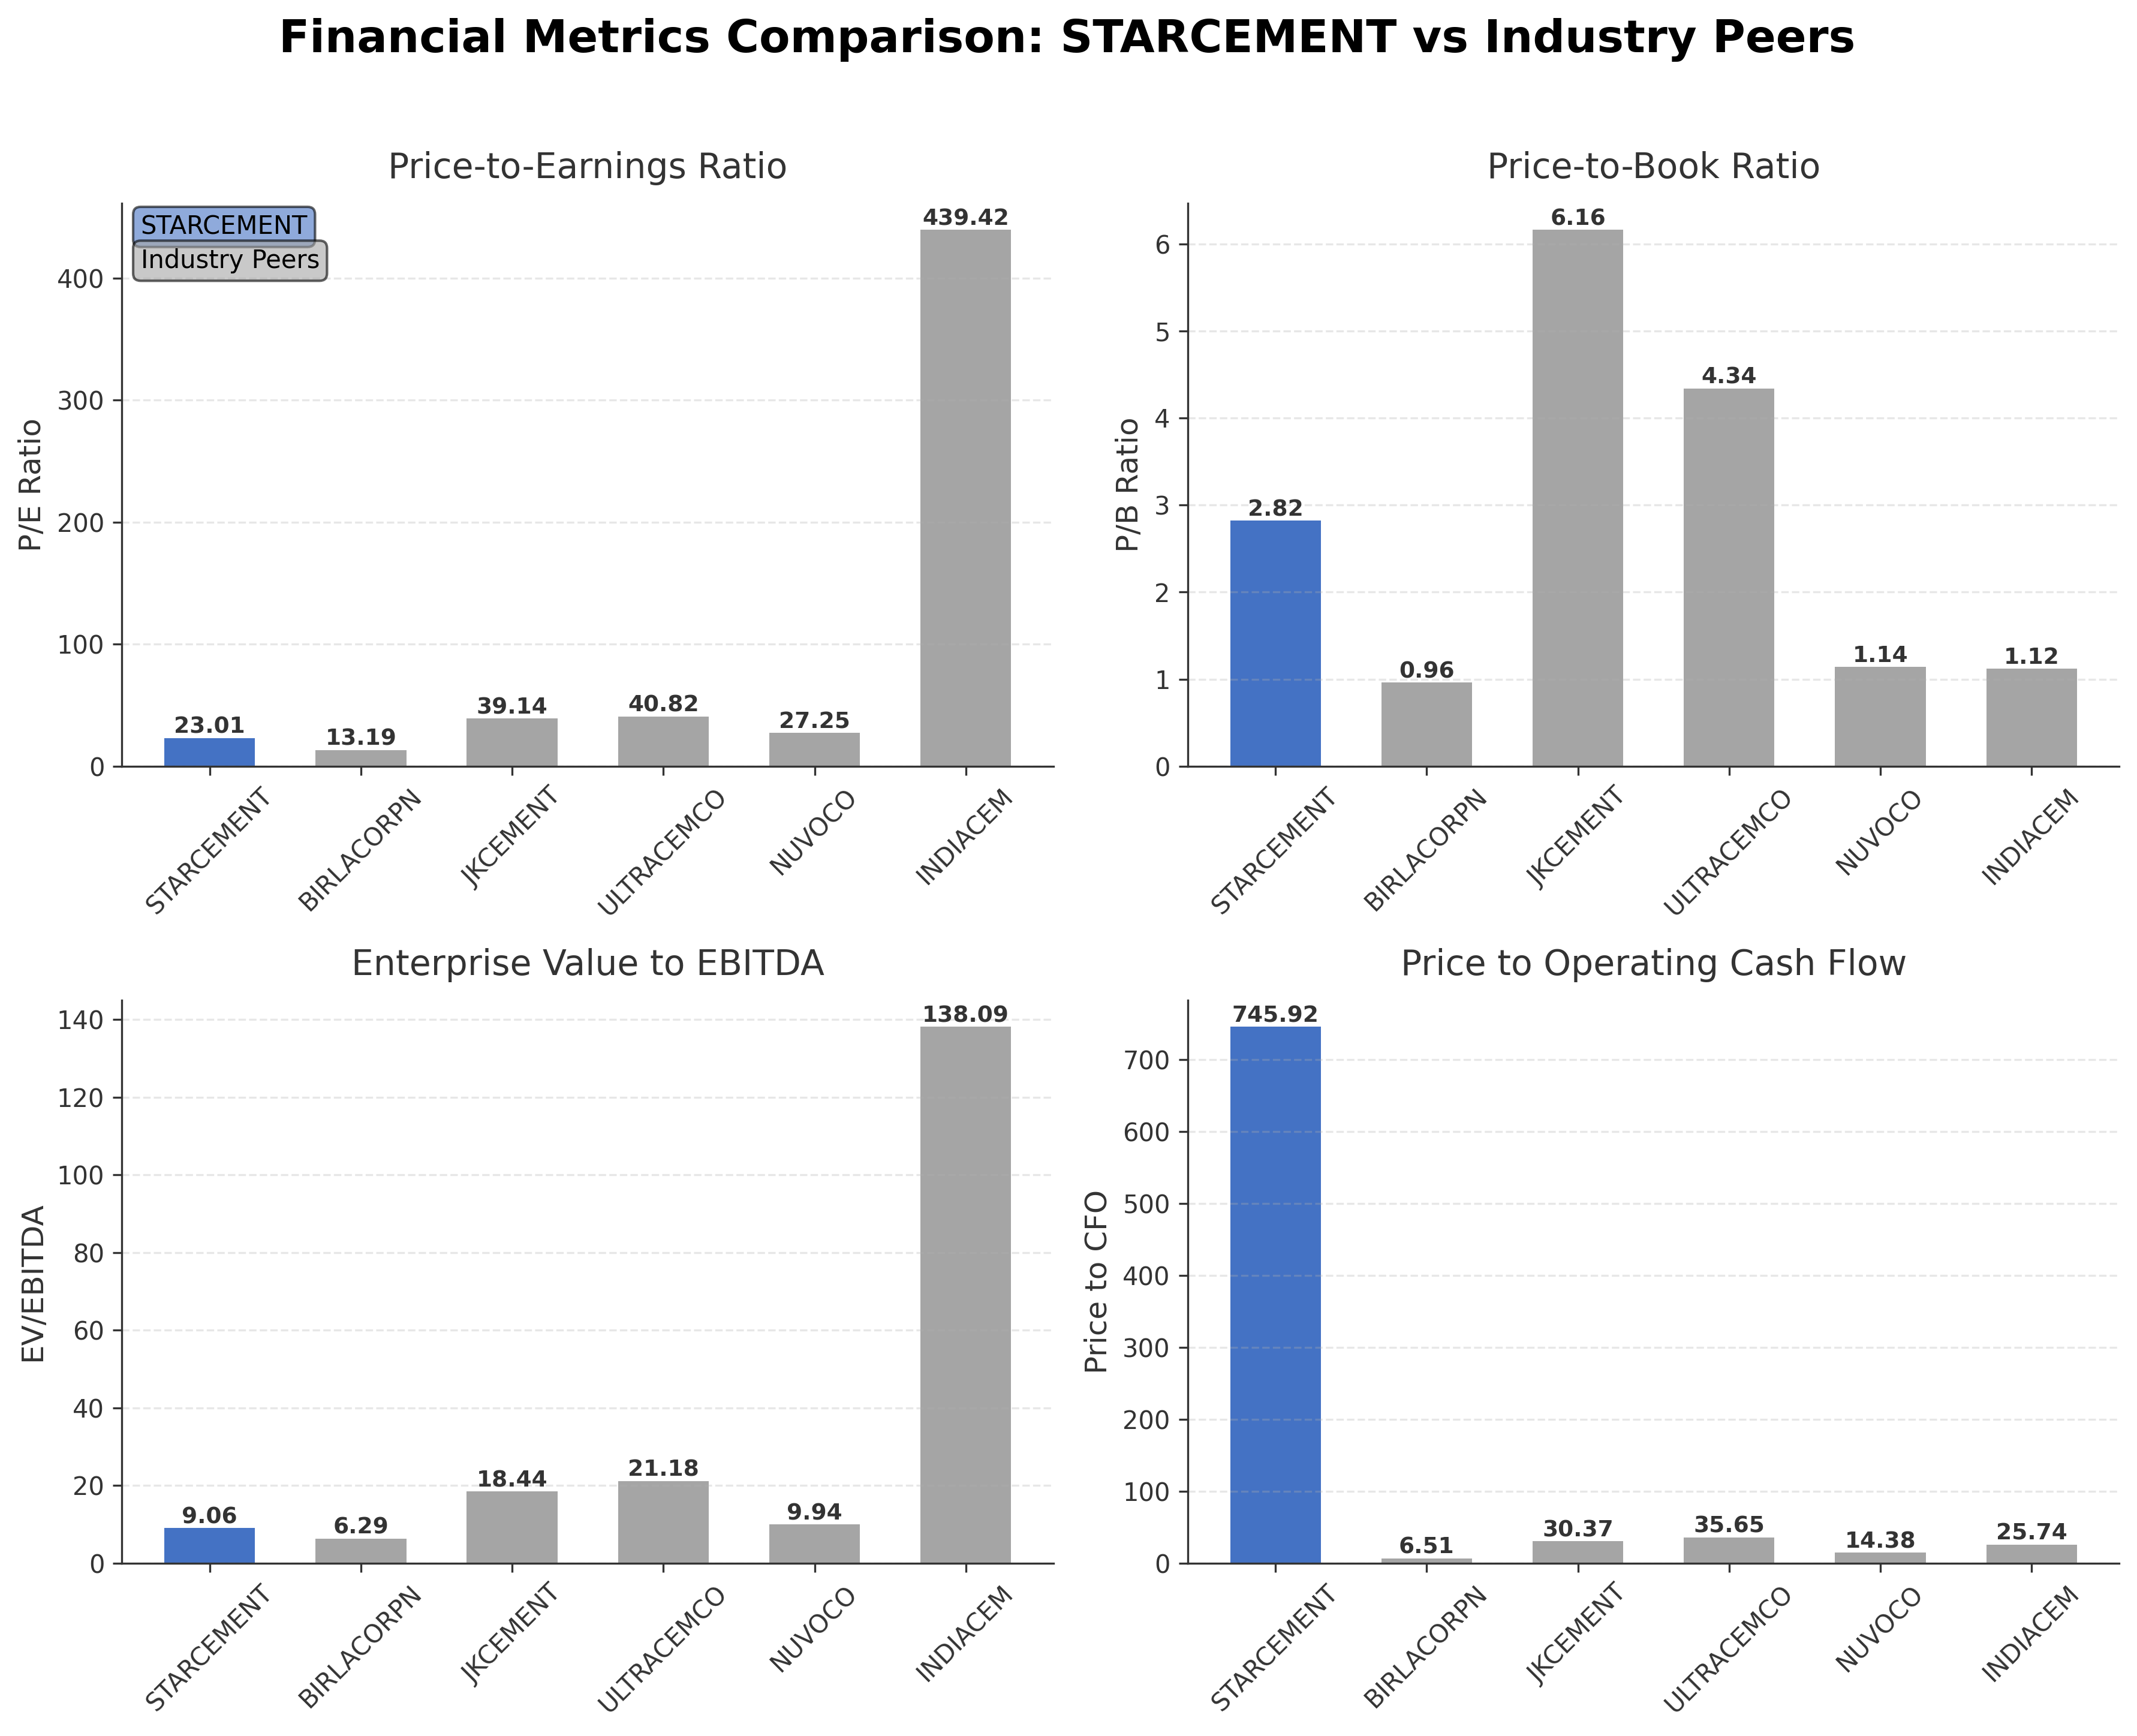
- High price-to-cash-flow ratio of 745.92 significantly exceeds peer levels, indicating potential valuation concerns.
- Environmental opposition to plant development poses operational risks and potential delays.
- Return on equity of 5.87% is modest compared to larger industry peers, reflecting limited profitability.
Disclosure: This information is for general awareness and does not constitute investment advice
Report Summary
Star Cement Ltd. operates within the Indian building materials industry, focusing on the manufacture and distribution of various cement products. The company primarily serves the eastern and northeastern regions of India, offering Ordinary Portland Cement, Portland Pozzolana Cement, and other blended cement types. Its market positioning is characterized by a strong regional presence and a commitment to sustainable manufacturing practices.
Financially, Star Cement reports a market capitalization of approximately â¹84.73 billion and an enterprise value near â¹89.75 billion. The companyâs trailing P/E ratio stands at 23.01 with a forward P/E of 19.75, reflecting valuation metrics aligned with industry averages. Revenue for the trailing twelve months is â¹36.52 billion, with a profit margin of 10.09% and an operating margin of 12.65%. Return on equity is modest at 5.87%, and the company maintains a current ratio of 1.15, indicating reasonable short-term liquidity.
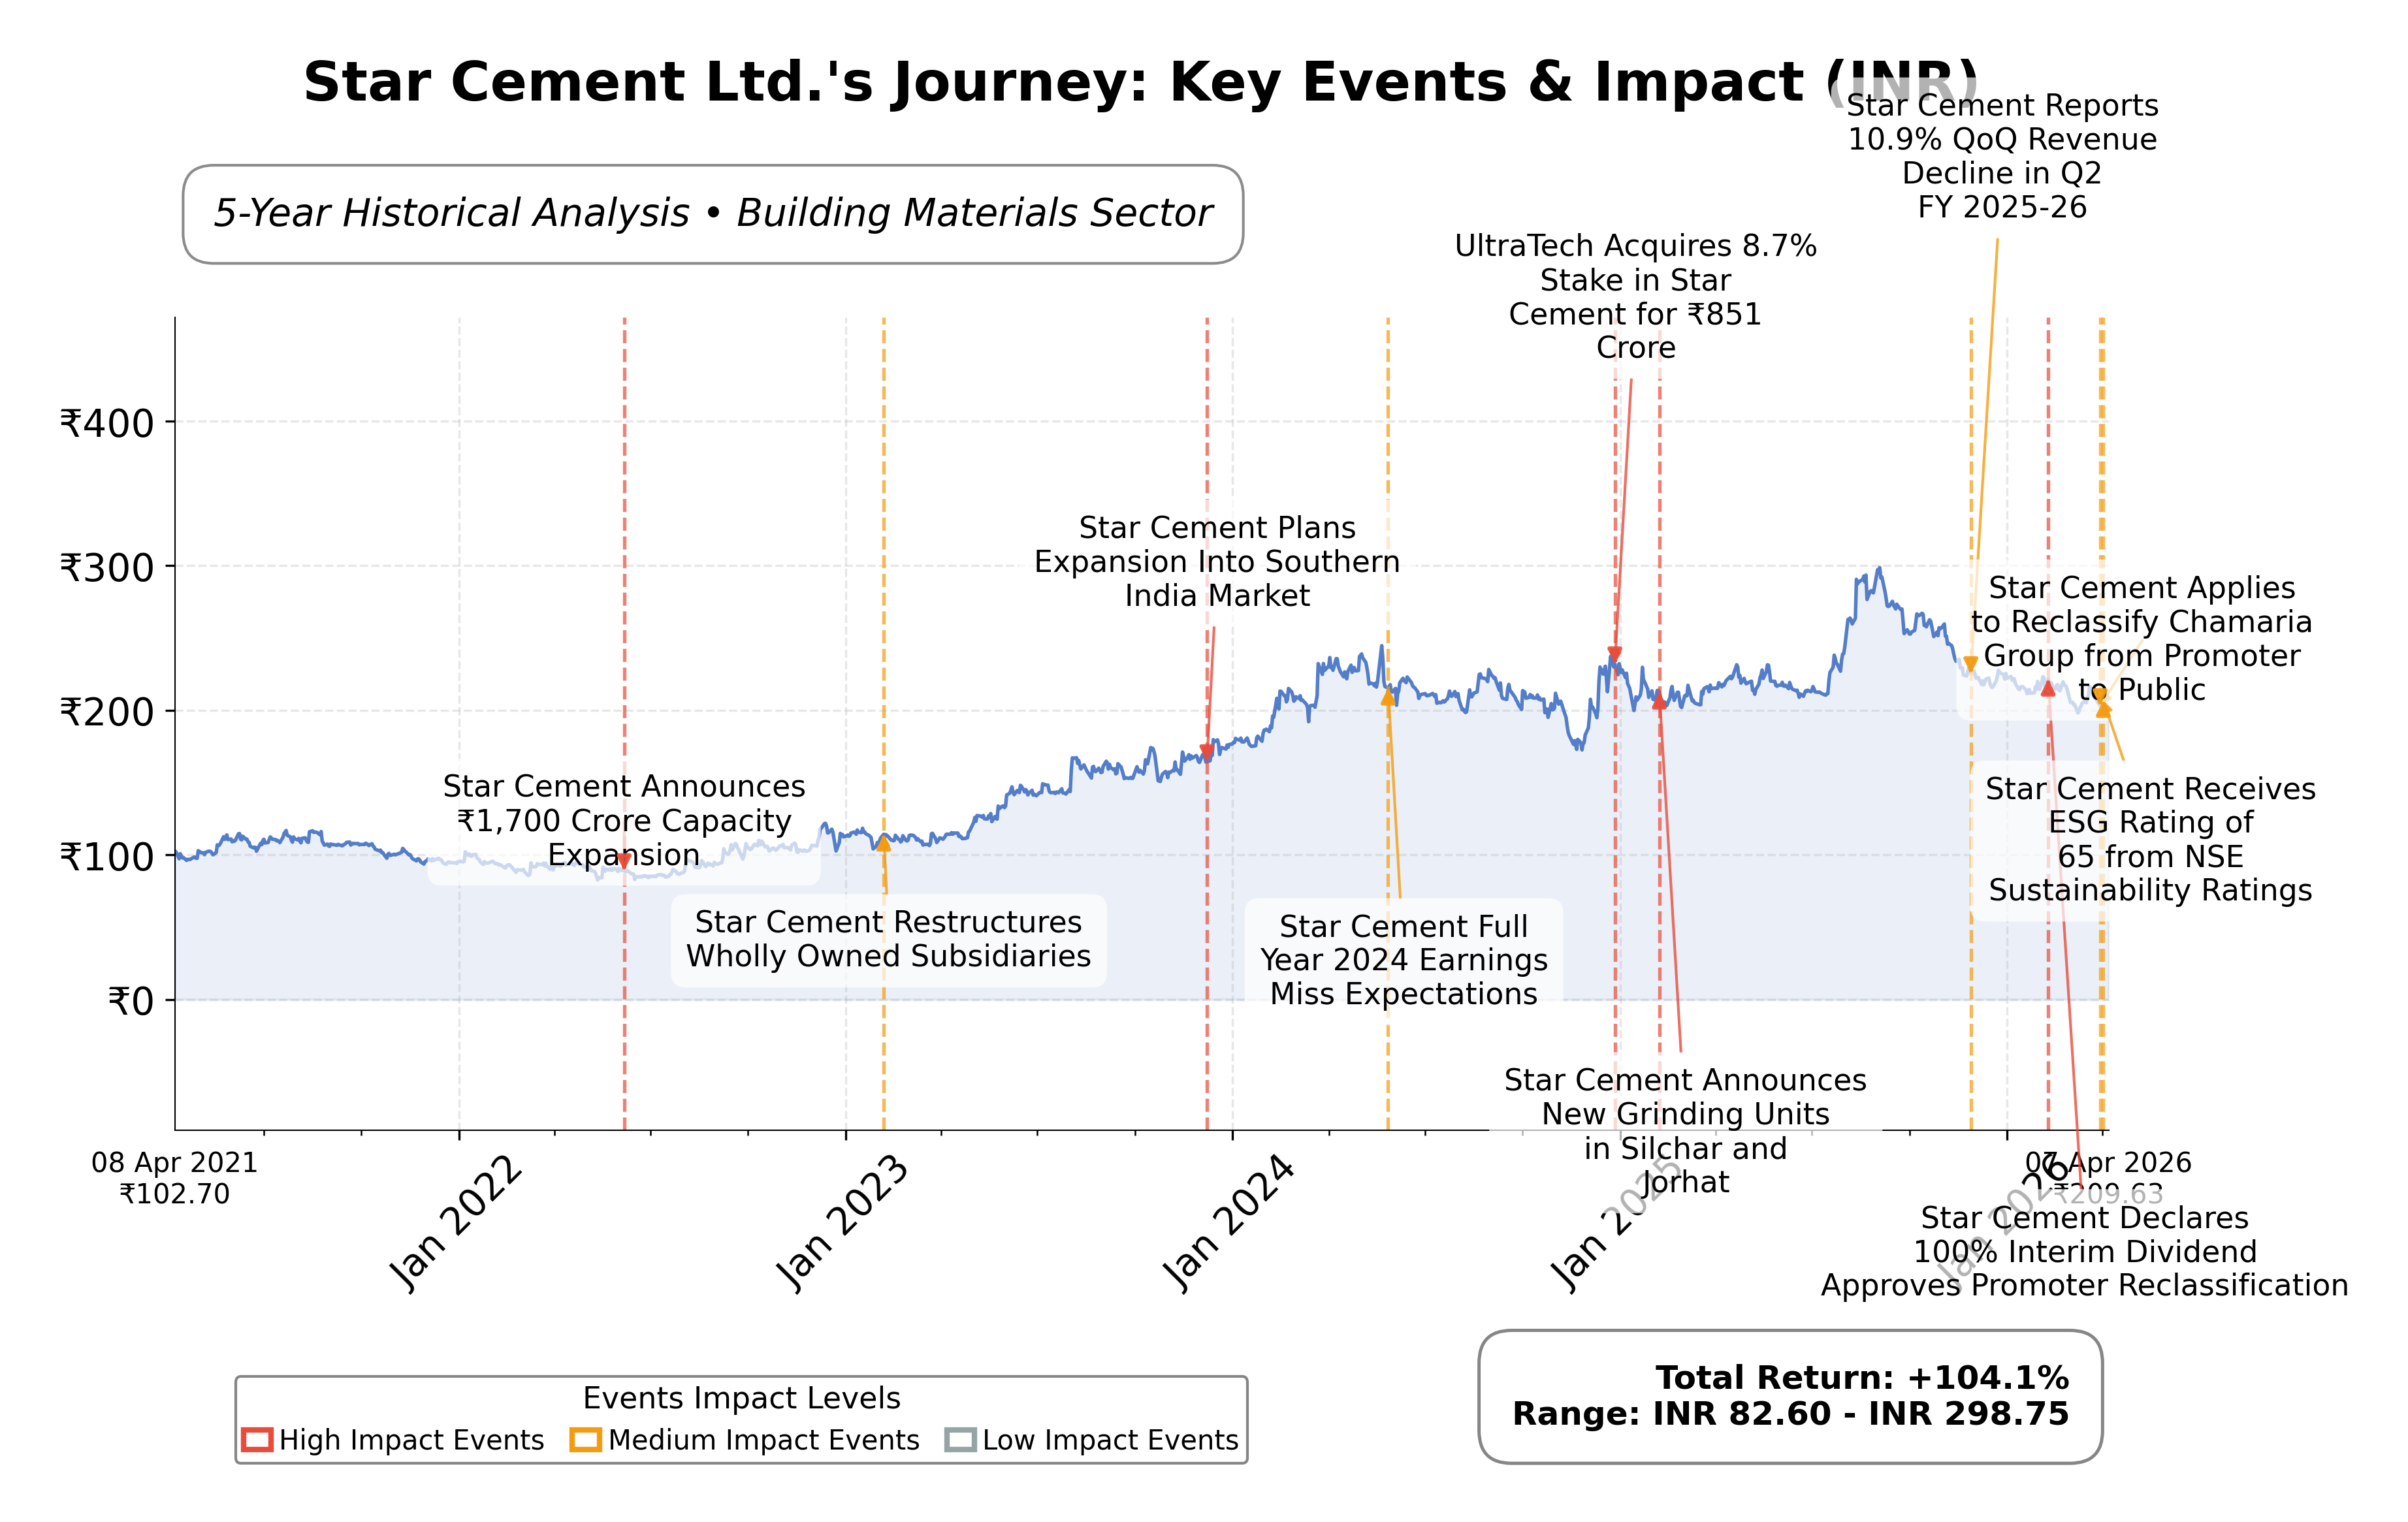
Technically, the stock trades near â¹215.35, below its 52-week high of â¹308.95 and above its 52-week low of â¹196.53, with a beta of -0.091 suggesting low volatility relative to the market. Recent strategic initiatives include emphasis on sustainable manufacturing and energy efficiency. Shareholding is predominantly public with insiders holding less than 1% and institutional investors around 6.2%. Notable strengths include solid gross margins and steady revenue growth, while risks involve sector valuation pressures and environmental opposition in certain regions.
Peer analysis within the Indian cement industry shows Star Cement with a mid-sized market cap compared to larger peers like Ultratech Cement Ltd. (â¹3.12 trillion) and JK Cement Ltd. (â¹399.52 billion). Its valuation metrics such as P/E and EV/EBITDA are moderate relative to peers, with some competitors exhibiting higher profitability and return on equity. The companyâs price-to-cash-flow ratio is significantly higher than peers, indicating potential valuation divergence. This positions Star Cement as a smaller but regionally focused player within a competitive landscape.
Star Cement Ltd. navigates a dynamic industry landscape marked by growth opportunities in infrastructure and urban development alongside challenges such as environmental concerns and valuation shifts. Recent achievements include steady revenue growth and recognition for ESG efforts, while ongoing challenges involve managing environmental opposition and maintaining competitive valuation. The company stands at a pivotal moment where its strategic focus on sustainability and regional dominance could influence its future trajectory. Given the current data, a balanced approach that monitors valuation and sector dynamics may be appropriate for those assessing the stockâs potential.
Company and Industry Overview
Company Basics
Price Performance
Company Size
Shareholding Pattern
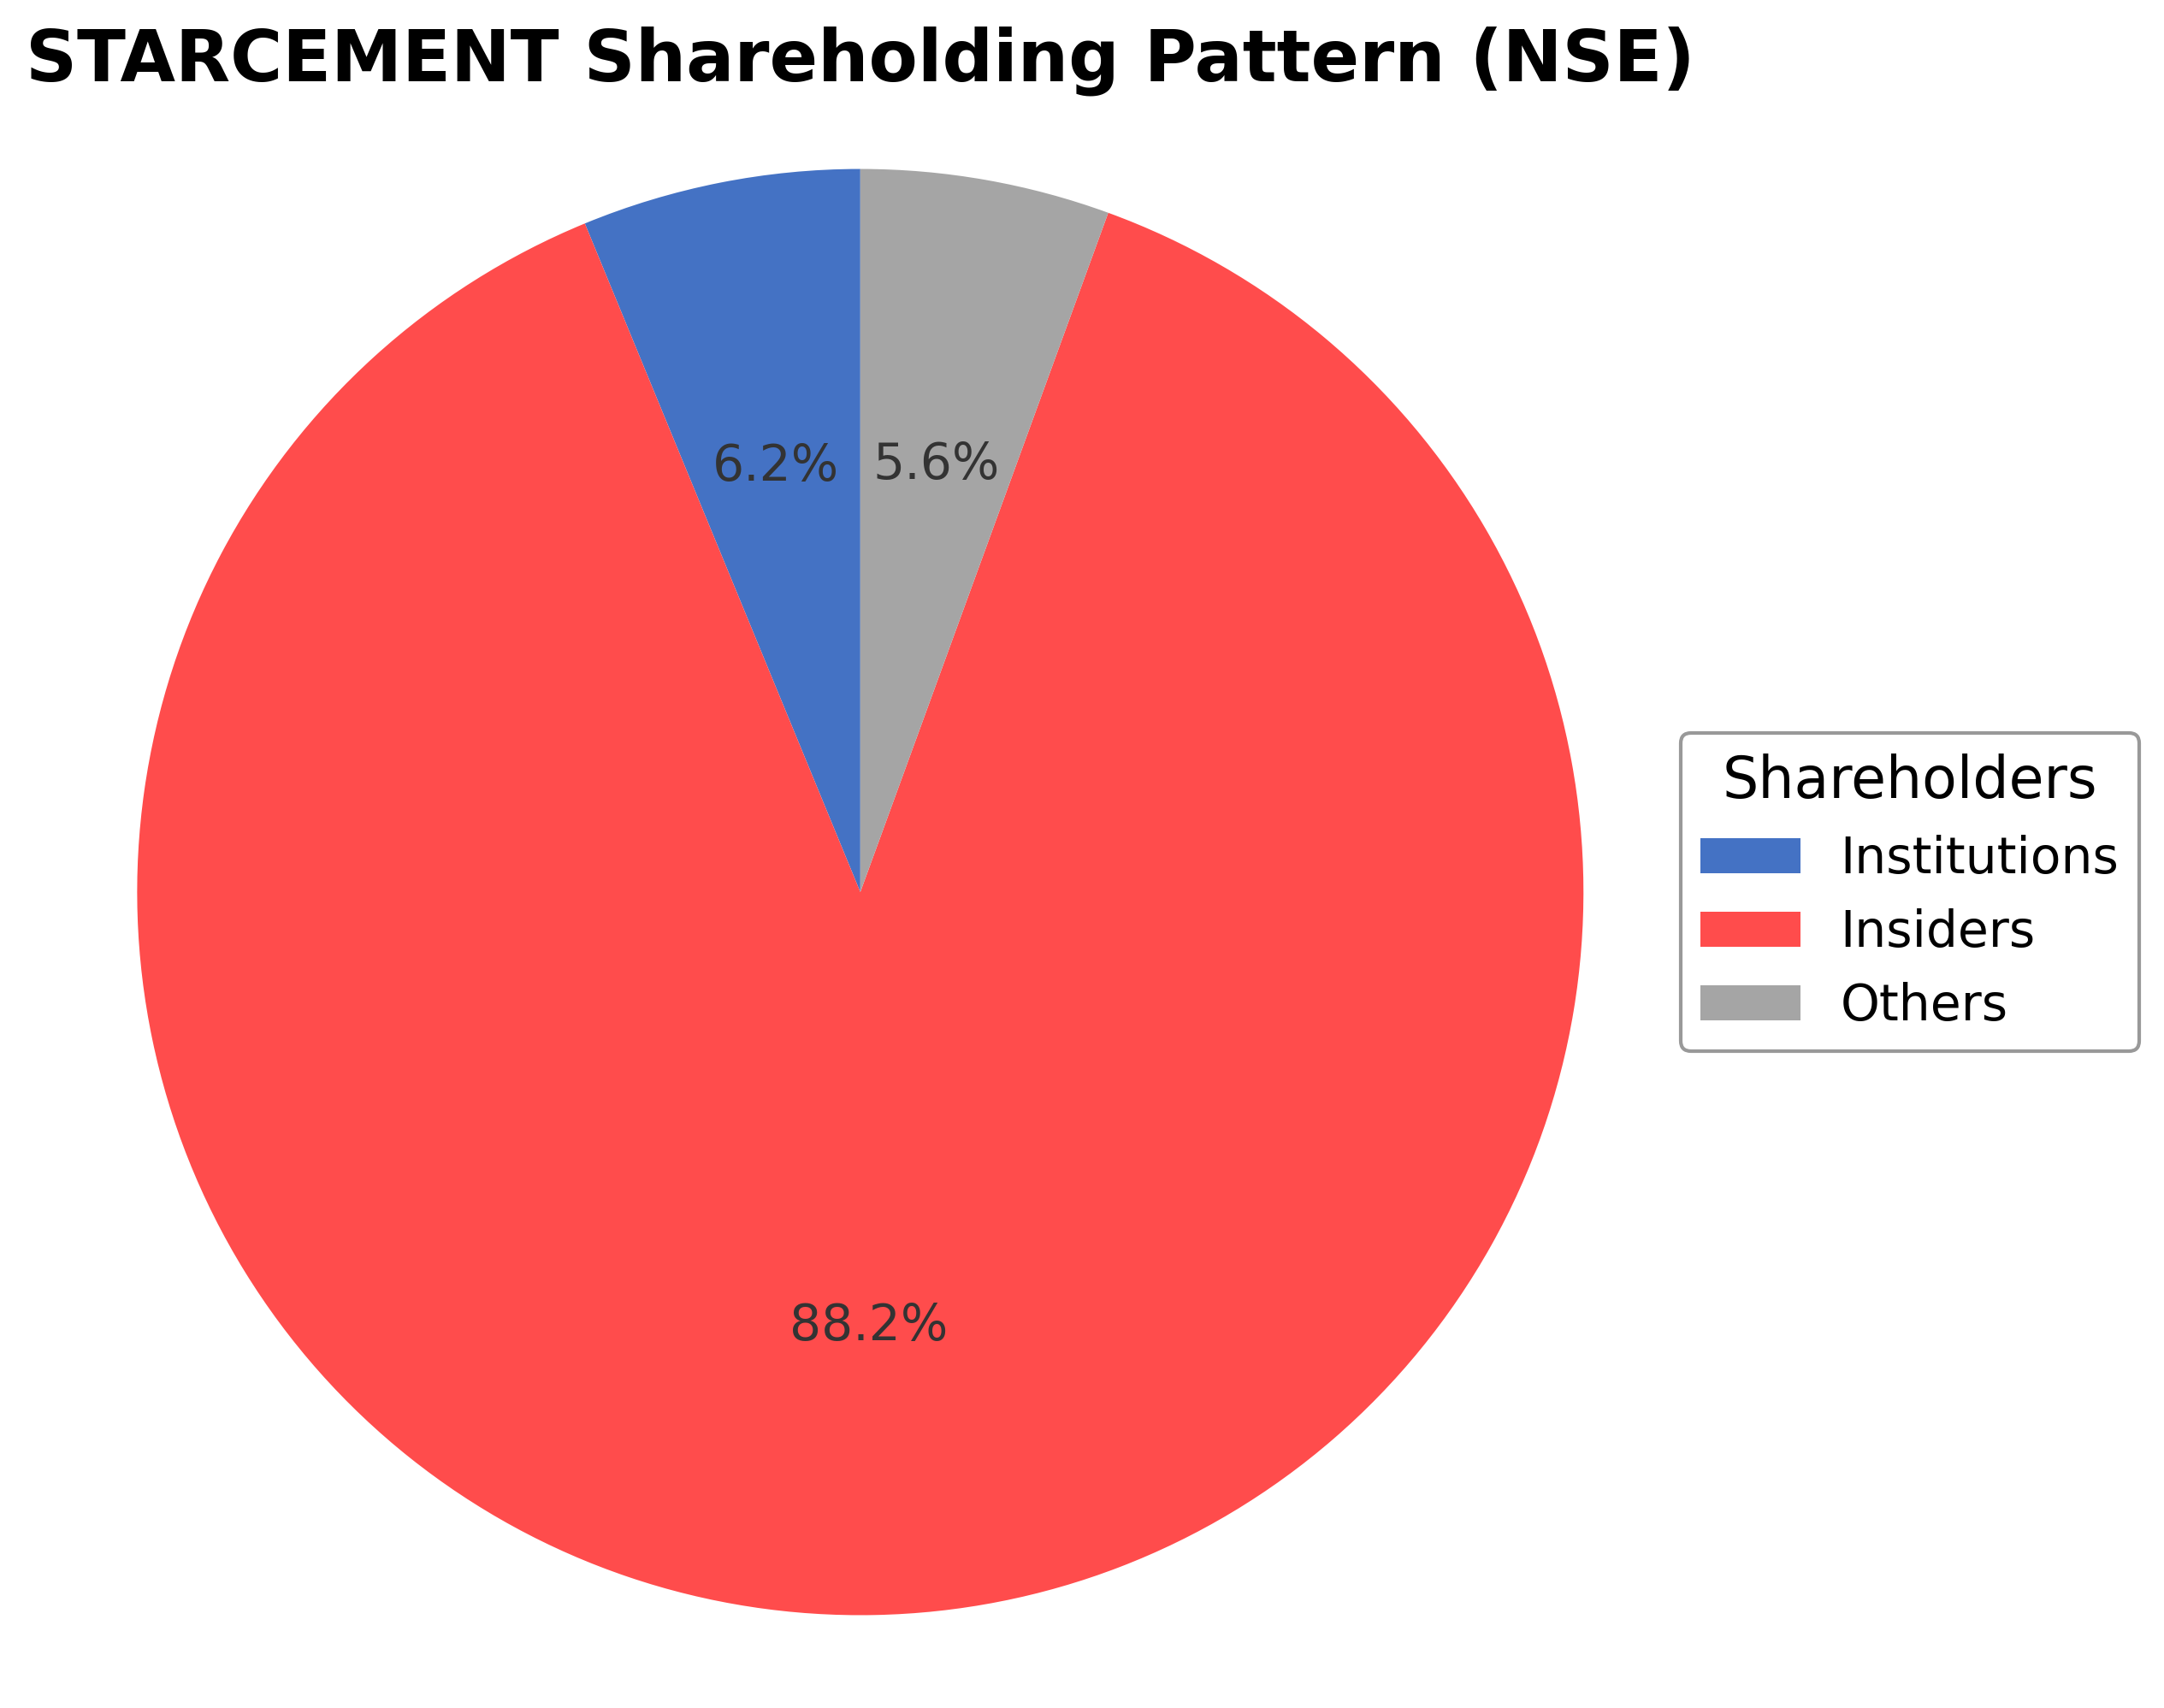
Star Cement Ltd.'s ownership structure comprises approximately 0.88% held by insiders including executives and board members, 6.22% by institutional investors such as mutual funds and asset managers, and the remaining 92.90% by public shareholders including retail investors and employee stock plans. Over the past 12-24 months, institutional holdings have shown modest fluctuations without significant accumulation or distribution by major funds. This distribution suggests a broad market participation with limited insider concentration, which may influence corporate governance dynamics and strategic decision-making. The current ownership pattern reflects a typical structure for a mid-sized Indian cement company, balancing public market liquidity with institutional oversight.
Sector and Industry Analysis
Star Cement Ltd. operates within the broader Materials sector, specifically in the cement manufacturing industry, a critical component of the construction and infrastructure ecosystem. The cement industry in India is one of the largest globally, with a market size exceeding 400 million tonnes annually and a growth trajectory closely tied to urbanization, infrastructure development, and government-led housing initiatives. Key players in this sector include UltraTech Cement, ACC, Ambuja Cements, and Shree Cement, alongside regional players like Star Cement that cater to specific geographic markets. The sector’s growth is driven by rising demand from residential, commercial, and industrial construction, supported by government infrastructure projects such as roads, railways, and smart cities.
Technological advancements in the cement industry are focused on improving energy efficiency, reducing carbon emissions, and enhancing product quality. Innovations such as the adoption of alternative fuels, waste heat recovery systems, and digital process optimization are gaining traction. Consumer behavior is evolving with increased demand for sustainable and eco-friendly building materials, prompting manufacturers to invest in green cement technologies and low-carbon products. Emerging opportunities include the growing use of blended cements and specialty cements tailored for specific construction needs, as well as expansion into underpenetrated rural and semi-urban markets.
The regulatory environment for the cement industry is shaped by environmental norms, labor laws, and industry-specific standards. Compliance with the Ministry of Environment, Forest and Climate Change (MoEFCC) regulations on emissions and waste management is critical, alongside adherence to the Bureau of Indian Standards (BIS) for product quality. Policy initiatives such as the Goods and Services Tax (GST) have streamlined taxation but also impacted pricing dynamics. Additionally, government policies promoting infrastructure spending and affordable housing schemes like Pradhan Mantri Awas Yojana (PMAY) influence demand patterns and capacity expansion decisions.
Competitive dynamics in the cement industry are characterized by moderate to high entry barriers due to capital-intensive manufacturing processes, access to raw materials (limestone, coal), and distribution network scale. The market structure is oligopolistic with a few large players dominating national markets, while regional players like Star Cement leverage local resource advantages and distribution efficiencies. Competitive positioning hinges on cost leadership, product quality, brand reputation, and logistical capabilities. The industry also experiences cyclical demand fluctuations linked to macroeconomic conditions and government spending, requiring agility in capacity management and pricing strategies. Overall, the sector remains capital-intensive with ongoing consolidation trends and strategic investments in sustainability shaping the competitive landscape.
Note: Analysis synthesized from industry research, market reports, and regulatory filings. Information is subject to change based on market conditions.
Illustrative Scenario Analysis
DCF Assumptions:
Method: Two-Stage EPS-Priority Model
Financials
Peer Analysis
| Company Name | Market Cap | P/E Ratio | P/B Ratio | EV/EBITDA | Price to CFO |
|---|---|---|---|---|---|
| Star Cement Ltd. | ₹84.73B | 23.01 | 2.82 | 9.06 | 745.92 |
| Birla Corporation Ltd. | ₹68.56B | 13.19 | 0.96 | 6.29 | 6.51 |
| JK Cement Ltd. | ₹399.52B | 39.14 | 6.16 | 18.44 | 30.37 |
| Ultratech Cement Ltd. | ₹3.12T | 40.82 | 4.34 | 21.18 | 35.65 |
| Nuvoco Vistas Corporation Ltd. | ₹104.69B | 27.25 | 1.14 | 9.94 | 14.38 |
| India Cements Ltd. | ₹166.86B | 439.42 | 1.12 | 138.09 | 25.74 |
Comparison Analysis: Star Cement Ltd. holds a moderate market capitalization relative to its Indian cement industry peers, with valuation metrics such as P/E and EV/EBITDA positioned below larger players like Ultratech Cement and JK Cement. The company's price-to-book ratio is higher than some peers, indicating a premium valuation relative to book value. Return on equity is comparatively low at 6%, which is below JK Cement and Ultratech but slightly above Birla Corporation. The price-to-cash-flow ratio is notably elevated compared to peers, suggesting a divergence in cash flow valuation. Overall, Star Cement appears as a smaller regional player with valuation and profitability metrics that reflect its scale and market positioning within the sector.
Financial Metrics Comparison with Peers
Financial Statements
Comprehensive financial data including income, balance sheet, and cash flow metrics
Income Statement
| fiscal_date | 2025-03-31 | 2024-03-31 | 2023-03-31 | 2022-03-31 | 2021-03-31 |
|---|---|---|---|---|---|
| Sales | 29.88B | 28.88B | 25.76B | 20.90B | 17.19B |
| Cost Of Goods | 11.28B | 10.18B | 9.15B | 9.96B | 7.52B |
| Gross Profit | 18.60B | 18.70B | 16.61B | 10.95B | 9.66B |
| Operating Expense Research And Development | 0.00 | N/A | 2.27M | 5.23M | 4.51M |
| Operating Expense Selling General And Administrative | 9.26B | 7.41B | 8.73B | 5.04B | 3.44B |
| Operating Expense Other Operating Expenses | 2.78B | 3.75B | 2.43B | 2.13B | 1.55B |
| Operating Income | 2.50B | 4.14B | 3.43B | 2.24B | 2.43B |
| Non Operating Interest Income | 32.03M | 199.09M | 433.48M | 331.24M | 272.57M |
| Non Operating Interest Expense | 298.26M | 108.28M | 78.53M | 108.68M | 52.08M |
| Pretax Income | 2.26B | 4.24B | 3.80B | 2.44B | 1.99B |
| Income Tax | 568.51M | 1.28B | 1.32B | -31.21M | 121.34M |
| Net Income | 1.69B | 2.95B | 2.48B | 2.47B | 1.87B |
| Eps Basic | 4.18 | 7.30 | 6.13 | 6.04 | 4.54 |
| Eps Diluted | 4.18 | 7.30 | 6.13 | 6.04 | 4.54 |
| Basic Shares Outstanding | 404.18M | 404.18M | 404.18M | 408.59M | 412.43M |
| Diluted Shares Outstanding | 404.18M | 404.18M | 404.18M | 408.59M | 412.43M |
| Ebit | 2.56B | 4.34B | 3.88B | 2.55B | 2.04B |
| Ebitda | 5.87B | 5.86B | 5.19B | 3.79B | 3.59B |
| Net Income Continuous Operations | 2.26B | 4.24B | 3.80B | 2.44B | 1.99B |
| Minority Interests | 1.80M | 0.00 | 0.00 | 0.00 | 0.00 |
| Preferred Stock Dividends | 0.00 | 0.00 | 0.00 | 0.00 | 0.00 |
Data provided by Twelve Data
Balance Sheet
| fiscal_date | 2025-03-31 | 2024-03-31 | 2023-03-31 | 2022-03-31 | 2021-03-31 |
|---|---|---|---|---|---|
| Cash And Cash Equivalents | 398.46M | 477.87M | 1.22B | 80.75M | 554.83M |
| Accounts Receivable | 2.00B | 1.51B | 1.05B | 1.29B | 1.32B |
| Total Assets | 41.07B | 36.02B | 31.31B | 27.45B | 25.62B |
| Total Liabilities | 12.28B | 8.92B | 7.15B | 5.77B | 4.88B |
| Long Term Debt | 3.00B | 847.67M | 48.38M | 80.08M | 16.79M |
| Shareholders Equity | 28.79B | 27.10B | 24.16B | 21.68B | 20.74B |
Data provided by Twelve Data
Cash Flow Statement
| fiscal_date | 2025-03-31 | 2024-03-31 | 2023-03-31 | 2022-03-31 | 2021-03-31 |
|---|---|---|---|---|---|
| Operating Activities Net Income | 2.26B | 4.24B | 3.80B | 2.44B | 1.99B |
| Operating Activities Other Non Cash Items | 251.60M | -116.28M | -391.56M | -197.84M | -168.62M |
| Operating Activities Accounts Receivable | -518.39M | -475.92M | 220.11M | 110.21M | -74.61M |
| Operating Activities Other Assets Liabilities | -1.88B | 1.09B | -1.91B | 793.44M | 1.12B |
| Operating Activities Operating Cash Flow | 113.59M | 4.74B | 1.72B | 3.14B | 2.87B |
| Investing Activities Capital Expenditures | -5.76B | -10.36B | -5.69B | -1.97B | -1.07B |
| Investing Activities Investing Cash Flow | -5.76B | -10.36B | -3.18B | -3.20B | -3.38B |
| Financing Activities Long Term Debt Issuance | 2.42B | 721.03M | 0.00 | N/A | N/A |
| Financing Activities Long Term Debt Payments | 0.00 | N/A | 0.00 | -1.87M | 0.00 |
| Financing Activities Short Term Debt Issuance | 169.16M | 316.23M | 207.26M | -97.47M | 41.96M |
| Financing Activities Financing Cash Flow | 2.59B | 1.04B | 207.26M | -1.62B | 41.96M |
| End Cash Position | 398.46M | 477.87M | 1.22B | 80.75M | 554.83M |
| Free Cash Flow | -2.85B | -5.47B | -2.13B | 2.18B | 2.43B |
| Investing Activities Other Investing Activity | N/A | -70.00K | 1.00K | N/A | -402.91M |
| Investing Activities Sale Of Investments | N/A | N/A | 2.51B | 396.43M | N/A |
| Financing Activities Common Stock Repurchase | N/A | N/A | 0.00 | -1.52B | 0.00 |
| Investing Activities Purchase Of Investments | N/A | N/A | N/A | -1.62B | -1.91B |
| Financing Activities Common Dividends | N/A | N/A | N/A | N/A | N/A |
Data provided by Twelve Data
Technical Analysis
Key Insights
- The current trend shows the stock trading below its 200-day moving average (₹236.29) but above the 50-day moving average (₹211.93), indicating mixed medium-term momentum.
- Key support levels are near the 52-week low at ₹196.53, while resistance is observed approaching the 52-week high at ₹308.95.
- The stock price is positioned between the 10-day, 50-day, and 200-day moving averages, suggesting consolidation with no clear directional bias.
- Momentum indicators show a Relative Strength Index (RSI) near neutral levels, a MACD with mixed signals, and a stochastic oscillator indicating potential short-term volatility.
- Analysis across daily, weekly, and monthly timeframes reveals a mildly bearish to neutral trend, with recent price action showing limited upward momentum.
- Potential market scenarios include a continuation of sideways movement with volatility or a possible test of support levels if downward pressure increases.
Trending News
1. Headline: IFL 2025-26: Naoba Meitei's stoppage-time strike seals three points for Rajasthan United
Summary: Naoba Meitei's dramatic stoppage-time strike helped Rajasthan United FC edge Gokulam Kerala FC 1-0 in Star Cement Indian Football League (IFL) 20....
Sentiment: positive
2. Headline: IFL 2025-26: Dempo secure first win of the season against Shillong Lajong
Summary: , April 7 (IANS) Goals from Marcus Joseph, Kapil Hoble, and Richmond Kwasi Owusu helped Dempo Sports Club register their first win of the Star Cement ....
Sentiment: positive
3. Headline: IFL 2025-26: Naoba Meitei’s stoppage-time strike seals three points for Rajasthan United - Social News XYZ
Summary: Jaipur, April 7 (SocialNews.XYZ) Naoba Meitei’s dramatic stoppage-time strike helped Rajasthan United FC edge Gokulam Kerala FC 1-0 in Star Cement Indian Football League (IFL) 2025-26 at the Vidhyadhar Nagar Stadium in Jaipur on Tuesday.... - Social News XYZ
Sentiment: positive
4. Headline: Star Cement Limited Receives ESG Rating of 65 from NSE Sustainability Ratings & Analytics
Summary: Star Cement Limited has been assigned an ESG rating of 65 by NSE Sustainability Ratings & Analytics Limited based on publicly disclosed information for FY2025. The SEBI registered rating provider conducted this voluntary assessment independently without engagement from the company, evaluating ...
Sentiment: neutral
5. Headline: Star Cement Ltd. Valuation Shifts Amidst Sector Dynamics: A Detailed Analysis
Summary: Star Cement Ltd., a small-cap player in the Cement & Cement Products sector, has seen a notable shift in its valuation parameters, moving from a 'very expensive' to an 'expensive' rating. This change reflects a deterioration in price attractiveness, as key metrics such as the price-to-earnings ...
Sentiment: negative
Summary: Shree Cements Share Price: Find the latest news on Shree Cements Stock Price. Get all the information on Shree Cements with historic price charts for NSE / BSE. Experts & Broker view also get the Shree Cements Ltd. buy/sell tips detailed news, announcements, Forecasts, Analysts, Valuation, ...
Sentiment: neutral
7. Headline: Star Cement Receives 70 ESG Score From Independent CFC Finlease | Whalesbook Corporate News
Summary: Star Cement earns an ESG rating of 70 from independent provider CFC Finlease for FY25. Assessed using public data, the score offers insight into sustainability efforts. See what's next.
Sentiment: positive
8. Headline: Star Cement Ltd. is Rated Sell by MarketsMOJO
Summary: Star Cement Ltd. is rated 'Sell' by MarketsMOJO, with this rating last updated on 02 Dec 2025. However, the analysis and financial metrics discussed here reflect the stock's current position as of 23 March 2026, providing investors with an up-to-date perspective on the company’s fundamentals, ...
Sentiment: neutral
9. Headline: Star Cement Ltd. Technical Momentum Shifts Amid Mixed Market Signals
Summary: Star Cement Ltd. has experienced a subtle shift in its technical momentum, moving from a bearish to a mildly bearish trend, as reflected in recent indicator readings. Despite a modest day gain of 2.76%, the stock’s technical landscape presents a complex picture with mixed signals from MACD, ...
Sentiment: positive
10. Headline: Star Cement Ltd: Valuation Shifts Signal Heightened Price Risk Amid Sector Comparisons
Summary: Star Cement Ltd., a small-cap player in the Cement & Cement Products sector, has seen its valuation parameters shift notably, with its price-to-earnings (P/E) and price-to-book value (P/BV) ratios moving into the 'very expensive' territory. This change comes despite a mixed performance relative ...
Sentiment: negative
Powered by Brave
Recent Updates
News Summary
Recent news coverage of Star Cement Ltd. highlights a notable shift in valuation metrics amid sector dynamics, with the company moving from a 'very expensive' to an 'expensive' valuation rating. Analyst consensus shows a range of price targets, reflecting varied market perceptions. The company has received ESG ratings of 65 and 70 from independent agencies, underscoring its commitment to sustainability. Additionally, local environmental concerns have emerged regarding a proposed cement plant, indicating potential operational challenges. These developments collectively impact Star Cement's market positioning, investor sentiment, and strategic outlook within the Indian cement industry.
News Sentiment
The sentiment across recent news is mixed to moderately positive, with ESG ratings and analyst estimates contributing positively, while valuation shifts and environmental opposition introduce cautionary tones. Sentiment trends reflect a balance between growth prospects and sector-specific risks, suggesting a nuanced market view.
Analytical Overview
Analysis Summary
Valuation Metrics: Star Cement's trailing P/E of 23.01 and forward P/E of 19.75 are in line with the industry average of 23.01, indicating a valuation consistent with sector norms. The PEG ratio is notably low at 0.019, suggesting valuation relative to growth is favorable.
Growth Trajectory: The company demonstrates strong revenue growth with a quarterly revenue increase of 22.4% and a year-over-year earnings growth of 7.27%. Operating cash flow remains positive, supporting ongoing business expansion.
Financial Health: With a total debt-to-equity ratio of 21.39 and a current ratio of 1.15, Star Cement maintains moderate leverage and adequate liquidity. Free cash flow is positive at ₹1.69 billion, indicating healthy cash generation.
Sector Specific Factors: The Indian cement sector faces challenges including environmental regulations and competitive pricing pressures, but benefits from infrastructure development and urbanization trends. Star Cement's regional focus and sustainability initiatives align with these sector dynamics.
India Specific Factors: India's regulatory environment emphasizes sustainable industrial practices, which Star Cement addresses through its ESG ratings. Consumer demand driven by infrastructure growth supports market opportunities, while economic outlook remains cautiously optimistic.
Overall Business and Market Assessment
Supporting Factors: No data
Risk Factors: No data
SWOT Analysis
Strengths
- Strong regional market presence in eastern and northeastern India.
- High gross margin of approximately 72% indicating operational efficiency.
- Positive free cash flow supporting financial flexibility.
- Commitment to sustainable manufacturing and ESG initiatives.
Weaknesses
- Modest return on equity at 5.87% relative to industry peers.
- Low insider ownership potentially limiting strategic alignment.
- High price-to-cash-flow ratio compared to peers.
- Limited dividend payout with a forward yield below 1%.
Opportunities
- Growing infrastructure and urban development in India driving cement demand.
- Potential for expansion into new geographic markets within India.
- Increasing focus on ESG may attract sustainability-conscious stakeholders.
- Technological advancements in energy-efficient production methods.
Threats
- Environmental opposition to new plant developments affecting expansion plans.
- Competitive pressures from larger cement manufacturers with greater scale.
- Volatility in raw material costs impacting profit margins.
- Regulatory changes imposing stricter environmental compliance requirements.
Company Description
Star Cement Ltd. is a prominent player in the Indian building materials industry, specializing in the manufacture and distribution of cement products. Its primary function is to provide high-quality cement supplies that are crucial for infrastructure development, including residential, commercial, and industrial construction projects. The company operates across various segments such as the production of Ordinary Portland Cement, Portland Pozzolana Cement, and other blended cement types, catering to diverse construction needs. Notably, Star Cement Ltd. has established a strong market presence in India's eastern and northeastern regions, where it is a preferred brand due to its consistent quality and wide distribution network. Additionally, the company emphasizes sustainable manufacturing practices and energy efficiency, balancing growth with environmental responsibility. In the financial market, Star Cement Ltd. holds significance for its role in supporting the burgeoning construction sector, which is a key driver of economic development. Its contributions to infrastructure projects and urban development position it as a vital component of India's industrial growth landscape.