
STALLION (STALLION)
Stock Analysis Report
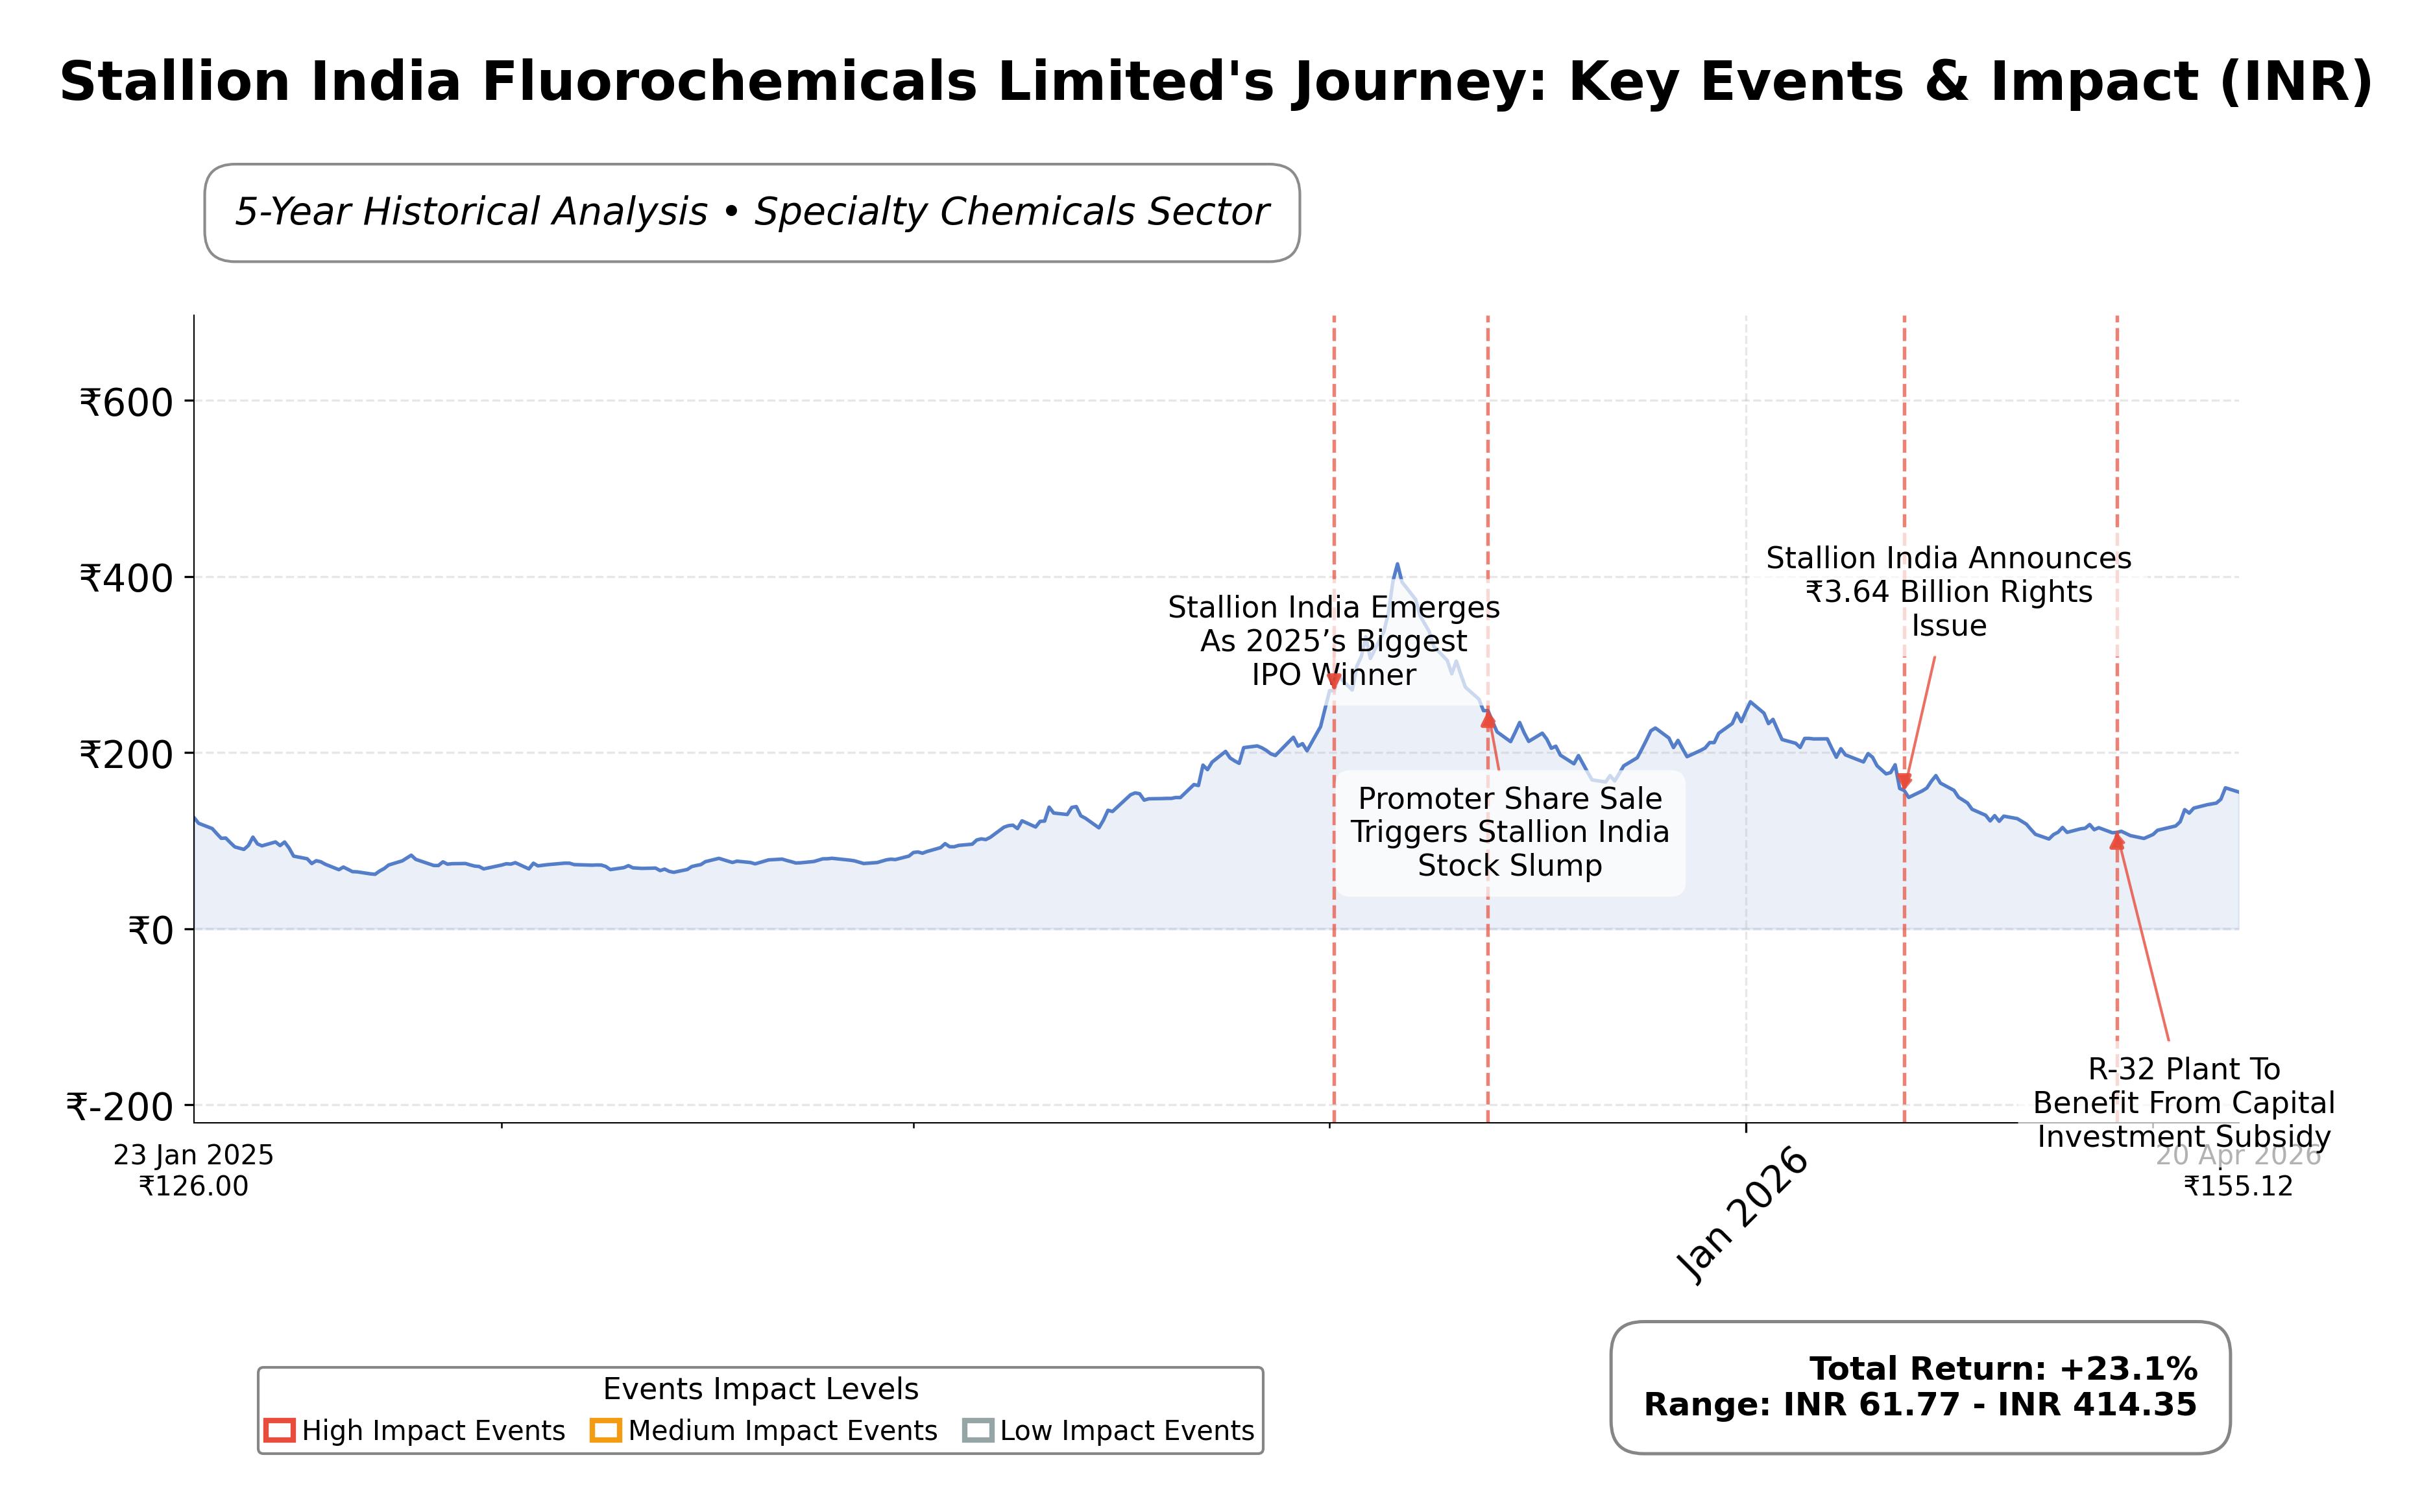
Stock Journey
Key Positives and Key Risks
Pros
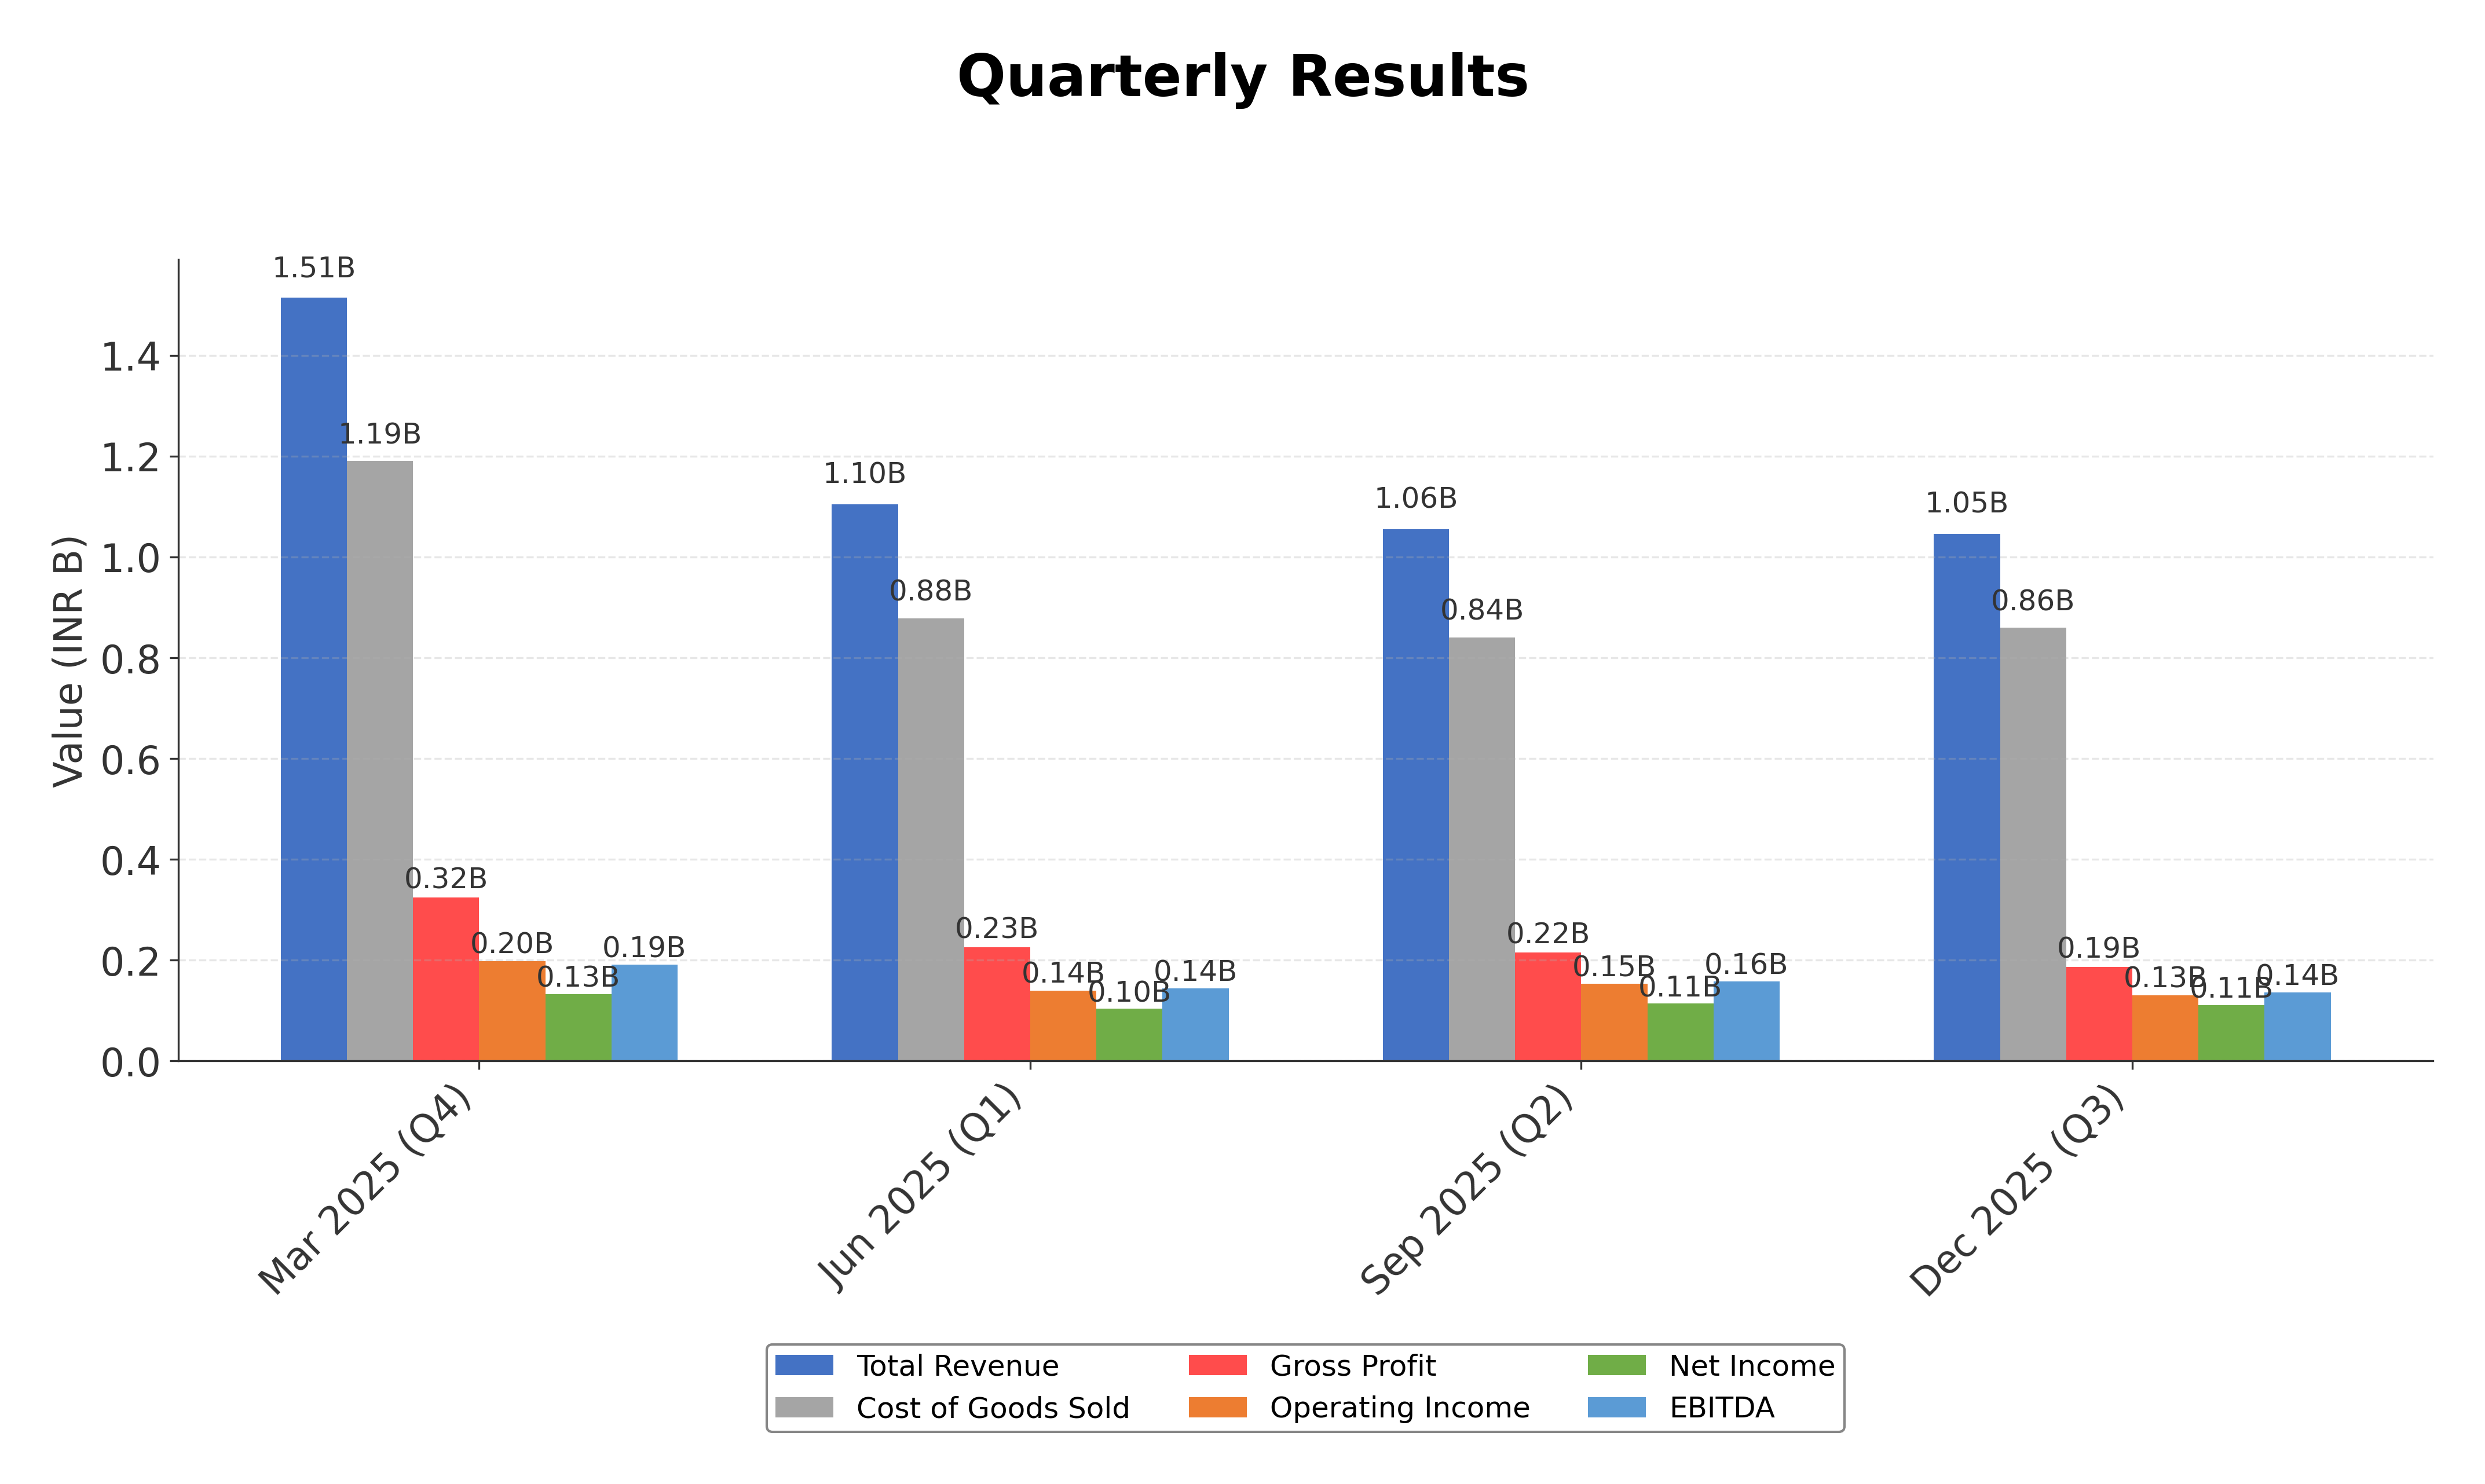
- Revenue growth of 22.9% quarterly and 72.8% PAT increase in 9M FY26 demonstrate strong operational momentum.
- Low debt-to-equity ratio of 0.37 and high current ratio of 9.21 indicate robust financial health and liquidity.
- Strategic technology partnership with SYS Advance enhances capabilities in helium recovery and specialty gases.
Cons
- Negative operating cash flow of INR 199 million raises concerns about cash generation from core operations.
- Stock price is significantly below its 52-week high (INR 423.8 vs. INR 163.01), reflecting volatility and bearish momentum.
- No dividend payout reduces attractiveness for income-focused shareholders.
Disclosure: This information is for general awareness and does not constitute investment advice
Report Summary
Stallion India Fluorochemicals Limited operates primarily in the specialty chemicals industry, focusing on manufacturing and supplying fluorine-based chemicals essential for various industrial applications. Listed on the NSE under the Basic Materials sector, the company serves critical markets including refrigerants, pharmaceuticals, agrochemicals, automotive, electronics, and healthcare. Its product portfolio supports technological advancements and environmental sustainability, particularly in green technology solutions such as low-global warming potential refrigerants. The firm’s strategic positioning within the fluorochemicals segment underscores its role in meeting global environmental standards.
Financially, Stallion India Fluorochemicals reported trailing twelve-month revenue of approximately INR 4.72 billion with a gross margin of 17.87%, operating margin of 12.46%, and net profit margin of 9.78%. The company’s return on equity stands at 10.75%, return on assets at 9.69%, and return on invested capital is reflected in an EV/EBITDA ratio of 19.06, indicating moderate profitability and operational efficiency. Despite a negative operating cash flow of INR 199 million, the firm generated positive free cash flow of INR 323 million, reflecting some cash generation capability.
Valuation metrics show a trailing price-to-earnings ratio of 31.36 and price-to-book ratio of 3.92, with a market capitalization near INR 18.86 billion. The stock trades well below its 52-week high of INR 423.80, currently priced at INR 163.01, indicating a significant price correction from its peak. The enterprise value to revenue ratio is 2.52, suggesting a valuation premium relative to sales. The PEG ratio of 2.30 suggests moderate growth expectations relative to earnings.
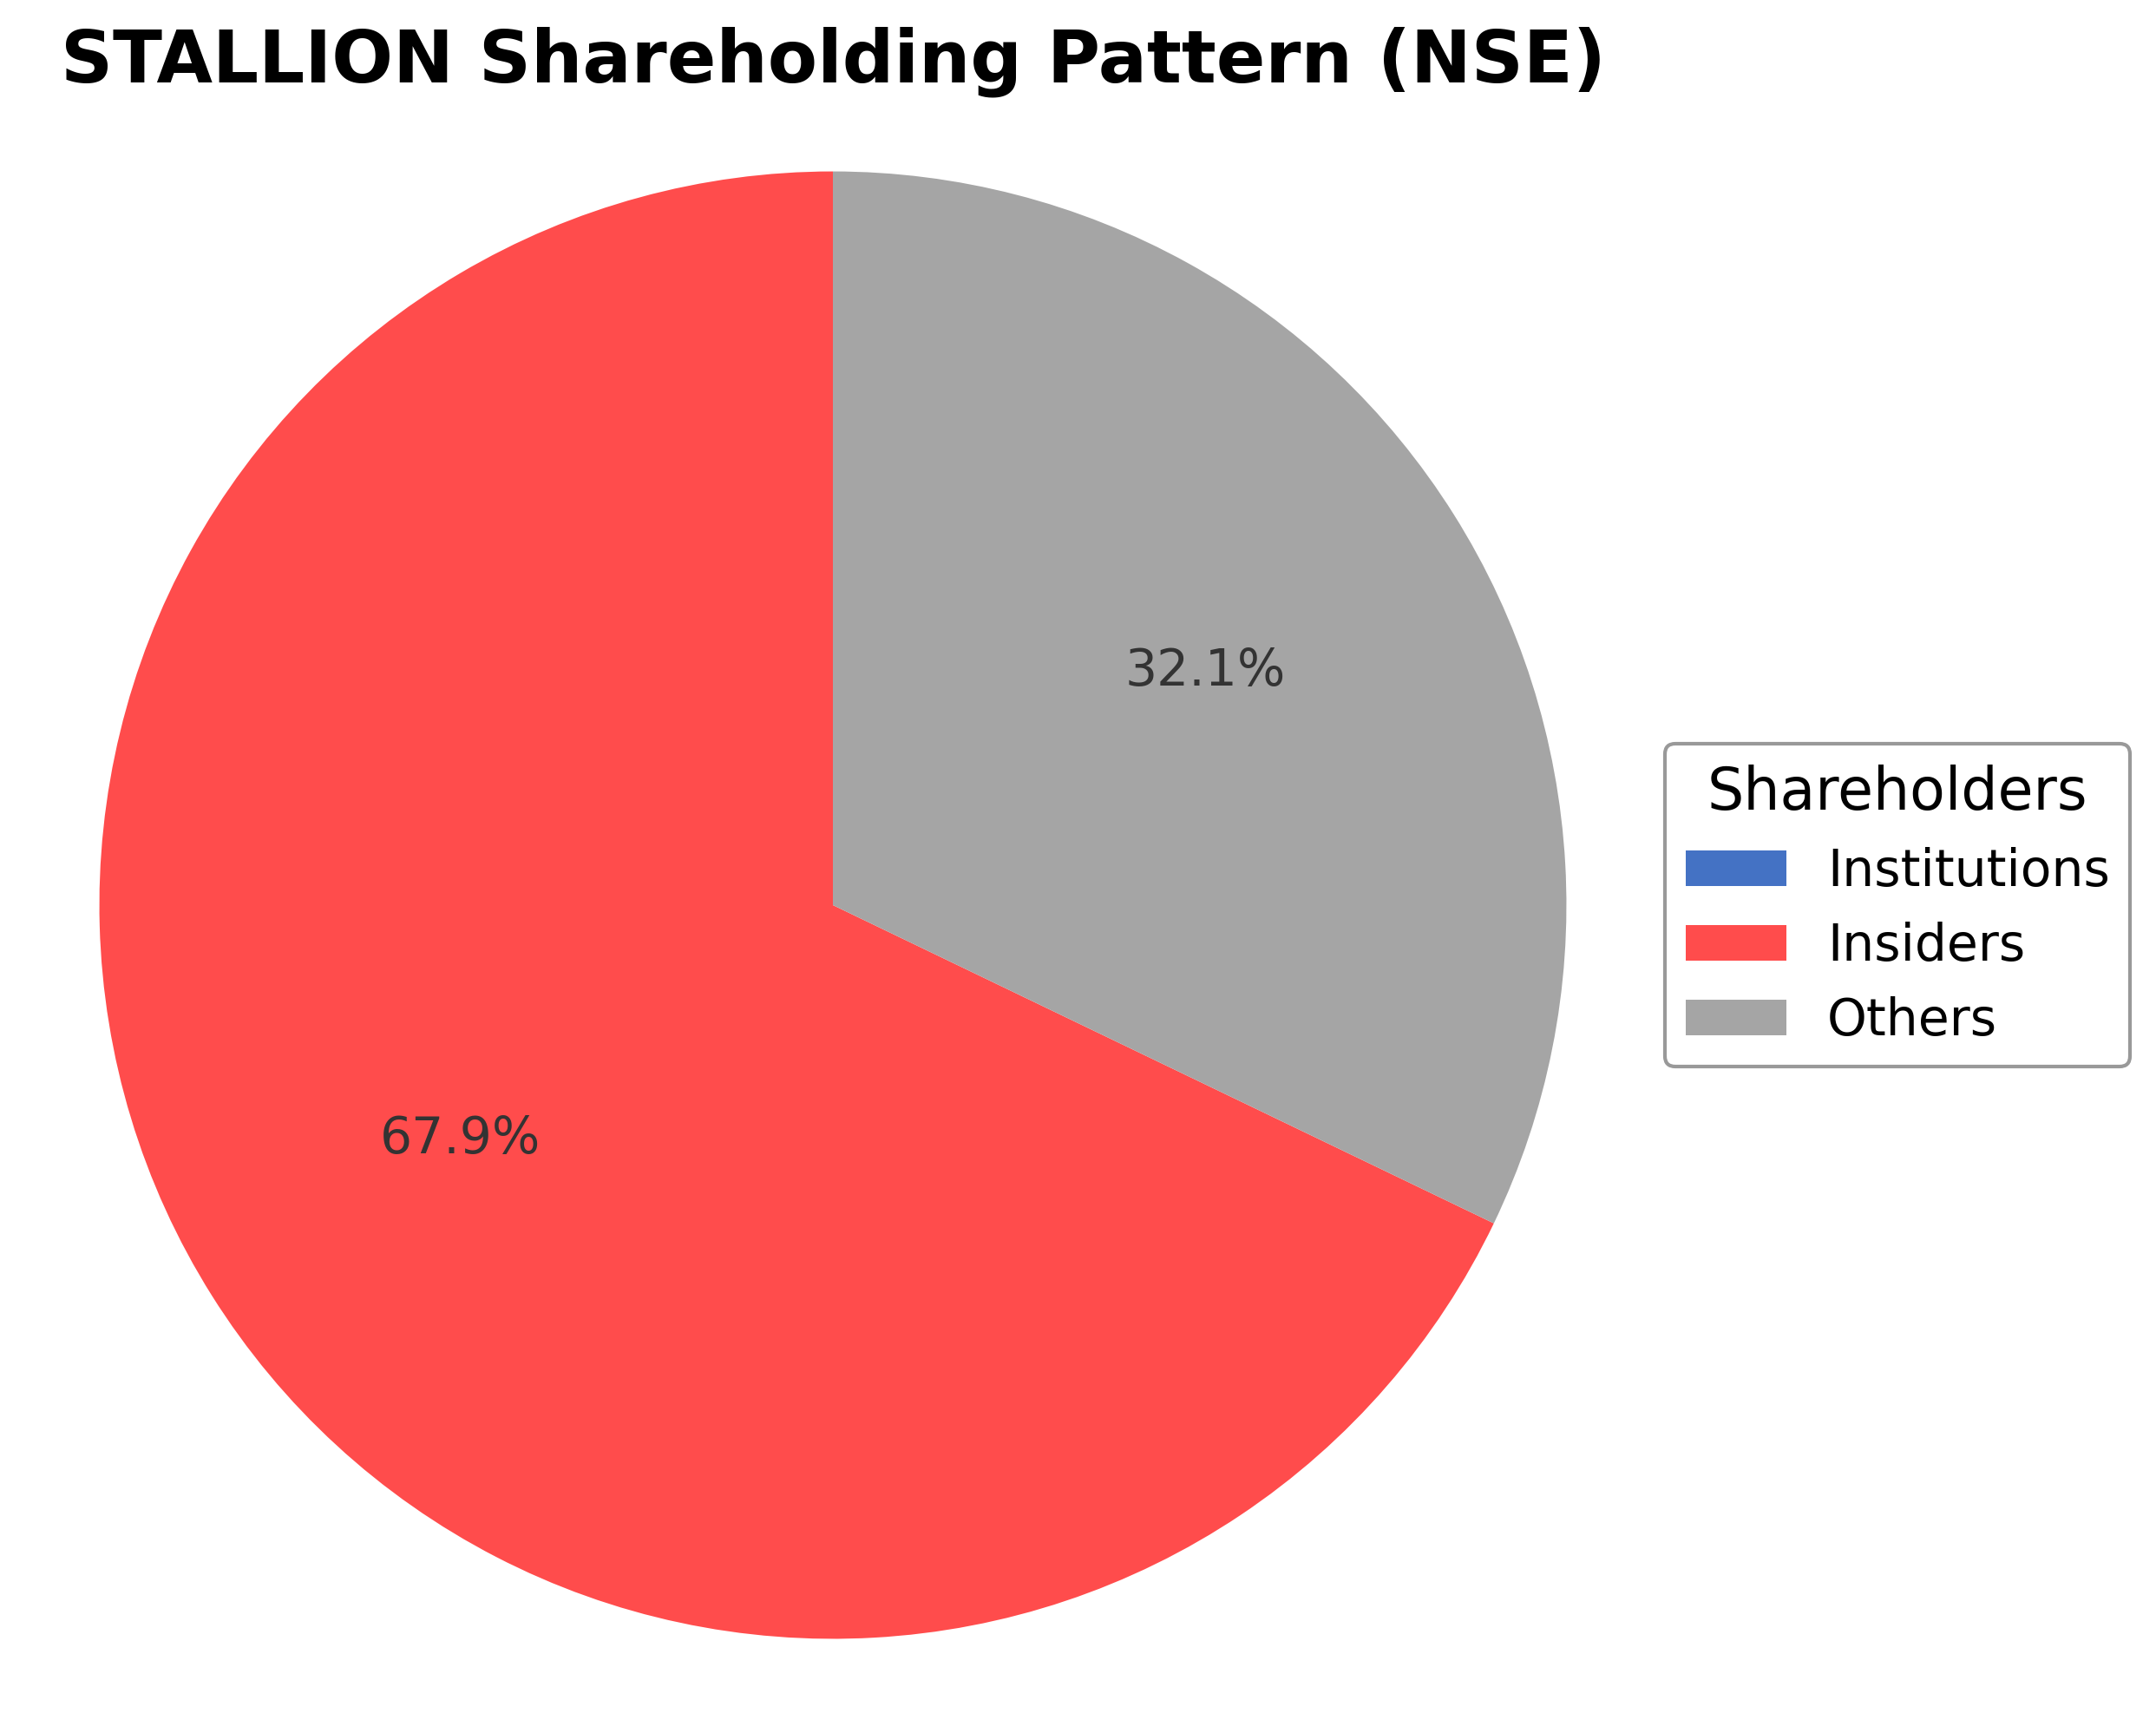
Stallion India Fluorochemicals benefits from a strong balance sheet with low debt levels (debt-to-equity ratio of 0.37) and a high current ratio of 9.21, indicating solid liquidity. Institutional ownership is currently nil, while insiders hold approximately 0.68%, reflecting concentrated ownership. Key risks include competitive pressures in specialty chemicals, regulatory changes impacting fluorochemical production, and macroeconomic factors affecting industrial demand. Recent strategic initiatives include a technology tie-up for helium recovery and liquefaction systems, which may enhance operational capabilities.
Technically, the stock has experienced downward momentum, trading below its 50-day and 200-day moving averages, with mixed signals from momentum indicators. Recent news highlights both positive operational performance and technical setbacks, suggesting a cautious market stance. Overall, the data points to a complex environment where accumulation or realization of gains should be considered carefully, with attention to evolving fundamentals and market dynamics.
Company and Industry Overview
Company Basics
Price Performance
Company Size
Shareholding Pattern
Sector and Industry Analysis
The fluorochemicals sector, encompassing refrigerants and specialty gases, is integral to industries such as automotive, electronics, pharmaceuticals, and semiconductors. The market has witnessed steady growth driven by rising demand for eco-friendly refrigerants and advanced industrial gases. Key players include multinational corporations and established domestic firms, with Stallion India Fluorochemicals among mid-sized companies contributing to the sector's expansion in India.
Industry trends highlight a shift towards low global warming potential (GWP) refrigerants like Hydrofluoroolefins (HFOs) and blends, responding to environmental concerns and regulatory pressures. Competitive dynamics are shaped by technological capabilities in gas blending and manufacturing, with barriers to entry including high capital expenditure and stringent quality standards. Companies with diversified product portfolios and strong distribution networks maintain advantageous positions in this evolving market.
The regulatory landscape is increasingly focused on phasing down high-GWP Hydrofluorocarbons (HFCs) under international agreements like the Kigali Amendment to the Montreal Protocol. Compliance requires innovation in product formulations and adherence to environmental norms, impacting production processes and cost structures. This regulatory environment encourages the adoption of sustainable refrigerants, influencing long-term industry growth and competitive strategies.
Note: Analysis synthesized from industry research, market reports, and regulatory filings. Information is subject to change based on market conditions.
Financial Ratios Dashboard
Illustrative Scenario Analysis
DCF Assumptions:
Method: Two-Stage EPS-Priority Model
Financials
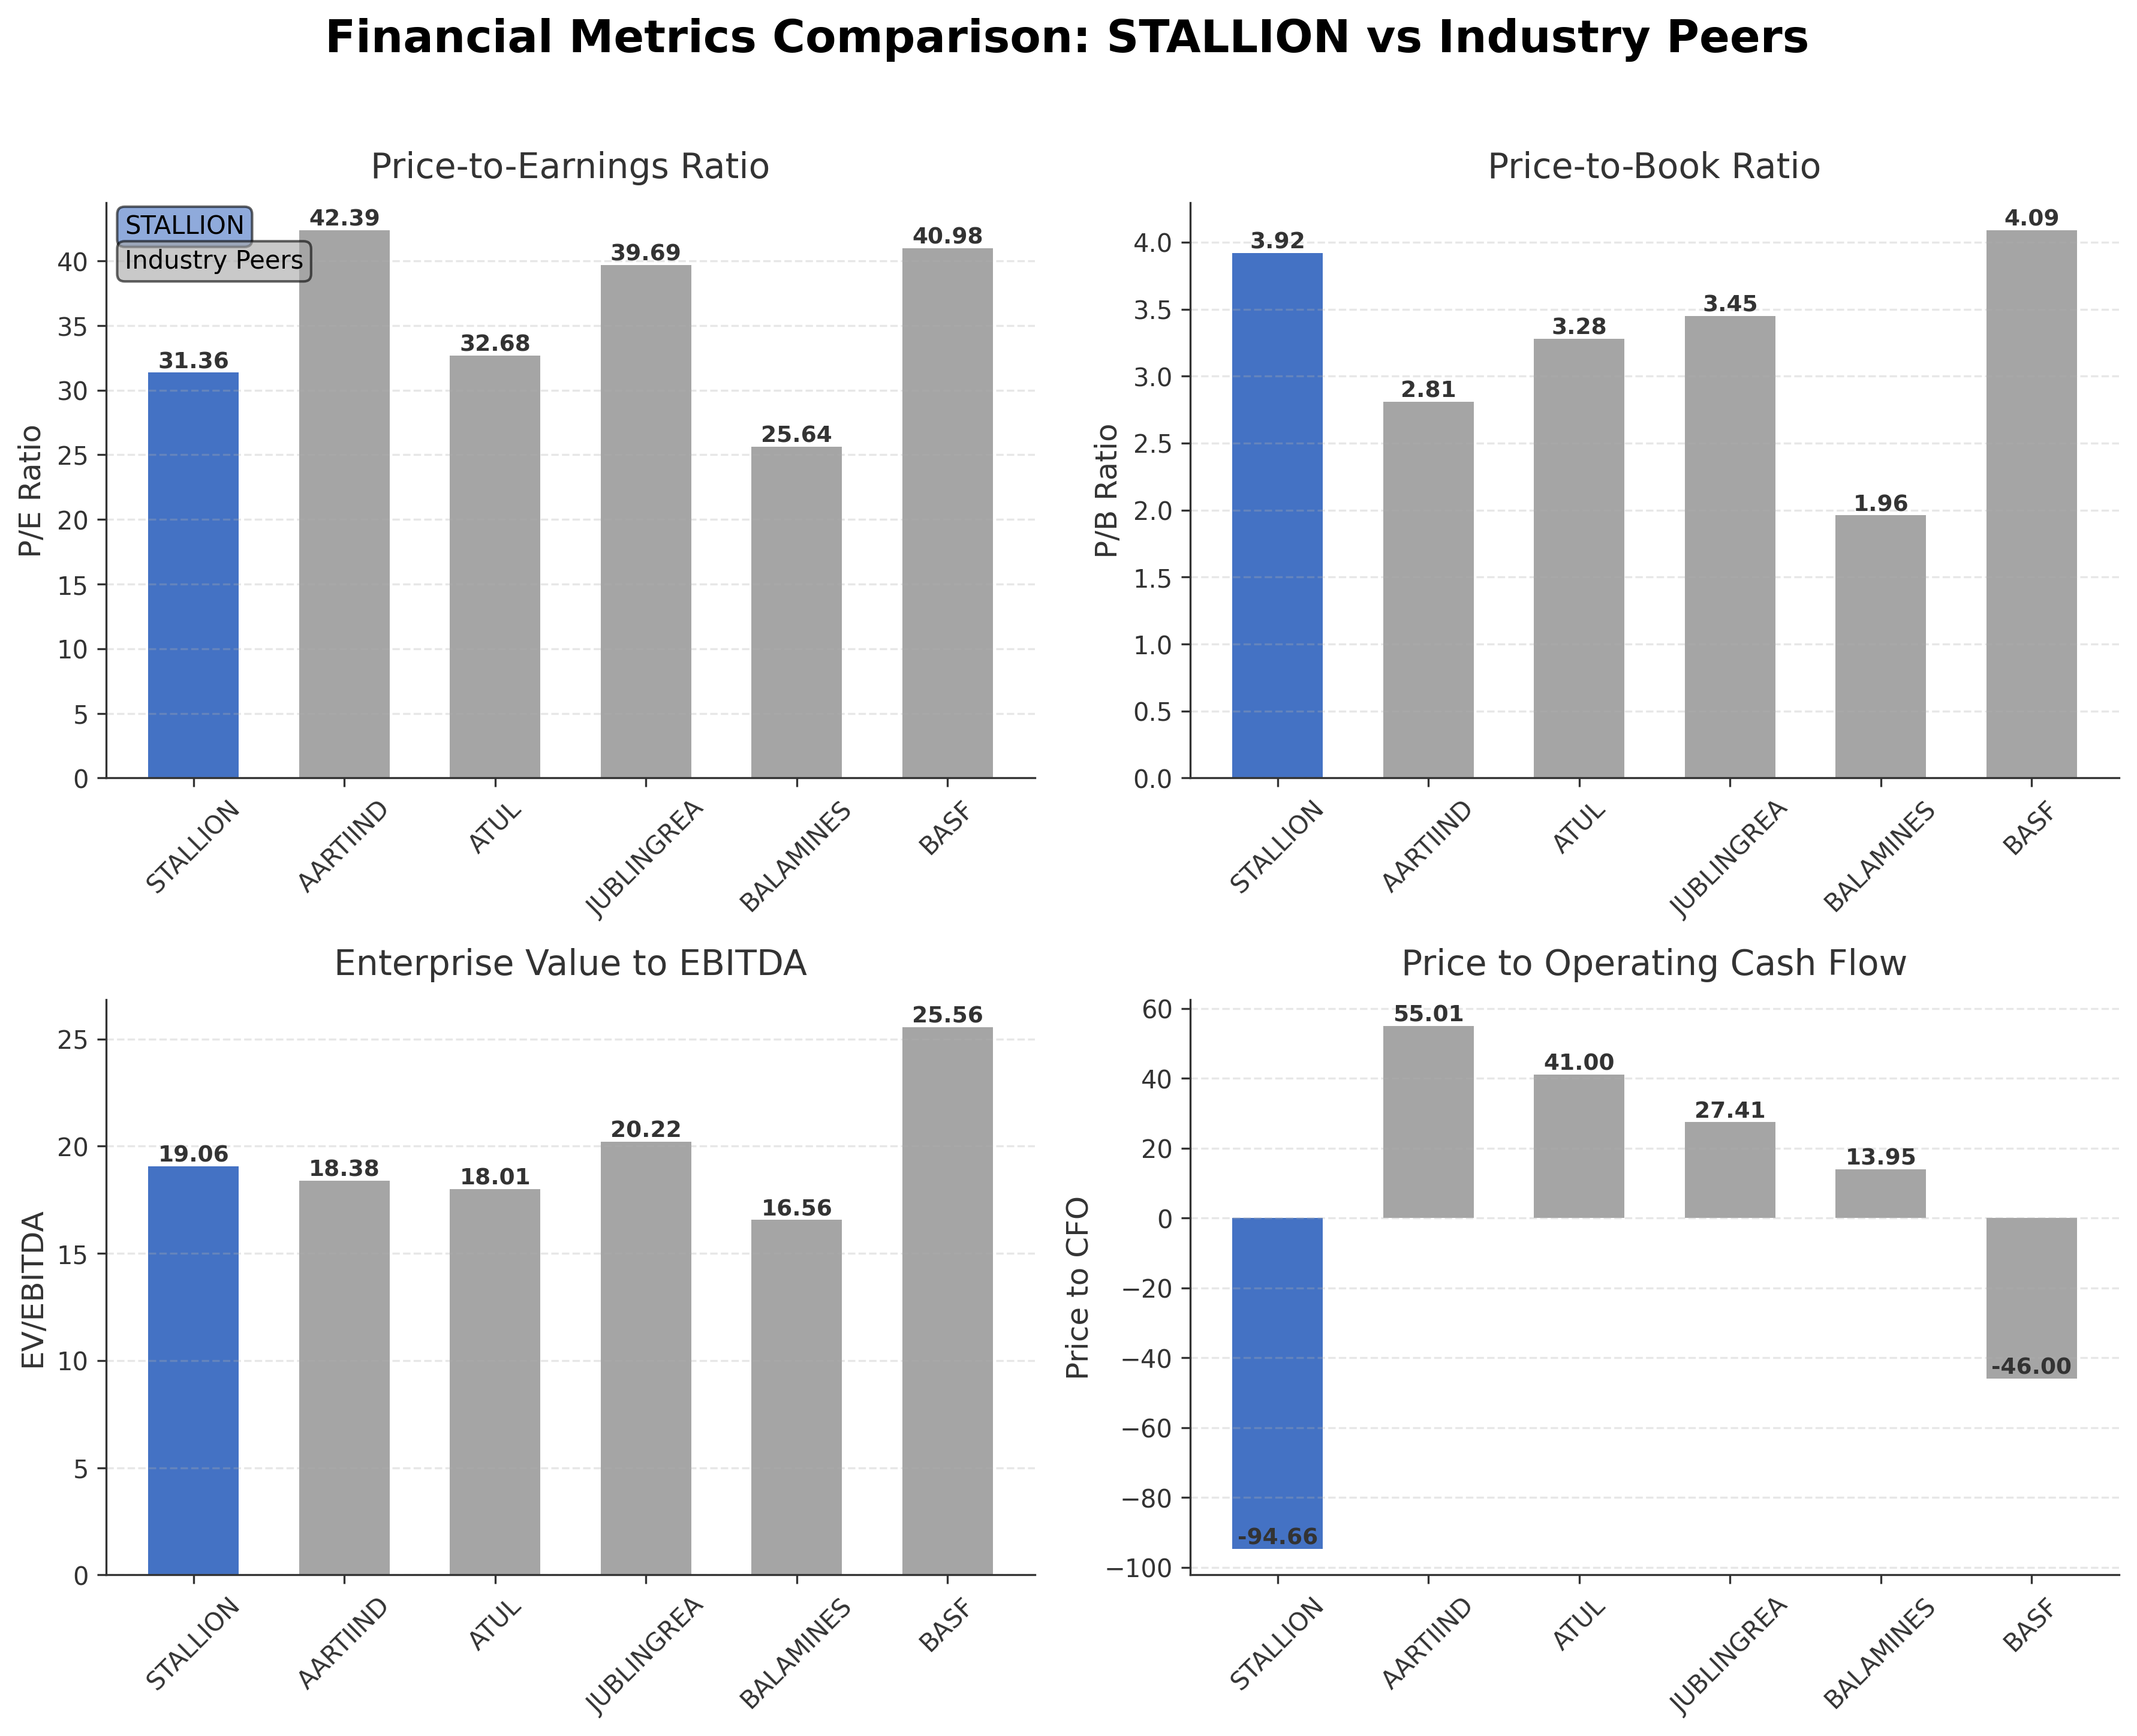
Peer Analysis
| Company Name | Market Cap | P/E Ratio | P/B Ratio | EV/EBITDA | Price to CFO |
|---|---|---|---|---|---|
| Stallion India Fluorochemicals Limited | ₹18.86B | 31.36 | 3.92 | 19.06 | -94.66 |
| Aarti Industries Ltd. | ₹160.06B | 42.39 | 2.81 | 18.38 | 55.01 |
| Atul Ltd. | ₹194.32B | 32.68 | 3.28 | 18.01 | 41.00 |
| Jubilant Ingrevia Ltd. | ₹104.91B | 39.69 | 3.45 | 20.22 | 27.41 |
| Balaji Amines Ltd. | ₹36.91B | 25.64 | 1.96 | 16.56 | 13.95 |
| BASF India Ltd. | ₹160.27B | 40.98 | 4.09 | 25.56 | -46.00 |
Comparison Analysis: Stallion India Fluorochemicals Limited exhibits a moderate valuation profile relative to its industry peers, with a trailing P/E of 31.36, which is below several peers such as Aarti Industries and Jubilant Ingrevia but above Balaji Amines. Its price-to-book ratio of 3.92 is among the higher end compared to peers, indicating a premium valuation on book value. The EV/EBITDA ratio of 19.06 is slightly elevated relative to the peer median, suggesting a relatively higher enterprise valuation per earnings before interest, taxes, depreciation, and amortization. Notably, Stallion's price to cash flow is negative, contrasting with positive values for most peers, which may signal cash flow challenges. The company’s return on equity of 11% is competitive within the peer group, reflecting efficient equity utilization. Overall, Stallion stands as a mid-sized player with valuation and profitability metrics largely in line with industry norms but with some areas warranting closer monitoring.
Financial Metrics Comparison with Peers
Financial Statements
Comprehensive financial data including income, balance sheet, and cash flow metrics
Income Statement
| fiscal_date | 2025-03-31 | 2024-03-31 | 2023-03-31 | 2022-03-31 | 2021-03-31 |
|---|---|---|---|---|---|
| Sales | 3.77B | 2.33B | 2.25B | 1.86B | 1.18B |
| Cost Of Goods | 2.87B | 1.87B | 1.90B | 1.39B | 926.12M |
| Gross Profit | 900.98M | 464.12M | 357.59M | 461.15M | 252.41M |
| Operating Expense Selling General And Administrative | 124.50M | 120.56M | 102.27M | 97.17M | 34.98M |
| Operating Expense Other Operating Expenses | 186.58M | 70.30M | 38.66M | 21.83M | 68.39M |
| Operating Income | 475.72M | 234.60M | 186.85M | 310.92M | 124.47M |
| Non Operating Interest Income | 1.11M | 7.48M | 4.83M | 170.00K | 140.00K |
| Non Operating Interest Expense | 49.13M | 34.39M | 9.81M | 10.60M | 3.41M |
| Pretax Income | 424.26M | 215.92M | 129.74M | 300.71M | 134.28M |
| Income Tax | 100.97M | 61.17M | 32.21M | 89.61M | 35.81M |
| Net Income | 323.29M | 154.75M | 97.53M | 211.10M | 98.47M |
| Eps Basic | 4.23 | 1.66 | 1.05 | 2.66 | 1.24 |
| Eps Diluted | 4.23 | 1.66 | 1.05 | 2.66 | 1.24 |
| Basic Shares Outstanding | 76.33M | 93.30M | 93.30M | 79.33M | 79.33M |
| Diluted Shares Outstanding | 76.33M | 93.30M | 93.30M | 79.33M | 79.33M |
| Ebit | 473.39M | 250.31M | 139.56M | 311.31M | 137.69M |
| Ebitda | 494.48M | 257.71M | 195.02M | 326.35M | 151.36M |
| Net Income Continuous Operations | 424.26M | 215.92M | 129.74M | 300.71M | 134.28M |
| Preferred Stock Dividends | 0.00 | 0.00 | 0.00 | 0.00 | 0.00 |
Data provided by Twelve Data
Balance Sheet
| fiscal_date | 2025-03-31 | 2024-03-31 | 2023-03-31 | 2022-03-31 | 2021-03-31 |
|---|---|---|---|---|---|
| Cash And Cash Equivalents | 589.38M | 161.36M | 10.12M | 16.24M | 25.87M |
| Accounts Receivable | 1.06B | 710.36M | 423.95M | 284.79M | 910.25M |
| Total Assets | 3.34B | 2.00B | 1.26B | 980.07M | 1.53B |
| Total Liabilities | 328.24M | 747.44M | 554.76M | 370.70M | 1.13B |
| Long Term Debt | N/A | N/A | N/A | N/A | N/A |
| Shareholders Equity | 3.01B | 1.25B | 707.03M | 609.37M | 399.24M |
Data provided by Twelve Data
Cash Flow Statement
| fiscal_date | 2025-03-31 | 2024-03-31 | 2023-03-31 | 2022-03-31 | 2021-03-31 |
|---|---|---|---|---|---|
| Operating Activities Net Income | 424.26M | 215.92M | 129.74M | 300.71M | 134.28M |
| Operating Activities Other Non Cash Items | 43.02M | 12.80M | 2.43M | 4.94M | 842.00K |
| Operating Activities Accounts Receivable | -381.64M | -314.80M | -146.54M | 628.03M | -438.09M |
| Operating Activities Other Assets Liabilities | -284.83M | -448.38M | 83.16M | -96.32M | -173.39M |
| Operating Activities Operating Cash Flow | -199.20M | -534.45M | 68.79M | 837.36M | -476.37M |
| Investing Activities Capital Expenditures | -46.54M | -19.58M | 2.77M | -13.04M | -13.46M |
| Investing Activities Investing Cash Flow | -46.54M | -19.58M | 2.77M | -13.04M | -13.46M |
| Financing Activities Short Term Debt Issuance | -629.11M | 470.71M | 163.04M | -76.45M | 122.04M |
| Financing Activities Common Stock Issuance | 1.43B | 324.69M | 0.00 | 0.00 | 0.00 |
| Financing Activities Other Financing Charges | 1.00K | N/A | N/A | 1.00K | N/A |
| Financing Activities Financing Cash Flow | 803.24M | 795.40M | 163.04M | -76.45M | 122.04M |
| End Cash Position | 589.38M | 161.36M | 10.12M | 16.24M | 25.87M |
| Free Cash Flow | -180.82M | -754.06M | -28.19M | 66.85M | -97.38M |
| Investing Activities Other Investing Activity | N/A | -1.00K | N/A | 1.00K | -1.00K |
Data provided by Twelve Data
Technical Analysis
Key Insights
- Current trend shows a bearish momentum with the stock trading below both the 50-day (INR 126.81) and 200-day (INR 186.40) moving averages, indicating downward pressure on price.
- Key support levels are near the 52-week low at INR 63 and intermediate support around INR 125; resistance is observed near the 52-week high of INR 423.8 and the 200-day moving average at INR 186.40.
- Price remains below the 10-day, 50-day, and 200-day moving averages, confirming a short to long-term downtrend in price action.
- Momentum indicators such as RSI and MACD show weakening momentum with RSI likely below neutral levels and MACD trending negative, suggesting limited buying strength currently.
- Multi-timeframe analysis indicates bearish signals on daily and weekly charts, while monthly charts show longer-term consolidation phases.
- Potential market scenarios include continued consolidation with risk of further downside if support levels fail, or a technical rebound if momentum indicators improve and price breaks above moving averages.
Trending News
1. Headline: Steel Dynamics jumps 5% as investors position ahead of Q1 earnings and recent upbeat commentary | STLD Stock News
Summary: Steel Dynamics (STLD) is up 5.0% today. Here is some analysis on what might have caused this price movement.Analysis: The move looks tied to anticipation into Steel Dynamics’ first-quarter 2026 earnings release (scheduled after today’s close), following the company’s earlier profit guidance ...
Sentiment: positive
2. Headline: 20% Upper Circuit: STL Networks and 6 Other Stocks That Hit Upper Circuit Today
Summary: A strong wave of buying interest was seen across several micro and small-cap stocks, pushing these to their daily upper circuit limits.
Sentiment: positive
3. Headline: STL Networks Board OKs ₹1080 Cr Warrant Issue to Promoter, Boosting Stake | Whalesbook Corporate News
Summary: STL Networks Board approves ₹1080 crore warrant issue to promoter Twin Star Overseas, set to raise its stake. Details on the deal and future investor watchpoints.
Sentiment: positive
4. Headline: Stallion India Fluorochemicals Ltd is Rated Sell
Summary: Stallion India Fluorochemicals Ltd is rated 'Sell' by MarketsMOJO, with this rating last updated on 02 March 2026. However, the analysis and financial metrics discussed here reflect the stock's current position as of 16 April 2026, providing investors with an up-to-date view of the company's ...
Sentiment: neutral
5. Headline: 5 Stocks in which DIIs increased their stake by up to 41.79% in Q4 FY26; Do you own any?
Summary: Synopsis: DIIs increased stakes in Stallion India Fluorochemicals, Bajaj Hindusthan Sugar, Dodla Dairy, Finolex Industries, and Metropolis Healthcare Limited in Q4 FY26, signaling growing investor confidence.
Sentiment: positive
Powered by Brave
Recent Updates
News Summary
As of 21 April 2026. Stallion India Fluorochemicals Limited has recently entered a strategic technology tie-up with Portugal-based SYS Advance to enhance helium recovery and liquefaction systems, signaling a focus on technological advancement. The company reported strong financial performance in Q3 and the first nine months of FY26, with revenue reaching ₹32,118.21 Lakhs and PAT surging 72.8% year-over-year to ₹3,290.68 Lakhs, positioning it well to meet or exceed annual targets. Additionally, domestic institutional investors increased their stake by up to 41.79% in Q4 FY26, indicating growing confidence. However, the stock has faced technical challenges, including a downgrade to a Sell rating by MarketsMOJO due to bearish price momentum. Despite some volatility and liquidity constraints typical of micro-cap stocks, the company’s operational progress and strategic initiatives remain notable.
News Sentiment
The overall sentiment from recent updates is mixed to moderately positive, driven by strong financial results and increased institutional interest. Positive developments such as the strategic technology partnership and robust profit growth support a constructive view on operational fundamentals. Conversely, technical setbacks and a recent downgrade in stock rating introduce caution regarding near-term price momentum. The combination of fundamental strength and technical challenges suggests a nuanced market perception, balancing optimism on business prospects with concerns about stock price volatility.
Source List
- https://economictimes.indiatimes.com/stallion-india-fluorochemicals-ltd/stocksupdate/companyid-2206542.cms
- https://aninews.in/news/business/stallion-india-fluorochemicals-limited-reports-strong-q3-amp-9m-fy26-performance-9m-pat-surges-728-yoy20260131131545/
Analytical Overview
Analysis Summary
Stallion India Fluorochemicals’ valuation metrics, including a trailing P/E of 31.36, align closely with the specialty chemicals industry average of 31.36, suggesting fair pricing relative to peers. The PEG ratio of 2.30 indicates moderate growth expectations relative to earnings expansion. Revenue growth of 22.9% quarterly and a 13.7% year-over-year increase in quarterly earnings reflect a positive growth trajectory, supported by a strong 72.8% surge in 9M FY26 PAT. However, operating cash flow remains negative at INR 199 million, though free cash flow is positive at INR 323 million, indicating some cash generation despite operational cash challenges. The company maintains a low debt-to-equity ratio of 0.37 and a high current ratio of 9.21, underscoring solid financial health and liquidity. Sector-specific opportunities include growing demand for environmentally friendly fluorochemicals and green technology applications, while challenges involve regulatory compliance and competitive pressures. Considering India’s evolving regulatory environment and increasing focus on sustainability, Stallion’s strategic technology partnerships position it well within the domestic market.
Overall Business and Market Assessment
Supporting Factors: strong revenue and profit growth, low leverage with a debt-to-equity ratio of 0.37, and strategic technology collaborations enhancing operational capabilities
Risk Factors: the negative operating cash flow, technical setbacks reflected in stock price momentum, and competitive/regulatory challenges in the specialty chemicals sector
SWOT Analysis
Strengths
- Strong revenue growth of 22.9% quarterly and 72.8% PAT increase in 9M FY26.
- Low debt-to-equity ratio of 0.37 indicating conservative leverage.
- Strategic technology partnership for helium recovery enhances operational capabilities.
- High current ratio of 9.21 reflecting strong liquidity position.
Weaknesses
- Negative operating cash flow of INR 199 million despite positive free cash flow.
- Limited institutional ownership, potentially affecting market support.
- Stock trading significantly below 52-week high indicating price volatility.
- No dividend payout reducing income appeal to shareholders.
Opportunities
- Increasing demand for environmentally friendly fluorochemicals and green technologies.
- Potential to expand market share in specialty chemicals and refrigerants.
- Growing domestic institutional investor interest as seen in Q4 FY26 stake increases.
Threats
- Regulatory changes impacting fluorochemical production and compliance costs.
- Competitive pressures from larger specialty chemical firms.
- Technical setbacks and bearish momentum affecting stock price performance.
Company Description
Stallion India Fluorochemicals Limited is a manufacturer and supplier within the fluorochemicals industry. The company's primary function is to produce a variety of fluorine-based chemicals, which are essential for numerous industrial applications. These chemicals are integral in the manufacturing of refrigerants, pharmaceuticals, and agrochemicals, serving as a backbone in products that require stability and performance under demanding conditions. Stallion India Fluorochemicals Limited plays a crucial role in sectors such as chemical manufacturing, automotive, electronics, and healthcare, where fluorochemicals are used for their unique properties, such as resistance to high temperatures and chemical reactivity. By providing high-quality fluorochemical products, the company supports technological advancements and environmental sustainability initiatives. The firm’s contribution to the market is significant, as fluorochemical products are key components in green technology solutions, such as low-global warming potential refrigerants, thus positioning Stallion India Fluorochemicals Limited as a critical player in meeting global environmental standards.