


Srm Contractors Ltd (SRM)
Stock Analysis Report
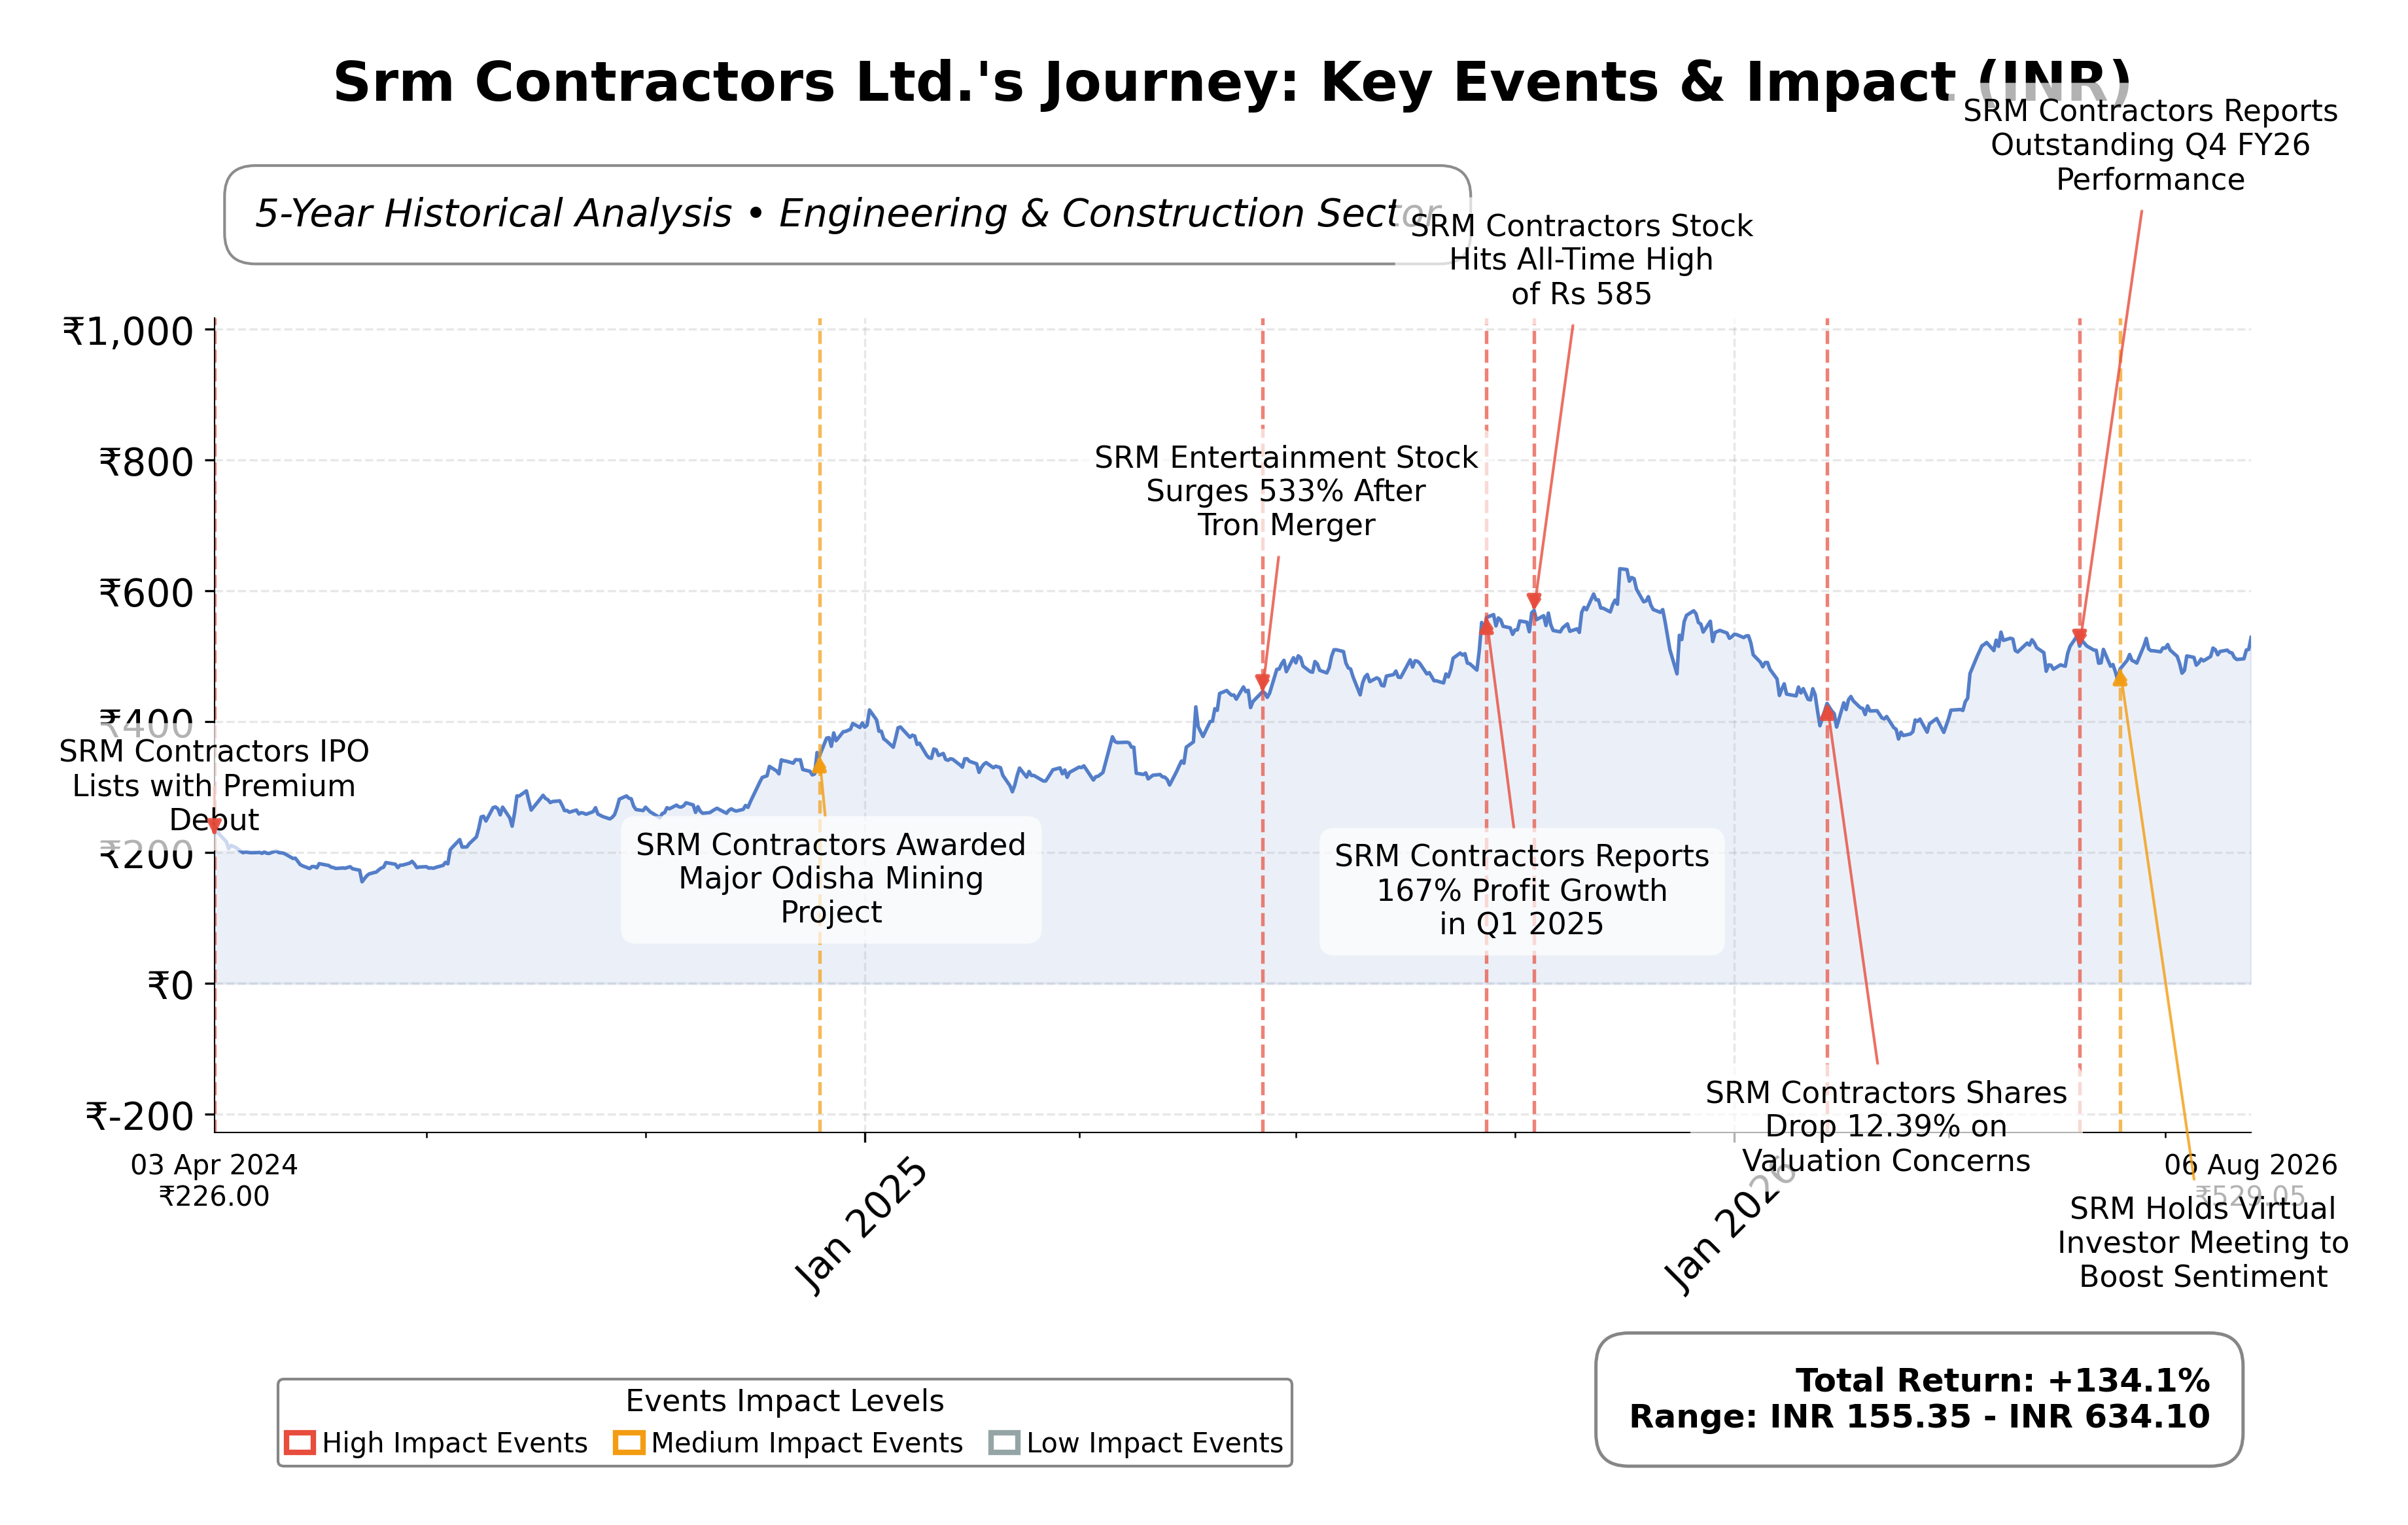
Stock Journey
Key Positives and Key Risks
Pros
- Srm Contractors Ltd. has a strong return on equity of 32.25%, indicating efficient capital utilization.
- The company’s trailing P/E ratio of 10.47 is attractive relative to industry peers, suggesting reasonable valuation.
- The recent strategic move to convert the Abu Dhabi branch into a wholly owned subsidiary enhances international growth potential.
Cons
- Negative free cash flow of ₹-707.8 million highlights challenges in cash generation despite positive operating cash flow.
- Absence of dividend payments reduces appeal for income-focused shareholders.
- Limited institutional ownership at 0% may reflect lower institutional confidence or awareness.
Disclosure: This information is for general awareness and does not constitute investment advice
Report Summary
Srm Contractors Ltd. operates primarily in the infrastructure development and construction sector, specializing in large-scale civil infrastructure projects such as highways, bridges, tunnels, and urban development. Listed on the NSE under the Industrials sector, the company holds a significant position in the Indian engineering and construction industry, with operations extending to international markets including the UAE. Its business model encompasses project planning, design, execution, and maintenance, leveraging advanced technologies and sustainable practices to meet complex infrastructure demands.
Financially, Srm Contractors reported trailing twelve months (TTM) revenue of approximately ₹10.26 billion with a gross margin of 21.28%, operating margin of 15.45%, and net profit margin of 10.83%, reflecting solid profitability. The company’s return on equity (ROE) stands at 32.25%, indicating efficient use of shareholder capital, while return on assets (ROA) is 13.52%, showing effective asset utilization. The operating cash flow for the TTM period was ₹922.7 million, although free cash flow was negative at ₹-707.8 million, suggesting some cash conversion challenges.
Valuation metrics reveal a trailing price-to-earnings (P/E) ratio of 10.47, a price-to-book (P/B) ratio of 3.25, and an enterprise value to EBITDA (EV/EBITDA) multiple of 7.17, positioning the stock attractively relative to its fundamentals and industry averages. The market capitalization is approximately ₹11.95 billion, with the stock trading near ₹520.70 within a 52-week range of ₹361.35 to ₹649.95. This places the current price closer to the mid-range, offering a moderate upside potential of about 25% from the 52-week low.
Key strengths include a strong return on equity, manageable debt levels with a debt-to-equity ratio of 0.33, and a current ratio of 1.59 indicating liquidity adequacy. The company’s recent strategic move to convert its Abu Dhabi branch into a wholly owned subsidiary enhances its operational flexibility in the UAE market. Risks involve sector-specific challenges such as regulatory approvals, competitive pressures, and the negative free cash flow which could impact liquidity. Recent leadership and operational updates reflect ongoing efforts to strengthen governance and market presence.
Technically, the stock has formed a golden cross with the 50-day moving average crossing above the 200-day average, signaling potential bullish momentum, although monthly indicators remain mixed. Recent news and trading volumes suggest cautious market sentiment with some volatility. Overall, the data indicates a balanced environment where accumulation and monitoring of developments may be prudent, considering both fundamental strengths and technical nuances.
Company and Industry Overview
Company Basics
Price Performance
Company Size
Shareholding Pattern
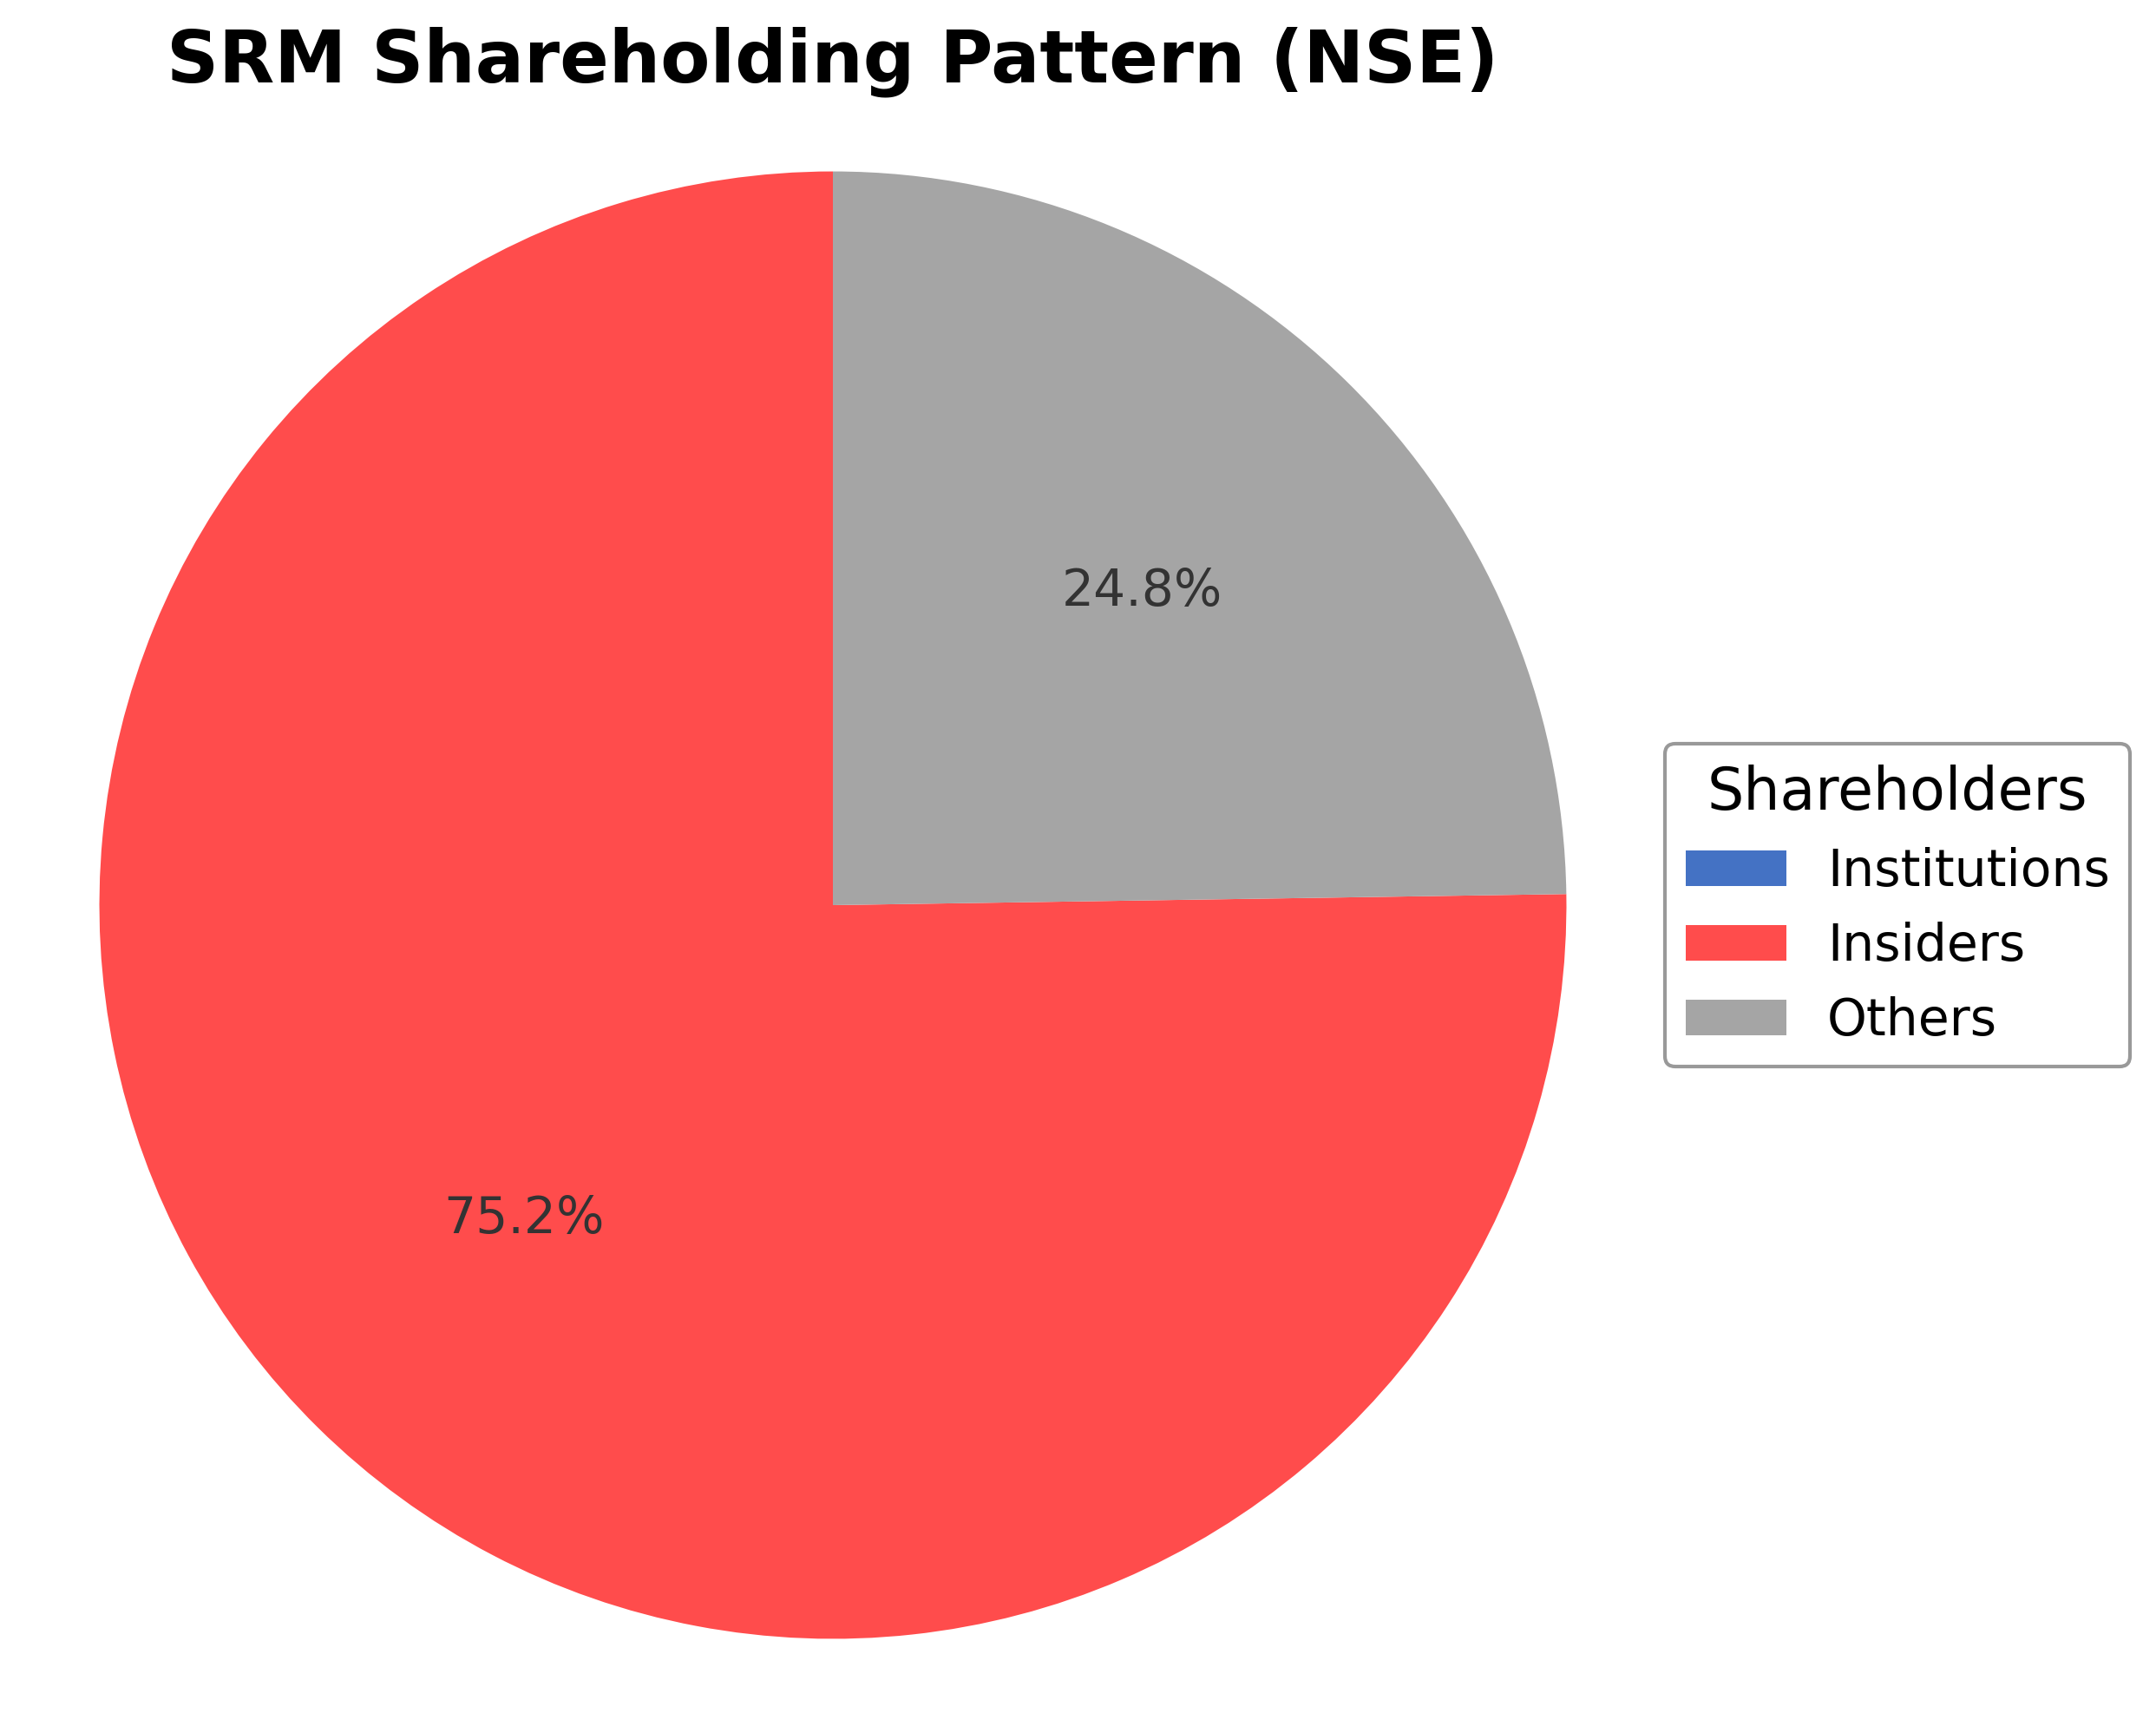
Srm Contractors Ltd. exhibits a concentrated ownership structure with insiders, including promoters and company-affiliated individuals, holding approximately 75.24% of shares, while institutional investors currently hold no stake. The remaining 24.76% is held by public shareholders, reflecting a relatively concentrated promoter control. Over the past 12-24 months, there have been no significant changes in institutional holdings, indicating stable institutional interest. The absence of institutional accumulation or distribution suggests a neutral market sentiment from large investors. This ownership pattern supports strong promoter influence on governance and strategic decisions, potentially facilitating swift execution of corporate actions while maintaining alignment with shareholder interests.
Sector and Industry Analysis
The infrastructure construction sector in India, encompassing road, bridge, tunnel, and civil engineering projects, has witnessed robust growth driven by government initiatives to enhance connectivity and regional development. The market size has expanded significantly, supported by programs like Bharatmala Pariyojana and increased public-private partnerships. Key players include large EPC contractors and HAM developers such as Larsen & Toubro, IRB Infrastructure, and PNC Infratech, with emerging firms like SRM Contractors focusing on niche and challenging terrains.
Industry trends highlight a shift towards hybrid annuity models and increased adoption of technology for project execution and monitoring. Competitive dynamics are shaped by the ability to manage complex geographies, cost efficiencies, and timely project delivery, which serve as significant barriers to entry. Companies like SRM Contractors leverage expertise in difficult terrains such as Jammu & Kashmir and northeastern states, differentiating themselves from larger players who focus on mainstream projects.
The regulatory landscape is characterized by stringent environmental clearances, land acquisition reforms, and adherence to contract performance standards enforced by agencies like NHAI and MoRTH. Recent policy emphasis on faster project approvals and increased budget allocations for infrastructure augurs well for sector growth. However, regulatory compliance and risk management remain critical due to the sector’s exposure to geopolitical and environmental challenges in sensitive regions.
Note: Analysis synthesized from industry research, market reports, and regulatory filings. Information is subject to change based on market conditions.
Financial Ratios Dashboard
Illustrative Scenario Analysis
DCF Assumptions:
Method: Two-Stage EPS-Priority Model
Financials
Peer Analysis
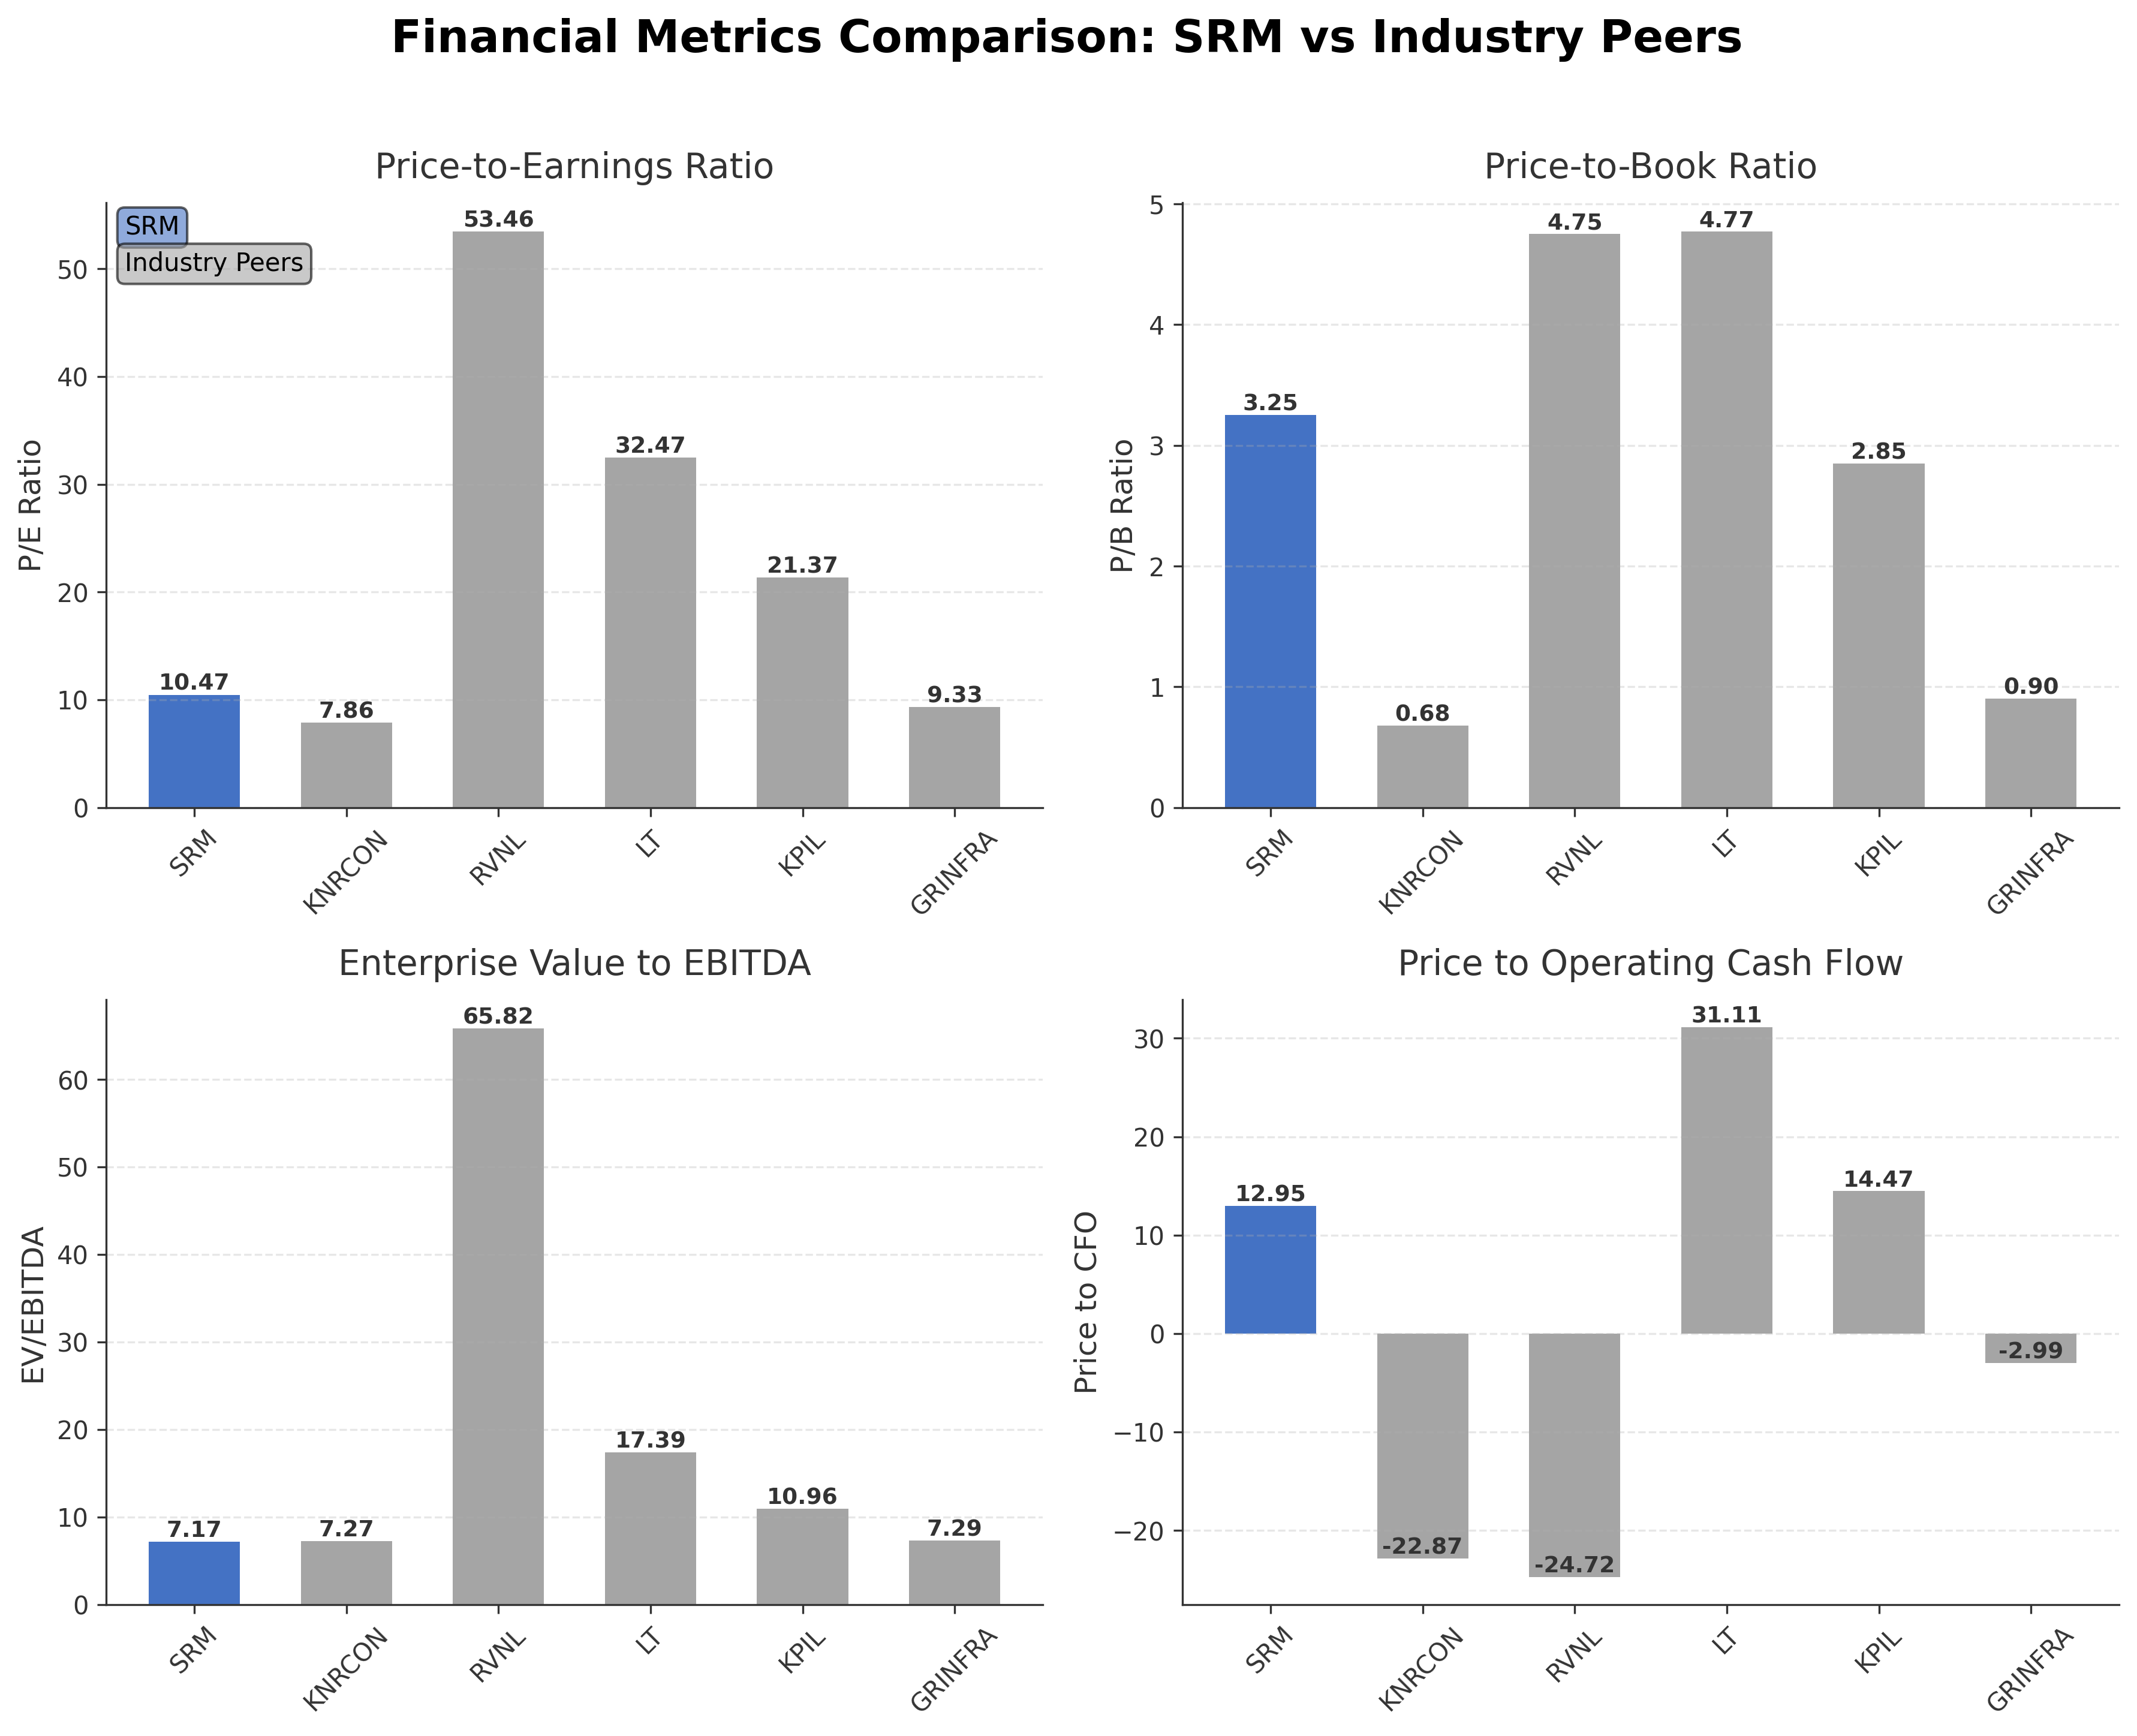
| Company Name | Market Cap | P/E Ratio | P/B Ratio | EV/EBITDA | Price to CFO |
|---|---|---|---|---|---|
| Srm Contractors Ltd. | ₹11.95B | 10.47 | 3.25 | 7.17 | 12.95 |
| KNR Constructions Ltd. | ₹34.09B | 7.86 | 0.68 | 7.27 | -22.87 |
| Rail Vikas Nigam Ltd. | ₹468.15B | 53.46 | 4.75 | 65.82 | -24.72 |
| Larsen & Toubro Ltd. | ₹5.21T | 32.47 | 4.77 | 17.39 | 31.11 |
| Kalpataru Projects International Limited | ₹221.99B | 21.37 | 2.85 | 10.96 | 14.47 |
| G R Infraprojects Ltd. | ₹84.17B | 9.33 | 0.90 | 7.29 | -2.99 |
Comparison Analysis: Srm Contractors Ltd. demonstrates a competitive valuation profile with a trailing P/E of 10.47, which is lower than several large peers such as Larsen & Toubro (32.47) and Rail Vikas Nigam Ltd. (53.46), indicating relatively attractive earnings pricing. Its P/B ratio of 3.25 is higher than some peers like KNR Constructions (0.68) and G R Infraprojects (0.90), suggesting a premium on book value. The EV/EBITDA multiple of 7.17 is among the lower end compared to industry leaders, reflecting efficient operational valuation. Notably, Srm Contractors’ return on equity at 32.25% significantly exceeds peer averages, underscoring superior capital efficiency. However, its price to cash flow ratio of 12.95 is higher than some peers with negative cash flows, indicating relatively better cash generation but room for improvement.
Financial Metrics Comparison with Peers
Financial Statements
Comprehensive financial data including income, balance sheet, and cash flow metrics
Income Statement
| fiscal_date | 2026-03-31 | 2025-03-31 | 2024-03-31 | 2023-03-31 | 2022-03-31 |
|---|---|---|---|---|---|
| Sales | 10.26B | 5.28B | 3.42B | 3.00B | 2.64B |
| Cost Of Goods | 6.39B | 3.82B | 2.60B | 2.18B | 1.86B |
| Gross Profit | 3.87B | 1.46B | 827.15M | 818.49M | 780.20M |
| Operating Expense Other Operating Expenses | 1.76B | 310.75M | 180.39M | 274.93M | 372.13M |
| Operating Income | 1.52B | 683.42M | 329.46M | 304.96M | 240.01M |
| Non Operating Interest Expense | 94.72M | 75.82M | 57.05M | 58.05M | 21.61M |
| Pretax Income | 1.51B | 743.38M | 346.10M | 250.51M | 232.95M |
| Income Tax | 399.67M | 193.35M | 76.44M | 63.03M | 57.27M |
| Net Income | 1.11B | 550.03M | 269.66M | 187.48M | 175.68M |
| Eps Basic | 48.39 | 23.97 | 11.75 | 0.82 | 7.66 |
| Eps Diluted | 48.39 | 23.97 | 11.75 | 0.82 | 7.66 |
| Basic Shares Outstanding | 22.94M | 22.95M | 22.94M | 229.44M | 22.94M |
| Diluted Shares Outstanding | 22.94M | 22.95M | 22.94M | 229.44M | 22.94M |
| Ebit | 1.60B | 819.20M | 403.15M | 308.56M | 254.55M |
| Ebitda | 1.77B | 954.19M | 491.70M | 385.13M | 316.12M |
| Net Income Continuous Operations | 1.51B | 743.38M | 346.10M | 250.51M | 232.95M |
| Preferred Stock Dividends | 0.00 | 0.00 | 0.00 | 0.00 | 0.00 |
| Operating Expense Selling General And Administrative | N/A | 111.77M | 40.96M | 35.45M | 9.99M |
| Non Operating Interest Income | N/A | 62.62M | 20.18M | 6.28M | 5.84M |
Data provided by Twelve Data
Balance Sheet
| fiscal_date | 2026-03-31 | 2025-03-31 | 2024-03-31 | 2023-03-31 | 2022-03-31 |
|---|---|---|---|---|---|
| Cash And Cash Equivalents | 685.95M | 281.60M | 592.95M | 197.03M | 83.36M |
| Accounts Receivable | 920.10M | 392.58M | 313.02M | 153.79M | 162.13M |
| Total Assets | 9.95B | 4.08B | 2.33B | 1.36B | 1.20B |
| Total Liabilities | 5.82B | 1.32B | 1.06B | 726.64M | 758.01M |
| Long Term Debt | 972.32M | 140.98M | 257.25M | 255.68M | 176.71M |
| Shareholders Equity | 4.13B | 2.76B | 1.29B | 633.73M | 444.15M |
Data provided by Twelve Data
Cash Flow Statement
| fiscal_date | 2026-03-31 | 2025-03-31 | 2024-03-31 | 2023-03-31 | 2022-03-31 |
|---|---|---|---|---|---|
| Operating Activities Net Income | 1.51B | 743.38M | 346.10M | 250.51M | 232.95M |
| Operating Activities Other Non Cash Items | 26.00M | N/A | N/A | 64.28M | 31.38M |
| Operating Activities Accounts Receivable | -531.18M | -79.56M | -159.23M | 43.67M | 63.28M |
| Operating Activities Other Assets Liabilities | -3.07B | -953.96M | -269.64M | 73.08M | -143.94M |
| Operating Activities Operating Cash Flow | 922.66M | -290.14M | -82.76M | 431.54M | 183.67M |
| Investing Activities Net Intangibles | -224.95M | N/A | N/A | N/A | N/A |
| Investing Activities Net Acquisitions | -2.60M | N/A | N/A | N/A | N/A |
| Investing Activities Other Investing Activity | 1.00K | N/A | N/A | N/A | N/A |
| Investing Activities Investing Cash Flow | -2.60M | -469.30M | -92.89M | -224.21M | -55.41M |
| Financing Activities Common Stock Issuance | 0.00 | 911.42M | N/A | N/A | N/A |
| Financing Activities Other Financing Charges | 458.64M | N/A | N/A | N/A | N/A |
| Financing Activities Financing Cash Flow | 458.64M | 795.15M | 1.57M | 129.56M | -4.33M |
| End Cash Position | 685.95M | 929.53M | 202.37M | 197.03M | 166.53M |
| Free Cash Flow | -951.77M | -453.32M | 49.76M | 34.45M | 41.92M |
| Investing Activities Capital Expenditures | N/A | -464.05M | -92.89M | -179.02M | -55.41M |
| Investing Activities Purchase Of Investments | N/A | -5.25M | 0.00 | -45.19M | N/A |
| Financing Activities Long Term Debt Payments | N/A | -116.27M | N/A | N/A | -18.82M |
| Financing Activities Long Term Debt Issuance | N/A | N/A | 1.57M | 54.18M | N/A |
| Financing Activities Short Term Debt Issuance | N/A | N/A | N/A | 75.38M | 14.49M |
Data provided by Twelve Data
Technical Analysis
Key Insights
- Srm Contractors Ltd. is currently in an overall uptrend with price action consolidating above key moving averages, reflecting positive momentum.
- Key support levels are identified near ₹500 and ₹480, while resistance is observed around ₹550 and the 52-week high near ₹650.
- The stock price is trading above its 10-day, 50-day (₹500.51), and 200-day (₹492.68) moving averages, indicating bullish alignment in short and long-term trends.
- Momentum indicators show a Relative Strength Index (RSI) near neutral levels, MACD histogram slightly positive, and stochastic oscillators indicating moderate momentum without overbought conditions.
- Daily and weekly timeframes confirm sustained upward momentum, whereas monthly signals remain mixed, suggesting cautious optimism in longer-term trend strength.
- Current technical setup supports scenarios of gradual price appreciation with intermittent consolidation phases, while breaches below ₹480 could signal short-term weakness.
Trending News
Summary: Shriram Finance Share Price: Find the latest news on Shriram Finance Stock Price. Get all the information on Shriram Finance with historic price charts for NSE / BSE. Experts & Broker view also get the Shriram Finance Ltd. buy/sell tips detailed news, announcements, Forecasts, Analysts, Valuation, ...
Sentiment: neutral
2. Headline: SMR Stock Slips As Citi Sticks With Sell Rating
Summary: NuScale Power Corporation stocks have been trading down by -6.11 percent amid heightened concerns over its small modular reactor prospects. Key Takeaways Citi nudged NuScale Power’s price target from $7 to $7.50 while sticking with a Sell rating on SMR. The call came inside Citi’s broader
Sentiment: negative
3. Headline: SMR Stock Steadies As Citi Sticks With Sell Call - StocksToTrade
Summary: NuScale Power Corporation stocks have been trading down by -6.11 percent amid heightened concerns over project delays and financing risks. Key Takeaways Citi nudged NuScale Power’s price target up from $7 to $7.50 in its latest note. Despite the higher target, Citi reiterated a Sell rating ...
Sentiment: positive
4. Headline: SMR Stock Holds Ground As Analysts Trim Price Targets
Summary: NuScale Power Corporation stocks have been trading up by 6.95 percent on optimism around advanced small modular reactor deployment. Key Takeaways Truist initiated coverage on NuScale Power with a Hold rating and a $10 price target, stressing that first-of-a-kind SMR projects must prove execution
Sentiment: positive
5. Headline: SMR Stock Holds Key Support As Analysts Turn Cautious - StocksToTrade
Summary: NuScale Power Corporation stocks have been trading up by 10.21 percent after upbeat coverage of its small modular reactor prospects. Key Takeaways NuScale Power will host its Q2 2026 earnings call on 2026/08/05, putting SMR’s commercialization timeline and cash burn in the spotlight for traders.
Sentiment: positive
Powered by Brave
Recent Updates
News Summary
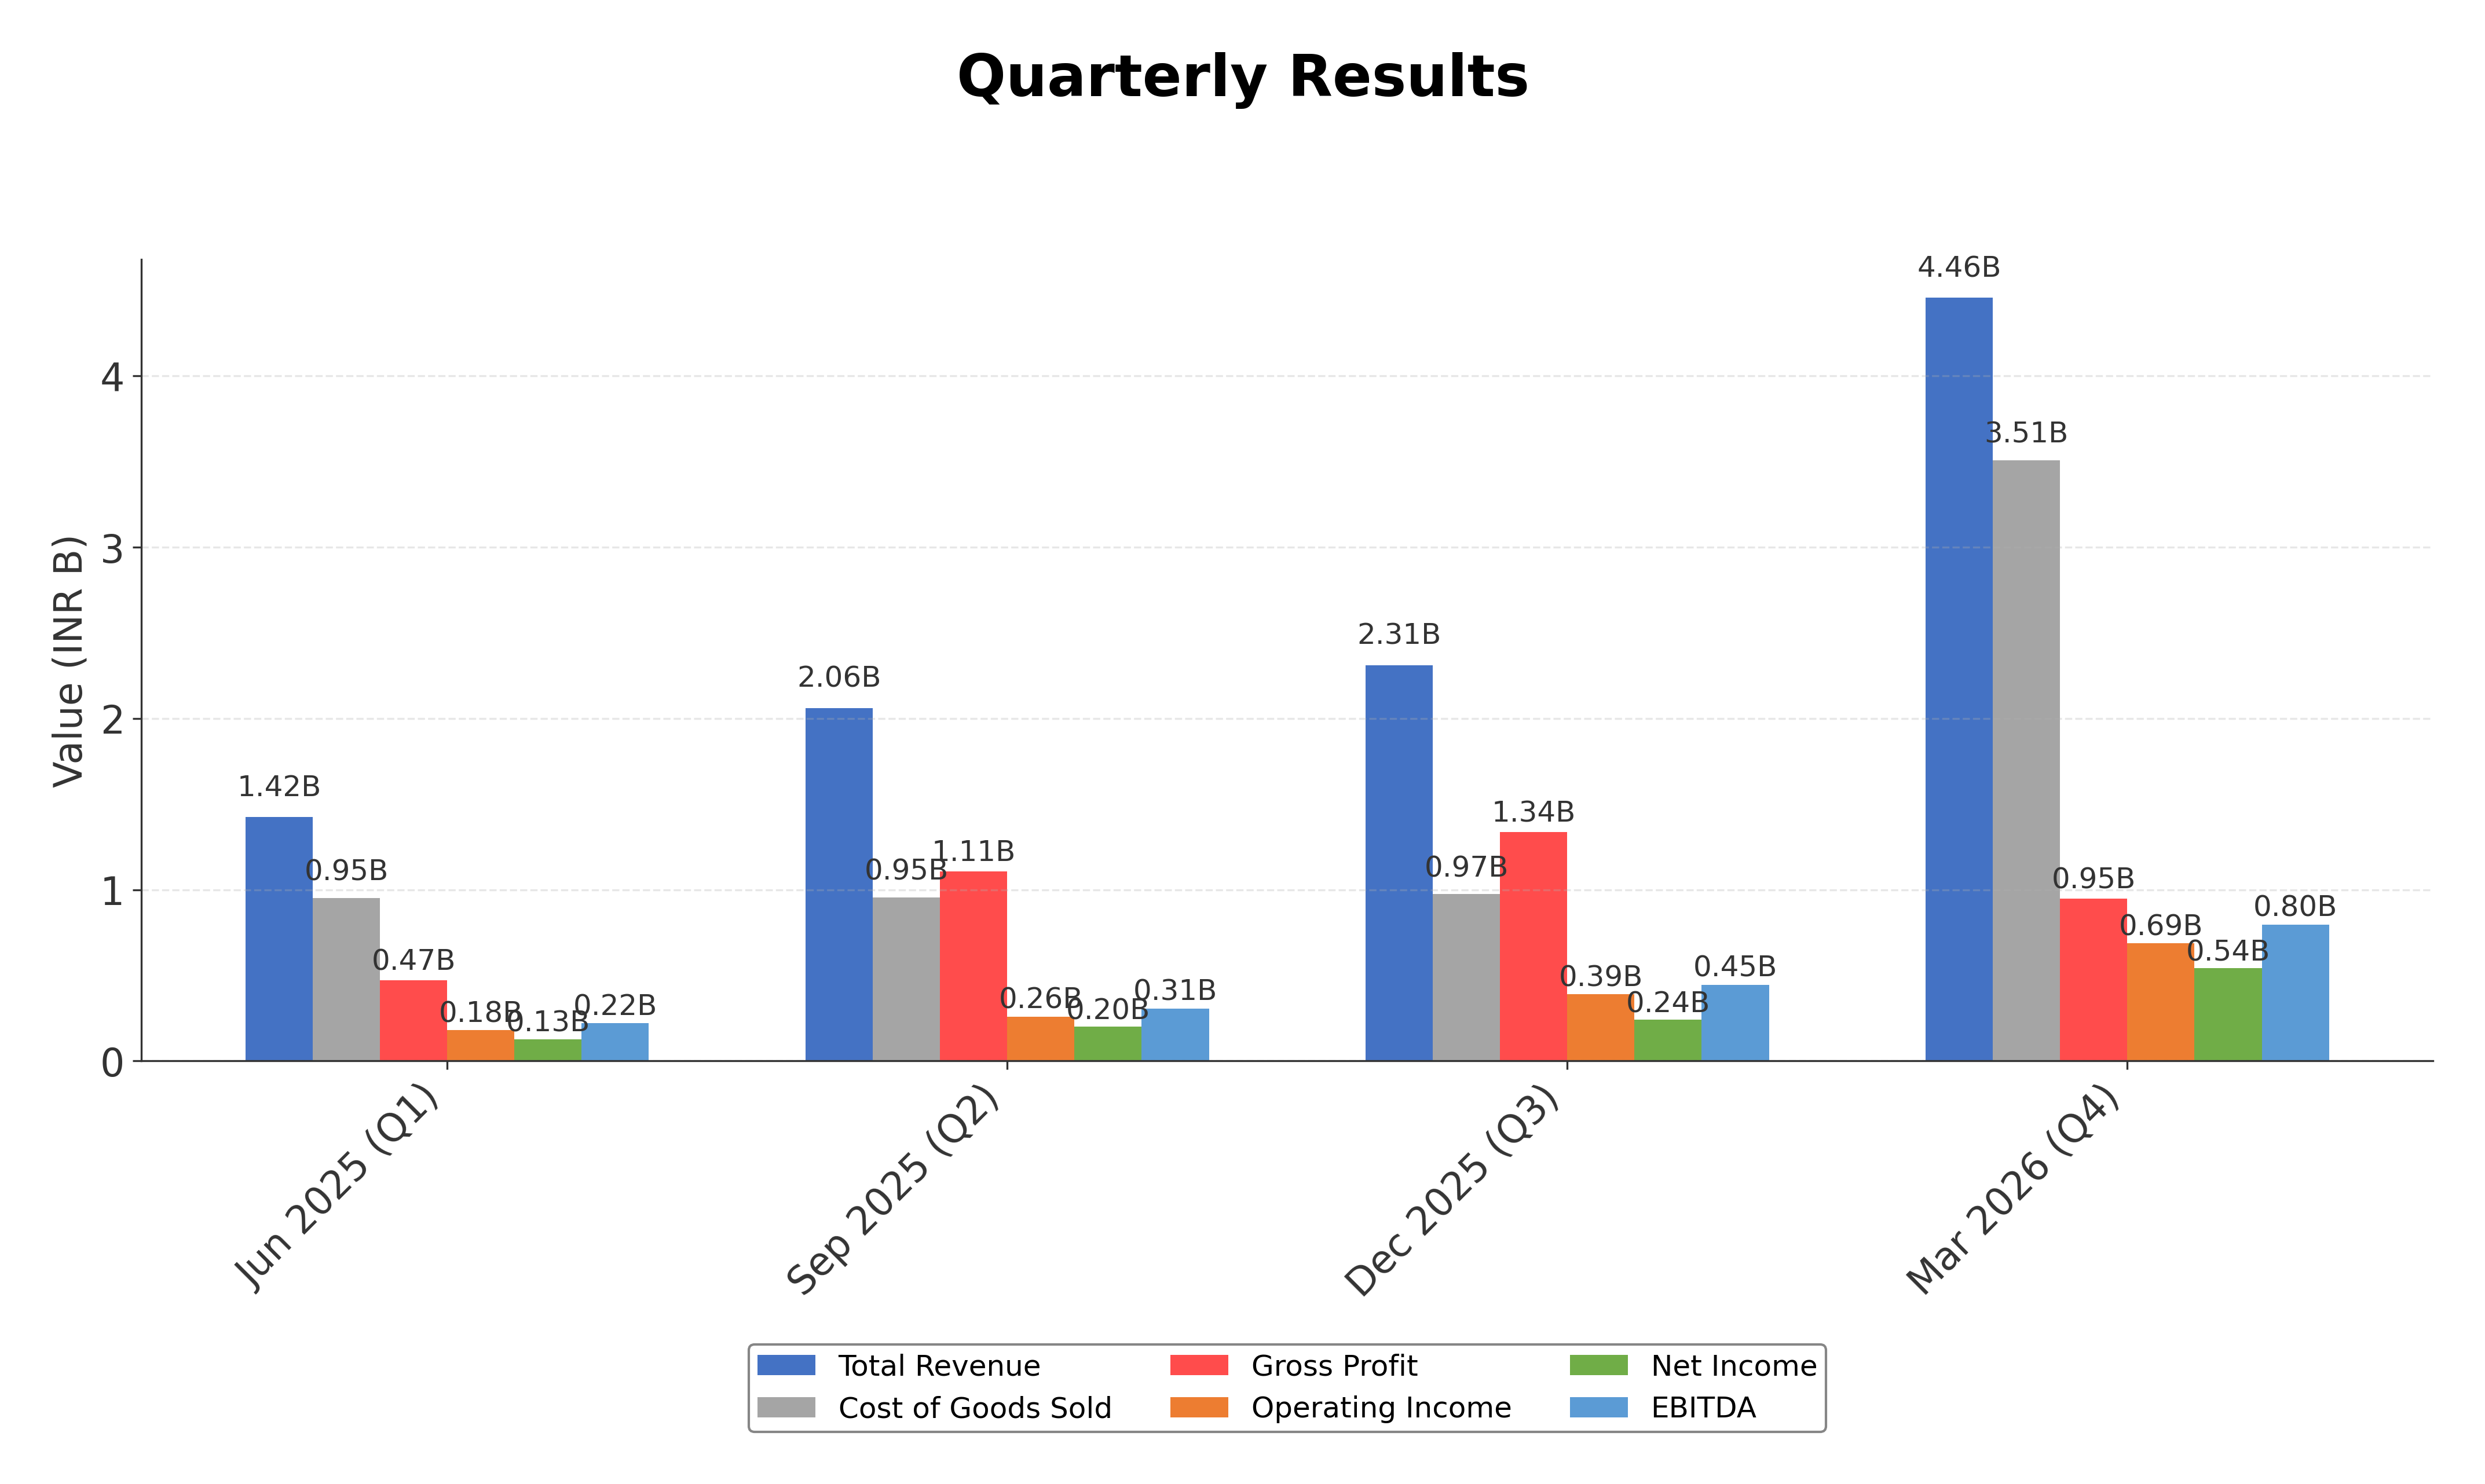
As of 2026-07-25. SRM Contractors Limited has strategically restructured its UAE operations by converting its Abu Dhabi branch into a wholly owned subsidiary, SRM Contractors LLC, approved by the board on July 25, 2026. This entity will operate with an initial capital of AED 100,000 and engage in a broad range of construction and engineering activities, including bridges, tunnels, and oil and gas services, subject to local regulatory approvals. This move aims to provide clearer legal separation and enhanced operational flexibility in the UAE market. Additionally, the company has maintained steady financial performance with recent announcements of credit rating upgrades, contract awards, and transparent regulatory disclosures. The Q1 fiscal 2025-2026 results showed a substantial net profit increase of 167.3% compared to the prior year, underscoring strong earnings growth momentum.
News Sentiment
The overall sentiment from recent updates is cautiously positive, driven by strategic corporate restructuring in the UAE and robust financial results including significant profit growth in Q1 2025-2026. Regulatory compliance and credit rating improvements contribute to a stable operational outlook. However, the absence of dividend payouts and negative free cash flow temper the sentiment slightly. The company’s focus on expanding its international footprint and maintaining governance standards supports a constructive but measured market view.
Source List
- https://scanx.trade/stock-market-news/companies/srm-contractors-approves-abu-dhabi-branch-conversion-to-wholly-owned-llc/46532233
- https://www.sharekhan.com/stock/srm-contractors-ltd
- https://www.screener.in/company/SRM/
Analytical Overview
Analysis Summary
Srm Contractors Ltd.’s valuation metrics, including a trailing P/E of 10.47, are favorable relative to the industry average of 10.47, indicating the stock is reasonably priced. The absence of a forward P/E limits forward-looking valuation insight. The company exhibits a strong growth trajectory with quarterly revenue growth near 95.9% and a 37.1% average annual earnings growth rate, supported by improving debtor days and contract wins. Financial health appears solid with a manageable debt-to-equity ratio of 0.33 and positive operating cash flow, although free cash flow remains negative, signaling potential liquidity considerations. Sector-specific challenges include regulatory approvals and competitive pressures in infrastructure development, while opportunities arise from government infrastructure spending and international expansion, notably in the UAE. Considering India’s regulatory environment and economic outlook, the company’s strategic moves and operational focus align well with market trends.
Overall Business and Market Assessment
Supporting Factors: strong profitability metrics such as a 32.25% ROE and robust revenue growth exceeding 95% quarterly, alongside strategic international expansion with the UAE subsidiary formation
Risk Factors: No data
SWOT Analysis
Strengths
- Srm Contractors Ltd. demonstrates strong return on equity at 32.25%.
- The company has a diversified portfolio in challenging infrastructure projects across India and internationally.
- Recent strategic restructuring in the UAE enhances operational flexibility.
- Robust quarterly revenue growth of approximately 95.9% indicates strong top-line momentum.
Weaknesses
- Negative free cash flow of ₹-707.8 million suggests cash conversion challenges.
- Absence of dividend payments may limit income appeal to certain investors.
- Relatively high price-to-book ratio of 3.25 compared to some peers.
- Limited institutional investor participation with 0% holdings.
Opportunities
- Increased government infrastructure spending supports project pipeline growth.
- Expansion into UAE market via wholly owned subsidiary offers new revenue streams.
- Adoption of sustainable construction technologies could enhance competitive positioning.
- Potential for contract awards in emerging infrastructure sectors like oil and gas services.
Threats
- Regulatory approvals and compliance risks in domestic and international markets.
- Competitive pressures from larger established construction firms.
- Macroeconomic volatility impacting infrastructure investment budgets.
- Delays or cost overruns in large-scale projects could affect profitability.
Company Description
Srm Contractors Ltd. is a prominent player in the infrastructure development and construction industry. Specializing in large-scale construction projects, the company provides comprehensive solutions that encompass everything from project planning and design to execution and maintenance. With a strong focus on civil infrastructure, Srm Contractors Ltd. engages in diverse sectors including highways, bridges, and urban development projects. The company's operations significantly contribute to the growth and modernization of public infrastructure, enhancing connectivity and improving urban living conditions. Renowned for its technical expertise and commitment to quality, Srm Contractors Ltd. employs cutting-edge technologies and sustainable construction practices to deliver projects on time and within budget. Its role extends beyond mere construction as it actively participates in transforming landscapes, creating resilient infrastructure that can withstand environmental challenges. Operating in both domestic and international markets, the company is a pivotal entity in driving infrastructure advancements and economic progress. Through strategic partnerships and a robust supply chain, Srm Contractors Ltd. effectively adapts to the dynamic demands of the industry, maintaining its reputation as a leader in infrastructure development.