


Solar Industries India Ltd (SOLARINDS)
Stock Analysis Report
Stock Journey
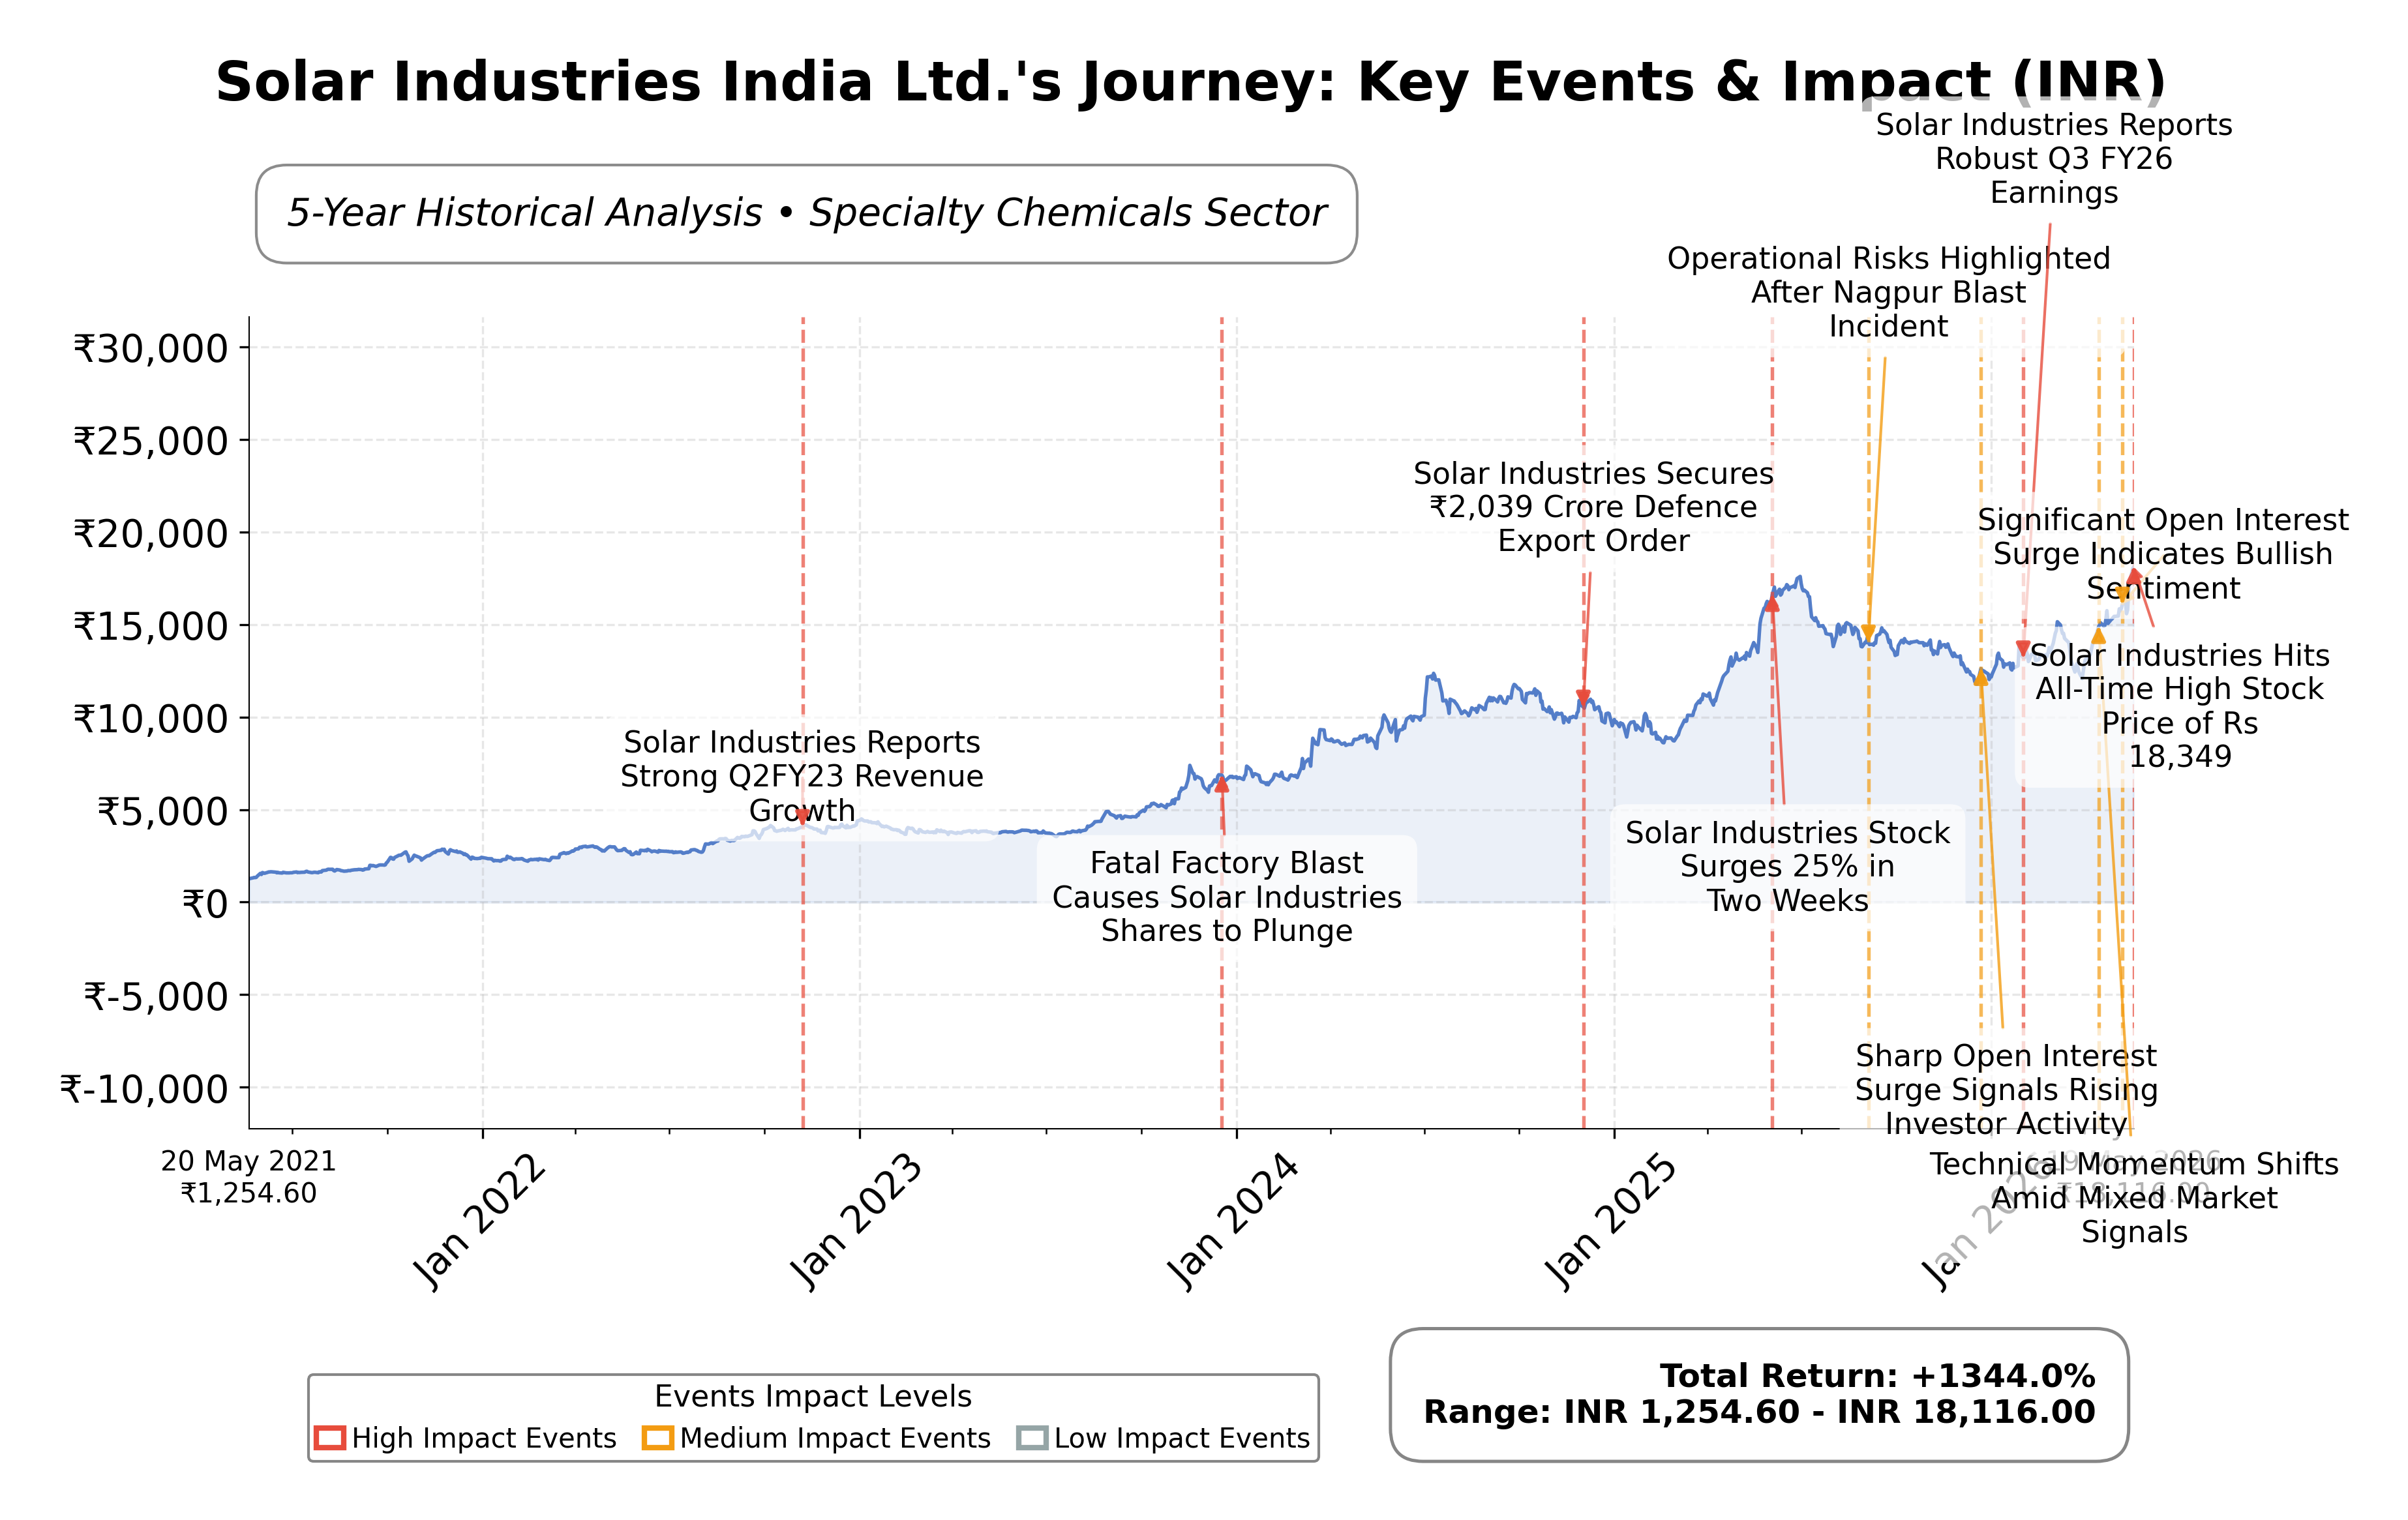
Key Positives and Key Risks
Pros
- Strong revenue growth of 40.9% quarterly and 325% international business expansion supports growth potential.
- High return on equity at 31.33% demonstrates efficient capital use and profitability.
- Healthy current ratio of 2.06 and moderate debt-to-equity ratio of 0.23 indicate financial stability.
Cons
- Extremely high valuation multiples with trailing P/E of 93.46 and price-to-book of 30.63 suggest stretched pricing.
- Negative free cash flow of INR -13.15 billion raises concerns about capital expenditure and liquidity.
- Input cost inflation from rising ammonium nitrate prices could pressure margins and earnings.
Disclosure: This information is for general awareness and does not constitute investment advice
Report Summary
Solar Industries India Ltd. operates primarily in the specialty chemicals sector, with a core focus on manufacturing industrial explosives, detonators, and ammunition. The company serves critical markets including mining, construction, and defense, positioning itself as a key supplier for infrastructure projects and national security. Listed on the NSE in India under the Basic Materials sector, Solar Industries has a significant presence both domestically and internationally, leveraging its expertise to support high-stakes applications.
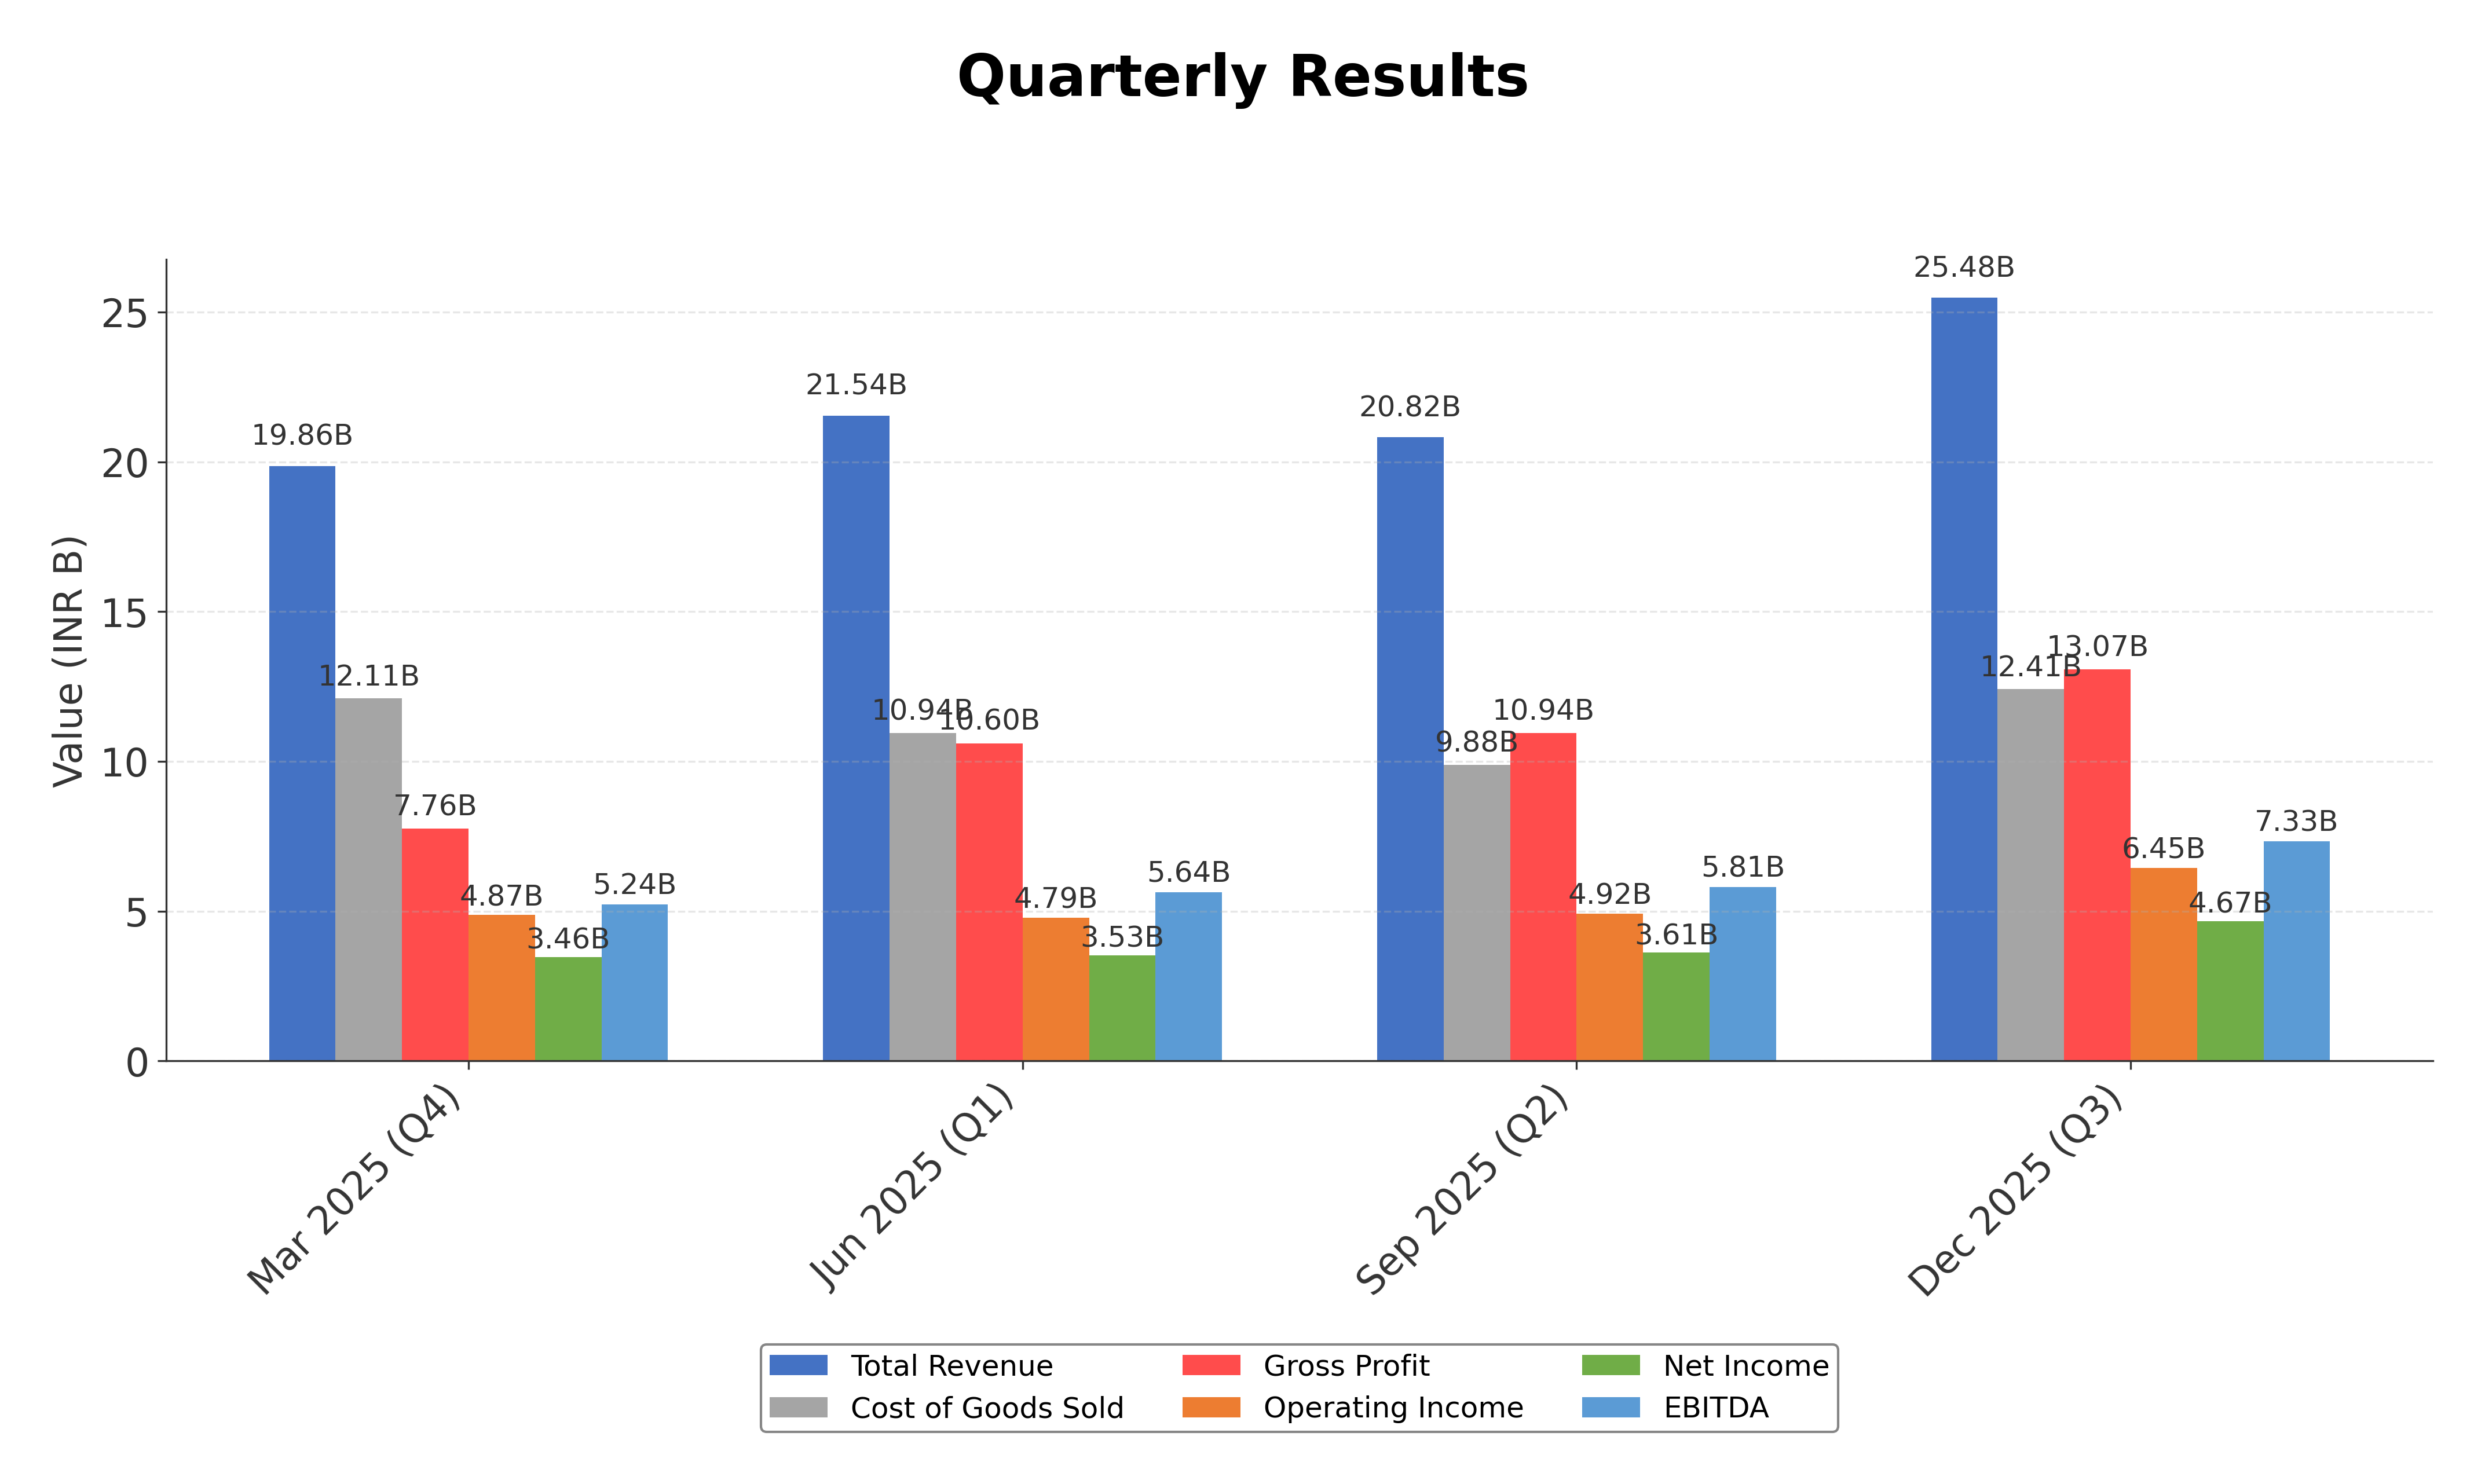
Financially, the company reported trailing twelve months (TTM) revenue of approximately INR 98.38 billion with a gross margin of 51.29%, operating margin of 26.17%, and net profit margin of 17.05%. Return on equity (ROE) stands at 31.33%, return on assets (ROA) at 15.45%, and return on invested capital (ROIC) is robust, reflecting efficient capital utilization and solid profitability. Quarterly revenue growth is strong at 40.9%, and net income has increased significantly, underscoring operational strength and growth momentum.
Valuation metrics indicate a trailing P/E ratio of 93.46 and a forward P/E of 56.14, with a price-to-book ratio of 30.63 and an enterprise value to EBITDA multiple of 60.22. The market capitalization is approximately INR 1.57 trillion. The stock currently trades near its 52-week high of INR 17,820, with a current price of INR 18,300, reflecting a premium valuation relative to industry peers. The PEG ratio of 2.24 suggests growth expectations are priced in, while dividend yield remains low at 0.23%.
Key strengths include strong cash flow generation, a healthy current ratio of 2.06, and moderate debt levels with a debt-to-equity ratio of 0.23. The company has demonstrated leadership in the defense explosives segment, with a rapidly growing defense business and a robust order book. Risks include stretched valuation multiples, input cost pressures from rising ammonium nitrate prices, and competitive dynamics in specialty chemicals. Recent strategic initiatives include expansion in defense revenues and product innovation such as the Bhargavastra anti-drone platform.
Technically, the stock exhibits bullish momentum with an ascending triangle pattern and trading above key moving averages (50-day and 200-day). Momentum indicators signal strength across multiple timeframes, supported by rising open interest and volume. Overall, the data suggests a market environment favoring continued accumulation and interest, tempered by valuation considerations and input cost risks warranting ongoing monitoring.
Company and Industry Overview
Company Basics
Price Performance
Company Size
Shareholding Pattern
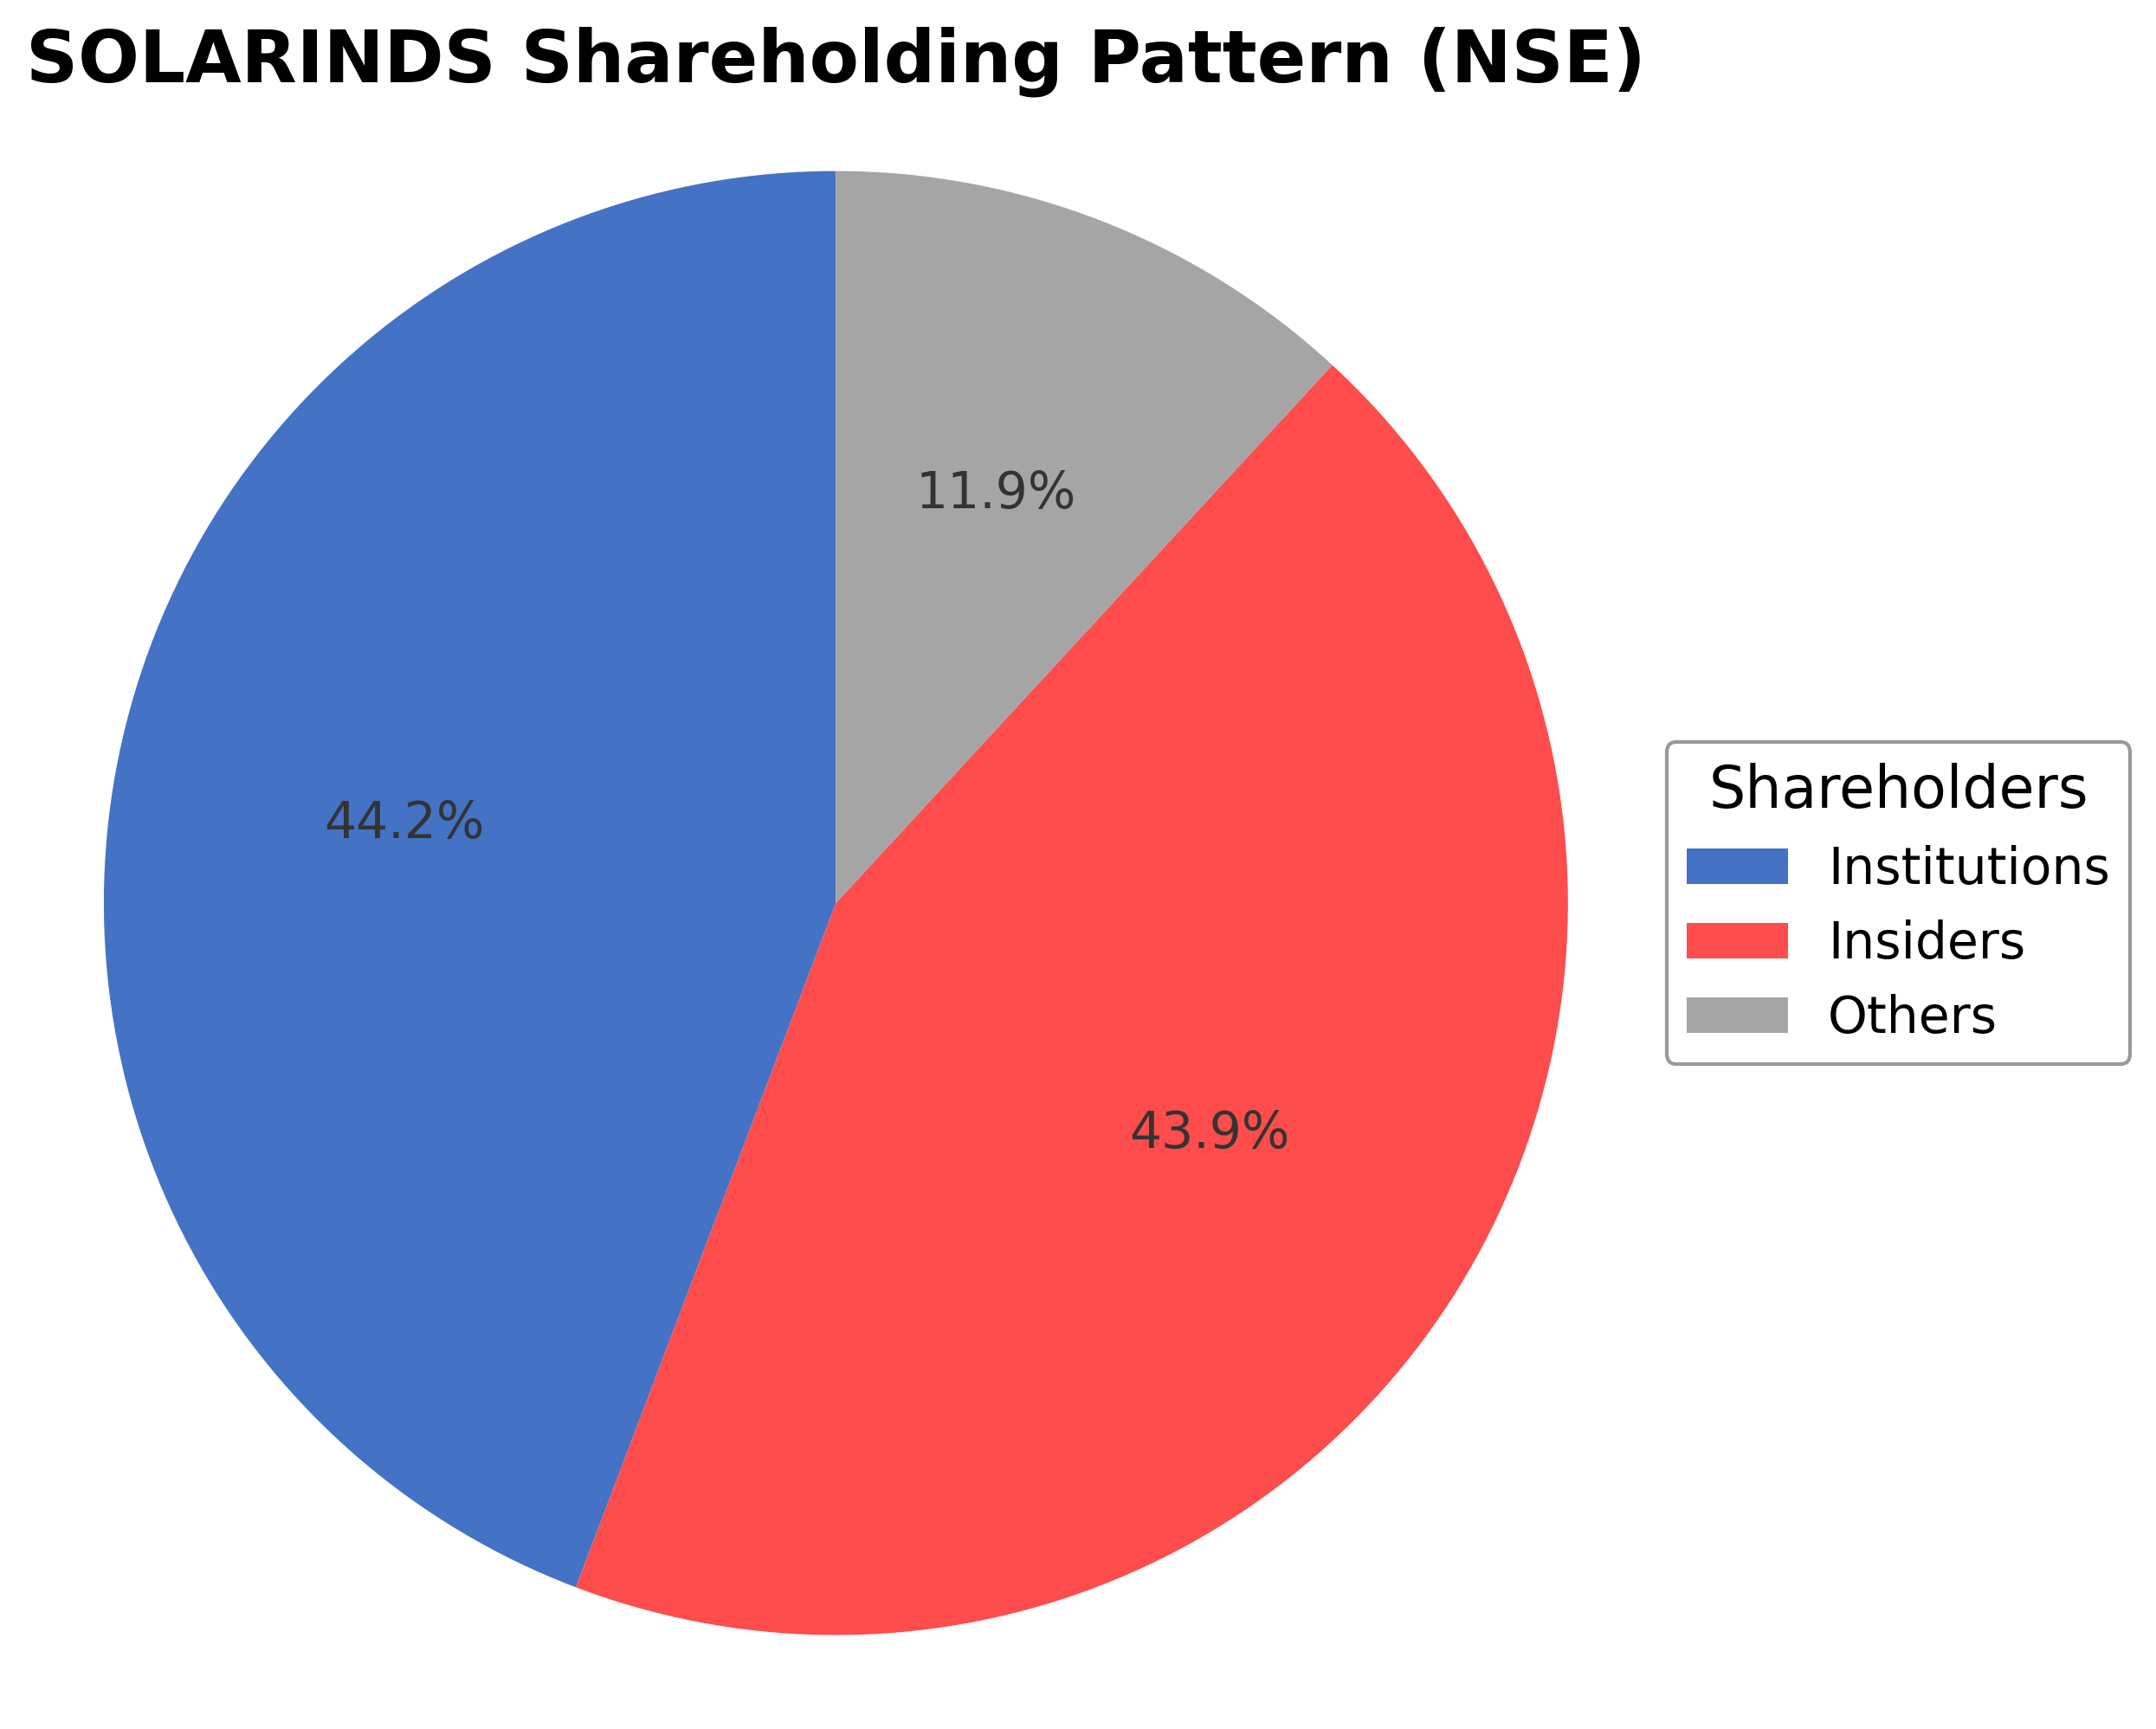
Solar Industries India Ltd.'s ownership structure is characterized by significant insider holdings at 43.92%, complemented by institutional investors holding 44.22%, and the remaining shares held by public and other shareholders at approximately 11.86%. Over the past 12-24 months, institutional investors have shown steady accumulation, reflecting confidence in the company's growth trajectory, while insiders maintain substantial stakes indicative of aligned governance interests. Major funds have increased positions in line with the company's expanding defense and industrial explosives business. This shareholding pattern suggests a balanced market sentiment with strong governance oversight and strategic focus on long-term value creation.
Sector and Industry Analysis
The solar power sector in India is experiencing rapid expansion, with the market projected to reach approximately USD 1,413 billion by 2030, growing at a compound annual growth rate (CAGR) of 49.5% from 2025 to 2030. This growth is driven by increasing energy demand, government commitments to decarbonization, and the economic competitiveness of photovoltaic technology. Key players include utility-scale developers, rooftop solar providers, and domestic manufacturers of solar modules and components, supported by a growing ecosystem of engineering, procurement, and construction (EPC) firms.
Industry trends highlight a strategic shift towards domestic solar module manufacturing to reduce import dependence, alongside a surge in rooftop solar installations across residential and commercial segments. Technological advancements such as high-efficiency TOPCon solar cells and floating solar farms are enhancing project viability, although challenges like grid integration, land acquisition, and supply chain risks persist. Competitive dynamics are shaped by evolving financing models for utility-scale projects and increasing corporate procurement through power purchase agreements, fostering a more mature and diversified market landscape.
The regulatory environment is characterized by supportive government policies including net metering, renewable purchase obligations, and production-linked incentives (PLI) aimed at boosting domestic manufacturing and renewable adoption. These frameworks have created a stable investment climate, encouraging capital inflows and innovation. However, the sector must navigate infrastructure upgrades and regulatory complexities related to grid stability and land use to sustain growth and meet India’s ambitious clean energy targets.
Note: Analysis synthesized from industry research, market reports, and regulatory filings. Information is subject to change based on market conditions.
Financial Ratios Dashboard
Illustrative Scenario Analysis
DCF Assumptions:
Method: Two-Stage EPS-Priority Model
Financials
Peer Analysis
| Company Name | Market Cap | P/E Ratio | P/B Ratio | EV/EBITDA | Price to CFO |
|---|---|---|---|---|---|
| Solar Industries India Ltd. | ₹1.57T | 93.46 | 30.63 | 60.22 | 252.35 |
| Asian Paints Ltd. | ₹2.50T | 65.17 | 12.77 | 42.70 | 52.73 |
| Vinati Organics Ltd. | ₹137.23B | 30.89 | 4.67 | 20.37 | 33.03 |
| Atul Ltd. | ₹209.04B | 30.87 | 3.36 | 18.47 | 20.44 |
| Aarti Industries Ltd. | ₹169.28B | 40.33 | 2.83 | 18.43 | 21.67 |
| Balaji Amines Ltd. | ₹55.28B | 38.36 | 2.94 | 17.57 | 30.04 |
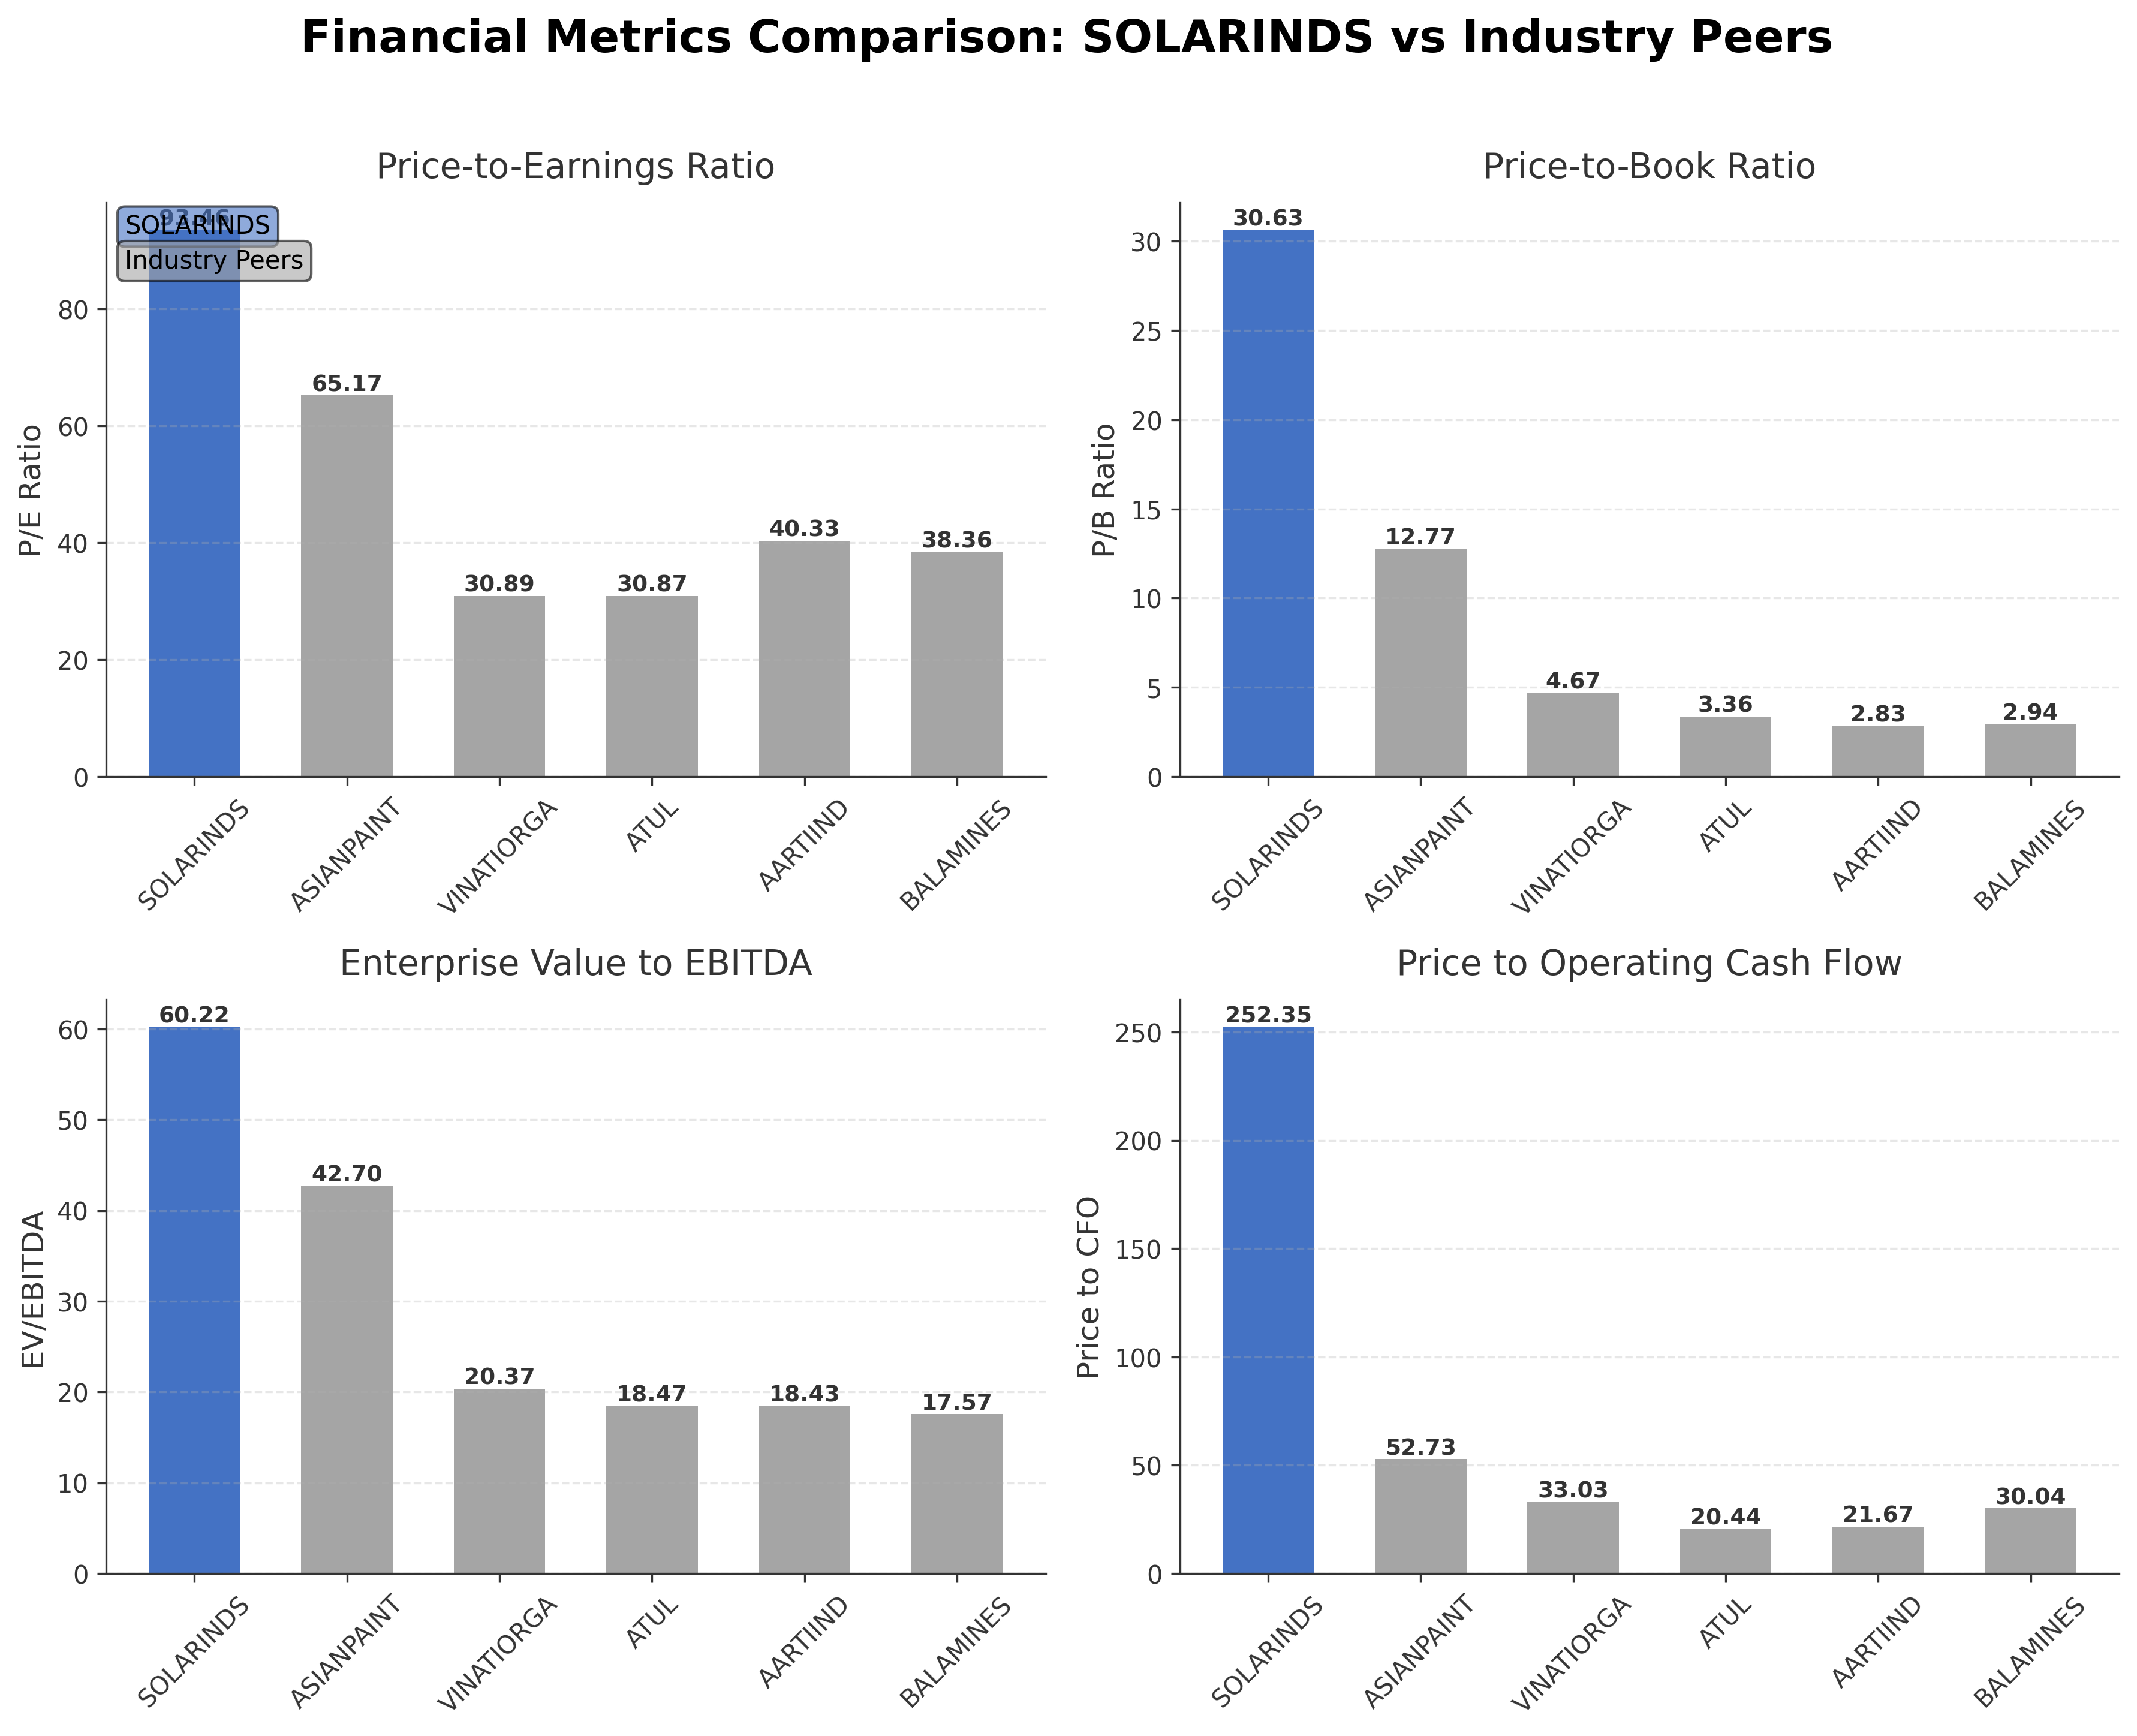
Comparison Analysis: Solar Industries India Ltd. trades at significantly higher valuation multiples compared to its regional specialty chemical peers, with a trailing P/E of 93.46 versus peer averages ranging from approximately 30.87 to 65.17. Its price-to-book ratio of 30.63 far exceeds peers, reflecting premium market expectations. The enterprise value to EBITDA multiple of 60.22 is also markedly elevated, indicating high growth anticipation. Despite this, Solar Industries delivers superior return on equity at 31%, outperforming peers whose ROE ranges from 7% to 18%. Price to CFO is substantially higher, suggesting stretched cash flow valuation. Overall, the company commands a premium valuation supported by robust profitability and growth prospects, though it stands as an outlier in valuation metrics.
Financial Metrics Comparison with Peers
Financial Statements
Comprehensive financial data including income, balance sheet, and cash flow metrics
Income Statement
| fiscal_date | 2025-03-31 | 2024-03-31 | 2023-03-31 | 2022-03-31 | 2021-03-31 |
|---|---|---|---|---|---|
| Sales | 73.60B | 59.09B | 67.70B | 38.29B | 24.42B |
| Cost Of Goods | 39.53B | 32.31B | 43.67B | 23.45B | 13.60B |
| Gross Profit | 34.07B | 26.78B | 24.03B | 14.84B | 10.82B |
| Operating Expense Selling General And Administrative | 5.57B | 4.16B | 4.15B | 2.75B | 1.90B |
| Operating Expense Other Operating Expenses | 4.71B | 3.10B | 3.13B | 2.51B | 1.83B |
| Operating Income | 17.77B | 15.35B | 13.46B | 6.78B | 4.59B |
| Non Operating Interest Income | 256.10M | 299.00M | 184.60M | 127.60M | 27.30M |
| Non Operating Interest Expense | 1.17B | 1.09B | 903.80M | 502.50M | 453.90M |
| Pretax Income | 17.39B | 11.61B | 11.02B | 6.07B | 3.97B |
| Income Tax | 4.51B | 2.86B | 2.90B | 1.52B | 1.09B |
| Net Income | 12.88B | 8.75B | 8.11B | 4.55B | 2.88B |
| Eps Basic | 133.65 | 92.38 | 83.68 | 48.77 | 30.54 |
| Eps Diluted | 133.65 | 92.38 | 83.68 | 48.77 | 30.54 |
| Basic Shares Outstanding | 90.49M | 90.49M | 90.49M | 90.49M | 90.49M |
| Diluted Shares Outstanding | 90.49M | 90.49M | 90.49M | 90.49M | 90.49M |
| Ebit | 18.55B | 12.71B | 11.92B | 6.58B | 4.42B |
| Ebitda | 20.17B | 15.45B | 14.19B | 7.60B | 5.70B |
| Net Income Continuous Operations | 17.33B | 11.61B | 11.02B | 6.07B | 3.97B |
| Minority Interests | -784.90M | -393.00M | -539.80M | -141.90M | -117.20M |
| Preferred Stock Dividends | 0.00 | 0.00 | 0.00 | 0.00 | 0.00 |
Source: Financial statements and regulatory filings
Balance Sheet
| fiscal_date | 2025-03-31 | 2024-03-31 | 2023-03-31 | 2022-03-31 | 2021-03-31 |
|---|---|---|---|---|---|
| Cash And Cash Equivalents | 5.88B | 2.52B | 2.45B | 836.70M | 1.70B |
| Accounts Receivable | 12.39B | 8.45B | 8.25B | 5.41B | 4.55B |
| Total Assets | 82.61B | 57.37B | 50.36B | 37.24B | 30.30B |
| Total Liabilities | 37.25B | 23.10B | 22.86B | 17.09B | 13.88B |
| Long Term Debt | 4.18B | 6.07B | 4.92B | 4.53B | 4.50B |
| Shareholders Equity | 45.37B | 34.27B | 27.51B | 20.15B | 16.42B |
Source: Financial statements and regulatory filings
Cash Flow Statement
| fiscal_date | 2025-03-31 | 2024-03-31 | 2023-03-31 | 2022-03-31 | 2021-03-31 |
|---|---|---|---|---|---|
| Operating Activities Net Income | 17.33B | 11.61B | 11.02B | 6.07B | 3.97B |
| Operating Activities Other Non Cash Items | 1.75B | 2.18B | 1.42B | 502.50M | 453.90M |
| Operating Activities Accounts Receivable | -3.17B | -511.00M | -3.23B | -729.60M | -1.19B |
| Operating Activities Other Assets Liabilities | 8.32B | 1.75B | -2.27B | -4.17B | -1.18B |
| Operating Activities Operating Cash Flow | 24.23B | 15.04B | 6.93B | 1.67B | 2.06B |
| Investing Activities Capital Expenditures | -10.01B | -5.48B | -4.73B | -2.77B | -2.61B |
| Investing Activities Net Acquisitions | -2.08B | N/A | 0.00 | -17.70M | -108.00M |
| Investing Activities Other Investing Activity | -1.80M | N/A | 100.00K | N/A | N/A |
| Investing Activities Investing Cash Flow | -12.09B | -5.48B | -4.73B | -2.79B | -2.54B |
| Financing Activities Long Term Debt Issuance | 1.16B | 3.40B | 4.09B | 1.98B | 3.43B |
| Financing Activities Long Term Debt Payments | -3.57B | -3.04B | -2.25B | -1.75B | -988.40M |
| Financing Activities Short Term Debt Issuance | 17.30M | -1.91B | 947.60M | 429.20M | -1.63B |
| Financing Activities Common Dividends | -769.20M | -723.70M | -678.70M | -542.90M | -542.90M |
| Financing Activities Financing Cash Flow | -3.16B | -2.28B | 2.11B | 116.50M | 266.80M |
| End Cash Position | 5.90B | 2.60B | 2.45B | 846.70M | 1.70B |
| Free Cash Flow | 14.62B | 8.46B | 1.77B | 103.60M | 917.20M |
| Investing Activities Sale Of Investments | N/A | N/A | N/A | N/A | 174.60M |
| Financing Activities Other Financing Charges | N/A | N/A | N/A | N/A | N/A |
Source: Financial statements and regulatory filings
Technical Analysis
Key Insights
- The stock is currently in a strong uptrend, forming an ascending triangle pattern indicative of bullish continuation.
- Key support levels are identified near INR 14,460 and INR 13,788, with resistance around the recent highs near INR 17,820 to INR 18,300.
- Price is trading above the 10-day, 50-day, and 200-day moving averages, confirming positive momentum across short, medium, and long-term timeframes.
- Momentum indicators show RSI in the overbought zone, MACD is positive with a bullish crossover, and stochastic oscillators confirm upward momentum.
- Multi-timeframe analysis (daily, weekly, monthly) consistently signals strength with no major reversal patterns detected.
- Potential market scenarios include continuation of the breakout above resistance with volume confirmation or a consolidation phase near current levels before further advances.
Trending News
1. Headline: Solar Industries Forms an Ascending Triangle Pattern Signalling a Short-term Bullish Breakout
Summary: The stock closed at Rs 18,116 on the weekly chart, indicating continued bullish momentum. In an ascending triangle, traders typically target the nearest resistance level or project a price move equal to the triangle’s height from the breakout point, using strong volume and momentum to confirm the trade. Solar Industries India Ltd ...
Sentiment: positive
2. Headline: Strong Momentum Meets Stretched Valuations as Solar Industries India Ltd Reaches All-Time High
Summary: On 19 May 2026, Solar Industries India Ltd, a leading player in the Other Chemical products sector, surged to a new peak of Rs.18,349, setting a fresh 52-week and all-time high. This price level represents a substantial gain, with the stock outperforming its sector by 1.6% on the day and ...
Sentiment: positive
3. Headline: Solar Industries Earnings Boost Industrial Market Confidence
Summary: Solar Industries growth outlook strengthens after earnings upgrades, signalling rising investor confidence in India’s defence manufacturing sector.
Sentiment: positive
4. Headline: Solar Industries India Ltd Sees Sharp Open Interest Surge Amid Strong Price Momentum
Summary: Solar Industries India Ltd (SOLARINDS) has witnessed a significant surge in open interest in its derivatives segment, signalling heightened market activity and potential directional bets. The stock recently hit a new 52-week and all-time high of Rs 17,950, supported by robust volume and sustained ...
Sentiment: positive
5. Headline: Solar Industries guides for over 40% revenue growth, sees ₹4,500 crore defence business in FY27 - CNBC TV18
Summary: Manish Nuwal, MD & CEO, Solar Industries India, said the company expects its defence segment to cross ₹4,500 crore in revenue, while its Bhargavastra anti-drone platform could become bigger than the Pinaka programme over time. Solar Industries also expects margins to remain stable despite ...
Sentiment: positive
Recent Updates
News Summary
As of May 18, 2026. Solar Industries India Ltd reported a 69.95% increase in consolidated profit after tax to ₹547.63 crore in Q4 FY26, driven by a 40.90% year-on-year growth in revenue to ₹3,052.75 crore. EBITDA reached a record ₹870 crore with a margin improvement to 28.51%. The defense segment nearly doubled revenue, surging 134% in Q4 and 94% for the full year, reaching ₹1,008 crore and ₹2,634 crore respectively. The company maintains a strong order book of ₹21,300 crore and projects crossing ₹4,500 crore in defense revenue in FY27. International business grew 325% year-over-year, reflecting strong global demand. Despite rising input costs, management expects stable margins supported by robust execution and growth pipelines.
News Sentiment
The overall sentiment from recent updates is positive, driven by strong quarterly earnings growth, record EBITDA margins, and significant expansion in the defense segment. The company’s optimistic guidance for over 40% revenue growth and a robust order book further supports confidence in its operational scalability. However, neutral tones emerge around input cost pressures from rising ammonium nitrate prices, which could impact margins if not fully passed through. The balance of strong financial performance and cautious cost management creates a constructive yet measured outlook.
Source List
- https://upstox.com/news/market-news/earnings/solar-industries-q4-results-net-profit-climbs-70-to-548-crore-dividend-announced-check-record-date/article-193785/
- https://www.cnbctv18.com/market/earnings/solar-industries-expects-revenue-grow-40-defence-business-cross-4500-crore-fy27-q4-earnings-results-boardroom-pinaka-bhargavastra-anti-drone-19907958.htm
- https://www.investywise.com/solar-industries-india-limited-q4-fy26-financial-results/
Analytical Overview
Analysis Summary
Solar Industries India Ltd. exhibits elevated valuation metrics with a trailing P/E of 93.46 and forward P/E of 56.14, substantially higher than industry averages near 30-40, reflecting strong growth expectations priced into the stock. Revenue growth is robust at 40.9% quarterly, supported by a 325% increase in international business and a doubling of defense segment revenues, indicating a strong growth trajectory. Financial health is solid with a current ratio of 2.06 and a manageable debt-to-equity ratio of 0.23, although free cash flow is negative, suggesting capital expenditures or working capital investments are significant. Sector-specific opportunities include expanding defense spending and infrastructure development in India, while challenges involve input cost inflation and competitive pressures. India-specific factors such as regulatory support for defense manufacturing and increasing infrastructure investments underpin the company’s growth potential.
Overall Business and Market Assessment
Supporting Factors: Key supporting factors include strong revenue and earnings growth driven by defense and international markets, robust profitability with a 31% ROE, and a healthy balance sheet with low leverage. Risks to monitor include stretched valuation multiples, input cost inflation from rising ammonium nitrate prices, and the impact of negative free cash flow on liquidity. The appropriate investment timeframe is medium to long term, considering the company’s growth initiatives and sector dynamics. Overall, Solar Industries presents a compelling growth story tempered by valuation and cost considerations, warranting balanced assessment.
Risk Factors: No data
SWOT Analysis
Strengths
- Strong market position in industrial explosives and defense sectors.
- Robust revenue growth with 40.9% quarterly increase and expanding international business.
- High return on equity at 31.33% indicating efficient capital utilization.
- Healthy current ratio of 2.06 and moderate debt levels supporting financial stability.
Weaknesses
- Elevated valuation multiples with P/E over 90 and price-to-book above 30.
- Negative free cash flow indicating high capital expenditure or working capital needs.
- Low dividend yield of 0.23% limiting income appeal.
- Dependence on volatile raw material prices such as ammonium nitrate.
Opportunities
- Expanding defense segment with projected revenue crossing ₹4,500 crore in FY27.
- Growth in international markets with 325% year-over-year increase.
- Innovation in defense products like the Bhargavastra anti-drone platform.
- Supportive regulatory environment for domestic defense manufacturing.
Threats
- Rising input costs potentially compressing profit margins.
- Competitive pressures within specialty chemicals and explosives markets.
- Regulatory risks related to defense and chemical manufacturing compliance.
- Macroeconomic uncertainties impacting infrastructure and mining sectors.
Company Description
Solar Industries India Ltd. is a prominent player in the defense sector, specifically in industrial explosives and ammunition manufacturing. Its primary function is the production of a wide range of explosives used in construction, mining, and defense applications. With a robust portfolio that includes industrial explosives, detonators, and ammunition, it plays a critical role in supporting infrastructure projects and enhancing defense capabilities. The company's expertise spans across sectors like mining, construction, and defense, making it vital for infrastructure development and national security. Solar Industries India's operations are significant in both domestic and international markets, reflecting its strategic importance in supplying essential materials for various high-stakes applications."}