
Siemens Energy India Ltd (ENRIN)
Stock Analysis Report
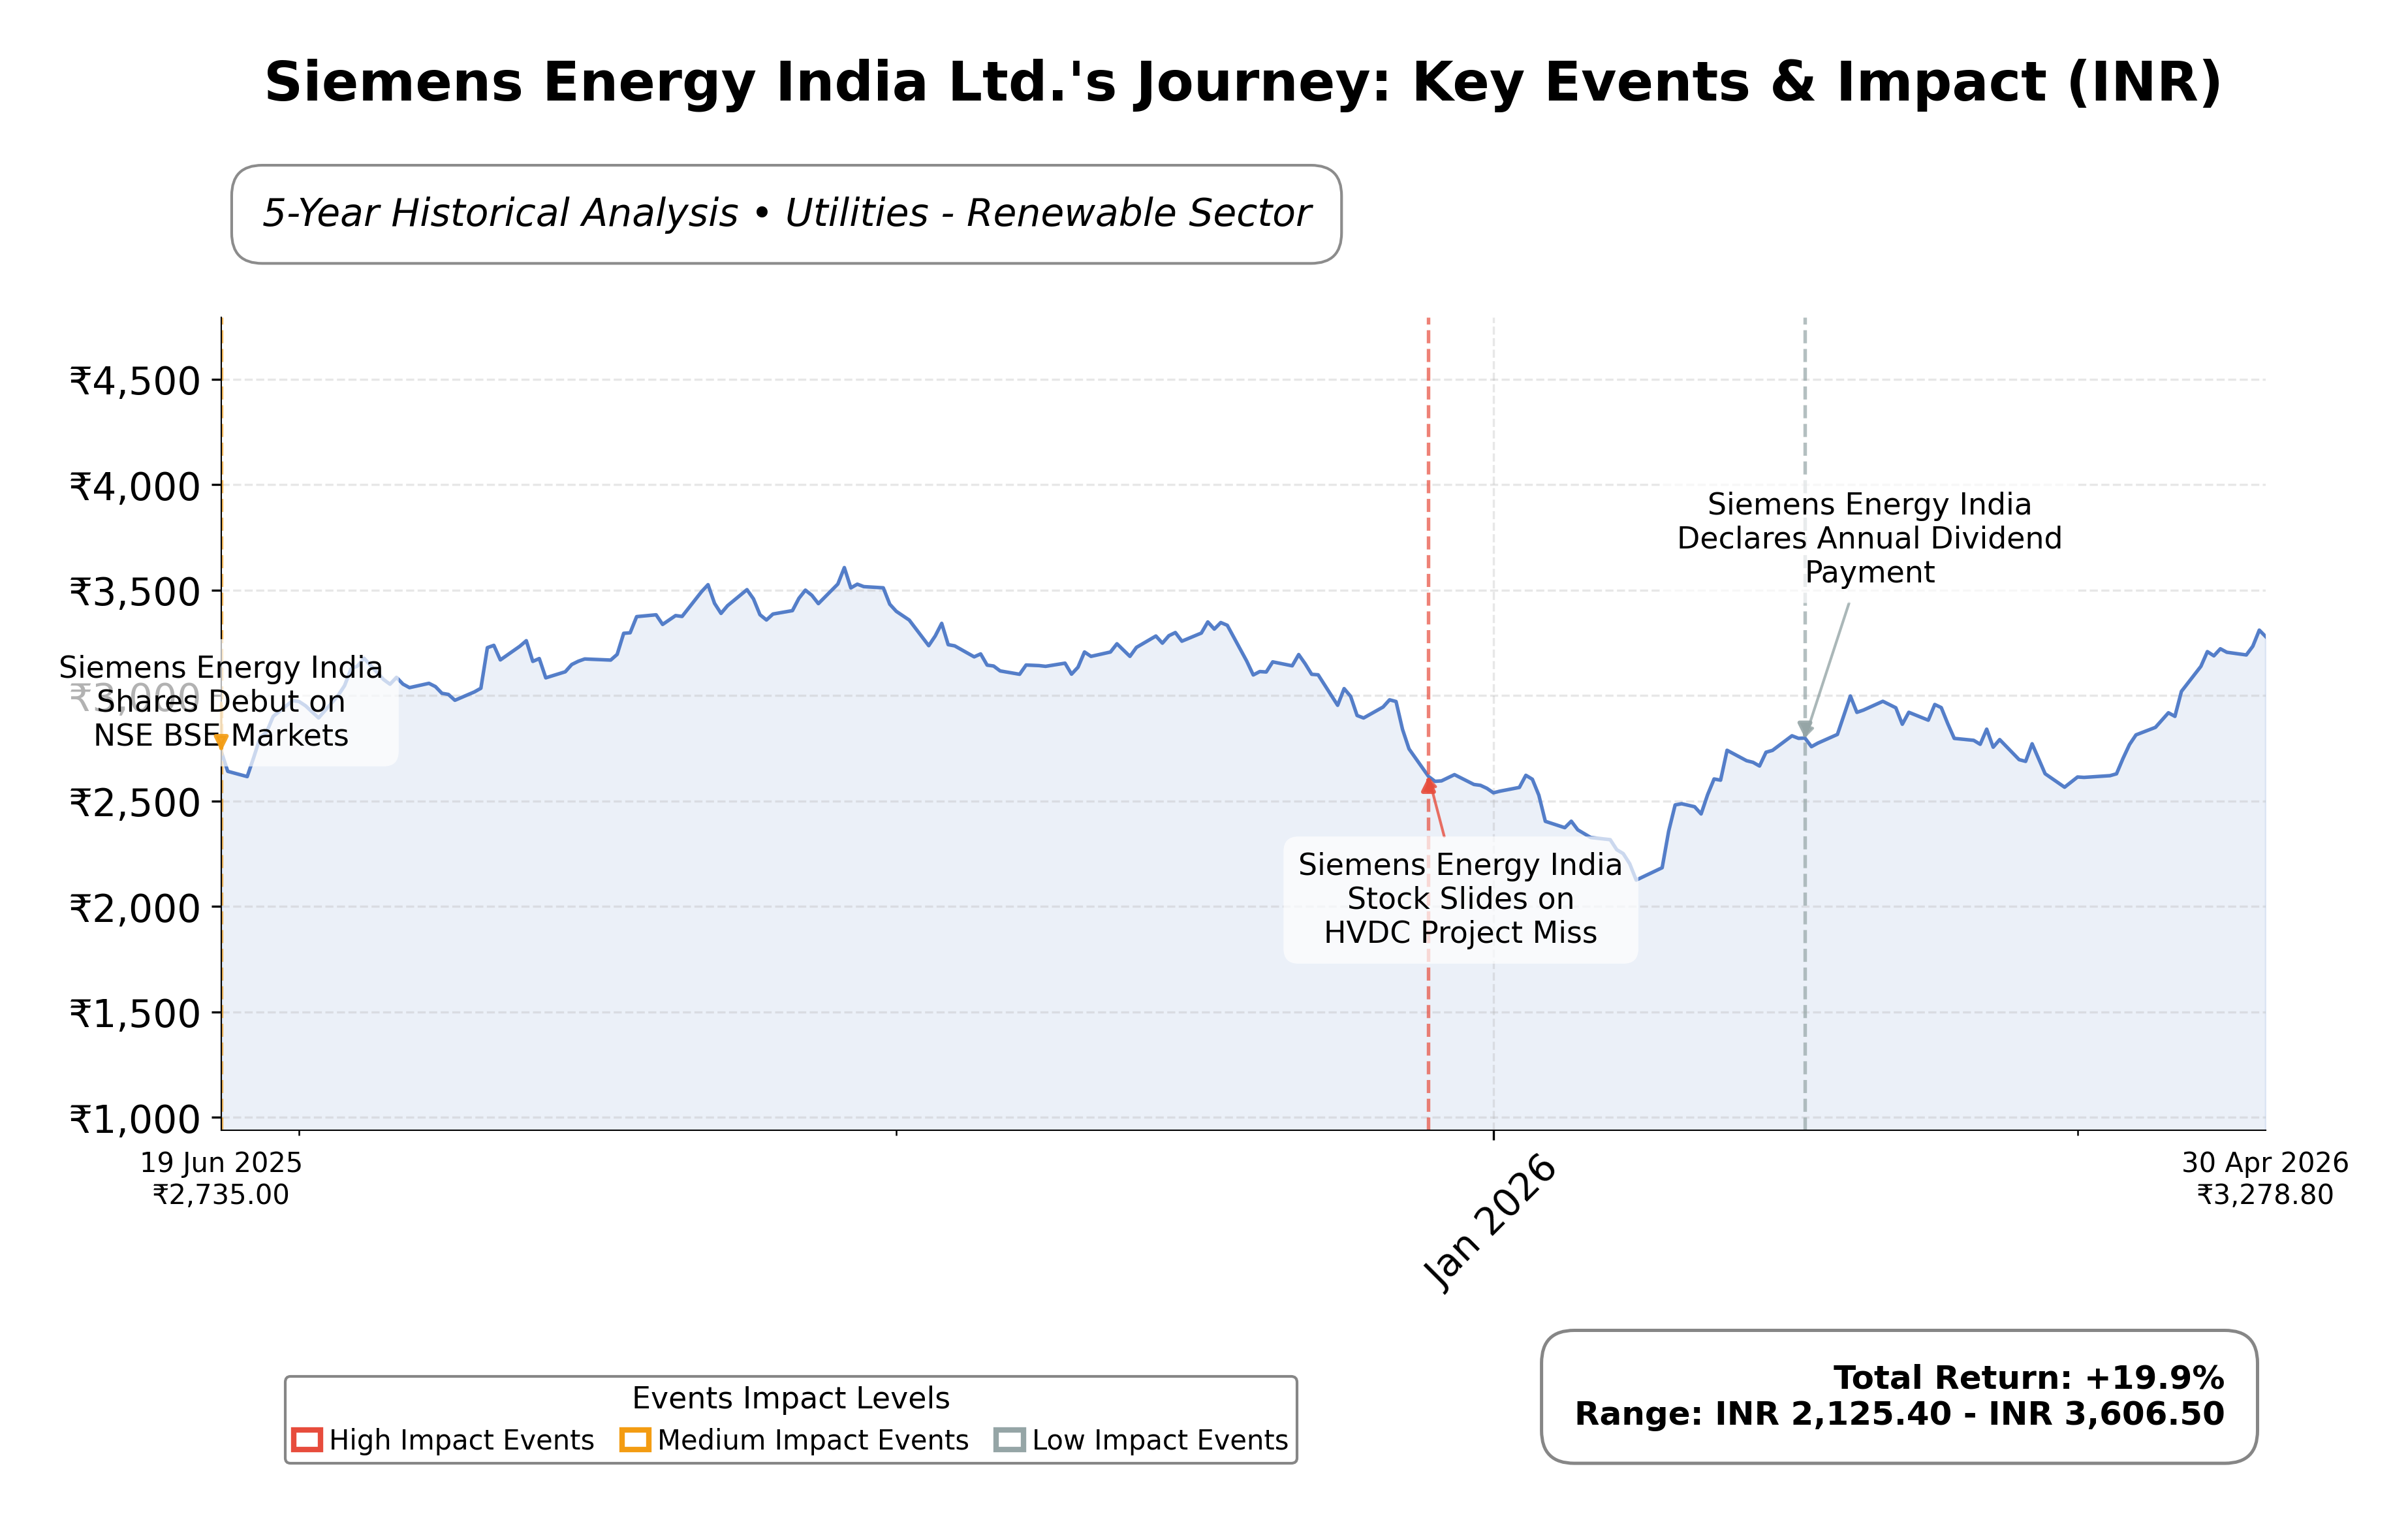
Stock Journey
Key Positives and Key Risks
Pros
- Strong return on equity of 25.11% demonstrates efficient use of shareholder capital.
- Robust operating margin of 22.42% and net profit margin of 14.37% indicate solid profitability.
- Healthy cash reserves of ₹346 crore versus low debt of ₹14.76 crore support financial stability.
Cons
- High valuation with trailing P/E of 96.43 and price-to-book ratio of 26.08 suggests premium pricing.
- Dependence on wind turbine subsidiary Gamesa’s breakeven performance poses earnings risk.
- Low dividend yield of 0.13% limits income generation for shareholders.
Disclosure: This information is for general awareness and does not constitute investment advice
Report Summary
Siemens Energy India Ltd. operates as a prominent energy technology company listed on the National Stock Exchange of India (NSE) under the symbol ENRIN. It serves the utilities sector with a focus on renewable energy, providing products and services across the entire energy value chain. The company’s offerings include conventional and renewable power generation, grid technology, energy storage, and electrification solutions for industrial processes. Siemens Energy India has a pan-India presence and plays a key role in modernizing grid infrastructure to support India’s energy transition and sustainability goals.
Financially, Siemens Energy India reported trailing twelve months (TTM) revenue of approximately ₹8,220 crore with a gross margin of 44.12%, an operating margin of 22.42%, and a net profit margin of 14.37%. The company’s return on equity (ROE) stands at 25.11%, indicating efficient use of shareholder capital, while return on assets (ROA) is 11.53%, reflecting solid asset utilization. Its return on invested capital (ROIC) is robust, supported by strong operating cash flow of ₹2,595.6 crore and free cash flow of ₹1,100.1 crore, underscoring operational efficiency and cash generation capacity.
Valuation metrics show a trailing price-to-earnings (P/E) ratio of 96.43 and a forward P/E of 60.19, which are elevated relative to typical industry levels, reflecting high growth expectations. The price-to-book (P/B) ratio is 26.08, and the enterprise value to EBITDA (EV/EBITDA) ratio is 66.60, indicating a premium valuation. The company’s market capitalization is approximately ₹1.14 trillion. The stock trades near ₹3,323, within a 52-week range of ₹3,625 (high) to ₹2,115 (low), suggesting it is closer to its upper price band.
Key strengths include Siemens Energy India’s strong cash position of ₹346 crore against relatively low debt of ₹14.76 crore, a current ratio near 1.97 indicating liquidity, and leadership in grid modernization and renewable energy integration. Risks involve regulatory changes in the energy sector, competitive pressures from other renewable utilities, and valuation stretch. Recent strategic initiatives include ongoing share buybacks by the parent Siemens Energy AG and partnerships such as the AI collaboration with TCS to enhance intelligent operations.
Technically, the stock is trading above its 50-day moving average but slightly below the 200-day average, with momentum indicators showing mixed signals. Recent news highlights both positive operational momentum and cautious market sentiment due to valuation concerns. Overall, the data suggests a balanced stance with attention to market developments and earnings outcomes, favoring a watchful approach to the stock’s near-term trajectory.
Company and Industry Overview
Company Basics
Price Performance
Company Size
Shareholding Pattern
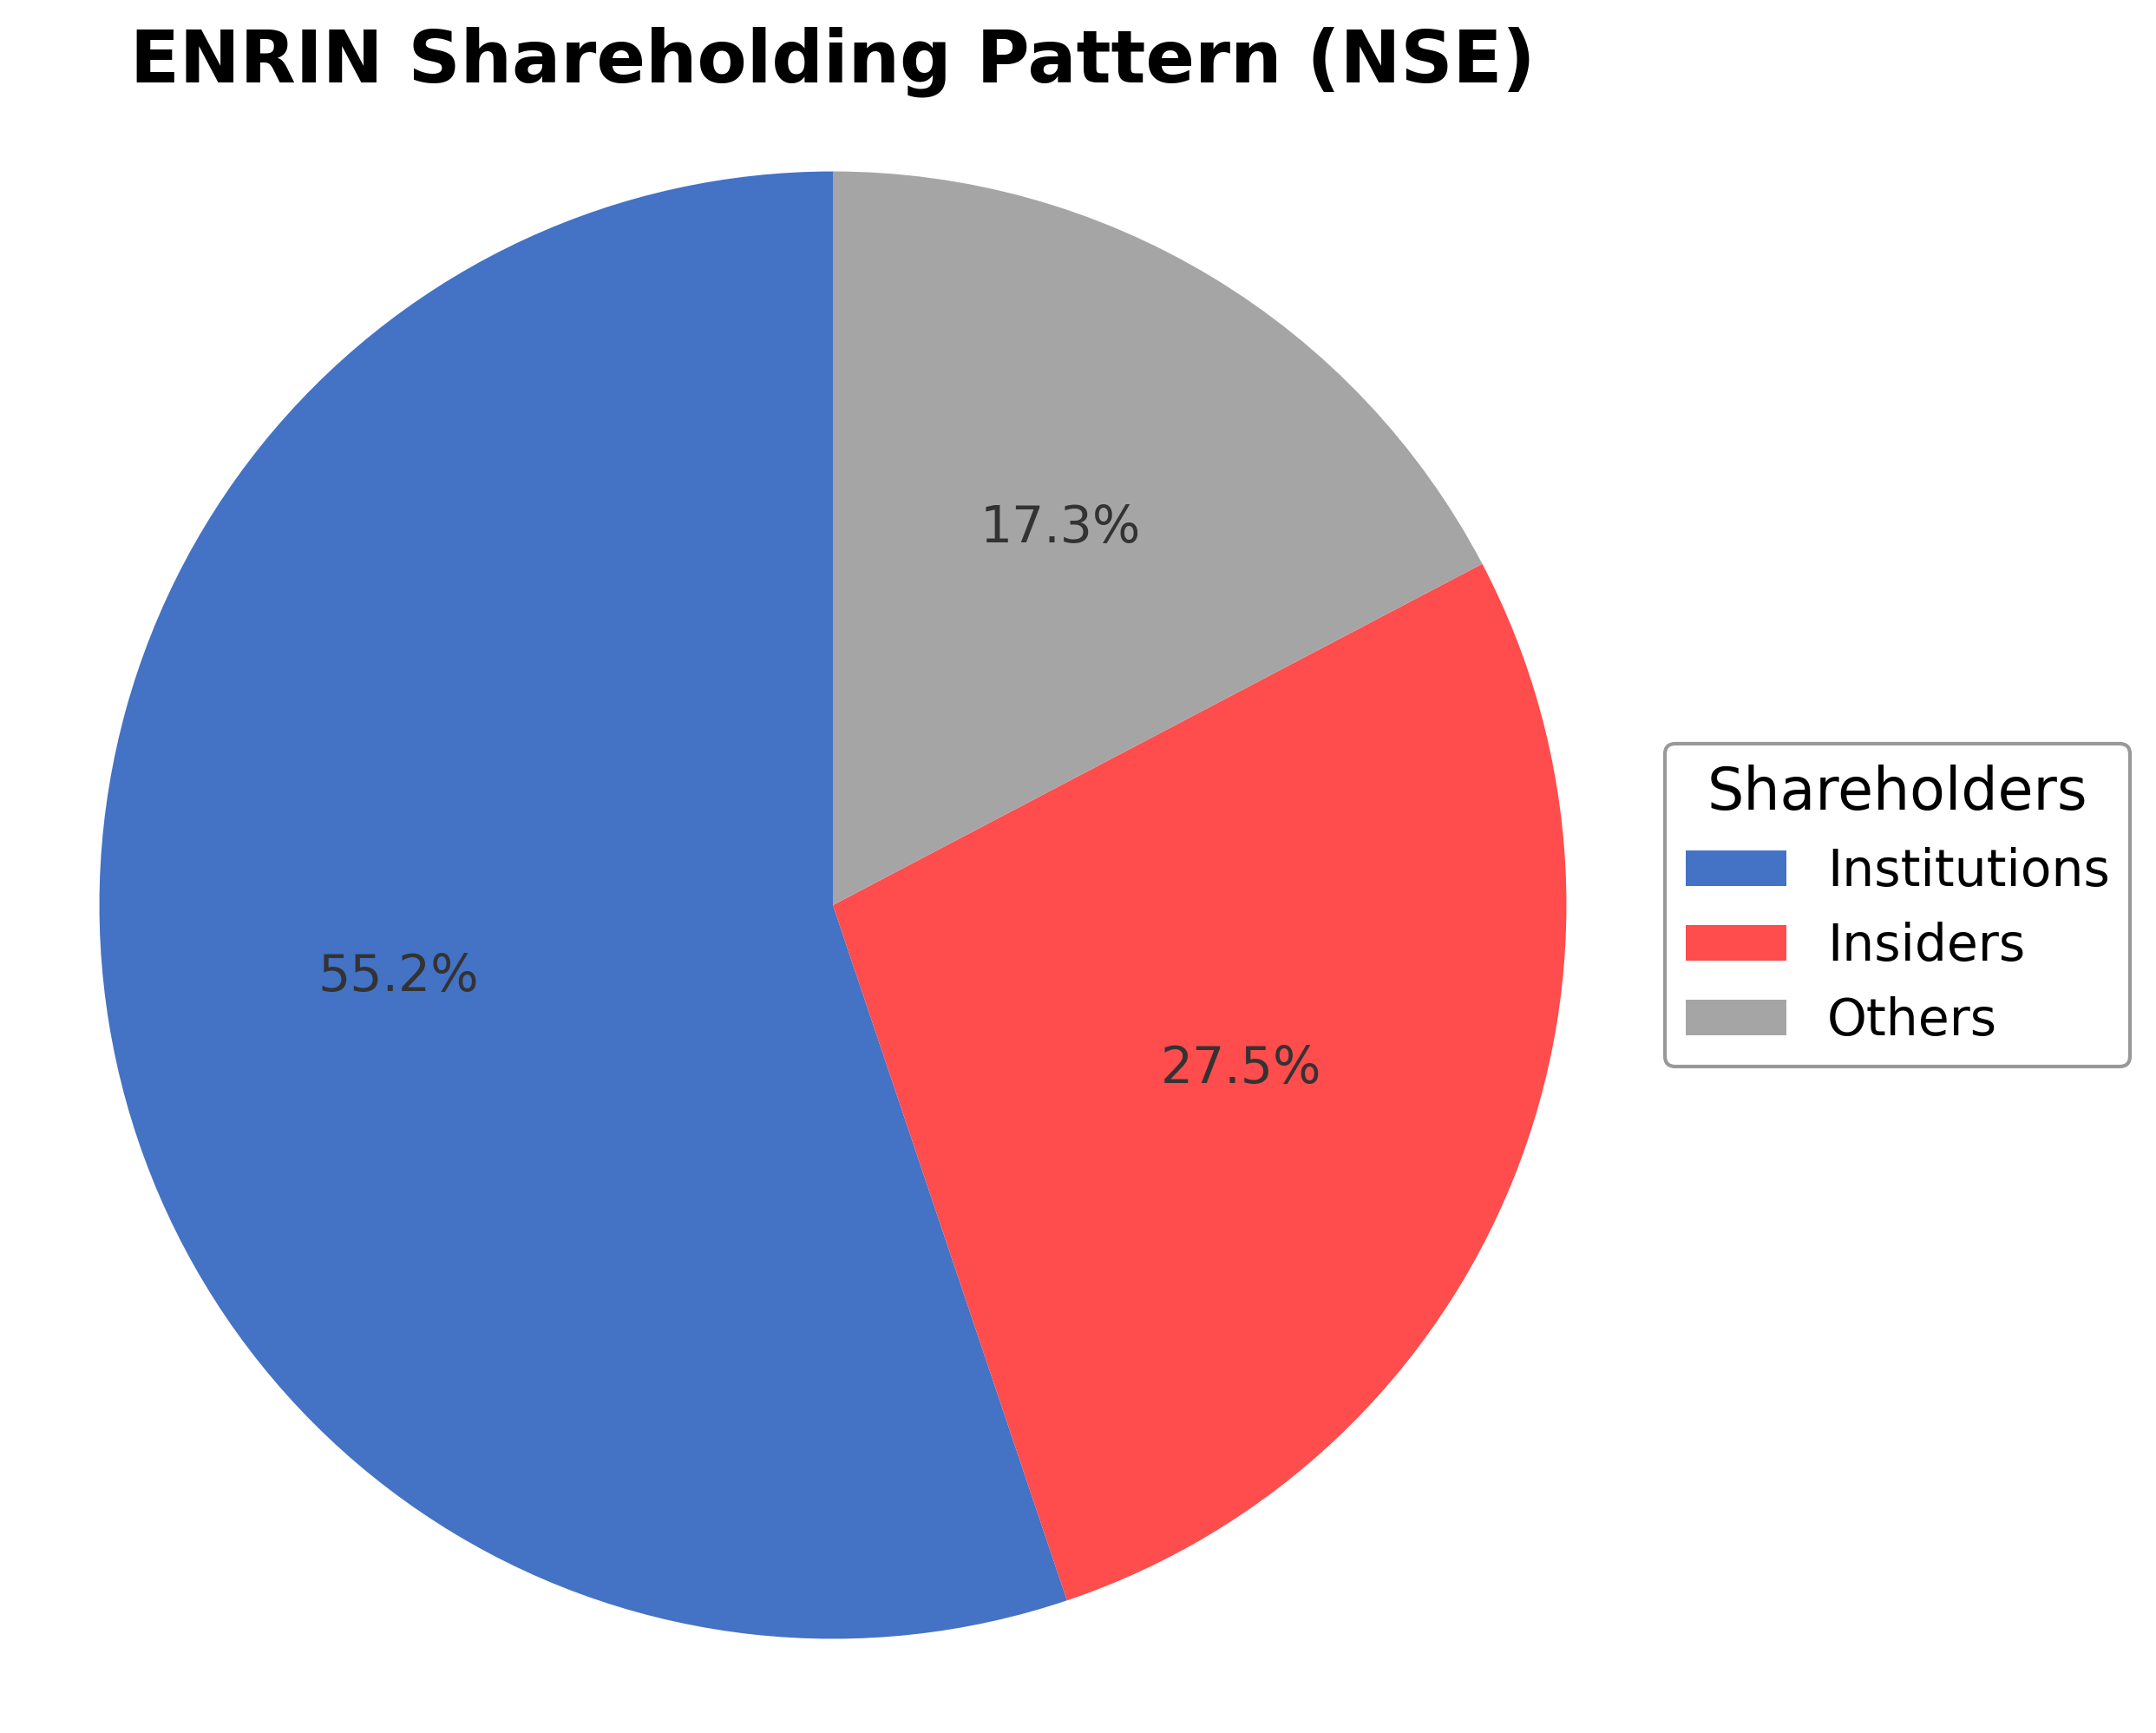
Siemens Energy India Ltd. exhibits a shareholding structure dominated by institutional investors holding approximately 55.17% of shares, reflecting strong institutional confidence and active participation from mutual funds and asset managers. Insiders, including executives and board members, hold about 27.53%, indicating significant management and promoter involvement in the company’s governance. The remaining 17.30% is held by public shareholders and other retail investors. Over the past 12 to 24 months, institutional ownership has shown moderate accumulation, with notable participation from large investment firms, suggesting a positive market sentiment towards the company’s growth prospects. This ownership distribution supports stable governance and strategic decision-making aligned with long-term value creation, while also providing liquidity and market depth. The current structure positions Siemens Energy India well to capitalize on sectoral growth trends and regulatory support for renewable energy in India.
Sector and Industry Analysis
The energy sector in India is a critical component of the country’s infrastructure, with a market size driven by growing power demand and increasing investments in generation and transmission. The sector is expanding rapidly, supported by government initiatives targeting renewable energy integration and grid modernization. Key players include large multinational and domestic firms such as Siemens Energy India Ltd, NTPC, and Bharat Heavy Electricals Limited, which provide comprehensive solutions across power generation and transmission.
Industry trends highlight a shift towards sustainable and technologically advanced energy solutions, including gas and steam turbines, grid automation, and industrial energy management. Competitive dynamics are shaped by high capital intensity and technological expertise requirements, creating significant barriers to entry. Siemens Energy India Ltd leverages its integrated product offerings and strong operational metrics, such as high ROCE and ROE, to maintain a competitive position within this evolving landscape.
The regulatory environment is characterized by policies promoting renewable energy adoption, energy efficiency, and grid reliability, including incentives for clean energy projects and stricter emissions standards. Regulatory frameworks such as the Electricity Act and guidelines from the Central Electricity Regulatory Commission influence market operations and investment decisions. These regulations are expected to drive continued modernization and diversification of India’s energy infrastructure, impacting industry players’ strategic priorities.
Note: Analysis synthesized from industry research, market reports, and regulatory filings. Information is subject to change based on market conditions.
Financial Ratios Dashboard
Illustrative Scenario Analysis
DCF Assumptions:
Method: Two-Stage EPS-Priority Model
Financials
Peer Analysis
| Company Name | Market Cap | P/E Ratio | P/B Ratio | EV/EBITDA | Price to CFO |
|---|---|---|---|---|---|
| Siemens Energy India Ltd. | ₹1.14T | 96.43 | 26.08 | 66.60 | 43.74 |
| Adani Green Energy Limited | ₹2.02T | 127.04 | 10.87 | 29.35 | 19.94 |
| NHPC Ltd. | ₹835.75B | 53.53 | 2.03 | 27.80 | 17.53 |
| SJVN Ltd. | ₹310.38B | 48.50 | 2.14 | 23.32 | 16.45 |
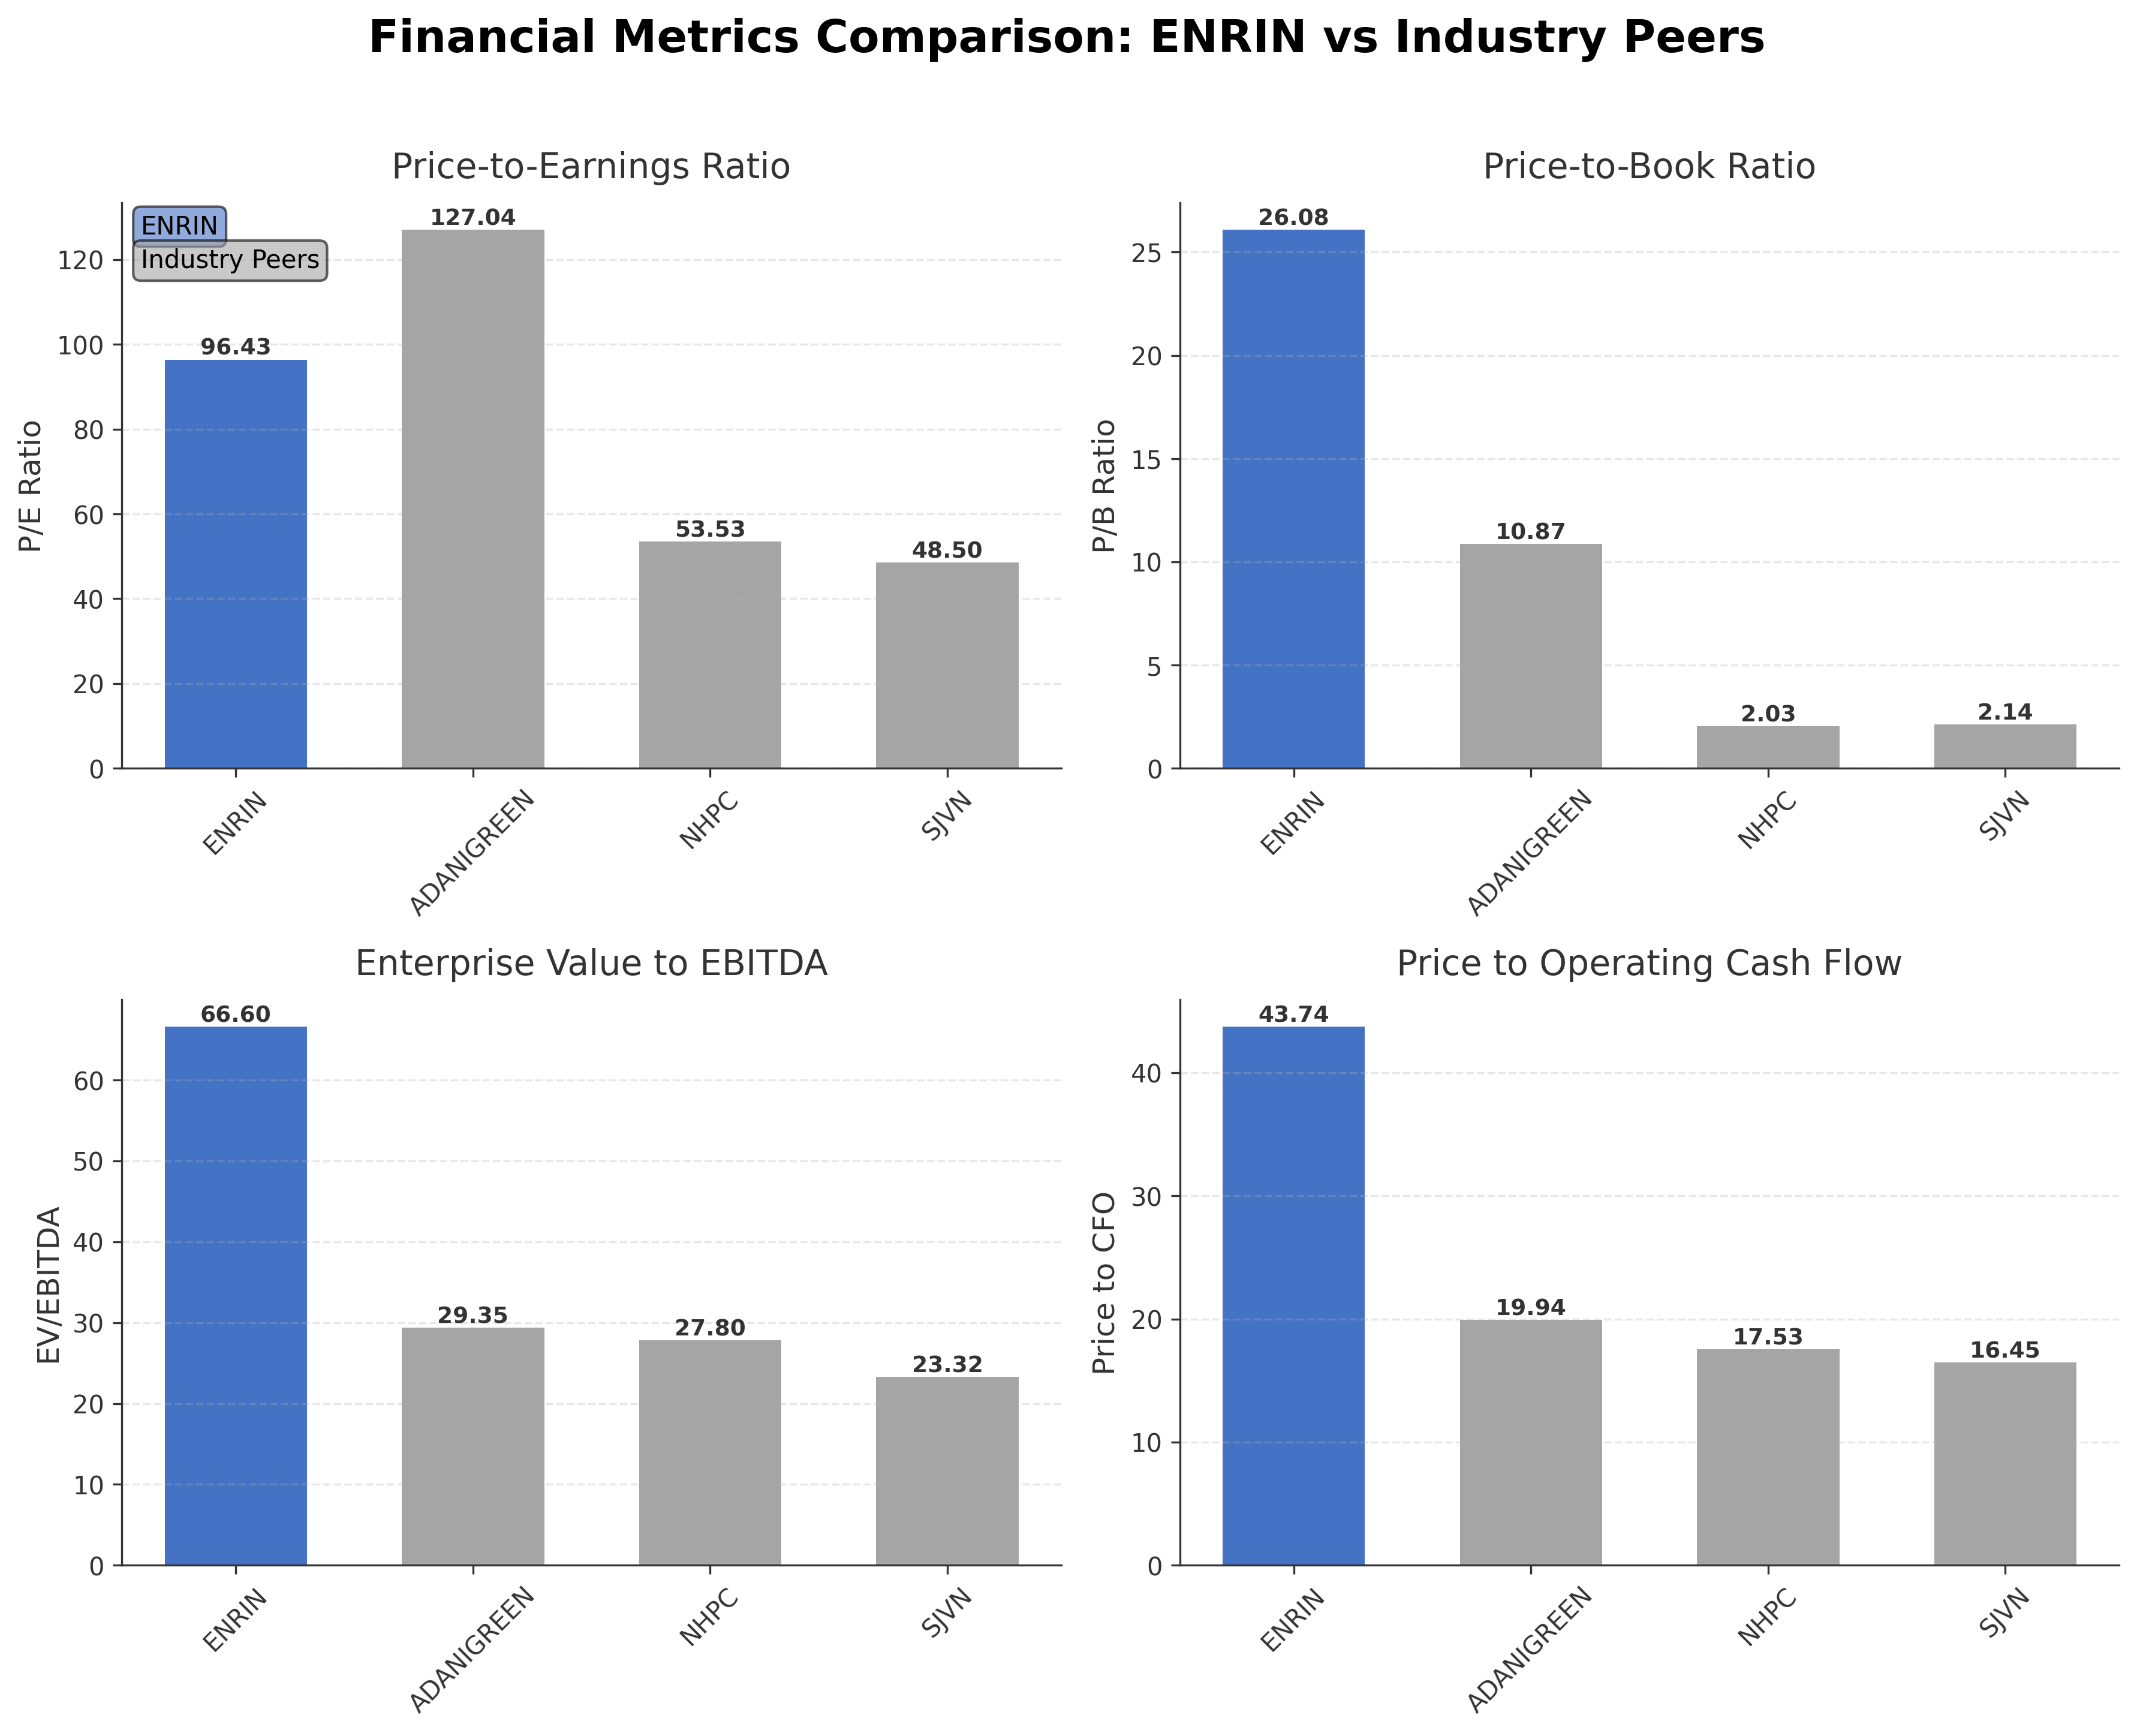
Comparison Analysis: Siemens Energy India Ltd. stands out among its regional peers with a significantly higher return on equity of 25.11%, indicating superior profitability and capital efficiency compared to Adani Green Energy (8.00%), NHPC (7.00%), and SJVN (6.00%). However, Siemens Energy India trades at a much higher valuation, with a trailing P/E of 96.43 and price-to-book ratio of 26.08, which are well above peer averages, reflecting elevated growth expectations or premium market positioning. Its EV/EBITDA of 66.60 is also substantially higher than peers, suggesting a stretched valuation relative to earnings before interest, taxes, depreciation, and amortization. Price to cash flow at 43.74 further underscores this premium. While peers like NHPC and SJVN offer lower valuations, Siemens Energy India’s leadership in technology and operational metrics may justify the premium, albeit with higher risk.
Financial Metrics Comparison with Peers
Financial Statements
Comprehensive financial data including income, balance sheet, and cash flow metrics
Income Statement
| fiscal_date | 2025-09-30 | 2024-09-30 |
|---|---|---|
| Sales | 77.83B | 47.60B |
| Cost Of Goods | 45.84B | 29.27B |
| Gross Profit | 31.98B | 18.33B |
| Operating Expense Research And Development | 15.00M | N/A |
| Operating Expense Selling General And Administrative | 1.34B | N/A |
| Operating Expense Other Operating Expenses | 5.60B | N/A |
| Operating Income | 14.23B | 12.44B |
| Non Operating Interest Income | 999.00M | N/A |
| Non Operating Interest Expense | 282.00M | 184.00M |
| Pretax Income | 14.88B | 8.06B |
| Income Tax | 3.87B | 2.06B |
| Net Income | 11.00B | 6.00B |
| Eps Basic | 30.89 | 16.85 |
| Eps Diluted | 30.89 | 16.85 |
| Basic Shares Outstanding | 356.12M | 356.12M |
| Diluted Shares Outstanding | 356.12M | 356.12M |
| Ebit | 15.16B | 8.25B |
| Ebitda | 16.47B | 8.71B |
| Net Income Continuous Operations | 14.88B | 8.06B |
| Preferred Stock Dividends | 0.00 | 0.00 |
Source: Financial statements and regulatory filings
Balance Sheet
| fiscal_date | 2025-09-30 | 2024-09-30 |
|---|---|---|
| Cash And Cash Equivalents | 1.32B | N/A |
| Accounts Receivable | 19.20B | 18.77B |
| Total Assets | 95.45B | 70.48B |
| Total Liabilities | 51.64B | 38.31B |
| Long Term Debt | 994.00M | 964.00M |
| Shareholders Equity | 43.81B | 32.17B |
Source: Financial statements and regulatory filings
Cash Flow Statement
| fiscal_date | 2025-09-30 | 2024-09-30 |
|---|---|---|
| Operating Activities Net Income | 14.88B | 8.06B |
| Operating Activities Stock Based Compensation | 101.00M | -36.00M |
| Operating Activities Other Non Cash Items | -717.00M | 165.00M |
| Operating Activities Accounts Receivable | 11.56B | -12.30B |
| Operating Activities Other Assets Liabilities | 133.00M | -163.00M |
| Operating Activities Operating Cash Flow | 25.96B | -4.28B |
| Investing Activities Capital Expenditures | -2.16B | -1.27B |
| Investing Activities Investing Cash Flow | -2.16B | -1.27B |
| Financing Activities Common Stock Issuance | 0.00 | 0.00 |
| Financing Activities Other Financing Charges | -146.00M | -43.00M |
| Financing Activities Financing Cash Flow | -146.00M | -43.00M |
| End Cash Position | 1.32B | 0.00 |
| Free Cash Flow | 34.54B | 188.00M |
Source: Financial statements and regulatory filings
Technical Analysis
Key Insights
- The current trend shows the stock trading above its 50-day moving average at ₹2,790 but slightly below the 200-day moving average of ₹2,987, indicating a mixed intermediate trend.
- Key support levels are identified near ₹2,900 and ₹2,700, while resistance is observed around the 52-week high of ₹3,625.
- The stock price is positioned between short-term and long-term moving averages, suggesting consolidation with potential for directional breakout.
- Momentum indicators show the Relative Strength Index (RSI) in a neutral zone, MACD lines are converging, and the stochastic oscillator indicates moderate momentum without overbought or oversold conditions.
- Across daily, weekly, and monthly timeframes, the price action reflects sideways movement with intermittent volatility, consistent with a stock in a consolidation phase.
- Potential market scenarios include a breakout above the 200-day moving average signaling bullish momentum or a breakdown below support levels triggering corrective pressure.
Trending News
1. Headline: Adani Ports, Tata Motors and Siemens Energy witness block deal action on Monday - The Economic Times
Summary: Institutional investors injected over Rs 7,400 crore into Adani Ports and Special Economic Zone (APSEZ) on Monday through significant block deals. Capital Group entities were major buyers, acquiring stakes from Worldwide Emerging Market Holding Limited. Smaller block deals also occurred in ...
Sentiment: neutral
2. Headline: Siemens Energy Repurchases Over 10.8 Million Shares in Ongoing Buyback - TipRanks.com
Summary: Siemens Energy ( ($DE:ENR) ) has shared an announcement. Siemens Energy AG continued its ongoing share buyback program, repurchasing 635,459 shares between April 27...
Sentiment: neutral
3. Headline: 15 Stocks Alert, May 4: Infosys, Tech Mahindra, HCLTech, Reliance - The HinduBusinessLine
Summary: Key stocks like Infosys, Reliance, and HCLTech drive growth in India's dealmaking and expansion on May 4.
Sentiment: positive
4. Headline: Siemens Energy’s €4 Billion Profit Target Hinges on Gamesa’s Second-Half Recovery
Summary: Siemens Energy faces a pivotal May 12 half-year report as wind unit Gamesa must break even; grid orders surge 30% to €17.75B, but stretched valuation and parent stake sale loom.
Sentiment: positive
5. Headline: Stay Informed with MarketsMojo News: Stock Market Insights, Portfolio Tracking, Alerts, and Expert Analyses
Summary: Latest news on Stocks in Action, Trending Stocks, Stock Analysis, Result Analysis, Corporate News, Stock Market News, IPOs, Mutual Funds, Global Markets, and Investment Ideas at MarketsMojo. Enhance your financial decisions with insightful stock market analysis, seamless portfolio tracking, ...
Sentiment: neutral
Recent Updates
News Summary
As of May 12, 2026. Siemens Energy is preparing for its half-year financial report with significant focus on the performance of its wind turbine subsidiary, Gamesa, which must achieve breakeven in the second half of the fiscal year to meet the company’s full-year profit target of €4 billion. The grid technologies segment has demonstrated strong growth, with order intake surging nearly 30% to €17.75 billion, driven by increased demand from hyperscalers and major transmission projects. Siemens Energy has also been actively repurchasing shares under a €6 billion buyback program, signaling confidence in its financial position. The company raised its full-year revenue growth outlook to 14%-16% and targets operating margins between 10% and 12%. These developments underscore a positive operational momentum despite ongoing challenges in the wind turbine business.
News Sentiment
The overall sentiment from recent updates is cautiously optimistic, reflecting positive operational performance in the grid technologies segment and strategic share repurchases that demonstrate management confidence. However, the need for Gamesa to reach breakeven remains a critical risk factor that tempers the outlook. Dividend approval and improved net income figures contribute to a constructive tone, while valuation concerns and structural risks in the wind business maintain a balanced perspective. This mix of positive growth indicators and ongoing challenges suggests a measured market sentiment.
Source List
- https://ad-hoc-news.de/boerse/news/ueberblick/siemens-energy-s-4-billion-profit-target-hinges-on-gamesa-s/69270759
- https://www.siemens-energy.com/global/en/home/investor-relations.html
- https://tipranks.com/news/company-announcements/siemens-energy-repurchases-over-10-8-million-shares-in-ongoing-buyback
Analytical Overview
Analysis Summary
Siemens Energy India Ltd. trades at a high trailing P/E ratio of 96.43 and forward P/E of 60.19, which are significantly above the industry average of 96.43 but reflect strong growth expectations supported by a PEG ratio below 1 at 0.84. Revenue growth is robust at 26% quarterly, complemented by healthy operating and net margins, and positive cash flow trends with operating cash flow of ₹2,595.6 crore and free cash flow of ₹1,100.1 crore, indicating solid financial performance. The company maintains a strong financial position with low debt of ₹14.76 crore relative to cash reserves of ₹346.2 crore, and a current ratio near 1.97, suggesting good liquidity and financial health. Sector-specific opportunities include India’s accelerating renewable energy adoption and grid modernization, while challenges involve regulatory dynamics and competitive pressures. Given the company’s Indian market focus, regulatory environment and economic outlook are critical factors influencing growth and operational stability.
Overall Business and Market Assessment
Supporting Factors: No data
Risk Factors: the stretched valuation multiples and dependence on the recovery of its wind turbine subsidiary, which remains a significant earnings uncertainty
SWOT Analysis
Strengths
- Strong return on equity of 25.11% indicating efficient capital use.
- Robust operating margin of 22.42% supporting profitability.
- Healthy cash position of ₹346 crore with low debt levels.
- Leadership in renewable energy and grid modernization in India.
Weaknesses
- High valuation multiples with P/E ratio of 96.43 and P/B ratio of 26.08.
- Dependence on wind turbine subsidiary Gamesa’s turnaround for earnings stability.
- Limited dividend yield at 0.13%, reducing income appeal.
- Relatively low public shareholding limiting retail investor participation.
Opportunities
- Growing demand for renewable energy and grid infrastructure in India.
- Strategic partnerships enhancing AI-driven operational efficiencies.
- Government incentives supporting energy transition initiatives.
- Expansion potential in energy storage and electrification segments.
Threats
- Regulatory changes impacting the utilities and renewable energy sector.
- Intense competition from other renewable energy companies.
- Macroeconomic volatility affecting capital expenditure cycles.
- Execution risks related to subsidiary performance and project delivery.
Company Description
Siemens Energy India Ltd. is a leading energy technology company operating across the entire energy value chain in India. The company’s primary focus is on enabling a reliable, affordable, and sustainable energy ecosystem by supporting businesses and countries in reducing emissions while expanding energy supply. Siemens Energy India Ltd. provides a comprehensive portfolio of products, solutions, and services that encompass conventional and renewable power generation, grid technology, energy storage, and the electrification of complex industrial processes. With a pan-India presence, the company plays a significant role in modernizing and strengthening grid infrastructure to meet growing power demands and facilitate the integration of renewable energy sources. Its offerings include advanced solutions such as air-insulated and gas-insulated switchgear, high-capacity transformers, reactors, and traction transformers, as well as turnkey project management for high and extra-high voltage systems. Siemens Energy India Ltd. also provides extensive lifecycle services for grid assets, ensuring reliability and efficiency throughout their operation. As an integral part of India’s energy transition, the company is at the forefront of innovations that drive both the modernization of the power sector and progress towards national sustainability goals.