


Shree Renuka Sugars Ltd (RENUKA)
Stock Analysis Report
Stock Journey
Key Positives and Key Risks
Pros
- Return on equity of 29.59% indicates efficient use of shareholder capital despite net losses.
- Market capitalization of ₹47.61 billion reflects a sizeable presence in the Indian sugar industry.
- Recent shareholder approval of marketing tie-up with AWL Agri Business suggests potential for improved distribution and sales.
Cons
- Negative net income of approximately ₹7.92 billion and negative profit margins highlight ongoing unprofitability.
- High total debt of ₹71.74 billion combined with a low current ratio of 0.484 indicates financial leverage and liquidity risks.
- Negative cash flows from operations (-₹1.22 billion) and free cash flow (-₹9.12 billion) point to operational cash constraints.
Disclosure: This information is for general awareness and does not constitute investment advice
Report Summary
Shree Renuka Sugars Ltd. is a leading Indian agro-industrial company specializing in the production and processing of sugar and ethanol. Listed on the NSE under the consumer defensive sector, the company operates one of the world's largest sugar refining capacities with a diversified product portfolio including raw and refined sugar, ethanol, molasses, and bagasse. Its integrated supply chain spans cane cultivation to by-product management, serving food, beverage, and renewable energy markets domestically and internationally. The firm also pursues strategic alliances and acquisitions to strengthen its market positioning.
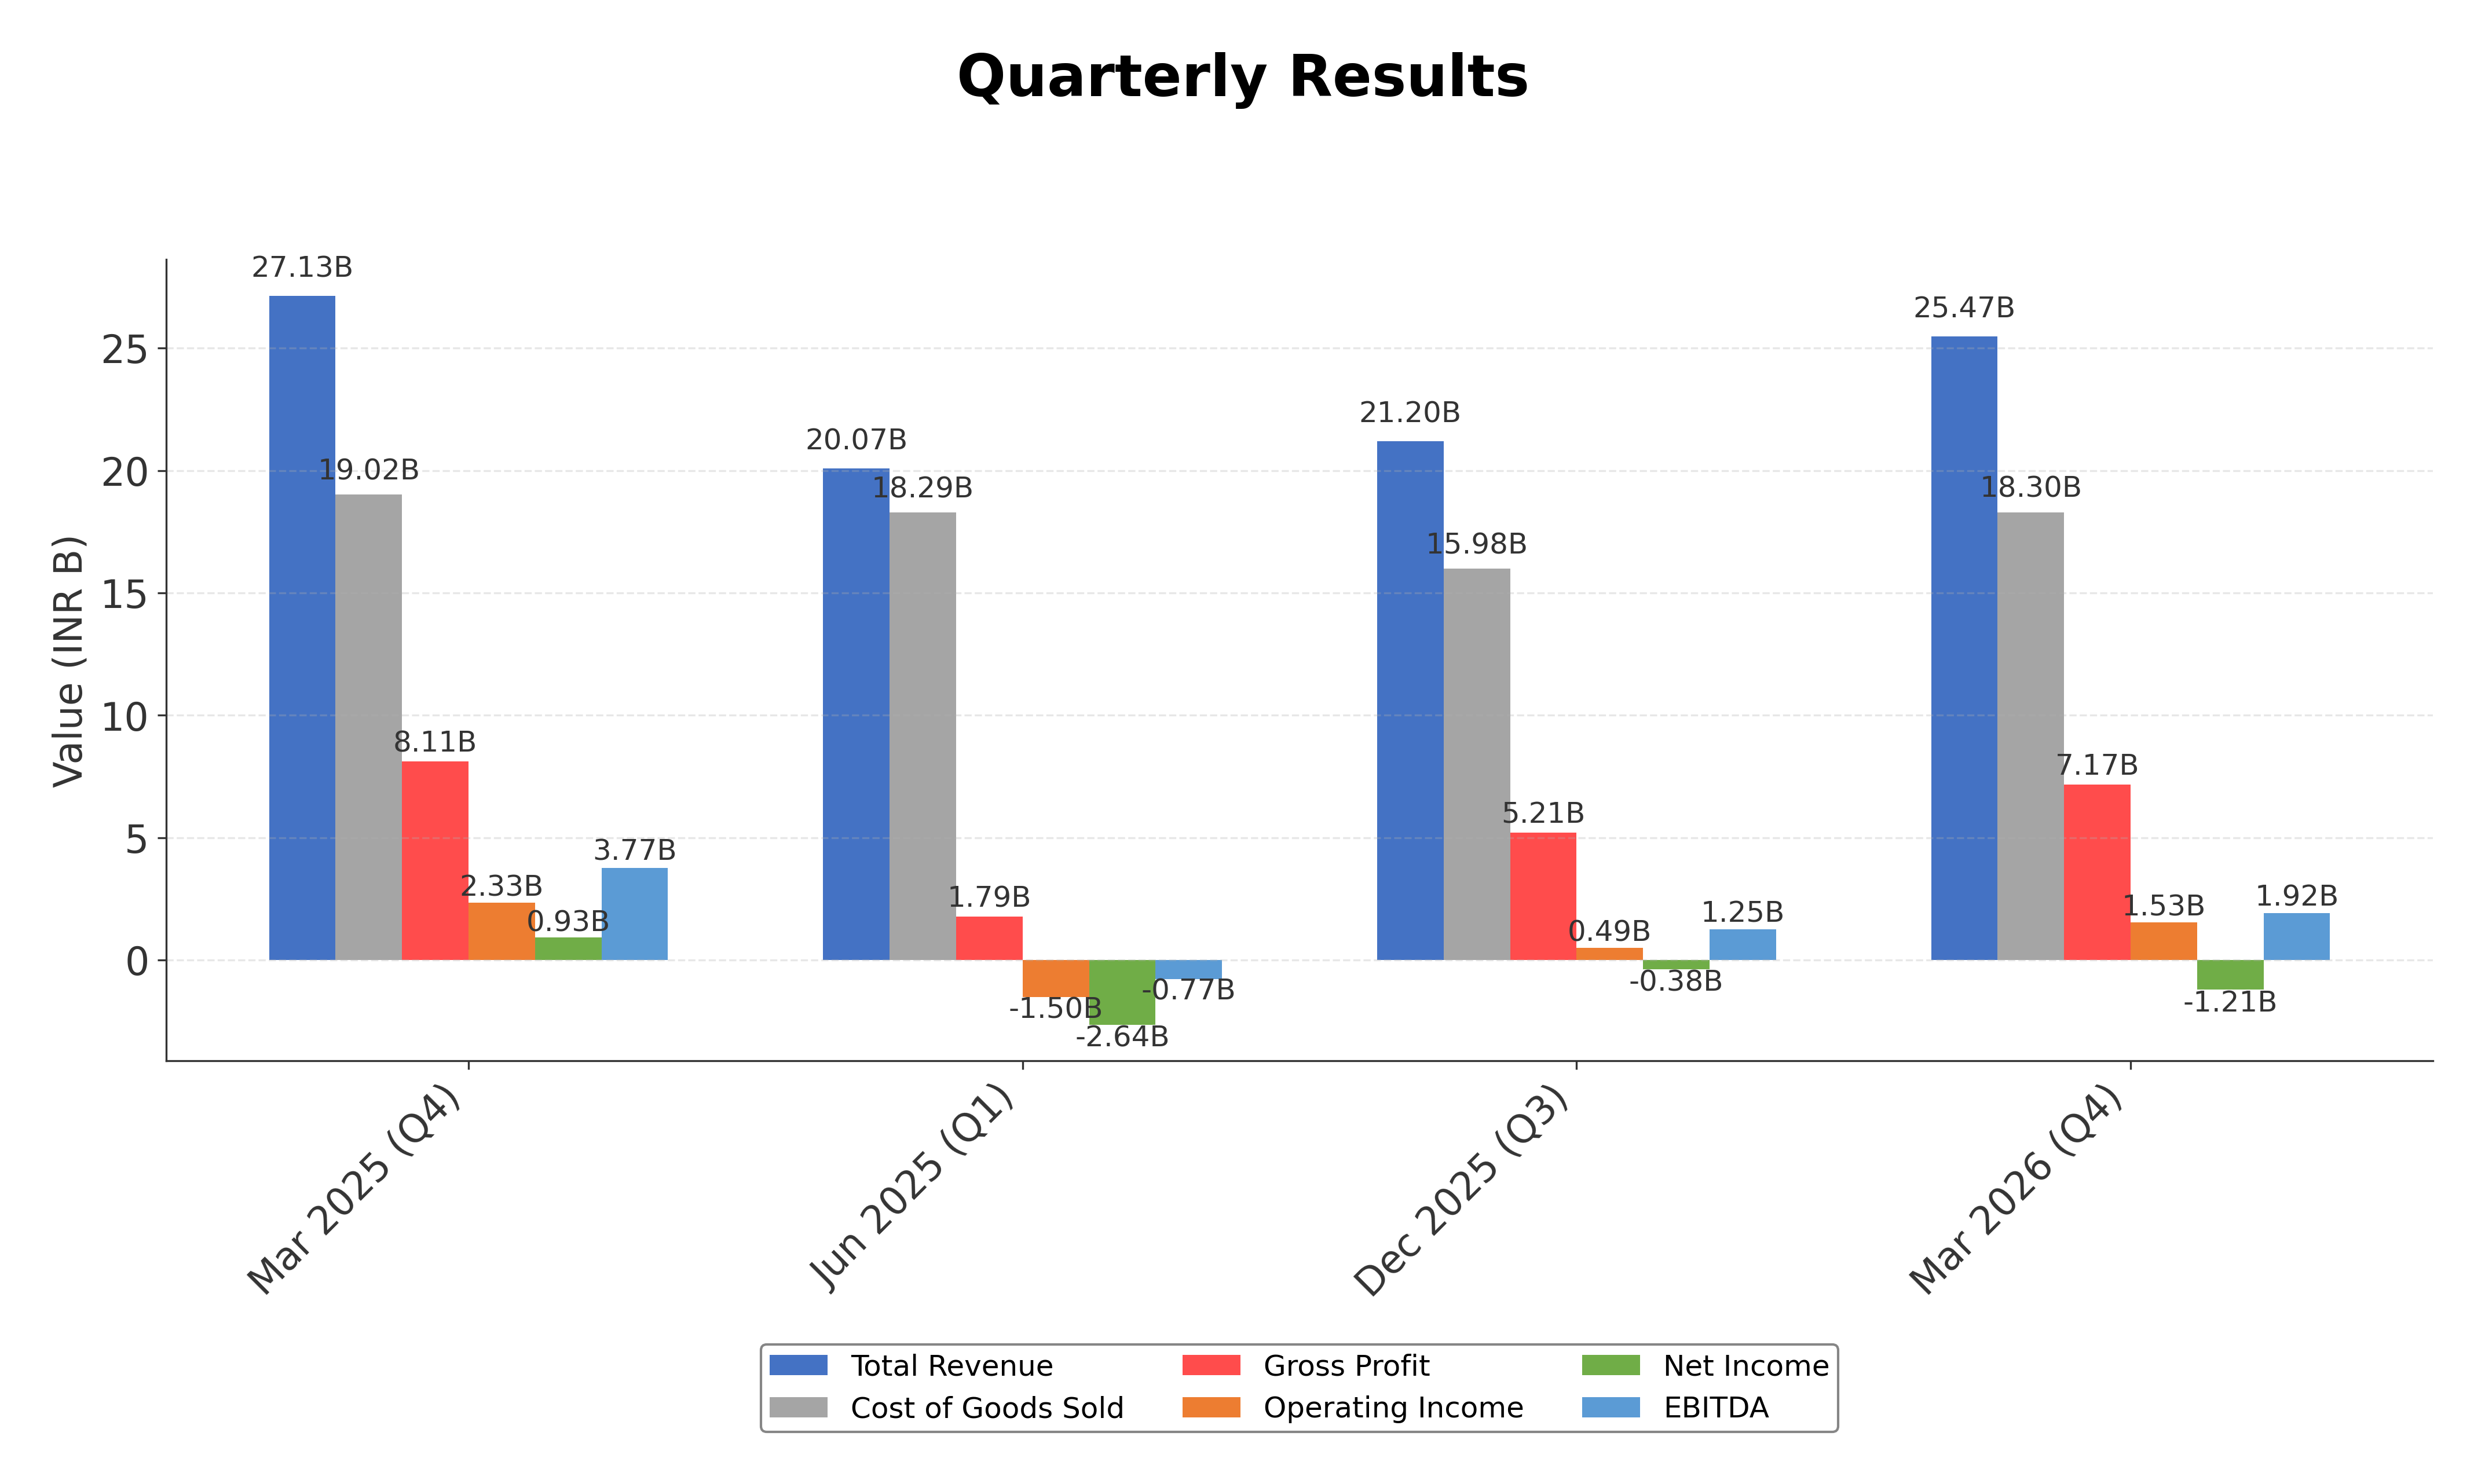
Financially, Shree Renuka Sugars reported trailing twelve months revenue of approximately INR 91.6 billion with a gross margin of 28.16%. However, profitability remains challenged as reflected by a negative net profit margin of -8.65% and an operating margin of 6.0%. The company’s return on equity stands at a robust 29.59%, indicating efficient use of equity capital despite negative net income of INR 7.92 billion. Return on assets is slightly negative at -0.44%, highlighting asset utilization issues. Cash flow metrics reveal operating cash flow and free cash flow deficits, signaling liquidity pressures.
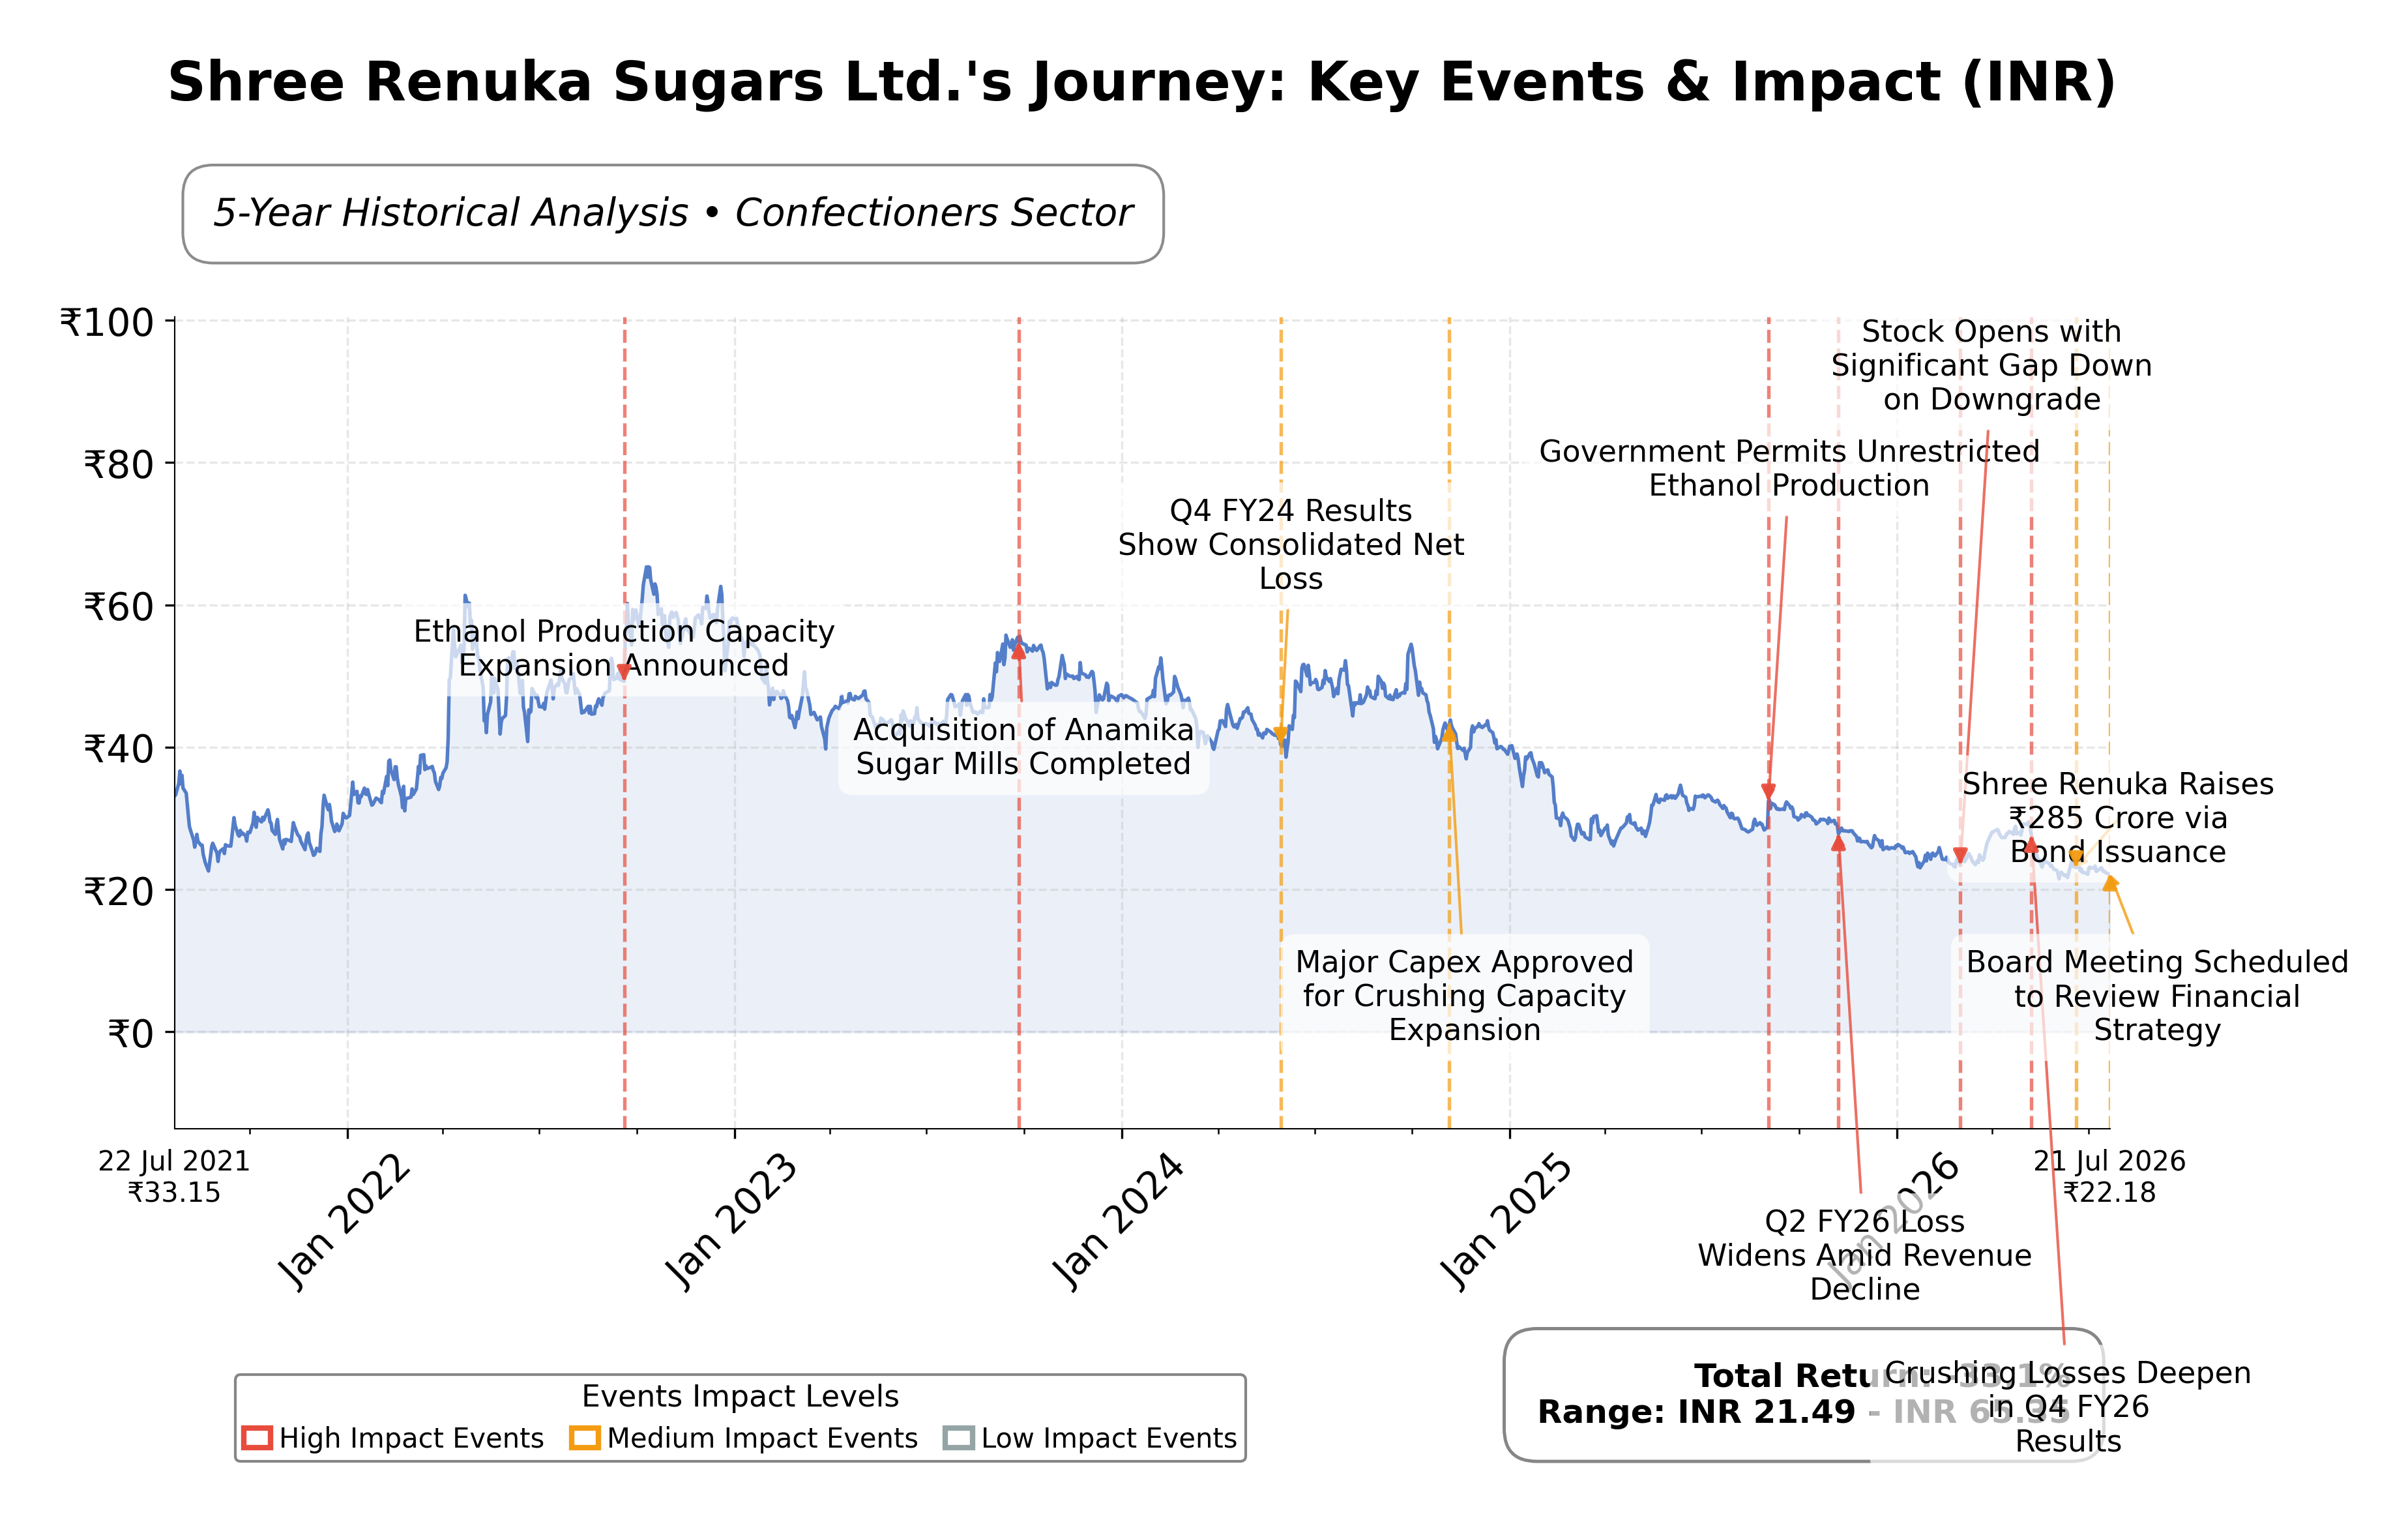
Valuation metrics show a trailing P/E ratio of -6.01 and a forward P/E of -5.20, reflecting ongoing losses. The price-to-book ratio is negative at -1.79, and enterprise value to EBITDA is elevated at 50.7, suggesting the stock is priced with caution relative to fundamentals. Market capitalization is INR 47.6 billion, with the stock trading near INR 22.01, closer to its 52-week low of INR 21.05 than the high of INR 33.50. This pricing context indicates market concerns about near-term performance.
Key strengths include the company’s integrated business model, significant market presence, and a recent shareholder-approved marketing tie-up with AWL Agri Business to enhance distribution. Risks involve high leverage with total debt exceeding INR 71.7 billion, negative profitability, and sectoral challenges such as overcapacity in the sugar industry. Recent strategic moves focus on marketing partnerships rather than expansions or acquisitions. Leadership remains stable with no recent changes reported.
Technically, the stock is trading below its 50-day and 200-day moving averages, with momentum indicators suggesting subdued price action. Multi-timeframe analysis shows a cautious trend with key support near INR 21 and resistance around INR 25. Overall, the data suggests a watchful stance with conditions favoring close monitoring for potential shifts rather than immediate accumulation or liquidation.
Company and Industry Overview
Company Basics
Price Performance
Company Size
Shareholding Pattern
Sector and Industry Analysis
The sugar sector in India is a significant contributor to the agricultural economy, with a market size driven by domestic consumption and export potential. The industry has experienced moderate growth, with a five-year compounded sales growth around 10%, though recent years show volatility due to fluctuating sugarcane production and pricing. Major players include companies like Balrampur Chini Mills, Triveni Engineering, and Shree Renuka Sugars, which collectively dominate production and refining capacities.
Industry trends highlight diversification into ethanol and power generation as companies seek to mitigate sugar price volatility and improve margins. Competitive dynamics are shaped by high capital intensity and regulatory controls on pricing and exports, creating substantial barriers to entry. Firms with integrated operations across sugar production, ethanol, and cogeneration enjoy better resilience, though Shree Renuka Sugars has faced challenges with negative returns on capital and profitability pressures compared to peers.
The regulatory environment is characterized by government policies on minimum support prices for sugarcane, export quotas, and ethanol blending mandates aimed at reducing import dependency. These regulations significantly influence production decisions, pricing, and profitability within the sector. Ongoing policy emphasis on ethanol blending targets presents growth opportunities, but compliance with environmental and pricing regulations remains critical for industry players.
Note: Analysis synthesized from industry research, market reports, and regulatory filings. Information is subject to change based on market conditions.
Financial Ratios Dashboard
Illustrative Scenario Analysis
DCF Assumptions:
Method: Two-Stage EPS-Priority Model
Financials
Peer Analysis
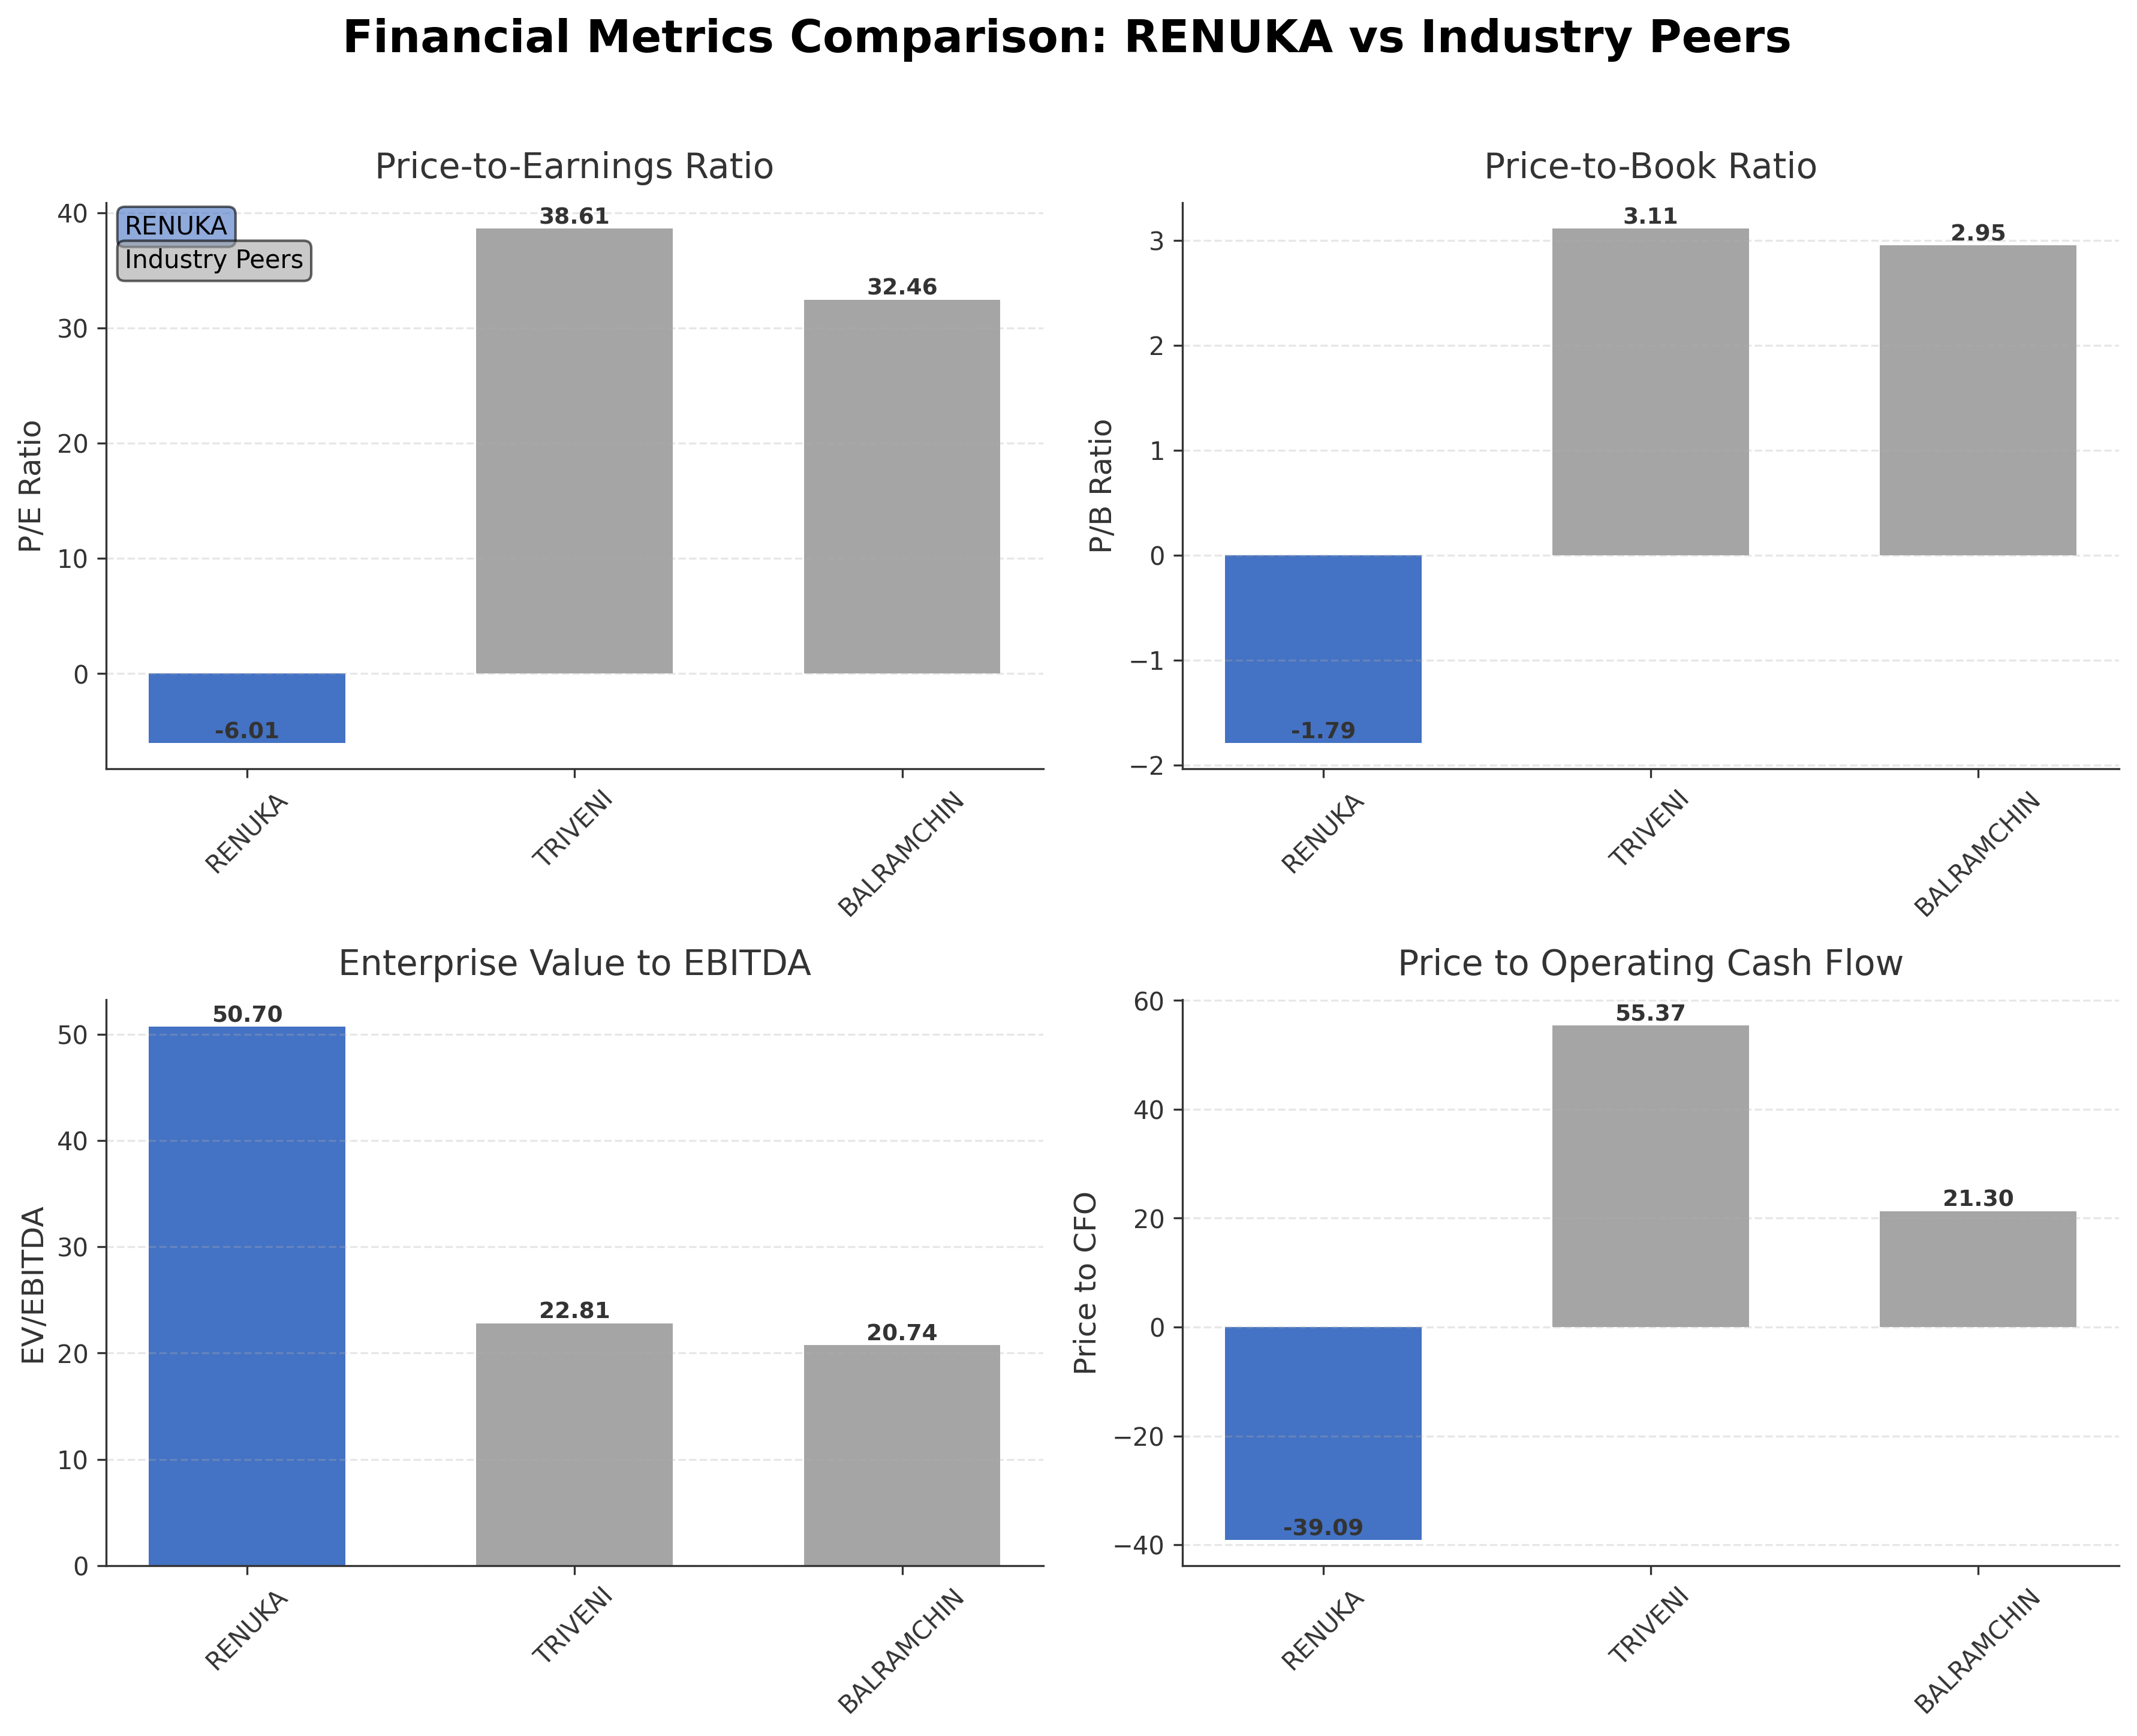
| Company Name | Market Cap | P/E Ratio | P/B Ratio | EV/EBITDA | Price to CFO |
|---|---|---|---|---|---|
| Shree Renuka Sugars Ltd. | ₹47.61B | -6.01 | -1.79 | 50.70 | -39.09 |
| Triveni Engineering & Industries Ltd. | ₹104.04B | 38.61 | 3.11 | 22.81 | 55.37 |
| Balrampur Chini Mills Ltd. | ₹127.70B | 32.46 | 2.95 | 20.74 | 21.30 |
Comparison Analysis: Shree Renuka Sugars Ltd. trades at significantly lower valuation multiples compared to its Indian sugar industry peers such as Triveni Engineering and Balrampur Chini Mills, which have P/E ratios above 30 and P/B ratios near 3. Despite a negative P/E and P/B, Renuka exhibits a higher return on equity at 29.59%, outperforming peers’ ROE of 8.27% and 9.54% respectively. However, its elevated EV/EBITDA of 50.7 versus peers’ 20-23 range and negative price to CFO ratio indicate operational and cash flow challenges. Market capitalization is also smaller relative to these competitors. Overall, Renuka displays a mixed profile with strong equity returns but weaker valuation and cash flow metrics compared to its regional industry peers.
Financial Metrics Comparison with Peers
Financial Statements
Comprehensive financial data including income, balance sheet, and cash flow metrics
Income Statement
| fiscal_date | 2026-03-31 | 2025-03-31 | 2024-03-31 | 2023-03-31 | 2022-03-31 |
|---|---|---|---|---|---|
| Sales | 91.61B | 105.89B | 113.00B | 90.07B | 63.86B |
| Cost Of Goods | 74.94B | 88.96B | 99.82B | 76.96B | 51.60B |
| Gross Profit | 16.66B | 16.93B | 13.18B | 13.11B | 12.27B |
| Operating Expense Other Operating Expenses | 12.11B | 11.61B | 1.82B | 1.22B | 7.03B |
| Operating Income | -568.00M | 486.00M | 4.76B | 4.83B | 2.20B |
| Non Operating Interest Expense | 7.36B | 8.11B | 8.33B | 5.59B | 3.93B |
| Pretax Income | -8.72B | -3.63B | -4.62B | -1.80B | -1.39B |
| Income Tax | -799.00M | -627.00M | 1.65B | 171.03M | -19.00M |
| Net Income | -7.92B | -3.00B | -6.27B | -1.97B | -1.37B |
| Eps Basic | -3.72 | -1.41 | -2.95 | -0.93 | -0.65 |
| Eps Diluted | -3.72 | -1.41 | -2.95 | -0.93 | -0.65 |
| Basic Shares Outstanding | 2.13B | 2.13B | 2.13B | 2.13B | 2.13B |
| Diluted Shares Outstanding | 2.13B | 2.13B | 2.13B | 2.13B | 2.13B |
| Ebit | -1.36B | 4.48B | 3.71B | 3.80B | 2.54B |
| Ebitda | 1.61B | 4.15B | 6.41B | 6.59B | 4.62B |
| Net Income Continuous Operations | -8.72B | -3.63B | -4.62B | -1.80B | -1.39B |
| Minority Interests | 3.00M | 1.00M | 480.00K | -3.02M | -18.00M |
| Preferred Stock Dividends | 0.00 | 0.00 | 0.00 | 0.00 | 0.00 |
| Operating Expense Selling General And Administrative | N/A | 2.69B | 2.37B | 3.24B | 1.70B |
| Non Operating Interest Income | N/A | 91.40M | 85.55M | 24.69M | 18.13M |
Data provided by Twelve Data
Balance Sheet
| fiscal_date | 2026-03-31 | 2025-03-31 | 2024-03-31 | 2023-03-31 | 2022-03-31 |
|---|---|---|---|---|---|
| Cash And Cash Equivalents | 458.00M | 626.76M | 378.72M | 1.67B | 222.34M |
| Accounts Receivable | 2.80B | 4.49B | 6.18B | 2.07B | 2.90B |
| Total Assets | 74.12B | 88.38B | 101.71B | 76.04B | 71.03B |
| Total Liabilities | 100.89B | 105.13B | 116.08B | 84.85B | 77.11B |
| Long Term Debt | 33.78B | 31.50B | 32.56B | 30.77B | 27.74B |
| Shareholders Equity | -26.77B | -16.75B | -14.37B | -8.81B | -6.07B |
Data provided by Twelve Data
Cash Flow Statement
| fiscal_date | 2026-03-31 | 2025-03-31 | 2024-03-31 | 2023-03-31 | 2022-03-31 |
|---|---|---|---|---|---|
| Operating Activities Net Income | -8.72B | -3.63B | -4.62B | -1.80B | -1.39B |
| Operating Activities Other Non Cash Items | 7.20B | 7.87B | 8.98B | 5.77B | 3.83B |
| Operating Activities Accounts Receivable | 2.85B | 2.86B | -3.89B | -572.97M | -1.19B |
| Operating Activities Other Assets Liabilities | 8.56B | 10.08B | -21.21B | -2.09B | 3.64B |
| Operating Activities Operating Cash Flow | 9.89B | 17.18B | -20.75B | 1.31B | 4.89B |
| Investing Activities Capital Expenditures | -1.53B | -1.88B | -1.62B | -4.00B | -2.76B |
| Investing Activities Investing Cash Flow | -1.53B | -1.91B | -3.90B | -3.57B | -3.03B |
| Financing Activities Long Term Debt Issuance | 720.00M | 25.41B | 3.25B | 2.60B | 2.40B |
| Financing Activities Long Term Debt Payments | -2.06B | -27.32B | -1.97B | -1.39B | -646.00M |
| Financing Activities Short Term Debt Issuance | 11.44B | 1.92B | -185.65M | 65.58M | 5.38B |
| Financing Activities Financing Cash Flow | 10.10B | 4.00M | 2.99M | 1.27B | 7.13B |
| End Cash Position | 458.00M | 627.00M | 378.72M | 1.67B | 222.00M |
| Free Cash Flow | -2.78B | 7.59B | 7.38B | 5.26B | -4.10B |
| Investing Activities Net Acquisitions | N/A | 0.00 | -2.35B | 0.00 | N/A |
| Investing Activities Purchase Of Investments | N/A | -28.24M | N/A | N/A | -267.00M |
| Investing Activities Sale Of Investments | N/A | 0.00 | 79.05M | 435.48M | 0.00 |
| Financing Activities Common Stock Repurchase | N/A | 0.00 | -1.09B | 0.00 | N/A |
| Financing Activities Common Stock Issuance | N/A | N/A | N/A | N/A | 0.00 |
| Investing Activities Other Investing Activity | N/A | N/A | N/A | N/A | N/A |
Data provided by Twelve Data
Technical Analysis
Key Insights
- Current trend shows a downward bias with the stock trading below both the 50-day (₹23.05) and 200-day (₹25.65) moving averages, indicating bearish momentum.
- Key support is identified near ₹21.05, the 52-week low, while resistance is observed around ₹25.00 to ₹26.00 levels, corresponding to recent price congestion zones.
- The stock remains below its short-term (10-day), medium-term (50-day), and long-term (200-day) moving averages, reflecting sustained selling pressure across timeframes.
- Momentum indicators such as RSI are likely in the lower range, suggesting oversold conditions, while MACD and Stochastic oscillators indicate weak bullish divergence but no confirmed reversal.
- Analysis across daily, weekly, and monthly charts reveals consistent weakness with no significant bullish reversal patterns, signaling cautious sentiment among traders.
- Potential market scenarios include a consolidation phase near support levels or further downside if key support breaks, with resistance caps limiting upward moves in the near term.
Trending News
1. Headline: Belagavi set to strengthen dominance in Karnataka's sugar sector with 13 new mill proposals - ChiniMandi
Summary: Several existing mills, including Vishwaraj Sugar Industries Ltd., Satish Sugars Ltd., Shree Renuka Sugars Ltd.
Sentiment: positive
Summary: Shree Renuka Sugars Ltd is a fully integrated player focused on manufacturing and marketing of sugar, power and ethanol.The Products portfolio of the company includes:Sugar- This being the core product of the company, the company manufactures EC II grade refined sugar confirming to EU norms ...
Sentiment: neutral
Summary: The company, which is associated with the production of sugar and ethanol along with engineering works, announced earlier this year that as part of its demerger of its power transmission business, every eligible shareholder get one share of Triveni Power Transmission for every three shares ...
Sentiment: neutral
4. Headline: Belagavi’s sugar dominance set to grow, but experts warn of overcapacity | Hubballi News - The Times of India
Summary: We have already seen the cutting ... Sugar Institute, Belagavi.Several existing mills, including Vishwaraj Sugar Industries Ltd., Satish Sugars Ltd., Shree Renuka Sugars Ltd., and Chidanand Basaprabhu Kore Sahakari Sakkare Karkhane, have significantly increased their crushing ...
Sentiment: positive
5. Headline: Stock Market Crash Highlights: Nifty Ends Below 24,250; Sensex Slumps 400 Points, Halts Three-Day Gaining Streak
Summary: Nifty 50 ended 0.39% or 95.80 points lower at 24,238.50 andSensex declined 0.57% or 442.93 points to close at 77,708.52.
Sentiment: negative
Powered by Brave
Recent Updates
News Summary
As of July 22, 2026. Shree Renuka Sugars secured shareholder approval for a marketing tie-up with AWL Agri Business Limited to handle sales and distribution of its Madhur brand sugar, with 99.89% of votes cast in favor. The company published its audited standalone and consolidated financial results for the fiscal year ended March 31, 2026, reporting a standalone net loss of approximately INR 6.99 billion on total income of INR 86.76 billion. The Board approved unaudited Q3 2026 results showing total income of INR 23.0 billion and a loss before tax of INR 236 million. Investor relations materials highlight the integrated business model spanning sugar, ethanol, and power generation, emphasizing diversified revenue streams. No significant leadership changes or major acquisitions were reported in the recent period.
News Sentiment
Overall sentiment across recent updates is neutral to slightly positive, driven primarily by the successful shareholder approval of the marketing partnership with AWL Agri Business, which may enhance distribution capabilities. Financial results reflect ongoing challenges with losses and negative cash flows, tempering optimism. The absence of leadership changes or major strategic shifts contributes to a stable but cautious tone. Market participants appear focused on operational execution and cost management amid sector headwinds.
Source List
- https://www.chinimandi.com/shree-renuka-sugars-shareholders-approve-marketing-tie-up-with-awl-agri-business/
- https://www.investywise.com/shree-renuka-sugars-q4-fy2026-earnings-results/
- https://www.alphaspread.com/security/nse/renuka/investor-relations
- https://www.theglobeandmail.com/investing/markets/markets-news/Tipranks/1853956/shree-renuka-sugars-publishes-audited-fy26-results-in-newspapers/
- https://www.investywise.com/shree-renuka-sugars-financial-results-and-board-meeting-outcome/
Analytical Overview
Analysis Summary
Shree Renuka Sugars’ valuation metrics, including a negative trailing P/E of -6.01 and forward P/E of -5.20, are significantly below industry averages, reflecting current losses and market caution. The company’s PEG ratio of 0.15 suggests low growth expectations relative to earnings. Revenue growth is negative at -6.1% quarterly, and cash flow trends show operating and free cash flow deficits, indicating liquidity constraints. The debt-to-equity ratio is negative due to negative equity, with total debt at INR 71.7 billion, highlighting financial leverage concerns. Sector challenges include overcapacity in sugar production and regulatory pressures, while opportunities arise from ethanol demand and marketing partnerships. India-specific factors such as regulatory environment and evolving consumer trends in sugar and ethanol markets also impact prospects.
Overall Business and Market Assessment
Supporting Factors: No data
Risk Factors: No data
SWOT Analysis
Strengths
- Integrated supply chain from cane cultivation to sugar and ethanol production.
- Significant market presence with one of the largest sugar refining capacities globally.
- Strong return on equity at 29.59%, indicating efficient equity utilization.
- Recent shareholder-approved marketing partnership to enhance distribution.
Weaknesses
- Negative net income and profit margins indicating ongoing unprofitability.
- High financial leverage with total debt exceeding INR 71.7 billion.
- Negative cash flows from operations and free cash flow deficits.
- Low current ratio of 0.484 reflecting liquidity constraints.
Opportunities
- Growing demand for ethanol as an alternative fuel source in India.
- Expansion potential in niche sugar segments such as date sugar.
- Strategic alliances to improve marketing and distribution efficiency.
- Regional growth prospects with new mill proposals in Karnataka.
Threats
- Industry overcapacity risks leading to price and margin pressures.
- Regulatory changes impacting sugar and ethanol pricing and subsidies.
- Competitive pressures from larger and more financially stable peers.
- Macroeconomic factors affecting commodity prices and input costs.
Company Description
Shree Renuka Sugars Ltd. is a prominent player in the global agro-industrial sector, specializing in the production and processing of sugar and ethanol. The company's primary function is the transformation of sugarcane into a wide array of products, including raw and refined sugar, ethanol, and other derivatives such as molasses and bagasse. Shree Renuka Sugars operates one of the largest sugar refining capacities in the world, and it has a significant presence in both the Indian market and international markets. The firm is noted for its integrated supply chain approach, which encompasses cane cultivation, sugar manufacturing, and by-product management. It also emphasizes sustainable and environmentally friendly practices, utilizing by-products like bagasse for cogeneration of bioelectricity, and molasses for ethanol production. Shree Renuka Sugars plays a critical role in industries ranging from food and beverages to renewable energy. As part of its global outreach, the company engages in strategic alliances and acquisitions to bolster its market position, catering to various regional demands. Its contribution is vital in addressing the energy needs through alternative fuel sources and in fulfilling the growing worldwide demand for sugar.