


Shilpa Medicare Ltd (SHILPAMED)
Stock Analysis Report
Stock Journey
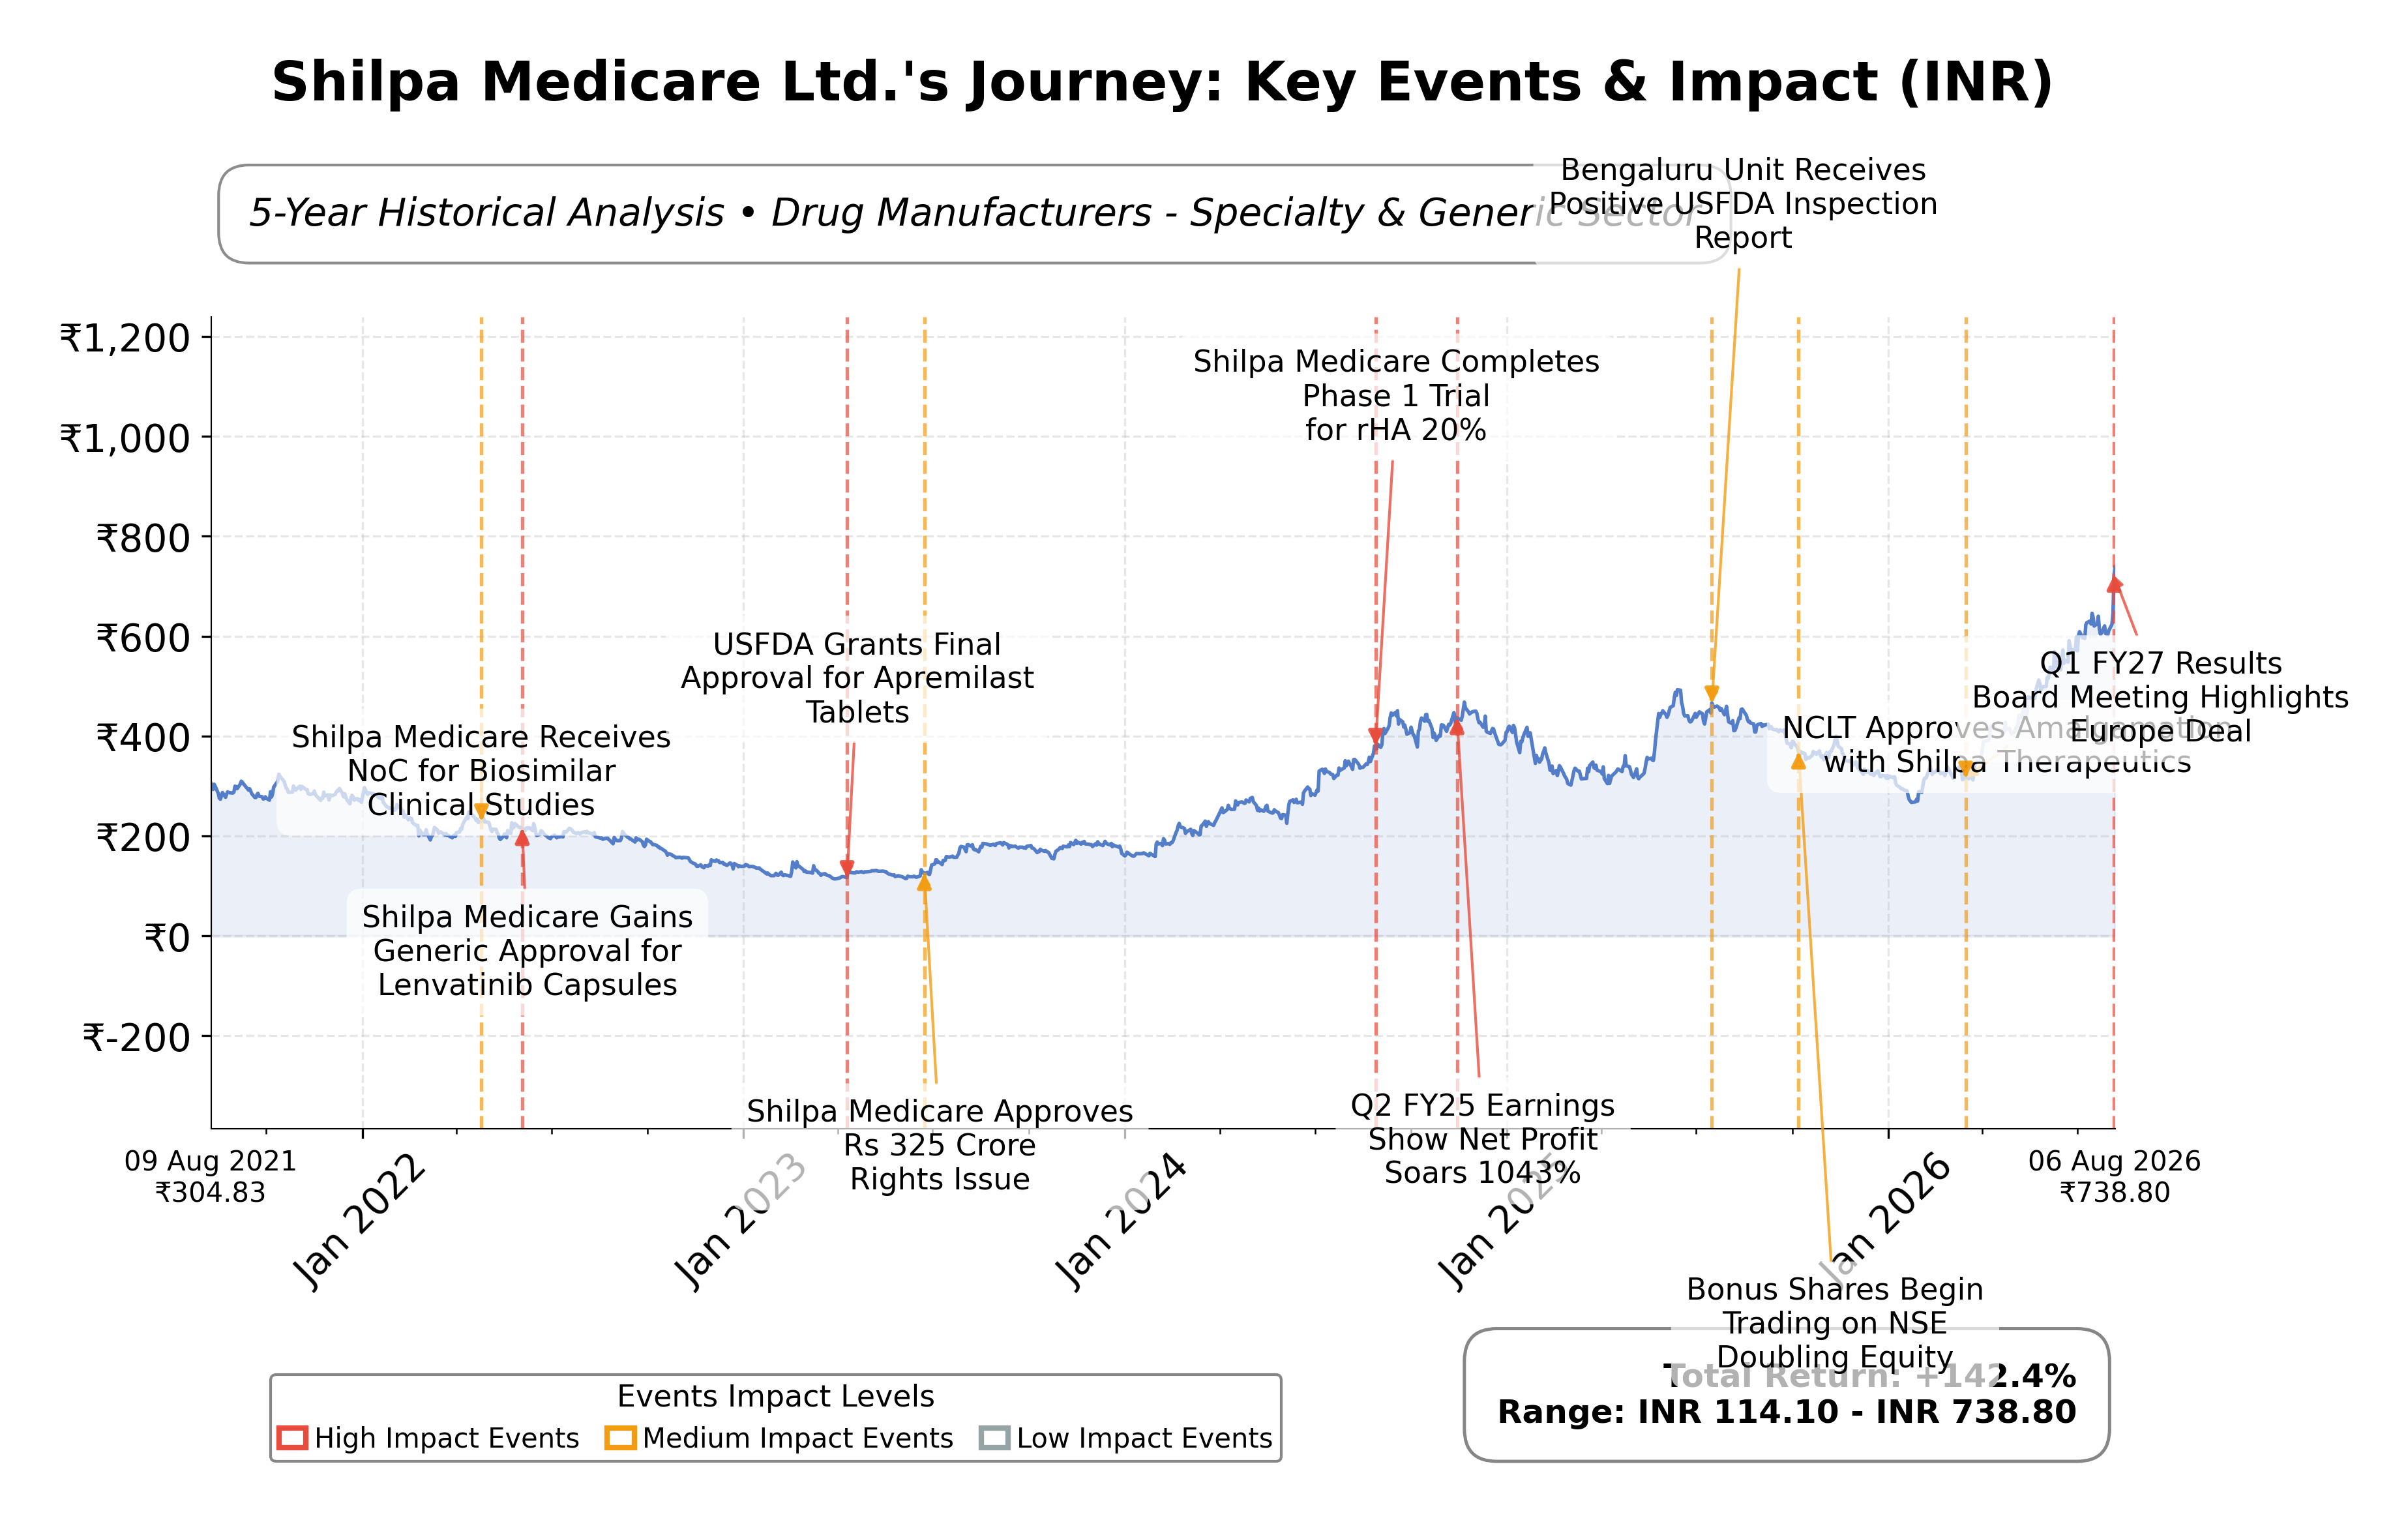
Key Positives and Key Risks
Pros
- Revenue growth of 31.5% quarter-over-quarter and 43% year-on-year demonstrates strong top-line momentum.
- EBITDA margin expansion to 30% with EBITDA of ₹139 crore in Q1 FY27 indicates improving operational efficiency.
- Manageable debt-to-equity ratio of 0.25 supports financial stability and liquidity.
Cons
- High trailing P/E ratio of 60.05 and forward P/E of 40.48 suggest the stock is trading at a premium relative to earnings.
- Negative free cash flow of ₹-142 crore reflects ongoing capital expenditures that may pressure liquidity.
- Return on equity of 9.82% is moderate compared to industry peers, indicating room for improvement in profitability.
Disclosure: This information is for general awareness and does not constitute investment advice
Report Summary
Shilpa Medicare Ltd. is a pharmaceutical company listed on the NSE in India, operating within the Healthcare sector, specifically in the Drug Manufacturers - Specialty & Generic industry. The company focuses on the formulation, development, and manufacturing of active pharmaceutical ingredients (APIs), formulations, and intermediates, serving both domestic and international markets. Its product portfolio includes oncology, anti-infectives, and anti-inflammatory treatments, with a strong emphasis on complex generics and niche APIs. Headquartered in Raichur, Karnataka, Shilpa Medicare has established itself as a significant player in regulated markets through innovation and strategic partnerships.
Financially, Shilpa Medicare reported trailing twelve months (TTM) revenue of approximately ₹1,538.87 crore with a gross margin of 67.5%, operating margin of 20.4%, and net profit margin of 15.8%. The company’s return on equity (ROE) stands at 9.82%, and return on assets (ROA) at 5.61%, indicating moderate profitability and efficient asset utilization. EBITDA for the TTM period was ₹461.67 crore, with an operating cash flow of ₹342.18 crore, although free cash flow was negative at ₹-142.03 crore, reflecting ongoing investments or working capital changes.
Valuation metrics show a trailing P/E ratio of 60.05 and a forward P/E of 40.48, which are relatively high compared to industry peers, indicating a premium valuation. The price-to-book ratio is 5.65, and the enterprise value to EBITDA ratio is 30.42, suggesting the stock is priced richly relative to earnings and book value. The market capitalization is approximately ₹144.50 billion, with the stock trading near its 52-week high of ₹785.80, currently priced at ₹738.80, reflecting a 52-week range of ₹259.50 to ₹785.80.
Shilpa Medicare’s strengths include robust revenue growth of 31.5% quarter-over-quarter, strong market positioning in specialty APIs, and recent record quarterly revenue and profit performance. The company maintains a manageable debt-to-equity ratio of 0.25 and a current ratio of 1.31, indicating reasonable liquidity. Key risks involve regulatory challenges inherent to the pharmaceutical industry, competitive pressures, and the impact of macroeconomic factors on export markets. Recent strategic actions include leadership changes in its biologics subsidiary and ongoing pipeline developments, such as ADC biosimilars and partnerships with Orion Corporation and Gate2Brain.
Technically, the stock shows a strong uptrend, trading above its 50-day and 200-day moving averages, with momentum indicators signaling positive momentum across multiple timeframes. Recent news highlights record quarterly earnings and significant stock price appreciation. Overall, the data suggests a market environment where accumulation and monitoring of performance metrics may be prudent, given the premium valuation and growth trajectory.
Company and Industry Overview
Company Basics
Price Performance
Company Size
Shareholding Pattern
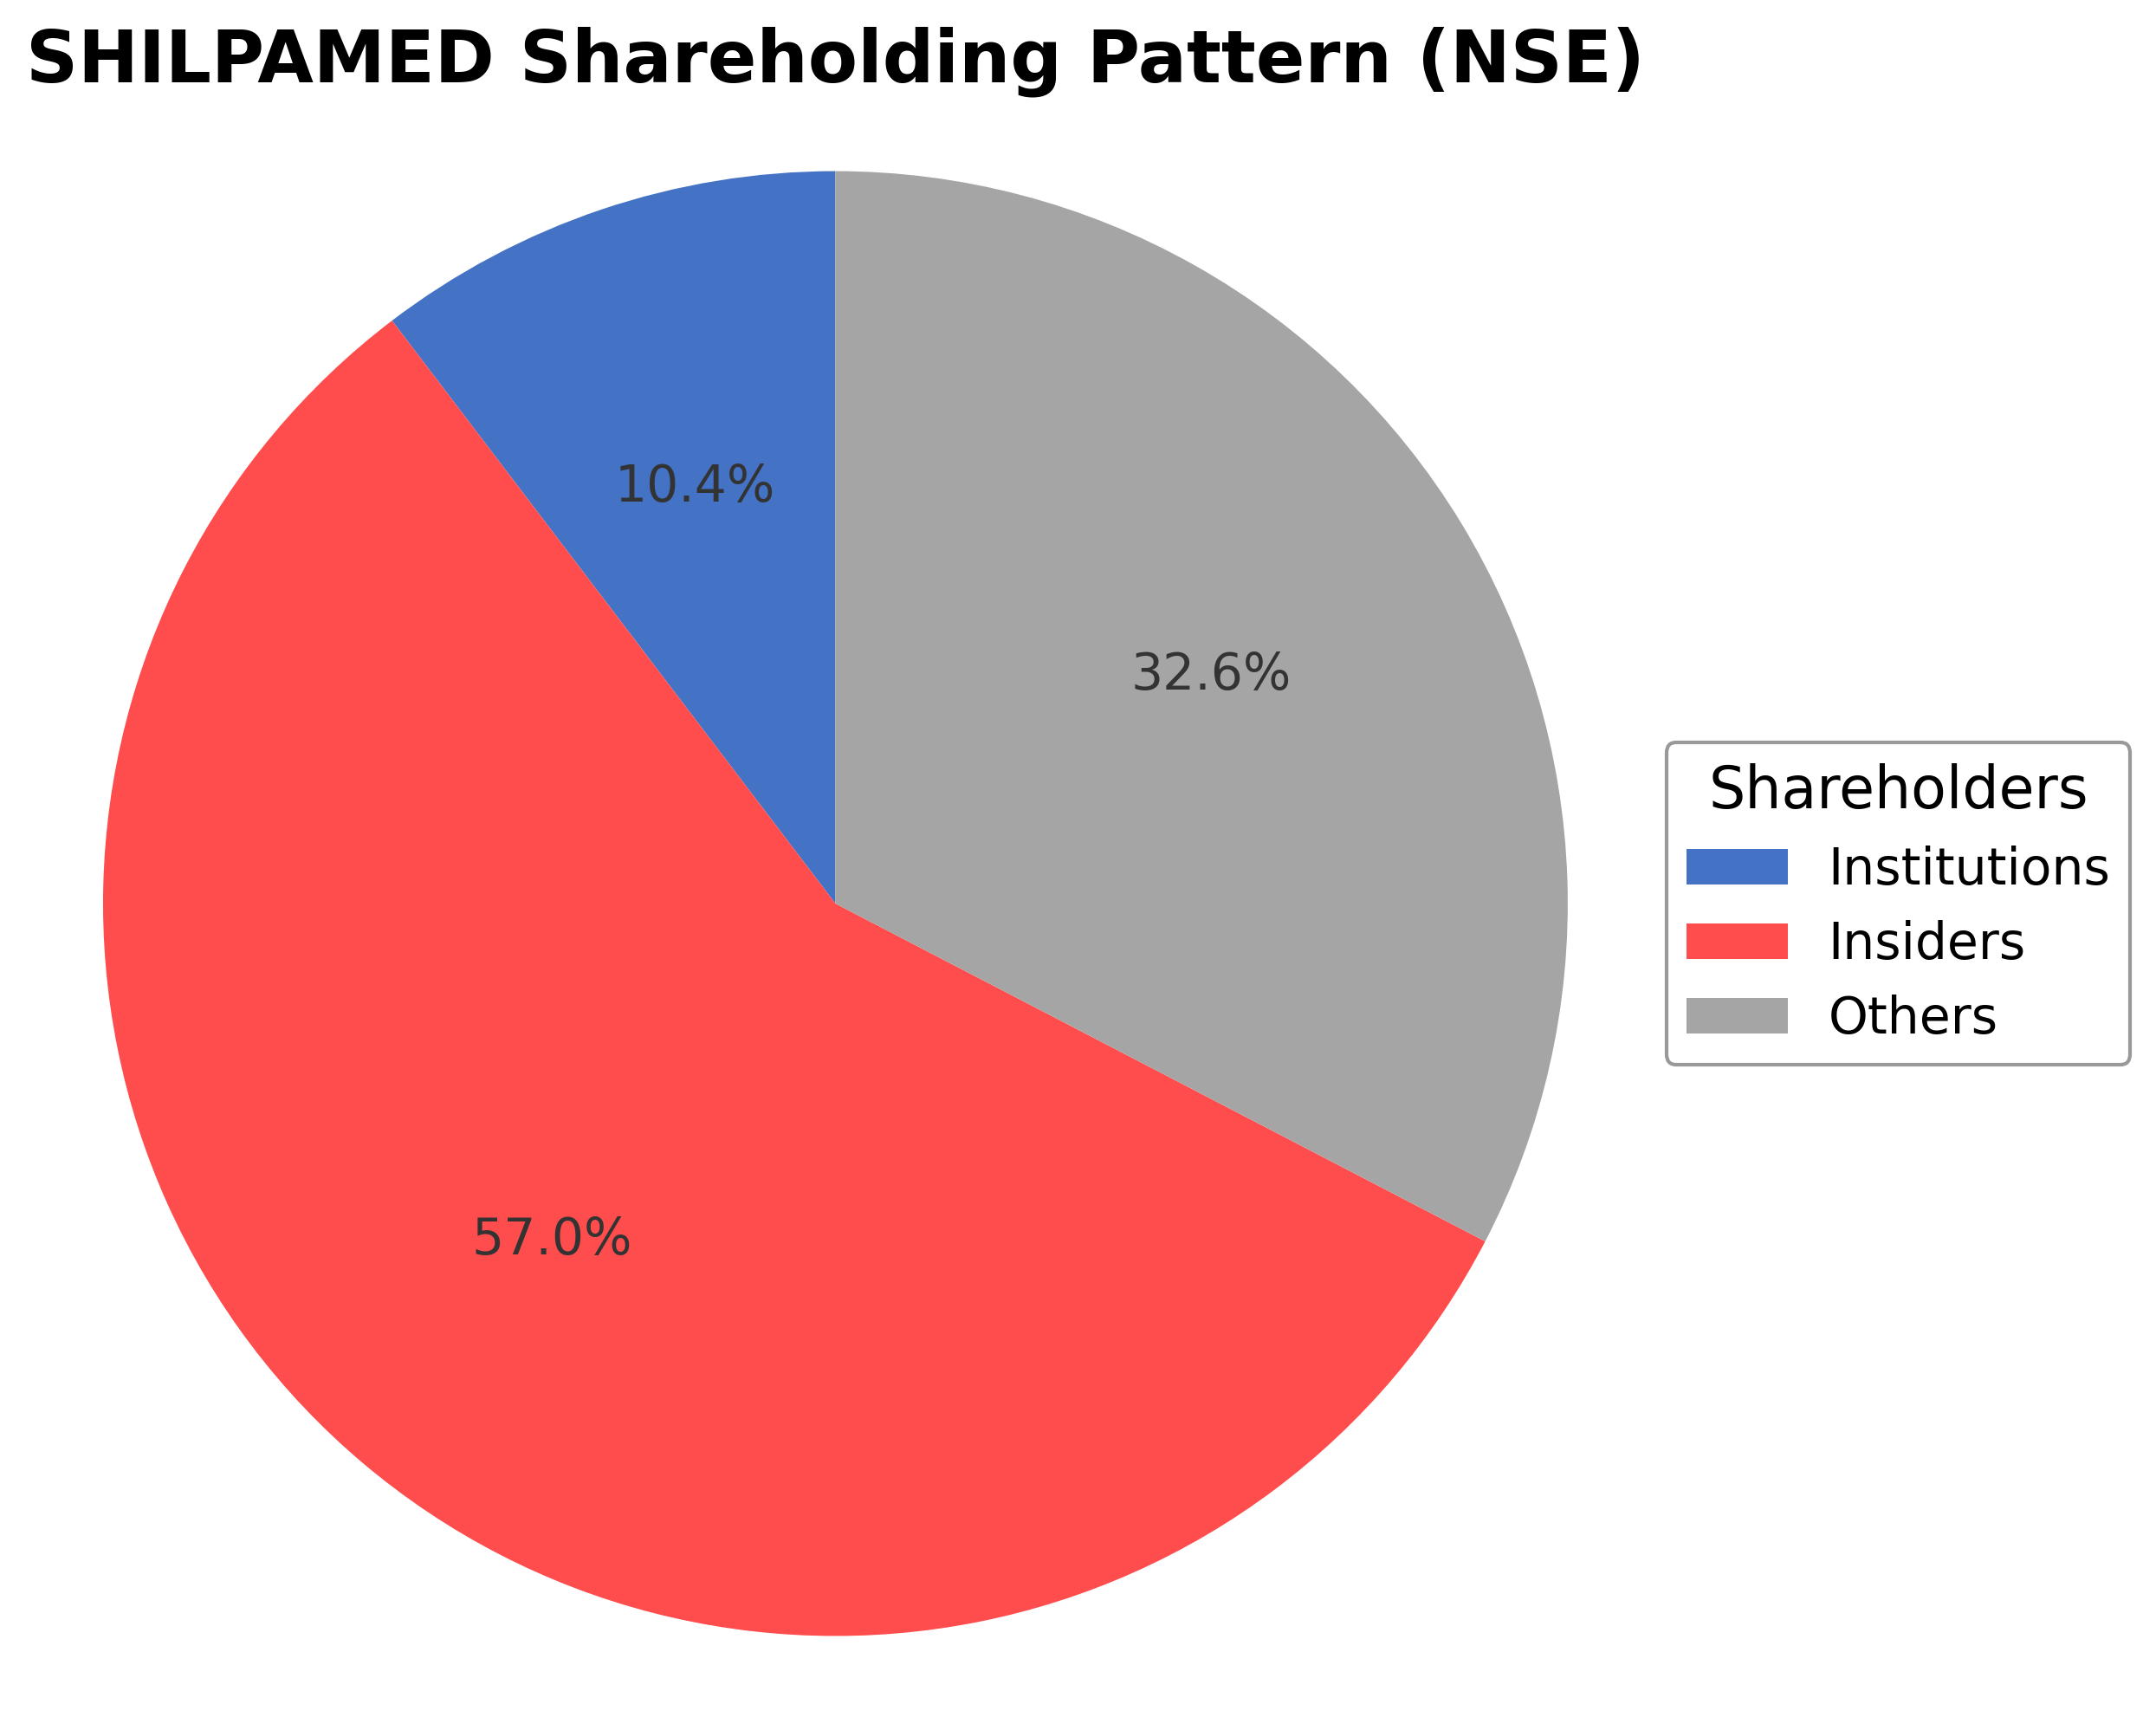
Shilpa Medicare Ltd.'s ownership structure is dominated by insiders, including executives and board members, holding approximately 57.02% of shares, reflecting strong promoter control. Institutional investors, such as mutual funds and pension funds, hold about 10.35%, indicating moderate institutional interest. The remaining 32.63% is held by public shareholders, including retail investors and employee stock plans. Over the past 12-24 months, there have been no significant changes in promoter holdings, while institutional investors have shown selective accumulation, suggesting cautious confidence. This ownership pattern supports stable governance with promoter influence, while institutional participation provides external oversight. The structure may facilitate strategic decisions aligned with long-term growth and innovation in the specialty pharmaceutical sector.
Sector and Industry Analysis
The Pharmaceuticals and Healthcare sector in India is a significant contributor to the country's economy, with a market size exceeding USD 40 billion and a projected compound annual growth rate (CAGR) of around 12-15% over the next five years. This growth is driven by rising healthcare awareness, increasing chronic disease prevalence, and expanding access to healthcare services. Key players include multinational corporations and domestic companies such as Sun Pharma, Dr. Reddy’s Laboratories, and Shilpa Medicare, which operate across formulations, generics, and specialty segments.
Industry trends reveal a strong focus on US generic drug markets, which offer substantial revenue opportunities but also present challenges like price erosion and regulatory scrutiny. Domestic formulations provide a stable revenue base amid export volatility. Competitive dynamics are shaped by high R&D intensity, patent expirations, and the need for regulatory approvals, creating significant barriers to entry. Companies with robust pipelines and efficient manufacturing capabilities tend to maintain competitive advantages in this evolving landscape.
The regulatory environment is dominated by stringent oversight from agencies such as the USFDA, which influences market access and product approvals, especially for export-oriented firms. Compliance with Good Manufacturing Practices (GMP) and timely resolution of regulatory warnings are critical to maintaining operations and investor confidence. Currency fluctuations and pricing regulations also impact profitability, requiring companies to navigate a complex framework that balances innovation, safety, and cost-effectiveness.
Note: Analysis synthesized from industry research, market reports, and regulatory filings. Information is subject to change based on market conditions.
Financial Ratios Dashboard
Illustrative Scenario Analysis
DCF Assumptions:
Method: Two-Stage EPS-Priority Model
Financials
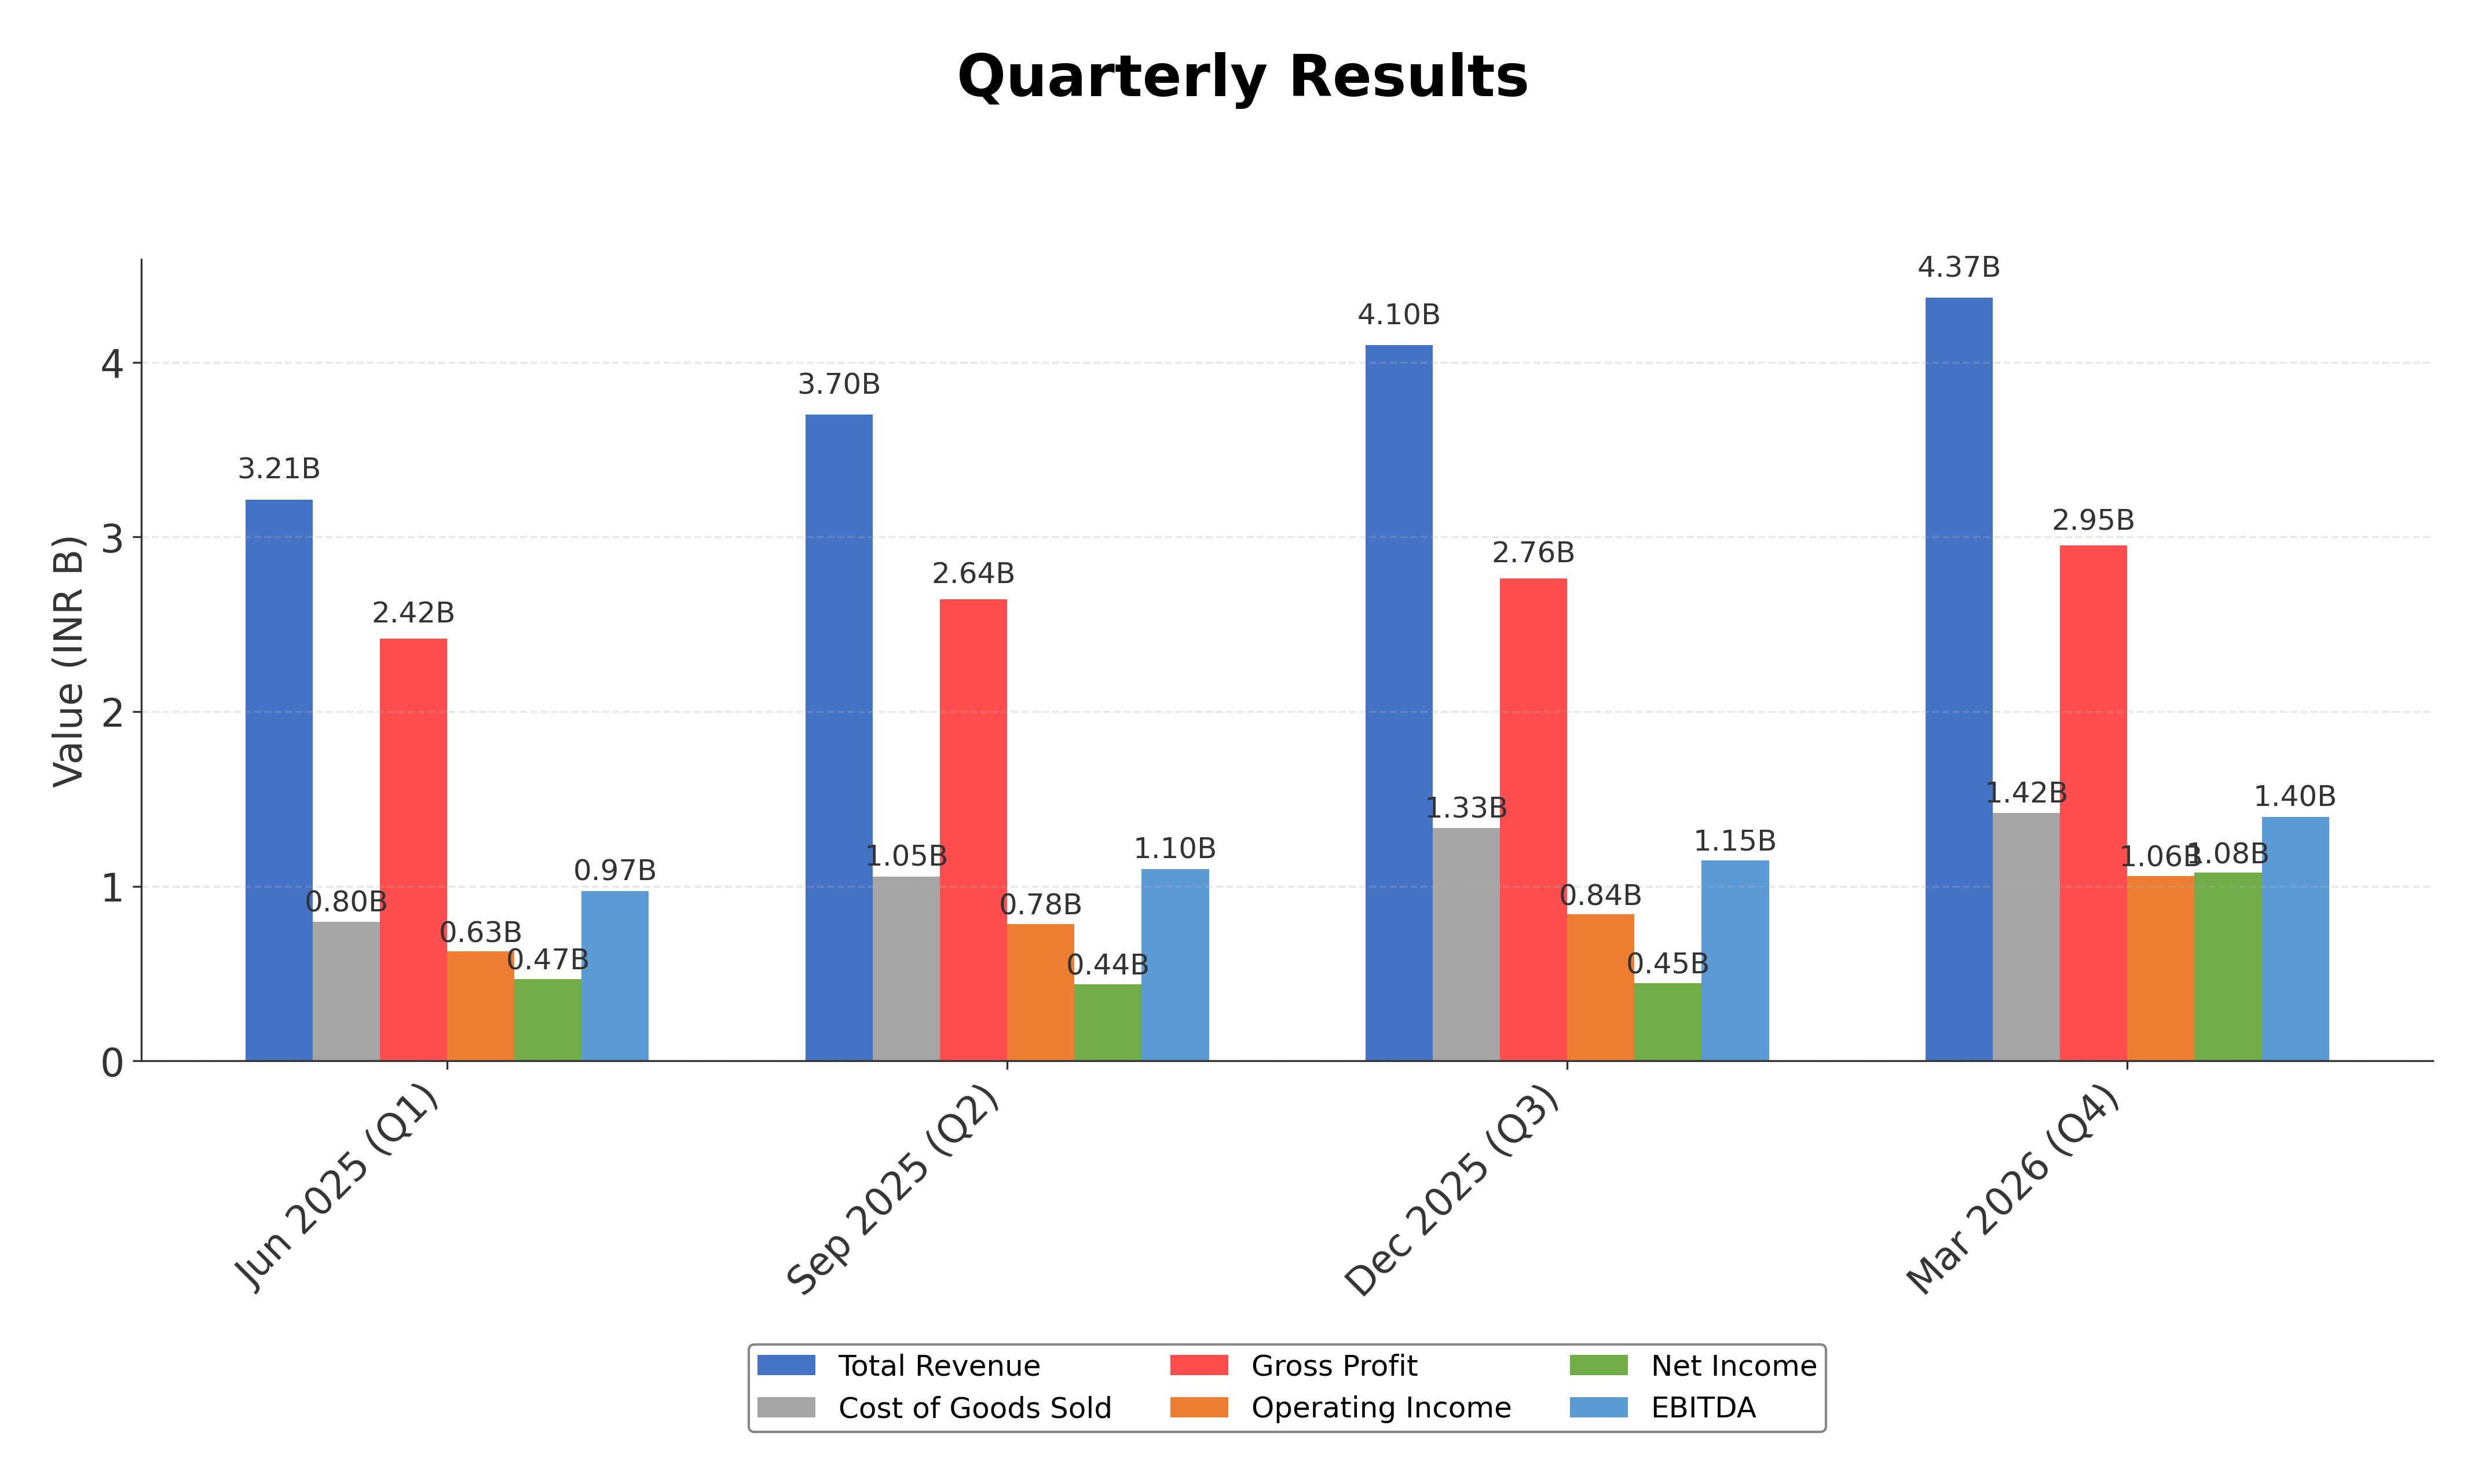
Peer Analysis
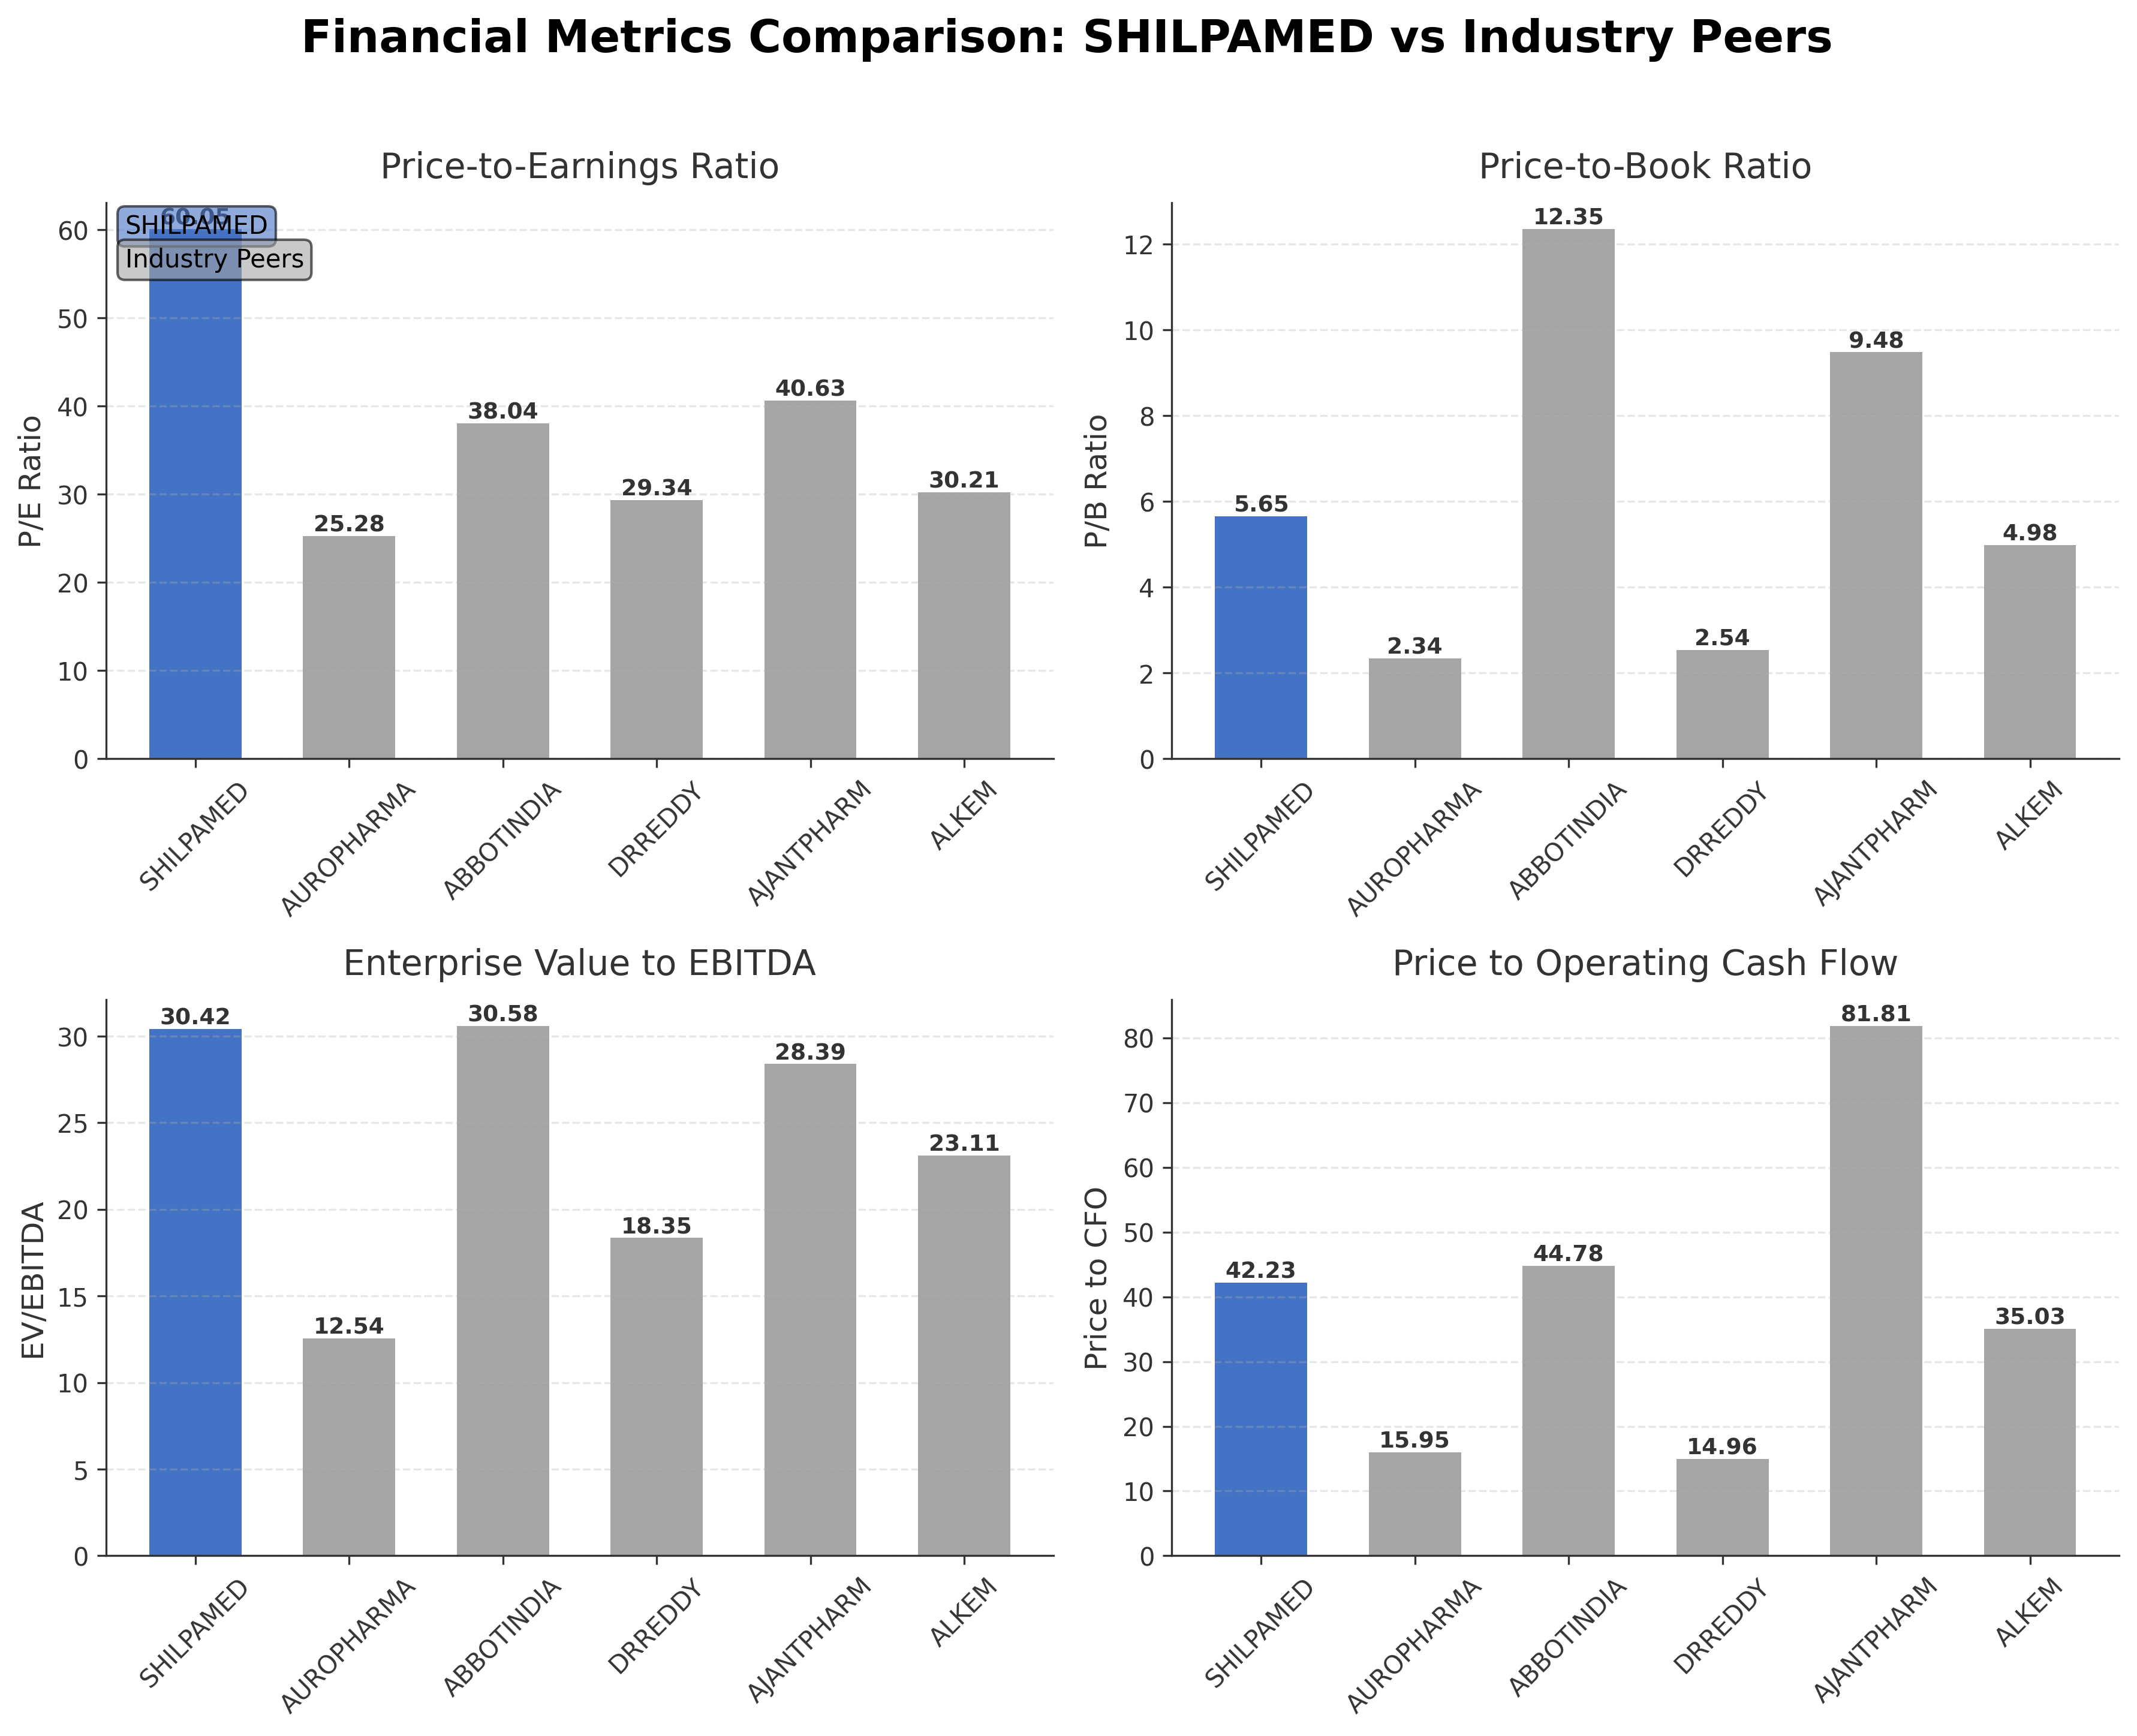
| Company Name | Market Cap | P/E Ratio | P/B Ratio | EV/EBITDA | Price to CFO |
|---|---|---|---|---|---|
| Shilpa Medicare Ltd. | ₹144.50B | 60.05 | 5.65 | 30.42 | 42.23 |
| Aurobindo Pharma Ltd. | ₹881.48B | 25.28 | 2.34 | 12.54 | 15.95 |
| Abbott India Ltd. | ₹590.73B | 38.04 | 12.35 | 30.58 | 44.78 |
| Dr. Reddy's Laboratories Ltd. | ₹959.05B | 29.34 | 2.54 | 18.35 | 14.96 |
| Ajanta Pharma Ltd. | ₹432.93B | 40.63 | 9.48 | 28.39 | 81.81 |
| Alkem Laboratories Ltd. | ₹687.68B | 30.21 | 4.98 | 23.11 | 35.03 |
Comparison Analysis: Shilpa Medicare Ltd. trades at a significantly higher P/E ratio of 60.05 compared to its peers, whose P/E ratios range from 25.28 to 40.63, indicating a premium valuation. Its price-to-book ratio of 5.65 is moderate relative to peers like Abbott India (12.35) and Ajanta Pharma (9.48), but higher than Aurobindo Pharma and Dr. Reddy's Laboratories. The enterprise value to EBITDA ratio of 30.42 is among the highest, reflecting elevated expectations on earnings. Return on equity at 9.82% is lower than several peers, notably Abbott India (34.46%) and Ajanta Pharma (25.39%), suggesting comparatively modest profitability. Overall, Shilpa Medicare shows strong market capitalization but trades at a premium with relatively moderate profitability metrics compared to regional industry competitors.
Financial Metrics Comparison with Peers
Financial Statements
Comprehensive financial data including income, balance sheet, and cash flow metrics
Income Statement
| fiscal_date | 2026-03-31 | 2025-03-31 | 2024-03-31 | 2023-03-31 | 2022-03-31 |
|---|---|---|---|---|---|
| Sales | 15.39B | 12.85B | 11.51B | 10.43B | 11.40B |
| Cost Of Goods | 4.60B | 4.10B | 4.08B | 4.17B | 3.84B |
| Gross Profit | 10.78B | 8.74B | 7.43B | 6.27B | 7.56B |
| Operating Expense Other Operating Expenses | 3.09B | 1.68B | 1.52B | 1.61B | 1.62B |
| Operating Income | 3.76B | 2.00B | 1.34B | -45.97M | 1.26B |
| Non Operating Interest Expense | 1.20B | 587.65M | 837.29M | 562.55M | 409.34M |
| Pretax Income | 2.95B | 1.22B | 543.41M | -382.79M | 1.02B |
| Income Tax | 519.90M | 440.36M | 223.85M | -73.07M | 416.83M |
| Net Income | 2.43B | 782.97M | 319.55M | -309.73M | 605.82M |
| Eps Basic | 12.44 | 4.02 | 3.67 | -3.75 | 7.26 |
| Eps Diluted | 12.44 | 4.02 | 3.67 | -3.75 | 7.26 |
| Basic Shares Outstanding | 195.60M | 194.86M | 86.80M | 86.80M | 83.54M |
| Diluted Shares Outstanding | 195.60M | 194.86M | 86.80M | 86.80M | 83.54M |
| Ebit | 4.15B | 1.81B | 1.38B | 179.75M | 1.43B |
| Ebitda | 5.23B | 3.26B | 2.44B | 1.15B | 2.21B |
| Net Income Continuous Operations | 2.95B | 1.22B | 543.41M | -382.80M | 1.02B |
| Minority Interests | 0.00 | -38.00K | -809.00K | -15.60M | 802.00K |
| Preferred Stock Dividends | 0.00 | 0.00 | 0.00 | 0.00 | 0.00 |
| Operating Expense Research And Development | N/A | 483.73M | 309.56M | 491.02M | 550.61M |
| Operating Expense Selling General And Administrative | N/A | 396.25M | 247.03M | 321.52M | 608.86M |
| Non Operating Interest Income | N/A | 80.31M | 13.84M | 17.61M | 20.67M |
Data provided by Twelve Data
Balance Sheet
| fiscal_date | 2026-03-31 | 2025-03-31 | 2024-03-31 | 2023-03-31 | 2022-03-31 |
|---|---|---|---|---|---|
| Cash And Cash Equivalents | 412.60M | 259.68M | 302.26M | 213.18M | 338.29M |
| Accounts Receivable | 5.19B | 4.41B | 3.92B | 3.24B | 3.86B |
| Total Assets | 37.06B | 33.11B | 30.93B | 29.04B | 28.75B |
| Total Liabilities | 11.14B | 9.56B | 12.93B | 11.30B | 10.64B |
| Long Term Debt | 1.85B | 2.33B | 5.61B | 2.91B | 3.55B |
| Shareholders Equity | 25.91B | 23.55B | 18.00B | 17.74B | 18.11B |
Data provided by Twelve Data
Cash Flow Statement
| fiscal_date | 2026-03-31 | 2025-03-31 | 2024-03-31 | 2023-03-31 | 2022-03-31 |
|---|---|---|---|---|---|
| Operating Activities Net Income | 2.95B | 1.22B | 543.41M | -382.80M | 1.02B |
| Operating Activities Other Non Cash Items | 451.80M | 577.43M | 889.22M | 560.73M | 376.88M |
| Operating Activities Accounts Receivable | -665.20M | -554.48M | -758.99M | 650.64M | -1.68B |
| Operating Activities Other Assets Liabilities | -33.20M | -127.83M | -420.50M | 400.30M | 125.55M |
| Operating Activities Operating Cash Flow | 3.42B | 1.12B | 253.14M | 1.23B | -157.64M |
| Investing Activities Net Acquisitions | 308.10M | 89.92M | 44.94M | -89.30M | 284.13M |
| Investing Activities Other Investing Activity | 132.50M | 275.05M | 120.98M | 12.09M | 316.36M |
| Investing Activities Investing Cash Flow | 440.60M | -2.07B | -1.68B | -2.34B | -2.71B |
| Financing Activities Short Term Debt Issuance | 1.05B | -538.72M | 163.71M | 1.41B | -415.57M |
| Financing Activities Common Stock Issuance | 0.00 | 4.89B | N/A | 0.00 | 2.97B |
| Financing Activities Common Dividends | -97.80M | N/A | N/A | -95.48M | -89.68M |
| Financing Activities Financing Cash Flow | 949.80M | 4.35B | 163.71M | 1.32B | 2.46B |
| End Cash Position | 451.80M | 285.24M | 304.25M | 190.71M | 253.39M |
| Free Cash Flow | -284.50M | -1.11B | -492.22M | -467.44M | -2.27B |
| Investing Activities Capital Expenditures | N/A | -2.44B | -1.85B | -2.27B | -3.31B |
| Financing Activities Other Financing Charges | N/A | 2.00K | -1.00K | 1.00K | -1.00K |
Data provided by Twelve Data
Technical Analysis
Key Insights
- The stock is currently in a strong uptrend, trading near its 52-week high of ₹785.80, with recent price action showing sustained upward momentum.
- Key support levels are identified around ₹577 (50-day moving average) and ₹410 (200-day moving average), while resistance is near the 52-week high of ₹785.80.
- The price is trading above the 10-day, 50-day, and 200-day moving averages, indicating bullish momentum across short, medium, and long-term timeframes.
- Momentum indicators show a Relative Strength Index (RSI) in the upper range, suggesting strong buying interest; MACD is positive with a bullish crossover; Stochastic oscillator confirms upward momentum.
- Multi-timeframe analysis (daily, weekly, monthly) consistently reflects bullish trends with no significant reversal signals observed.
- Potential market scenarios include continuation of the uptrend supported by strong earnings momentum, with possible consolidation near resistance levels before further advances.
Trending News
1. Headline: Shilpa Medicare Q1 Results: Earnings call recording uploaded
Summary: Shilpa Medicare Limited has published the recording of its Q1FY27 earnings call held on August 5, 2026. The audio is available on the company website for investors to review management's discussion on quarterly performance. The filing was submitted to BSE and NSE by Company Secretary Ritu Tiwary.
Sentiment: neutral
2. Headline: Shilpa Medicare Shares Jump 16% on Record Q1 Results - Equitypandit
Summary: Shilpa Medicare shares hit a record high of Rs 753.85 on the NSE after the company posted record Q1 revenue and profit.
Sentiment: positive
3. Headline: Shilpa Medicare Share Price Gains Over 13% After Q1 FY27 Earnings Results: Total Income Up 43% YoY
Summary: Shilpa Medicare Limited's financial results for the June 2026 quarter show a 43% YoY increase in total income to ₹468.91 crore and a 115.2% YoY rise in net profit to ₹100.88 crore. However, net profit decreased by 6.4% QoQ from the March 2026 quarter. Track the stock market in Hindi. Visit Angel One News ...
Sentiment: positive
4. Headline: Shilpa Medicare soars after Q1 PAT climbs over two-fold to Rs 101 cr | Capital Market News - Business Standard
Summary: Shlipa Medicare zoomed 11.59% to Rs 723.55 after the pharmaceutical company's consolidated net profit jumped 115.19% year-on-year to Rs 100.88 crore in Q1 FY27 from Rs 46.88 crore in the corresponding quarter last year.
Sentiment: positive
5. Headline: Shilpa Medicare Q1 Results: Highest quarterly revenue and EBITDA on record sends stock 17% higher - CNBC TV18
Summary: Shares of Shilpa Medicare are trading 11.6% higher after the results announcement at ₹716.75. The stock is up 127% for the year so far. Also Read: Tips Music approves ₹44.5 crore share buyback; Stock cools from day's high ... HomeMarket NewsShilpa Medicare Q1 Results: Highest quarterly ...
Sentiment: positive
Powered by Brave
Recent Updates
News Summary
As of August 7, 2026. Shilpa Medicare Ltd. reported record quarterly financial results for Q1 FY27, with revenue reaching ₹469 crore, a 43% year-on-year increase, and EBITDA rising 42% to ₹139 crore, reflecting strong operational performance. Net profit more than doubled to ₹101 crore, up approximately 115% year-on-year, driven by growth in both the API and formulations segments. The formulations business showed explosive growth of over 100% year-on-year, supported by gains in the US, European, and domestic markets. The company’s EBITDA margin expanded to 30%, while gross margins declined slightly to 71%. A deferred tax liability reversal led to a negative tax rate in the quarter, with normalization expected in subsequent periods. Leadership changes included the appointment of Dr. Uday N Harle as CEO of Shilpa Biologicals. The company also highlighted ongoing pipeline developments and strategic partnerships, positioning for consistent growth and improved return on capital employed.
News Sentiment
The overall sentiment from recent updates is predominantly positive, driven by Shilpa Medicare's record-breaking quarterly revenue and profit growth, strong EBITDA margin expansion, and robust market performance across multiple geographies. Positive investor response is reflected in significant stock price appreciation and trading volume increases. Neutral tones arise from leadership changes and regulatory disclosures, which are routine but important for corporate governance. The combination of operational excellence and strategic initiatives supports a constructive outlook, tempered by typical sector risks such as regulatory scrutiny and competitive pressures.
Source List
- https://scanx.trade/stock-market-news/companies/shilpa-medicare-q1-results-earnings-call-scheduled-for-aug-5/47447175
- https://economictimes.indiatimes.com/shilpa-medicare-ltd/stocksupdate/companyid-7974.cms
- https://www.alphaspread.com/security/nse/shilpamed/investor-relations
- https://www.cnbctv18.com/market/shilpa-medicare-q1-results-record-high-revenue-ebitda-api-formulations-share-price-19962338.htm
- https://www.angelone.in/news/stocks/shilpa-medicare-share-price-gains-over-13-after-q1-fy27-earnings-results-total-income-up-43-yoy
Analytical Overview
Analysis Summary
Shilpa Medicare’s valuation metrics, including a trailing P/E of 60.05 and forward P/E of 40.48, are significantly higher than the industry average of approximately 60.05, indicating a premium pricing relative to earnings expectations. The company exhibits a strong growth trajectory, with quarterly revenue growth of 31.5% and a 115% year-on-year increase in net profit for Q1 FY27, supported by robust cash flow from operations of ₹342.18 crore, though free cash flow remains negative due to investment activities. Financial health is moderate, with a debt-to-equity ratio of 0.25 and a current ratio of 1.31, suggesting manageable leverage and adequate liquidity. Sector-specific opportunities include expanding specialty APIs and formulations markets, while challenges include regulatory compliance and competitive pressures in global pharmaceutical markets. Considering India-specific factors, the company benefits from a growing domestic pharmaceutical market and export potential, balanced against regulatory scrutiny and currency fluctuation risks.
Overall Business and Market Assessment
Supporting Factors: strong revenue and profit growth driven by specialty APIs and formulations, a solid operational cash flow base, and strategic pipeline advancements
Risk Factors: the high valuation multiples relative to peers, potential regulatory hurdles, and the negative free cash flow indicating ongoing capital expenditures
SWOT Analysis
Strengths
- Strong revenue growth of 31.5% quarter-over-quarter and 43% year-on-year.
- Robust gross margin of 67.5% and operating margin of 20.4%.
- Established presence in specialty APIs and complex generics with a diversified product portfolio.
- Significant market capitalization of ₹144.50 billion with strategic international market penetration.
Weaknesses
- High trailing P/E ratio of 60.05 indicating premium valuation.
- Negative free cash flow of ₹-142 crore reflecting ongoing capital investments.
- Return on equity of 9.82% is moderate compared to industry leaders.
- Relatively low dividend yield of 0.07% may limit income appeal.
Opportunities
- Expanding formulations business with over 100% year-on-year growth.
- Pipeline developments including ADC biosimilars and biologics partnerships.
- Growing domestic pharmaceutical market and export potential.
- Strategic alliances with companies like Orion Corporation and Gate2Brain.
Threats
- Regulatory challenges in domestic and international markets.
- Intense competition from larger pharmaceutical companies.
- Macroeconomic factors impacting export demand and currency fluctuations.
- Potential delays in product approvals and pipeline commercialization.
Company Description
Shilpa Medicare Ltd. is a pharmaceutical company focused on formulating, developing, and manufacturing active pharmaceutical ingredients (APIs), formulations, and intermediates. The primary function of Shilpa Medicare is to contribute to healthcare needs by providing high-quality and affordable medication across various therapeutic segments. It plays a critical role in the pharmaceutical industry, directly impacting sectors such as oncology, anti-infectives, and anti-inflammatory treatments. The company's comprehensive range of products serves both the domestic market in India and international markets, demonstrating a robust export-oriented strategy. With a commitment to innovation and adhering to global quality standards, Shilpa Medicare Ltd. has established a significant presence in regulated markets. It is acknowledged for its research and development capabilities, particularly in the field of complex generics and niche APIs, underscoring its importance in the pharmaceutical supply chain. Headquartered in Raichur, Karnataka, Shilpa Medicare continues to enhance its portfolio through strategic alliances and investments in R&D, underscoring its critical role in the global pharmaceuticals landscape.