


Sheela Foam Ltd (SFL)
Stock Analysis Report
Stock Journey
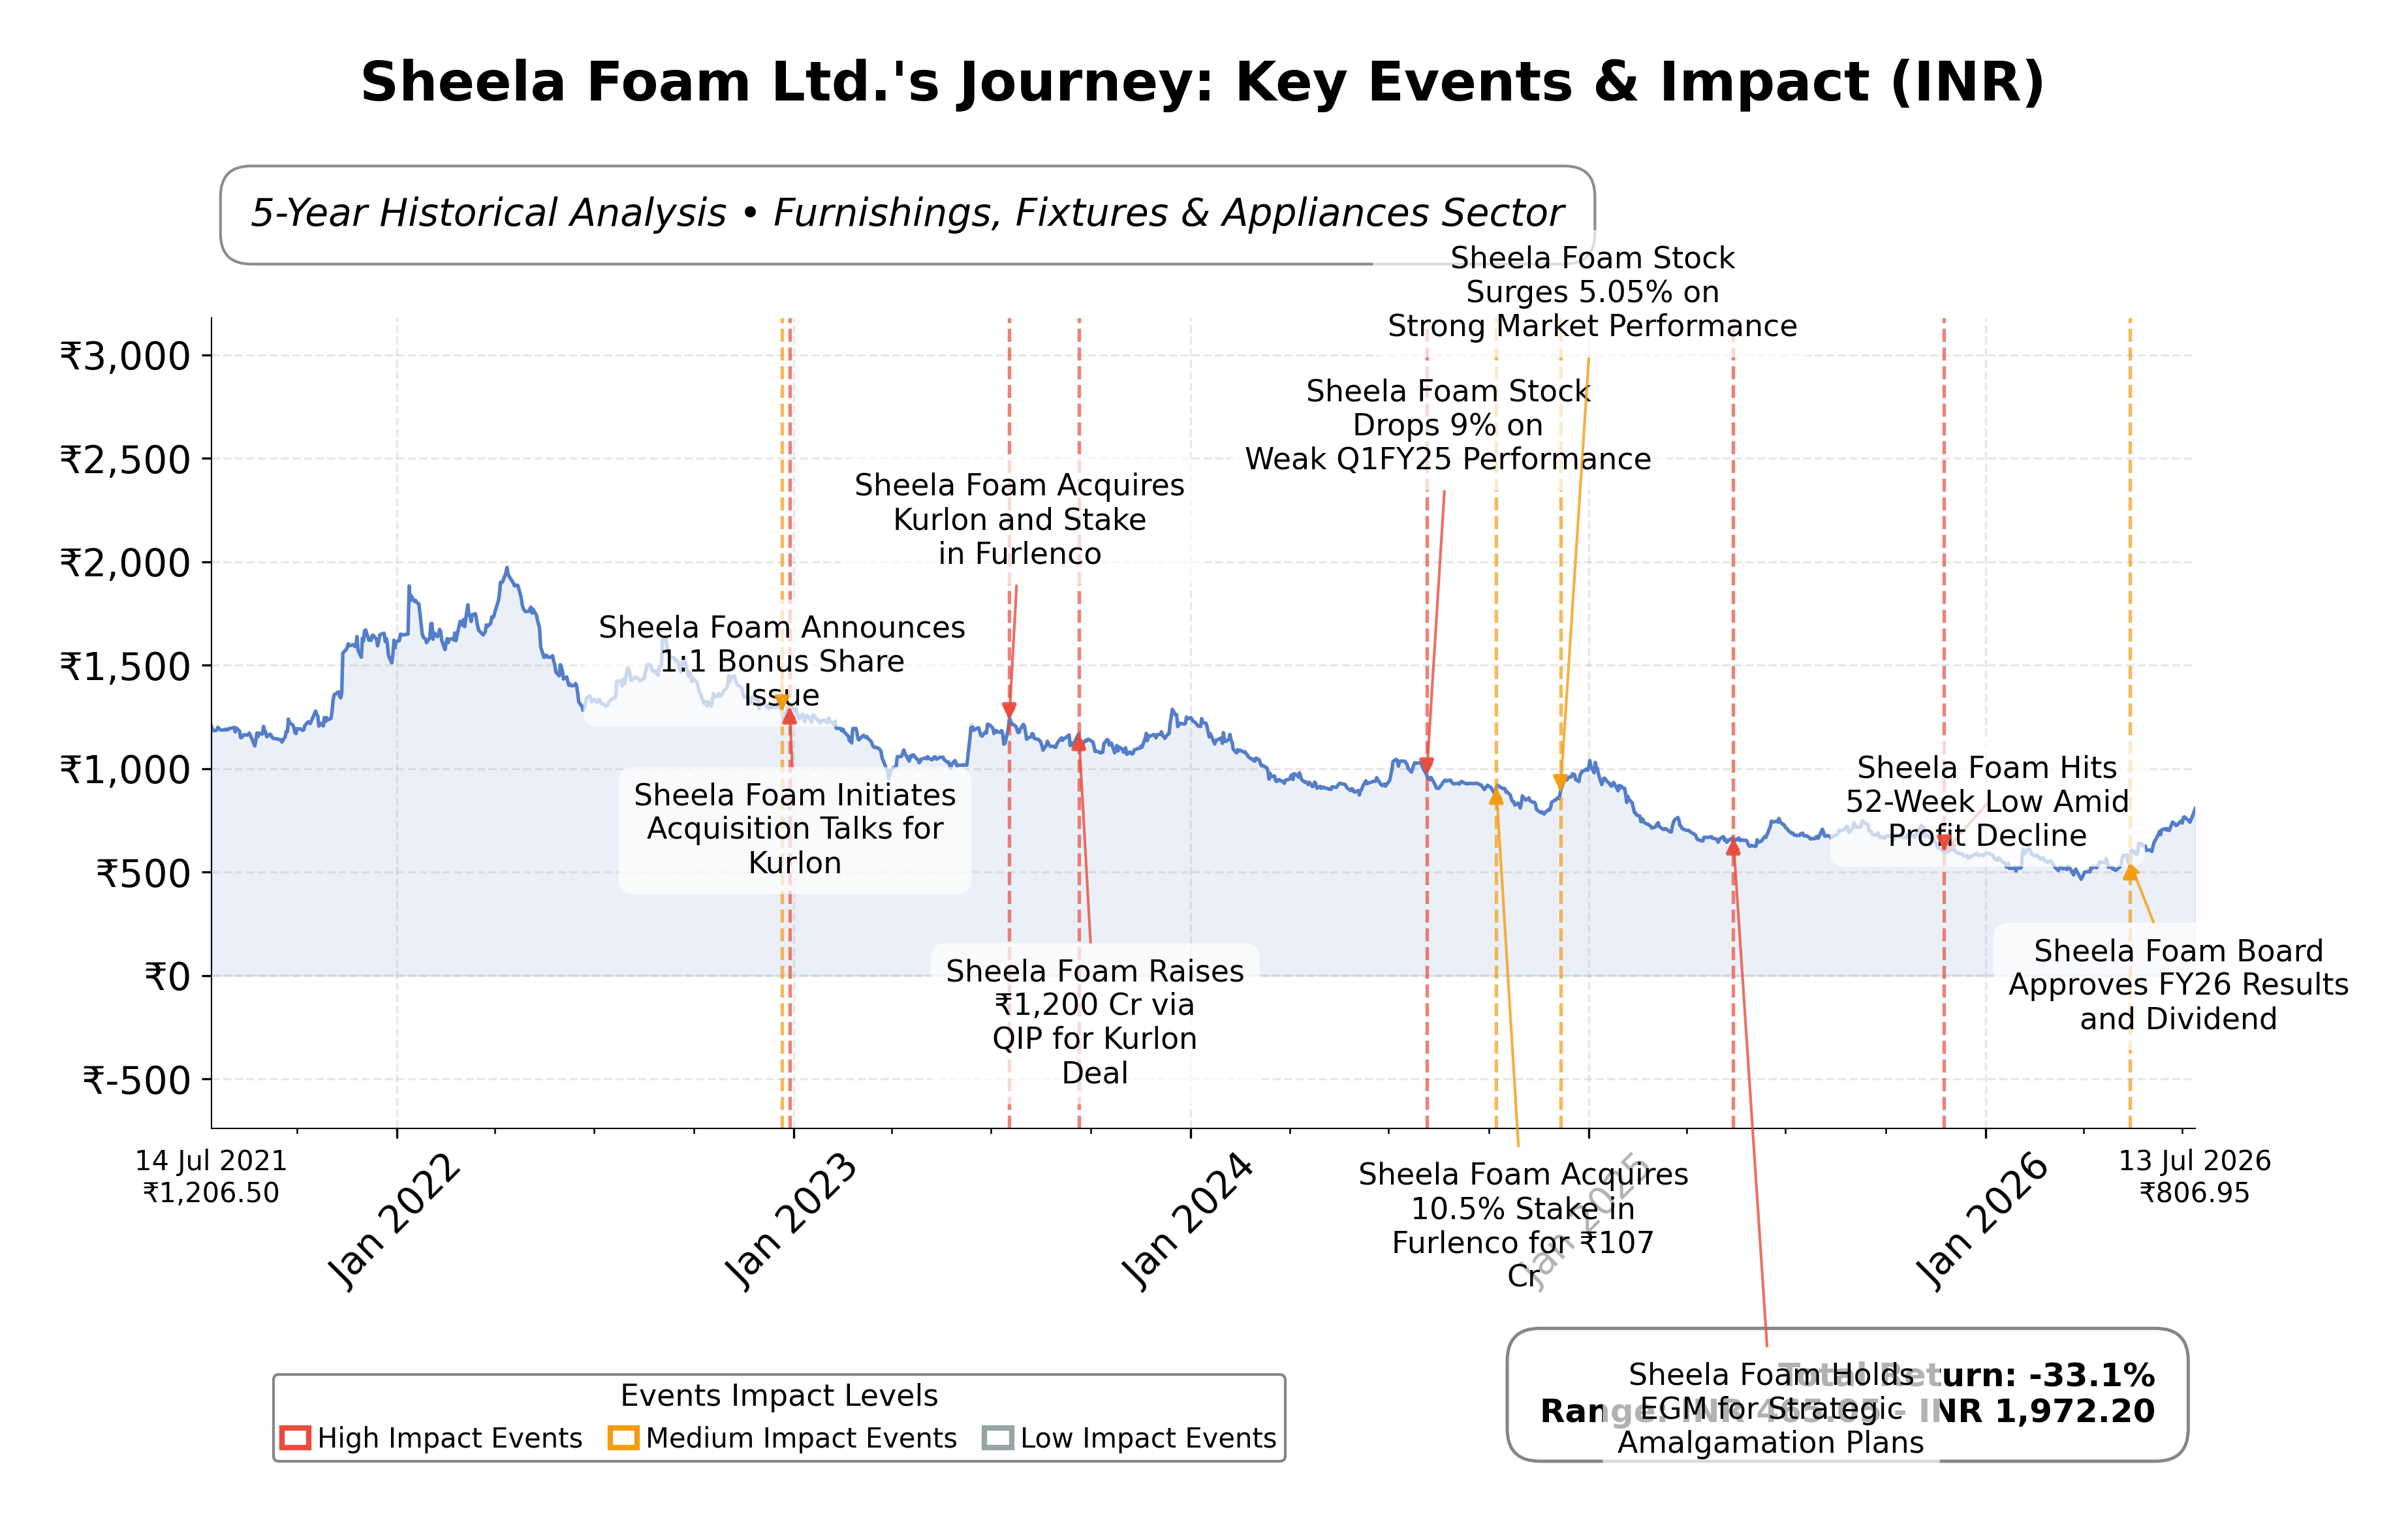
Key Positives and Key Risks
Pros
- Revenue growth of 23.6% indicates strong top-line expansion supporting business momentum.
- Operating cash flow of INR 409.32 crores and free cash flow of INR 187.16 crores demonstrate solid cash generation.
- Debt-to-equity ratio of 0.28 reflects manageable leverage and financial stability.
Cons
- Trailing P/E ratio of 55.19 suggests the stock is priced at a premium relative to earnings.
- Current ratio of 0.763 signals potential short-term liquidity constraints.
- Net profit margin of 4.18% and ROE of 5.12% are modest compared to some industry peers.
Disclosure: This information is for general awareness and does not constitute investment advice
Report Summary
Sheela Foam Ltd. (SFL) is a prominent Indian company specializing in the production and distribution of polyurethane foam-based products, primarily serving the comfort and technical foam industry. Listed on the NSE in the Consumer Cyclical sector, the company is well-known for its Sleepwell brand, offering mattresses, pillows, and cushioning products. Sheela Foam also operates internationally, with significant presence in Australia and Spain, catering to both consumer and business-to-business markets. Its diversified product portfolio and extensive distribution network position it as a key player in the furnishings, fixtures, and appliances industry.
Financially, Sheela Foam reported trailing twelve months (TTM) revenue of approximately INR 3,820.84 crores with a gross margin of 40.56%, indicating efficient production and pricing strategies. The operating margin stands at 9.86%, while the net profit margin is 4.18%, reflecting moderate profitability. Return on equity (ROE) and return on assets (ROA) are 5.12% and 2.83%, respectively, suggesting modest returns relative to equity and asset base. The company’s return on invested capital (ROIC) is not explicitly stated but can be inferred as moderate given the operating metrics and capital structure.
Valuation metrics show a trailing price-to-earnings (P/E) ratio of 55.19 and a forward P/E of 28.92, indicating the market prices the stock at a premium relative to current earnings but with expectations of earnings growth. The price-to-book (P/B) ratio is 2.71, and the enterprise value to EBITDA (EV/EBITDA) ratio is 26.29, both suggesting a relatively high valuation compared to some peers. The market capitalization is approximately INR 88.34 billion, with the stock trading near its 52-week high of INR 828.95, currently priced at INR 805, reflecting a 2.9% downside risk from the high.
Sheela Foam’s strengths include a strong brand presence, robust cash flow with operating cash flow of INR 409.32 crores and free cash flow of INR 187.16 crores, and a relatively low debt-to-equity ratio of 0.28, indicating manageable leverage. Key risks involve competitive pressures within the consumer goods sector, regulatory tax compliance related to dividend payouts, and macroeconomic factors impacting consumer discretionary spending. Recent strategic actions include dividend declarations and investor engagement initiatives, with no major acquisitions or leadership changes reported.
Technically, the stock exhibits a bullish momentum with price trading above its 50-day and 200-day moving averages, supported by positive momentum indicators. However, the current ratio below 1 (0.763) signals liquidity considerations. The overall data suggests a market environment where accumulation and cautious monitoring may be appropriate, reflecting a balance between valuation premiums and growth prospects without explicit directional bias.
Company and Industry Overview
Company Basics
Price Performance
Company Size
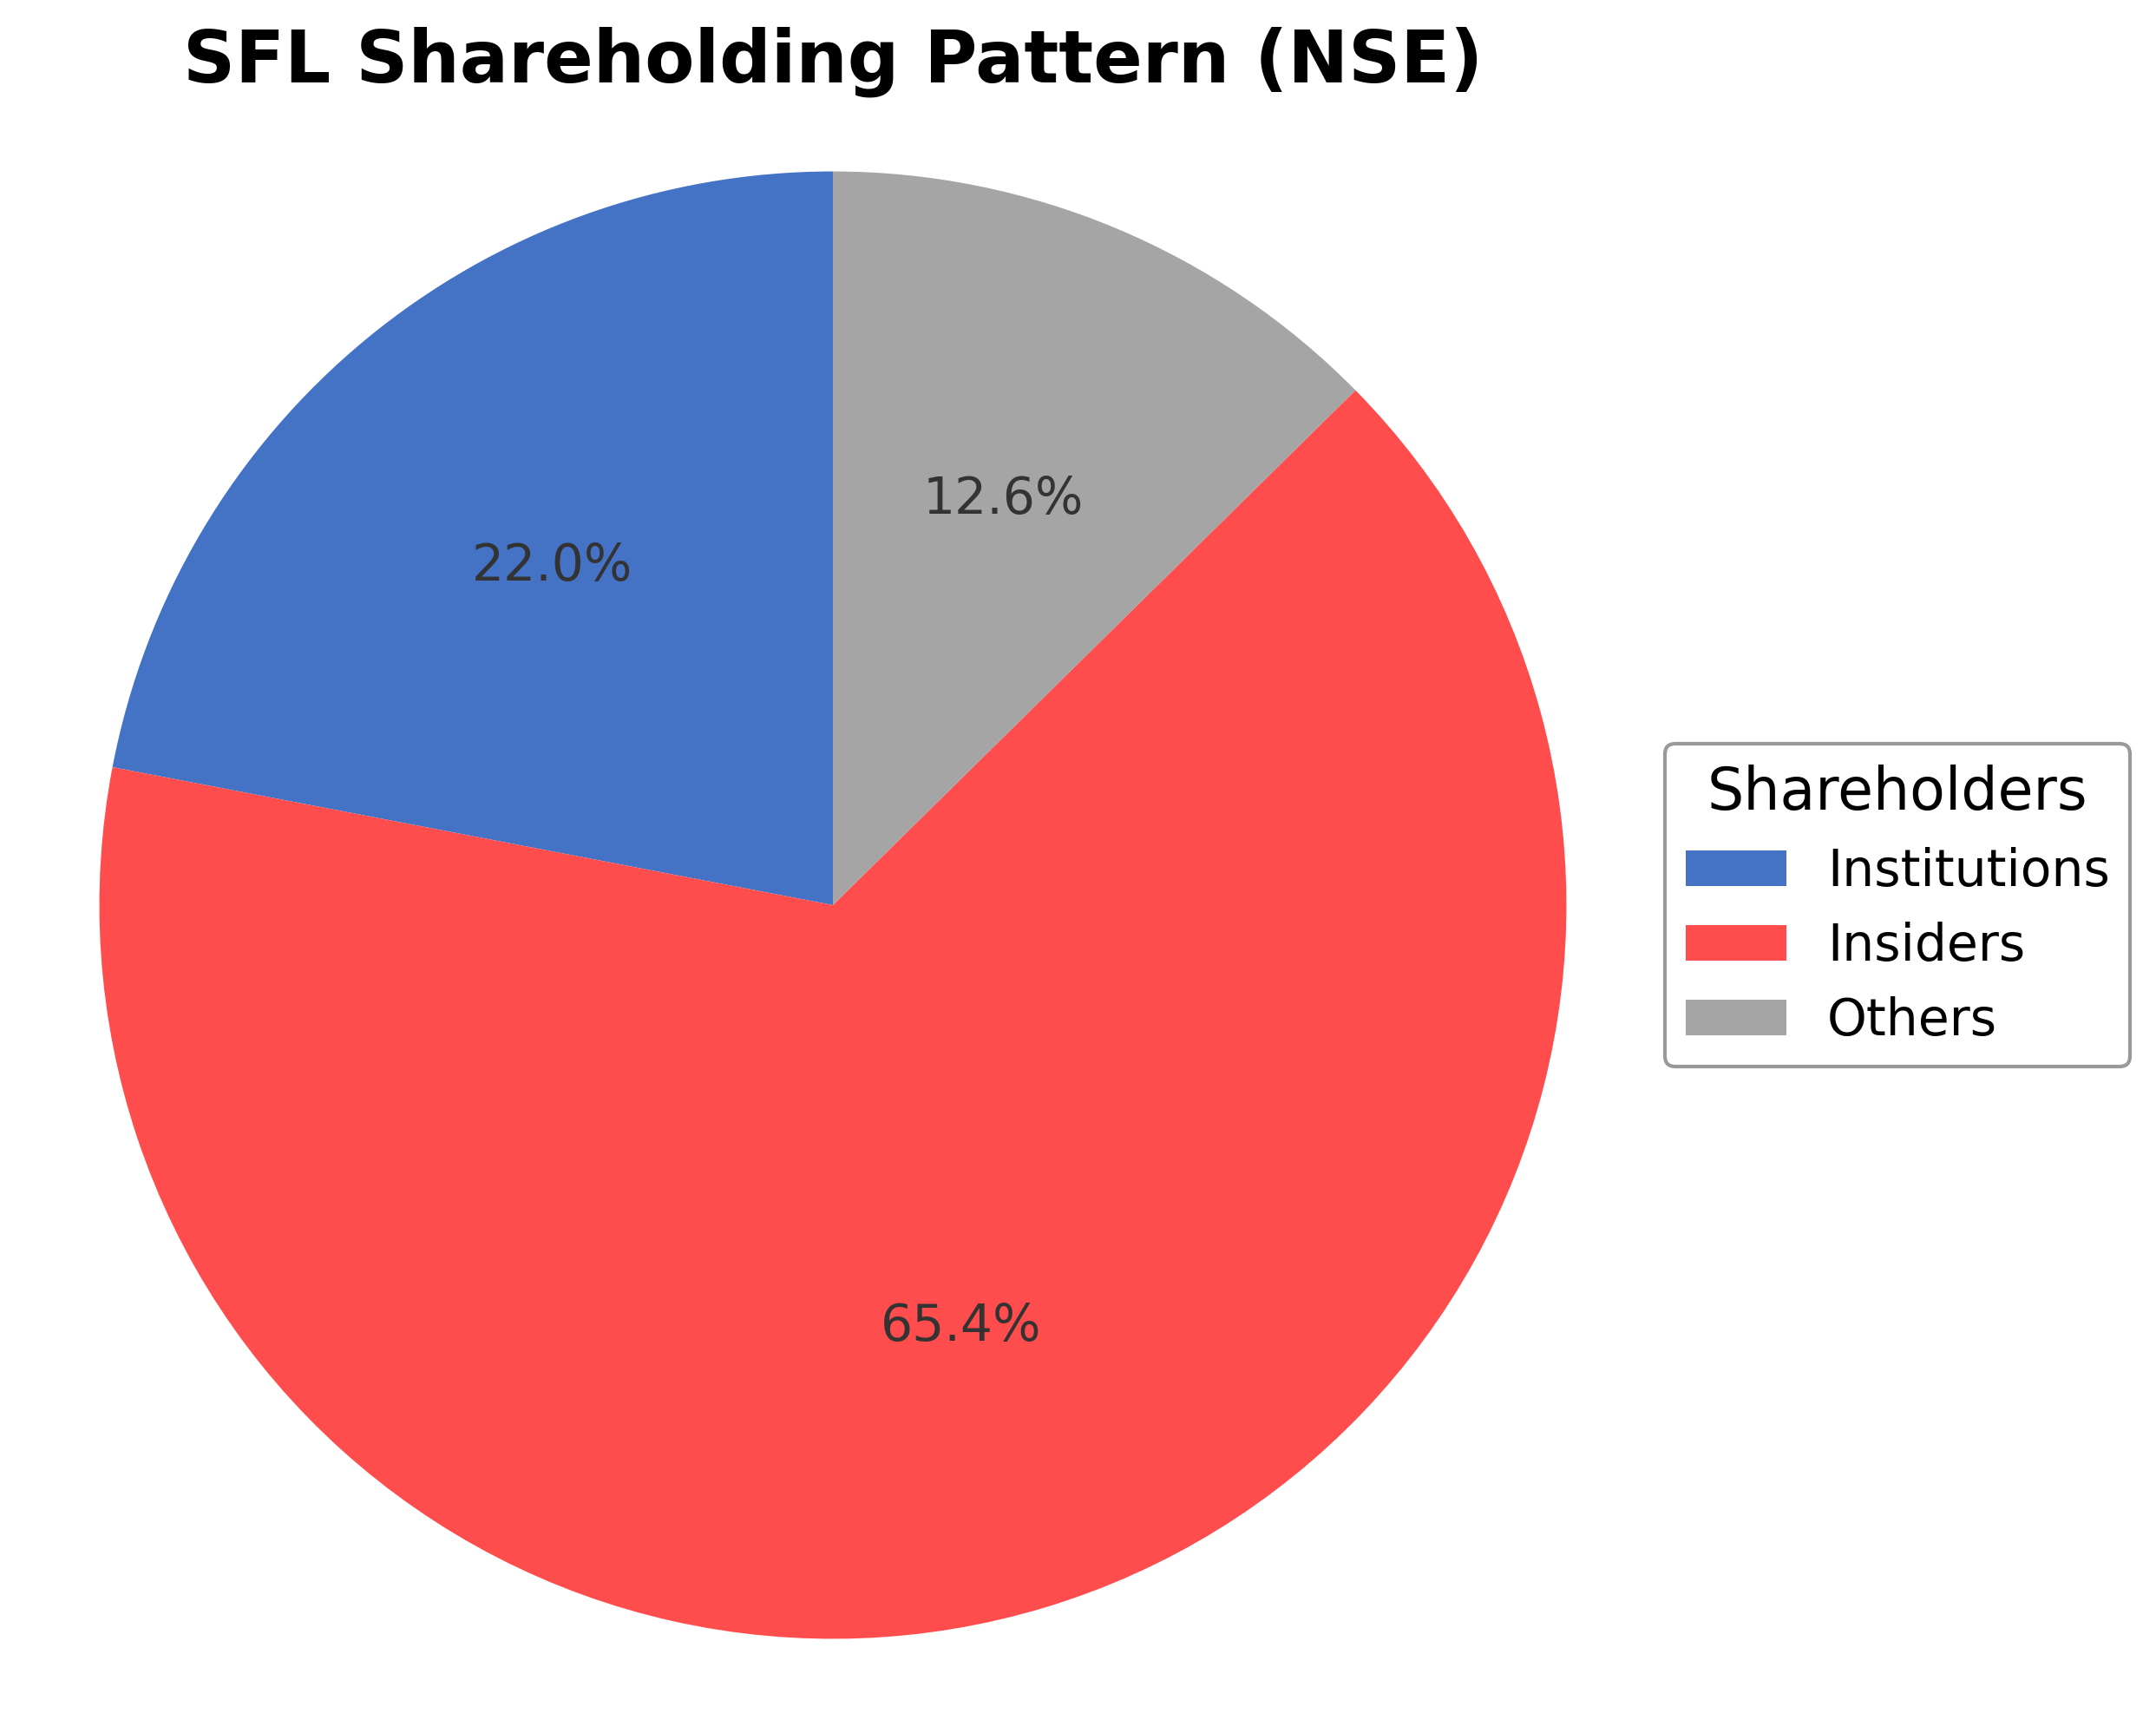
Shareholding Pattern
Sector and Industry Analysis
The Mattresses/PU Foam sector in India is witnessing steady growth driven by rising domestic consumption, government infrastructure spending, and expanding export opportunities. The market is characterized by a mix of established players and emerging firms, with Sheela Foam Ltd. being a prominent participant. The sector benefits from increasing urbanization and consumer preference for premium sleep solutions, contributing to a positive growth trajectory.
Industry trends highlight a shift towards higher-margin product segments and improved revenue mix, supported by easing input cost pressures. Competitive dynamics are influenced by institutional investor interest and sectoral rotation, with mid and small-cap companies experiencing volatility but also momentum. Barriers to entry include capital intensity, raw material sourcing, and brand recognition, which favor established companies scaling operations efficiently.
Regulatory factors impacting the sector include commodity price volatility and evolving compliance requirements, which can affect margins and operational costs. The broader macroeconomic environment, including monetary easing and infrastructure policies, supports sector growth but also introduces risks related to market corrections and earnings variability. Ongoing monitoring of regulatory changes remains essential for assessing sector outlook and company performance.
Note: Analysis synthesized from industry research, market reports, and regulatory filings. Information is subject to change based on market conditions.
Financial Ratios Dashboard
Illustrative Scenario Analysis
DCF Assumptions:
Method: Two-Stage EPS-Priority Model
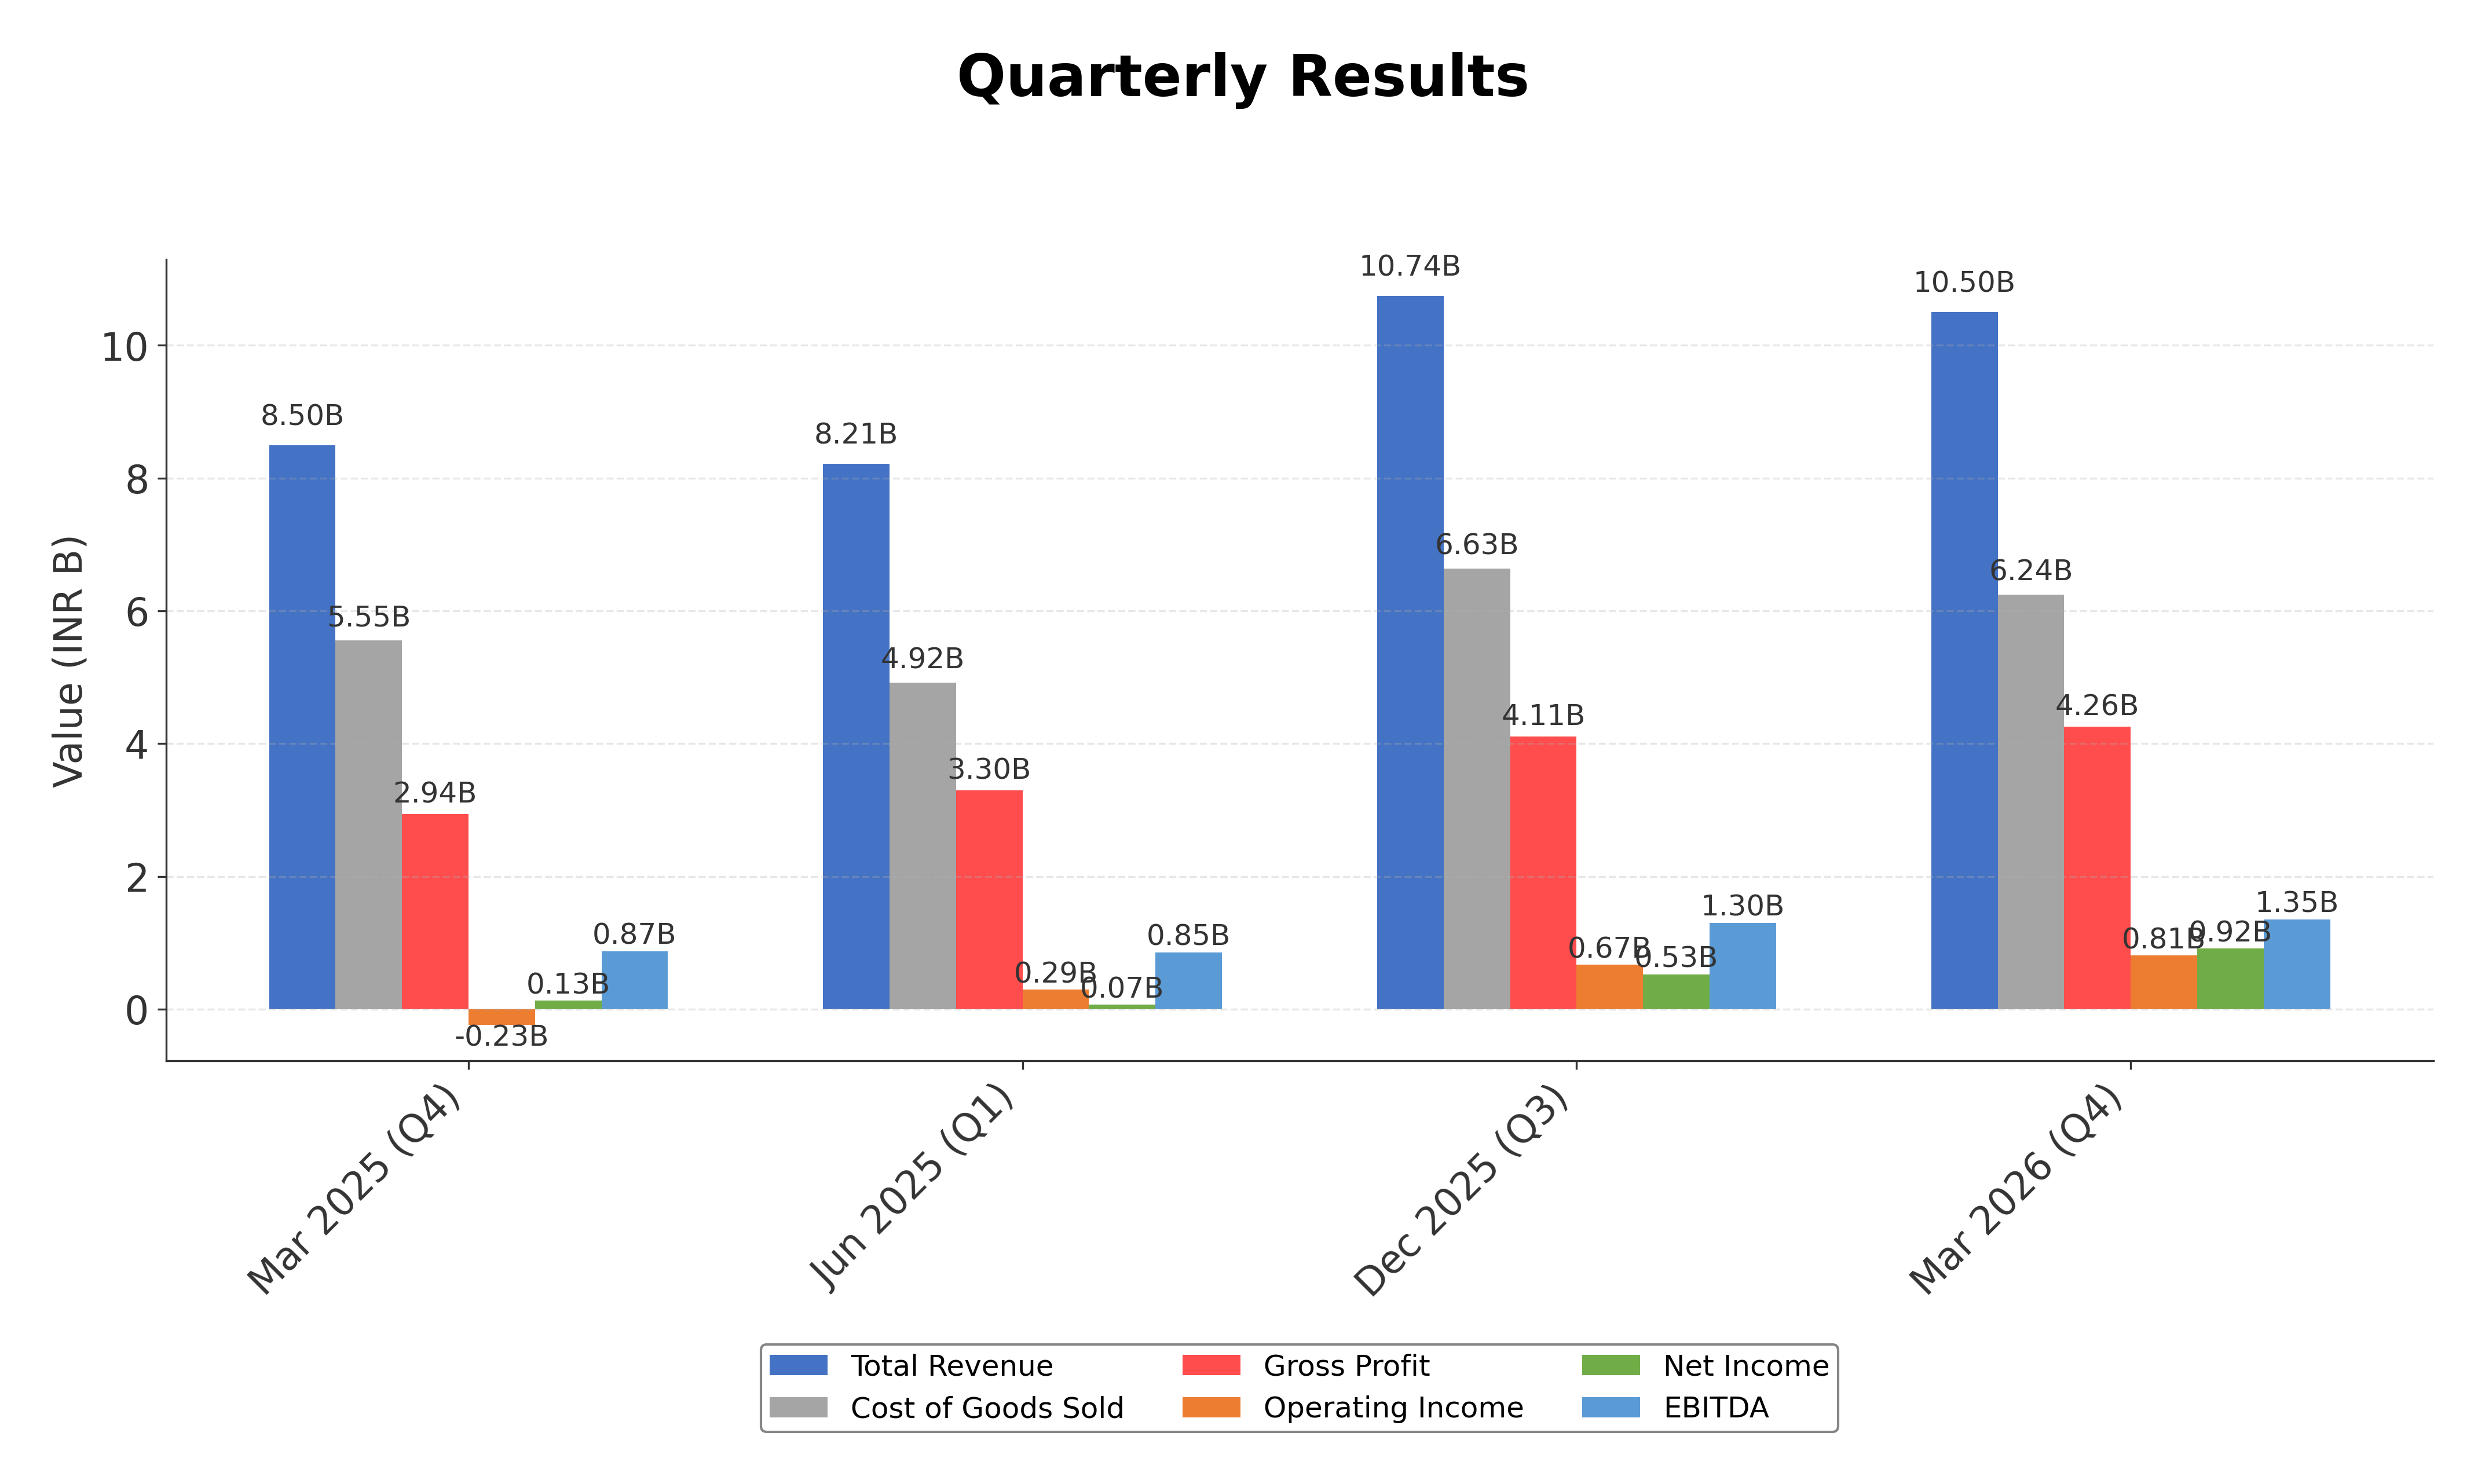
Financials
Peer Analysis
| Company Name | Market Cap | P/E Ratio | P/B Ratio | EV/EBITDA | Price to CFO |
|---|---|---|---|---|---|
| Sheela Foam Ltd. | ₹88.34B | 55.19 | 2.71 | 26.29 | 21.58 |
| Cello World Ltd. | ₹81.43B | 24.29 | 3.06 | 14.47 | 31.93 |
| Whirlpool of India Ltd. | ₹100.92B | 34.19 | 2.42 | 19.34 | 33.87 |
| Amber Enterprises India Ltd. | ₹274.35B | 150.56 | 6.12 | 31.94 | 114.24 |
| Voltas Limited | ₹425.75B | 111.25 | 6.59 | 58.61 | 599.90 |
| Crompton Greaves Consumer Electricals Ltd. | ₹168.51B | 39.34 | 5.62 | 19.57 | 23.29 |
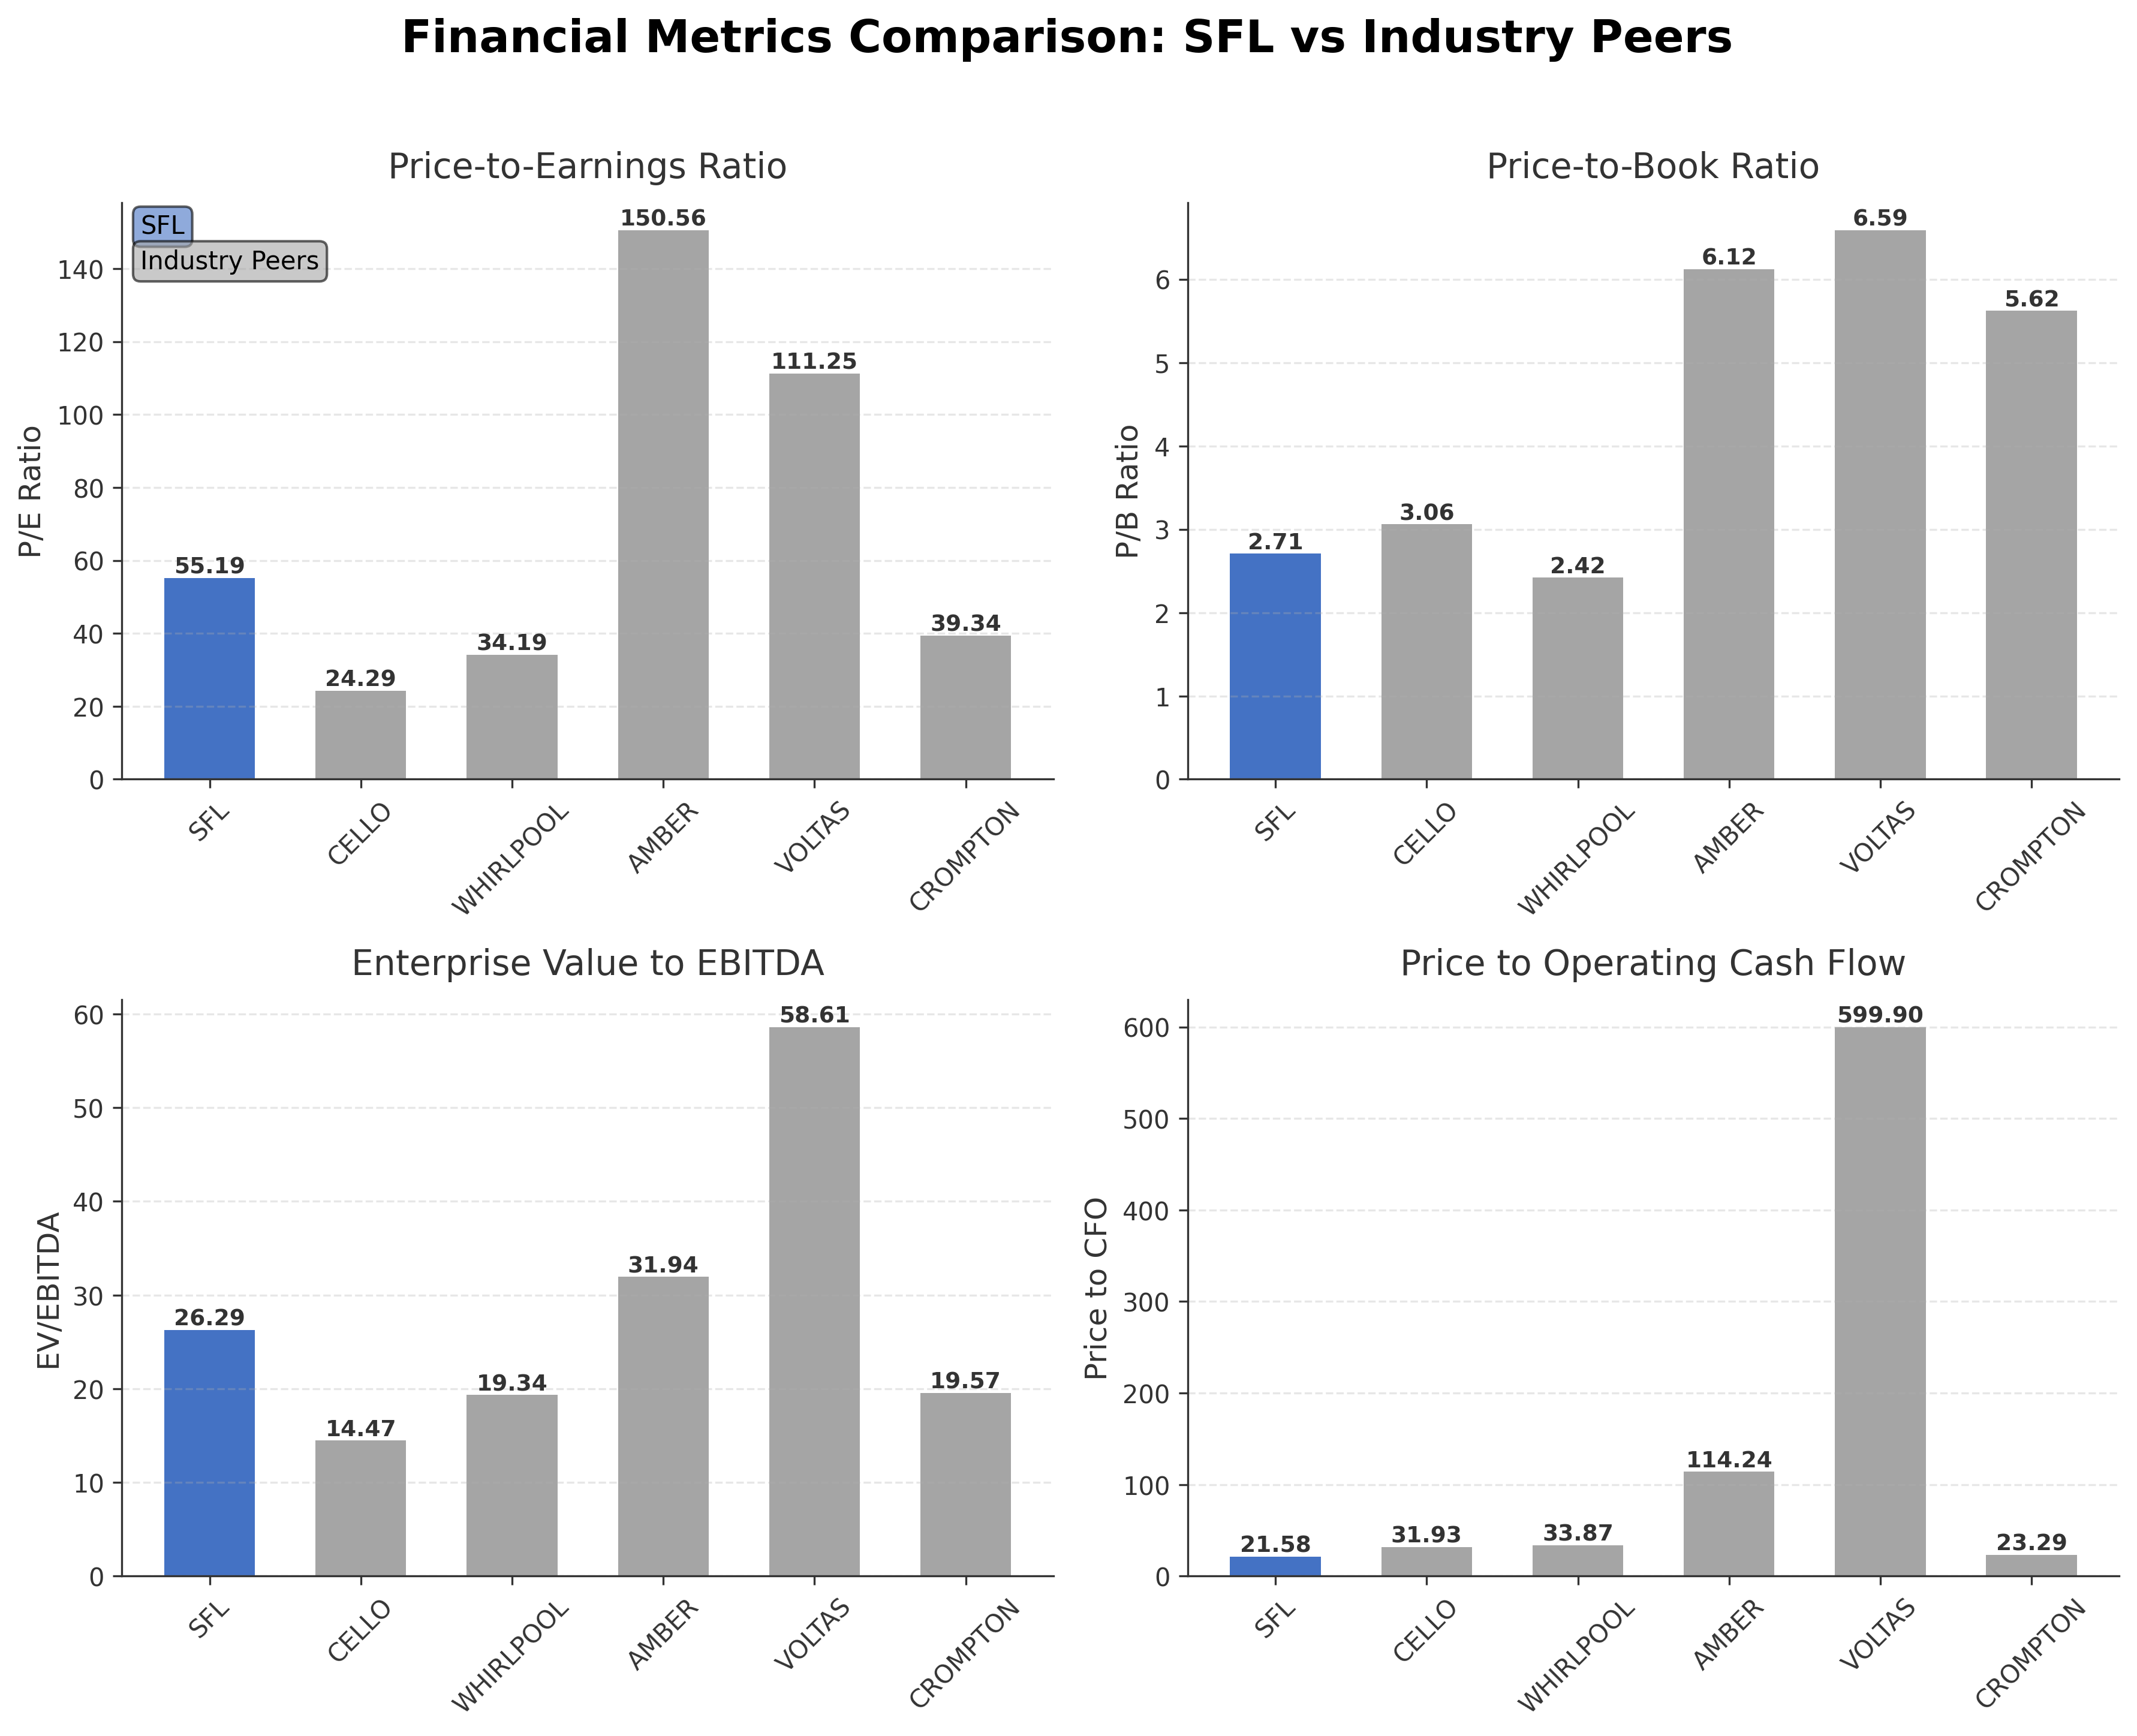
Comparison Analysis: Sheela Foam Ltd. trades at a higher P/E ratio of 55.19 compared to most regional peers, indicating a premium valuation relative to earnings. Its P/B ratio of 2.71 is moderate and lower than several peers such as Amber Enterprises and Voltas, which have P/B ratios above 6. The EV/EBITDA ratio of 26.29 is elevated but remains below Voltas’ 58.61, suggesting a relatively high enterprise valuation. Return on equity at 5.12% is lower than Cello World and Whirlpool of India but comparable to Amber and Voltas. Price to CFO at 21.58 is lower than some peers like Voltas and Amber, indicating relatively better cash flow pricing. Overall, Sheela Foam shows a balanced profile with premium valuation metrics but moderate profitability compared to its industry peers.
Financial Metrics Comparison with Peers
Financial Statements
Comprehensive financial data including income, balance sheet, and cash flow metrics
Income Statement
| fiscal_date | 2026-03-31 | 2025-03-31 | 2024-03-31 | 2023-03-31 | 2022-03-31 |
|---|---|---|---|---|---|
| Sales | 38.13B | 34.25B | 29.78B | 28.68B | 28.64B |
| Cost Of Goods | 22.98B | 21.59B | 18.59B | 18.53B | 19.38B |
| Gross Profit | 15.15B | 12.66B | 11.19B | 10.15B | 9.25B |
| Operating Expense Selling General And Administrative | 4.69B | 4.45B | 3.71B | 3.24B | 2.69B |
| Operating Expense Other Operating Expenses | 1.30B | 1.32B | 821.40M | 852.40M | 741.09M |
| Operating Income | 2.45B | 845.10M | 2.07B | 2.38B | 2.49B |
| Non Operating Interest Income | 123.70M | 106.40M | 94.40M | 345.10M | 376.94M |
| Non Operating Interest Expense | 938.80M | 1.19B | 678.00M | 202.00M | 149.79M |
| Pretax Income | 1.82B | 1.03B | 2.56B | 2.73B | 2.96B |
| Income Tax | 423.80M | 144.10M | 614.20M | 722.50M | 776.31M |
| Net Income | 1.61B | 900.90M | 1.84B | 2.01B | 2.19B |
| Eps Basic | 14.62 | 8.18 | 17.66 | 20.39 | 22.42 |
| Eps Diluted | 14.59 | 8.17 | 17.66 | 20.39 | 22.42 |
| Basic Shares Outstanding | 109.20M | 109.19M | 103.28M | 97.57M | 97.57M |
| Diluted Shares Outstanding | 109.20M | 109.19M | 103.28M | 97.57M | 97.57M |
| Ebit | 2.76B | 2.22B | 3.24B | 2.93B | 3.11B |
| Ebitda | 4.65B | 2.90B | 3.50B | 3.73B | 3.84B |
| Net Income Continuous Operations | 1.74B | 727.40M | 2.33B | 2.73B | 2.96B |
| Minority Interests | -12.40M | -7.40M | -14.90M | -19.10M | -13.98M |
| Preferred Stock Dividends | 0.00 | 0.00 | 0.00 | 0.00 | 0.00 |
Data provided by Twelve Data
Balance Sheet
| fiscal_date | 2026-03-31 | 2025-03-31 | 2024-03-31 | 2023-03-31 | 2022-03-31 |
|---|---|---|---|---|---|
| Cash And Cash Equivalents | 331.20M | 412.50M | 440.20M | 422.70M | 408.13M |
| Accounts Receivable | 4.42B | 3.46B | 3.64B | 2.82B | 2.69B |
| Total Assets | 51.17B | 53.68B | 53.40B | 27.09B | 23.63B |
| Total Liabilities | 18.57B | 23.43B | 23.59B | 11.03B | 9.63B |
| Long Term Debt | 2.47B | 7.39B | 11.19B | 3.71B | 3.34B |
| Shareholders Equity | 32.60B | 30.24B | 29.81B | 16.06B | 14.00B |
Data provided by Twelve Data
Cash Flow Statement
| fiscal_date | 2026-03-31 | 2025-03-31 | 2024-03-31 | 2023-03-31 | 2022-03-31 |
|---|---|---|---|---|---|
| Operating Activities Net Income | 1.74B | 727.40M | 2.33B | 2.73B | 2.96B |
| Operating Activities Stock Based Compensation | 62.90M | 74.20M | 24.20M | 0.00 | N/A |
| Operating Activities Other Non Cash Items | 646.00M | 538.00M | 330.10M | -247.50M | -326.29M |
| Operating Activities Accounts Receivable | -741.20M | 159.30M | -834.30M | -186.10M | 169.85M |
| Operating Activities Other Assets Liabilities | -227.00M | -260.30M | 1.18B | -14.10M | -435.66M |
| Operating Activities Operating Cash Flow | 1.48B | 1.24B | 3.03B | 2.28B | 2.37B |
| Investing Activities Capital Expenditures | -327.10M | -719.60M | -6.61B | -2.10B | -1.43B |
| Investing Activities Net Intangibles | -60.20M | -323.60M | -16.43B | 0.00 | N/A |
| Investing Activities Net Acquisitions | -300.00M | -509.40M | -3.11B | 0.00 | N/A |
| Investing Activities Sale Of Investments | 3.43B | 1.13B | 3.10B | 500.00K | 0.00 |
| Investing Activities Other Investing Activity | 95.10M | 101.20M | 423.40M | 70.20M | 113.85M |
| Investing Activities Investing Cash Flow | 2.90B | -5.90M | -6.24B | -3.30B | -3.31B |
| Financing Activities Long Term Debt Payments | -5.40B | -1.18B | -831.70M | -376.00M | -568.56M |
| Financing Activities Common Stock Issuance | 100.00K | 0.00 | 11.42B | 0.00 | N/A |
| Financing Activities Other Financing Charges | 2.50M | 10.00K | N/A | N/A | 1.36M |
| Financing Activities Financing Cash Flow | -5.40B | -1.35B | 19.22B | 1.01B | 720.09M |
| End Cash Position | 331.20M | 412.50M | 440.20M | 422.70M | 408.13M |
| Free Cash Flow | 2.72B | 1.01B | -19.43B | 59.40M | 336.93M |
| Investing Activities Purchase Of Investments | N/A | -13.00M | -46.60M | -1.27B | -1.99B |
| Financing Activities Short Term Debt Issuance | N/A | -162.10M | 1.45B | 648.20M | 365.82M |
| Financing Activities Common Dividends | N/A | -900.00K | -9.60M | -28.00M | -37.27M |
| Financing Activities Long Term Debt Issuance | N/A | N/A | 7.20B | 768.40M | 958.75M |
Data provided by Twelve Data
Technical Analysis
Key Insights
- Sheela Foam Ltd. is currently in an uptrend with price action showing higher highs and higher lows, reflecting bullish momentum.
- Key support levels are identified near ₹658 (50-day moving average) and ₹600 (200-day moving average), while resistance is near the 52-week high at ₹829.
- The stock price is trading above its 10-day, 50-day (₹658.22), and 200-day (₹599.78) moving averages, indicating positive medium- and long-term momentum.
- Momentum indicators show RSI in a moderately overbought zone, MACD histogram is positive, and stochastic oscillators signal sustained buying interest.
- Multi-timeframe analysis reveals consistent bullish signals on daily, weekly, and monthly charts, supporting a stable upward trend.
- Market scenarios suggest potential continuation of the bullish trend if support levels hold, while a break below key moving averages could signal consolidation or correction.
Trending News
1. Headline: Stocks to watch: TCS, Tata Steel, SBI, Titan, Graphite India, NLC India, NALCO, JSW Energy, Kalpataru - BusinessToday
Summary: Titan Company Ltd, Sheela Foam Ltd: Harsha Engineers International Ltd, RPG Life Sciences Ltd, Sheela Foam Ltd and Titan Company Ltd are four stocks that would turn ex-date for dividend today.
Sentiment: neutral
Summary: In total, these four companies are rewarding up to Rs 41.5 in dividends per share. The highest dividend payout is of Rs 24 per share from RPG Life and the second highest is of Rs 15 which is offered by the largest gems and jewellery stock, Titan.
Sentiment: neutral
Summary: Sheela Foam Share Price: Find the latest news on Sheela Foam Stock Price. Get all the information on Sheela Foam with historic price charts for NSE / BSE. Experts & Broker view also get the Sheela Foam Ltd. buy/sell tips detailed news, announcements, Forecasts, Analysts, Valuation, Earning ...
Sentiment: neutral
4. Headline: Sheela Foam Ltd. Upgraded to Strong Buy on Robust Financials and Bullish Technicals
Summary: Over a three- and five-year horizon, the stock has delivered returns of -36.68% and -36.23% respectively, contrasting sharply with the Sensex’s robust gains of 22.25% and 46.10% over the same periods. This underperformance tempers enthusiasm and suggests investors should remain vigilant about the company’s ability to regain long-term growth. Want to dive deeper on Sheela Foam Ltd...
Sentiment: positive
5. Headline: Sheela Foam Ltd. Technical Momentum Shifts Signal Bullish Outlook
Summary: Sheela Foam Ltd., a prominent player in the furniture and home furnishing sector, has witnessed a notable shift in its technical momentum, moving from a mildly bullish stance to a more confident bullish trend. This change is underscored by a combination of technical indicators and price action, reflecting growing investor optimism despite a slight dip in the stock ...
Sentiment: positive
Powered by Brave
Recent Updates
News Summary
As of July 9, 2026. Sheela Foam Ltd. has set July 9, 2026, as the record date for its final dividend of Re 1 per share for FY26, pending shareholder approval at the upcoming AGM. The company has outlined detailed tax deduction at source (TDS) norms for resident and non-resident shareholders, including withholding rates ranging from 10% to 20% depending on PAN validity and residency status. Shareholders are required to submit relevant documentation by July 3, 2026, to ensure correct tax treatment. The dividend declaration reflects the company’s ongoing commitment to shareholder returns. Additionally, management continues to engage with investors through scheduled virtual meetings, maintaining transparency and regulatory compliance. Financial results indicate steady revenue growth and improved profitability, with net income rising to INR 159.61 crores in FY26, supported by efficient cost management and margin improvements.
News Sentiment
The overall sentiment from recent updates is neutral to mildly positive, driven by the company’s consistent dividend policy and transparent investor communications. The dividend record date announcement and detailed TDS guidelines provide clarity for shareholders, supporting stable market perception. Positive technical momentum and financial upgrades contribute to a cautiously optimistic tone, although no major strategic changes or acquisitions have been reported. The balance of steady operational performance and shareholder engagement underpins a stable outlook without significant volatility or disruption.
Source List
- https://www.alphaspread.com/security/nse/sfl/investor-relations
Analytical Overview
Analysis Summary
Sheela Foam Ltd.’s valuation metrics, including a trailing P/E of 55.19 and forward P/E of 28.92, are elevated relative to the industry average P/E of 55.19, reflecting market expectations for growth but also a premium pricing. The company’s revenue growth rate of 23.6% and positive cash flow trends, with operating cash flow of INR 409.32 crores and free cash flow of INR 187.16 crores, indicate a healthy growth trajectory and operational efficiency. Financial health is supported by a manageable debt-to-equity ratio of 0.28 and sufficient liquidity, though the current ratio of 0.763 suggests some short-term liquidity constraints. Sector-specific challenges include competitive pressures in the consumer cyclical segment and regulatory compliance related to dividend taxation, while opportunities arise from expanding product lines and international market presence. Considering India-specific factors, the company benefits from growing consumer demand for home comfort products amid a favorable economic outlook and evolving regulatory environment.
Overall Business and Market Assessment
Supporting Factors: Key supporting factors include robust revenue growth of 23.6%, strong operating cash flow generation, and a well-recognized brand with international reach. Risks to monitor involve the elevated P/E ratio, liquidity indicated by a current ratio below 1, and competitive dynamics in the consumer cyclical sector. The appropriate investment timeframe is medium to long-term, focusing on the company’s ability to sustain growth and improve profitability. Overall, Sheela Foam presents a balanced risk-reward profile with stable fundamentals and market positioning.
Risk Factors: No data
SWOT Analysis
Strengths
- Strong brand presence with Sleepwell in the comfort foam industry.
- Robust revenue growth of 23.6% and consistent cash flow generation.
- Moderate debt levels with a debt-to-equity ratio of 0.28.
- International market presence in Australia and Spain.
Weaknesses
- Relatively high valuation multiples with a trailing P/E of 55.19.
- Modest profitability with net profit margin of 4.18%.
- Current ratio below 1 indicating potential short-term liquidity constraints.
- Return on equity at 5.12% is lower than some industry peers.
Opportunities
- Expansion of product portfolio in home comfort and technical foam segments.
- Growing consumer demand in India’s home furnishing market.
- Increasing institutional investor interest and shareholder engagement.
- Potential for innovation in foam technology and material sourcing.
Threats
- Competitive pressures from established and emerging players in consumer cyclical sector.
- Regulatory and tax compliance risks related to dividend payouts.
- Macroeconomic factors impacting discretionary consumer spending.
- Currency and geopolitical risks affecting international operations.
Company Description
Sheela Foam Ltd. is an Indian company known for producing and distributing polyurethane foam-based products. It primarily serves the comfort and technical foam industry. The company's product portfolio includes mattresses, pillows, and cushioning products under the popular brand name Sleepwell. Sheela Foam Ltd. operates not only in India but also has a significant international presence, particularly in Australia and Spain, thereby serving diverse market segments. Its primary function is to cater to the growing demand for comfort and luxury in home furnishings. Sheela Foam Ltd. is also engaged in the business-to-business market, providing foam for use in various applications, ranging from automobiles to industrial and technical sectors. In the financial market, Sheela Foam Ltd. holds significant importance as it is a key player in the consumer goods sector, especially in the mattress segment known for its extensive distribution network and innovative products. The company's emphasis on quality and R&D-enhanced products underscore its role in influencing consumer trends and contributing to advances in material technology.