


Shakti Press Ltd (SHAKTIPR)
Stock Analysis Report
Stock Journey
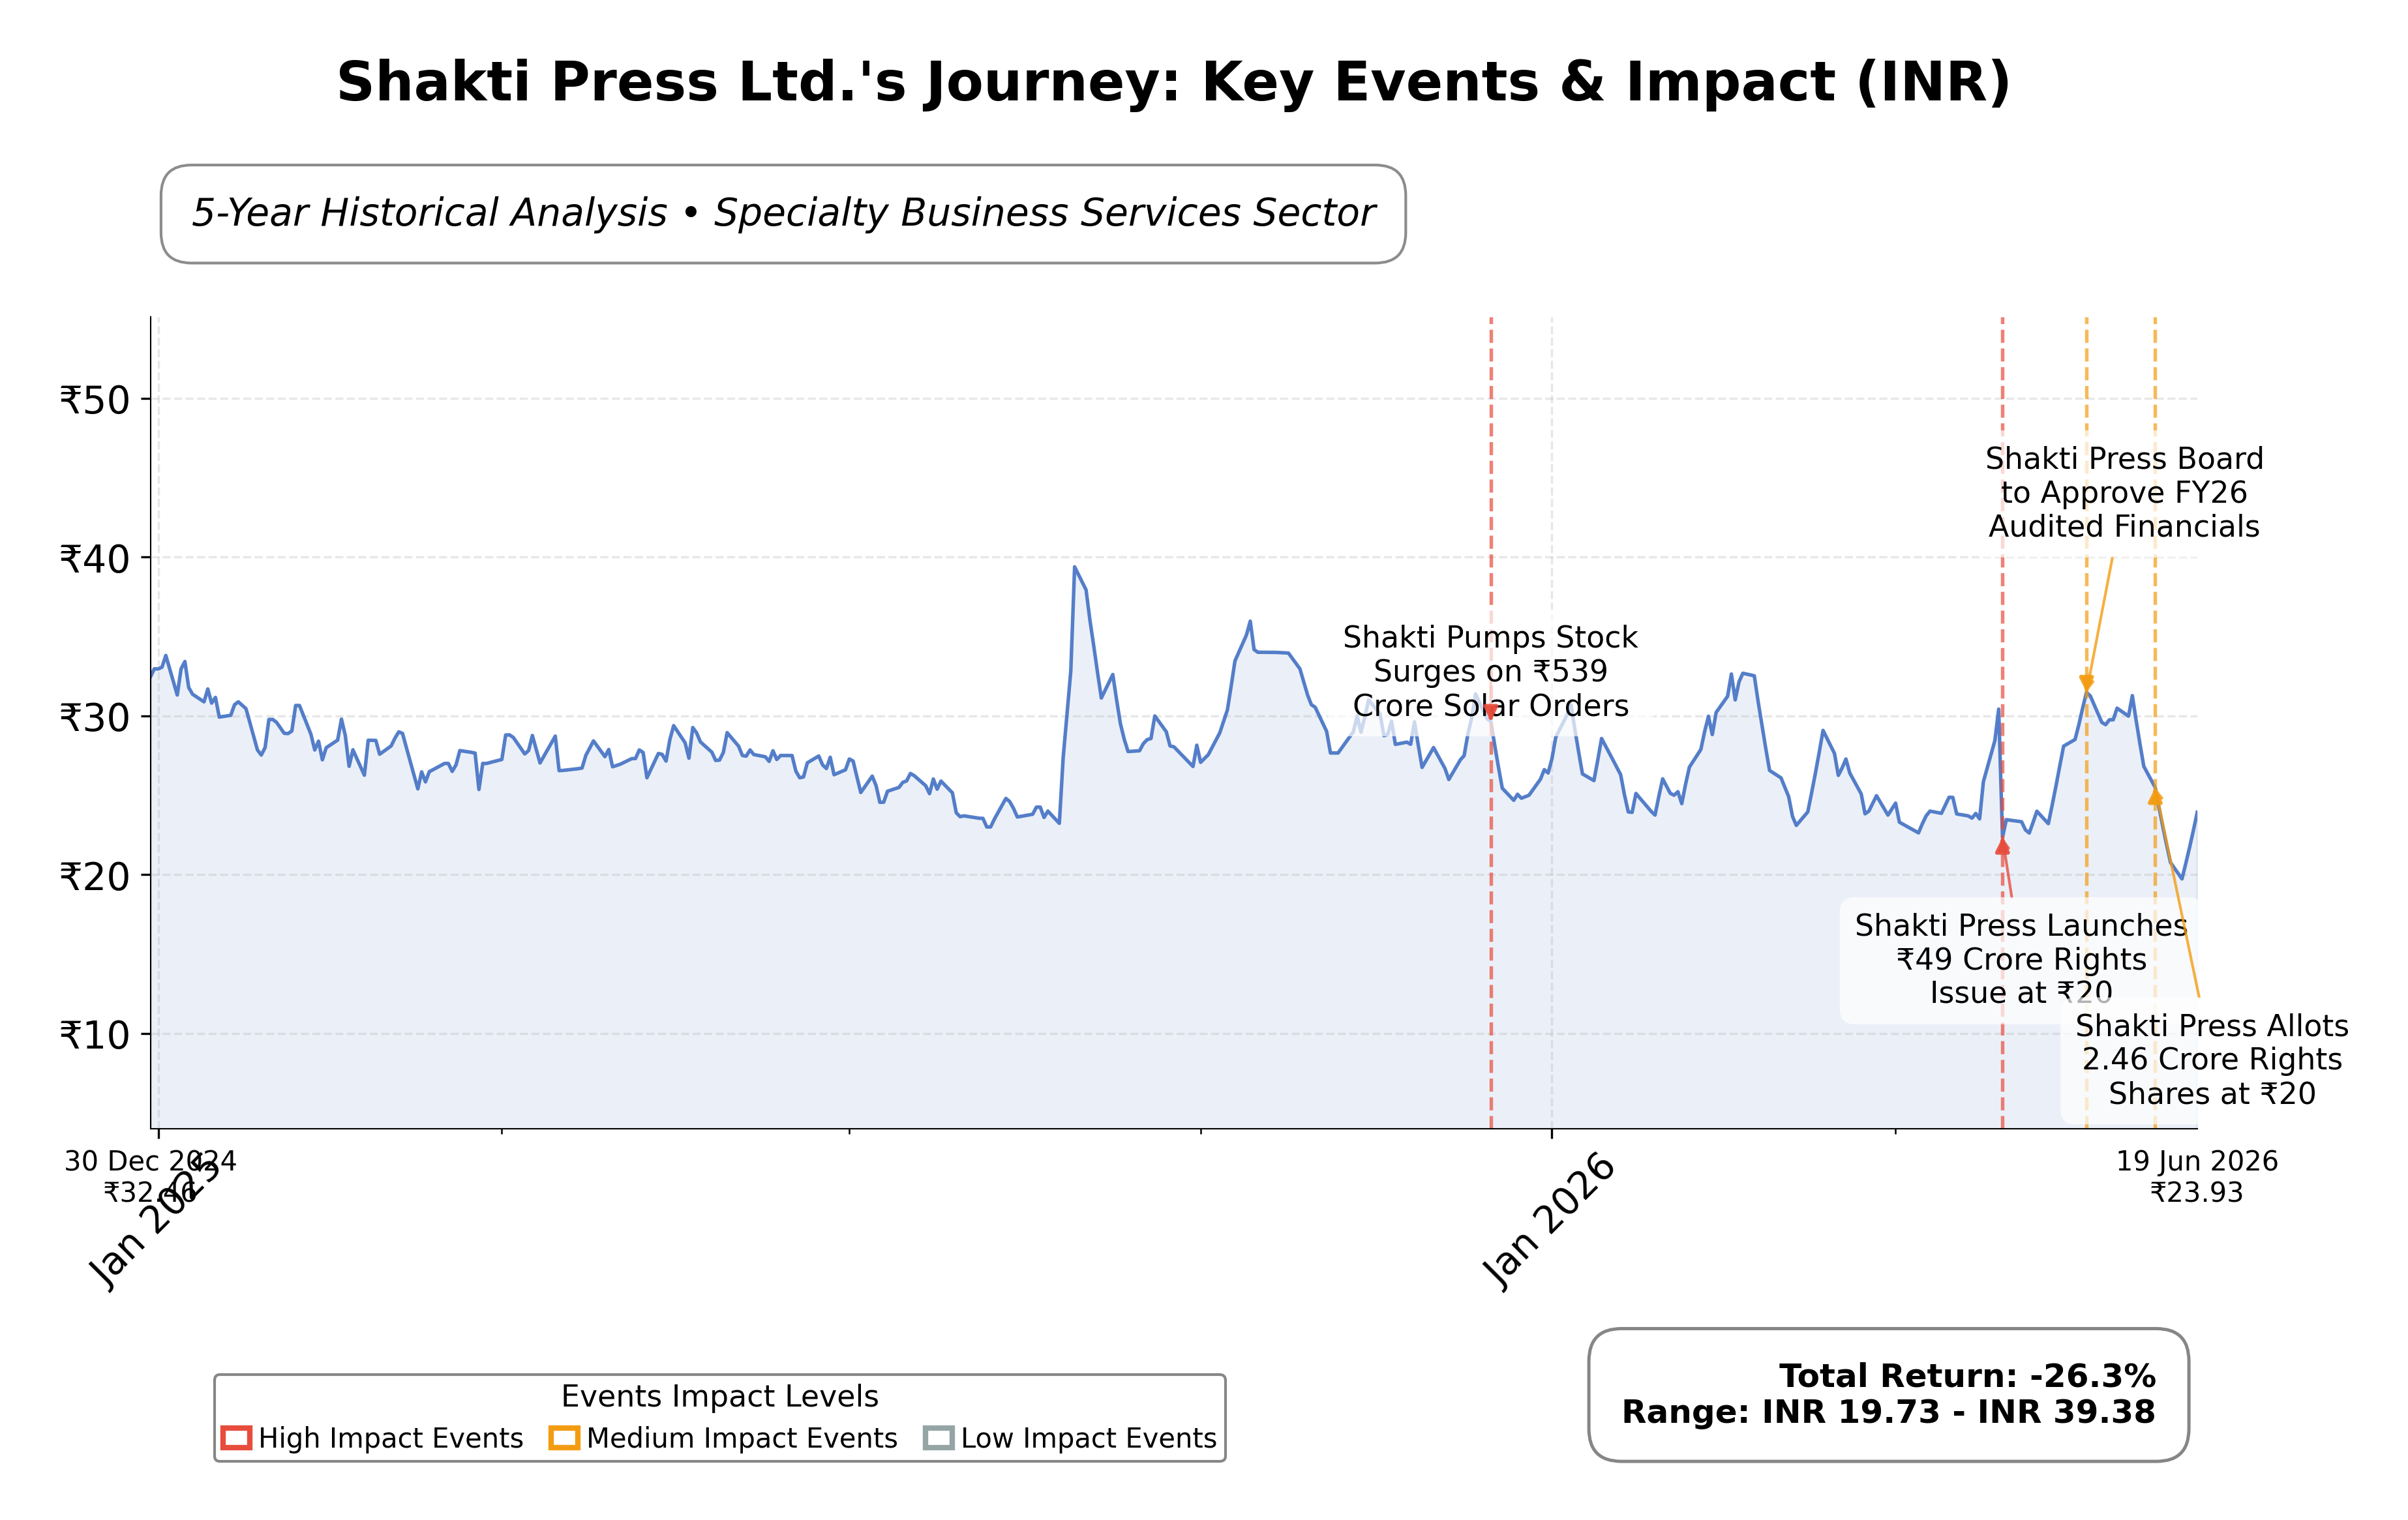
Key Positives and Key Risks
Pros
- Revenue growth of 15.18% quarter-over-quarter demonstrates strong operational momentum.
- Trailing P/E ratio of 7.30 and P/B ratio of 0.46 indicate the stock is trading at a valuation discount relative to industry averages.
- Successful rights issue raised ₹4928.28 lakh, providing capital for expansion and debt management.
Cons
- Negative operating cash flow of ₹-59.65 crore and free cash flow of ₹-78.14 crore highlight cash generation challenges.
- Low cash reserves of ₹0.93 crore against total debt of ₹138.45 crore raise liquidity concerns.
- Modest net profit margin of 2.10% limits profitability leverage amid sector pressures.
Disclosure: This information is for general awareness and does not constitute investment advice
Report Summary
Shakti Press Ltd. operates primarily in the printing and publishing industry, offering a broad range of services including packaging, paper printing, and publishing solutions. Listed on the Bombay Stock Exchange (BSE) under the ticker SHAKTIPR, the company serves diverse sectors such as education, media, and consumer goods, providing essential printed materials like textbooks and commercial packaging. Positioned within the Industrials sector and classified under Specialty Business Services, Shakti Press has established a significant presence in the Indian market, leveraging advanced printing technologies to maintain its competitive edge.
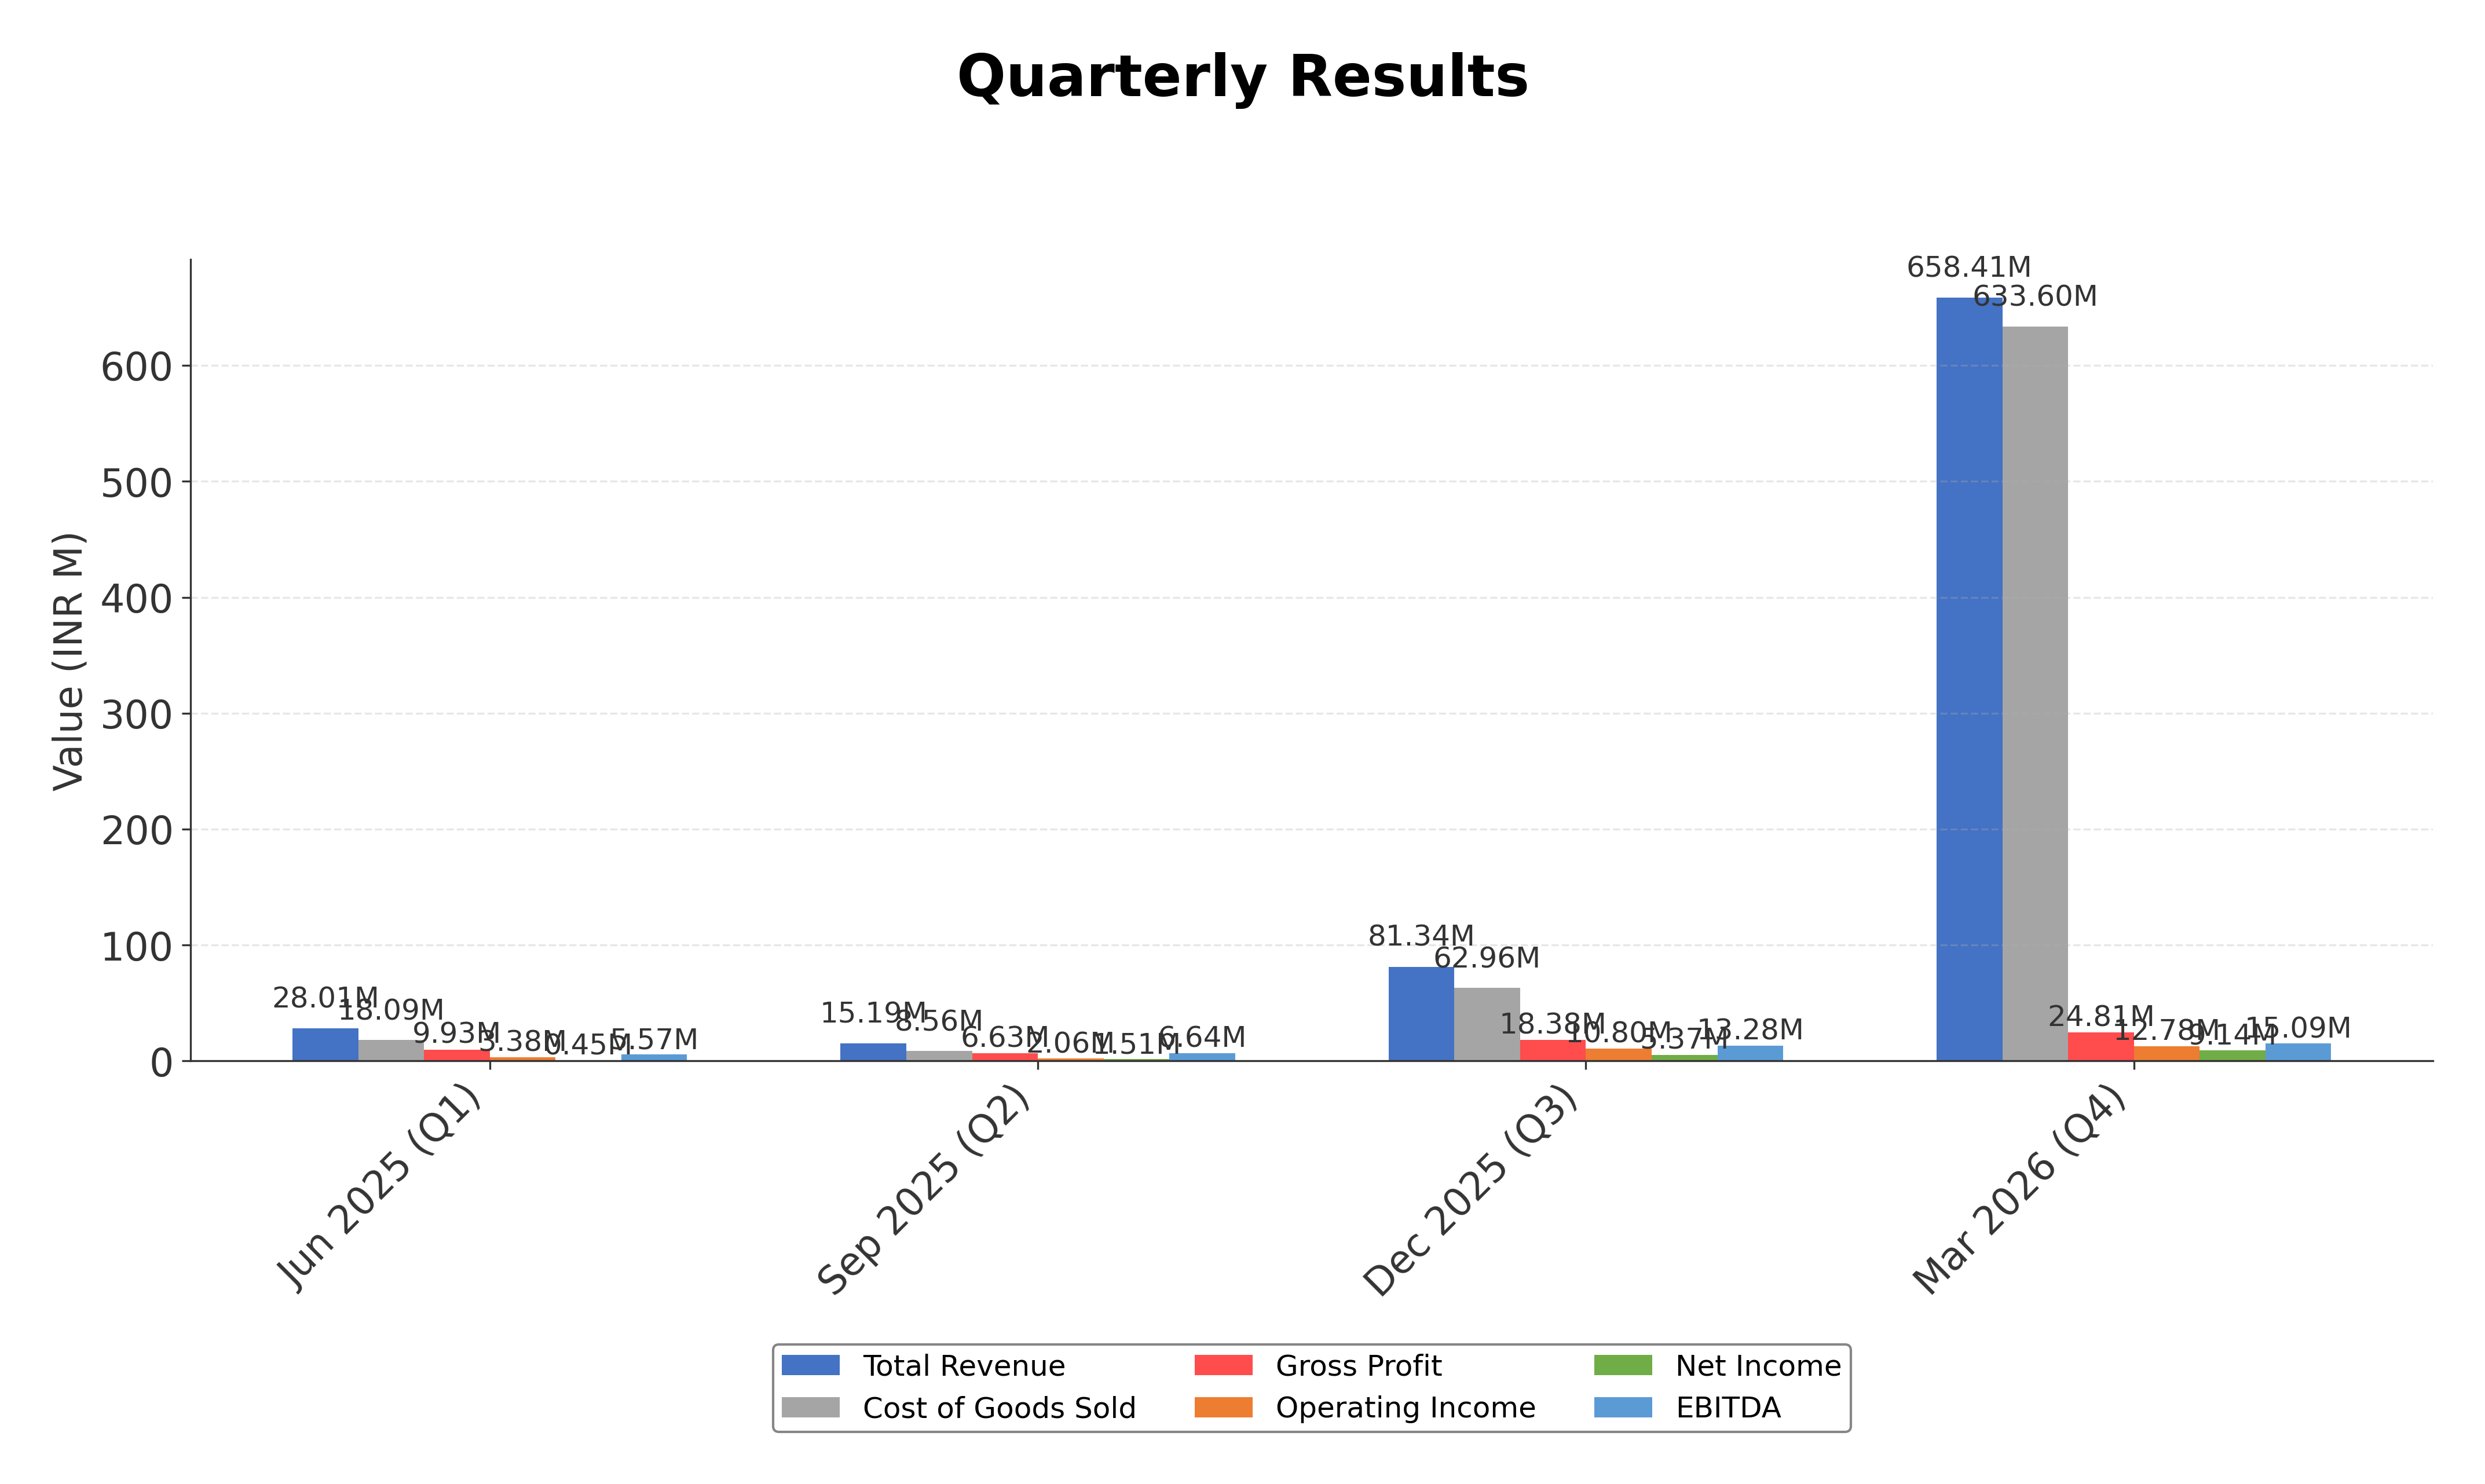
Financially, Shakti Press reported trailing twelve months (TTM) revenue of approximately ₹785.26 crore, with a gross margin of 3.77%, operating margin of 2.29%, and net profit margin of 2.10%. The company’s return on equity (ROE) stands at 7.42%, and return on assets (ROA) at 4.64%, indicating moderate profitability and asset efficiency. Despite positive revenue growth of 15.18% quarter-over-quarter, the firm faces challenges with negative operating cash flow of ₹-59.65 crore and levered free cash flow of ₹-78.14 crore, reflecting cash management pressures.
Valuation metrics show a trailing price-to-earnings (P/E) ratio of 7.30, a price-to-book (P/B) ratio of 0.46, and an enterprise value to EBITDA (EV/EBITDA) multiple of 6.25. The market capitalization is approximately ₹120.29 million, with the stock currently trading at ₹25.12 within a 52-week range of ₹18.75 to ₹39.38. The stock price is positioned closer to the mid-range, suggesting a valuation that is modest relative to its historical price extremes and fundamentals.
Key strengths include a solid current ratio of 2.06, indicating liquidity adequacy, and a low debt-to-equity ratio of 53.02%, which suggests manageable leverage. The company recently completed a significant rights issue raising ₹492.8 crore to support corporate objectives and has seen incremental promoter stake increases, reflecting confidence in its strategic direction. Risks include negative cash flow trends, sectoral challenges from digital media substitution, and the capital-intensive nature of its expanding Agri Division. Recent strategic moves involve capital raising and potential expansion into agricultural commodities trading.
Technically, the stock trades below its 200-day moving average of ₹27.29 but above the 50-day average of ₹24.62, indicating mixed momentum signals. The beta of 0.985 suggests market-correlated volatility. Recent news highlights promoter buying and capital infusion, which may influence market sentiment. Overall, the data suggests a cautious stance with attention to operational cash flow and capital deployment, warranting close monitoring of financial and strategic developments.
Company and Industry Overview
Company Basics
Price Performance
Company Size
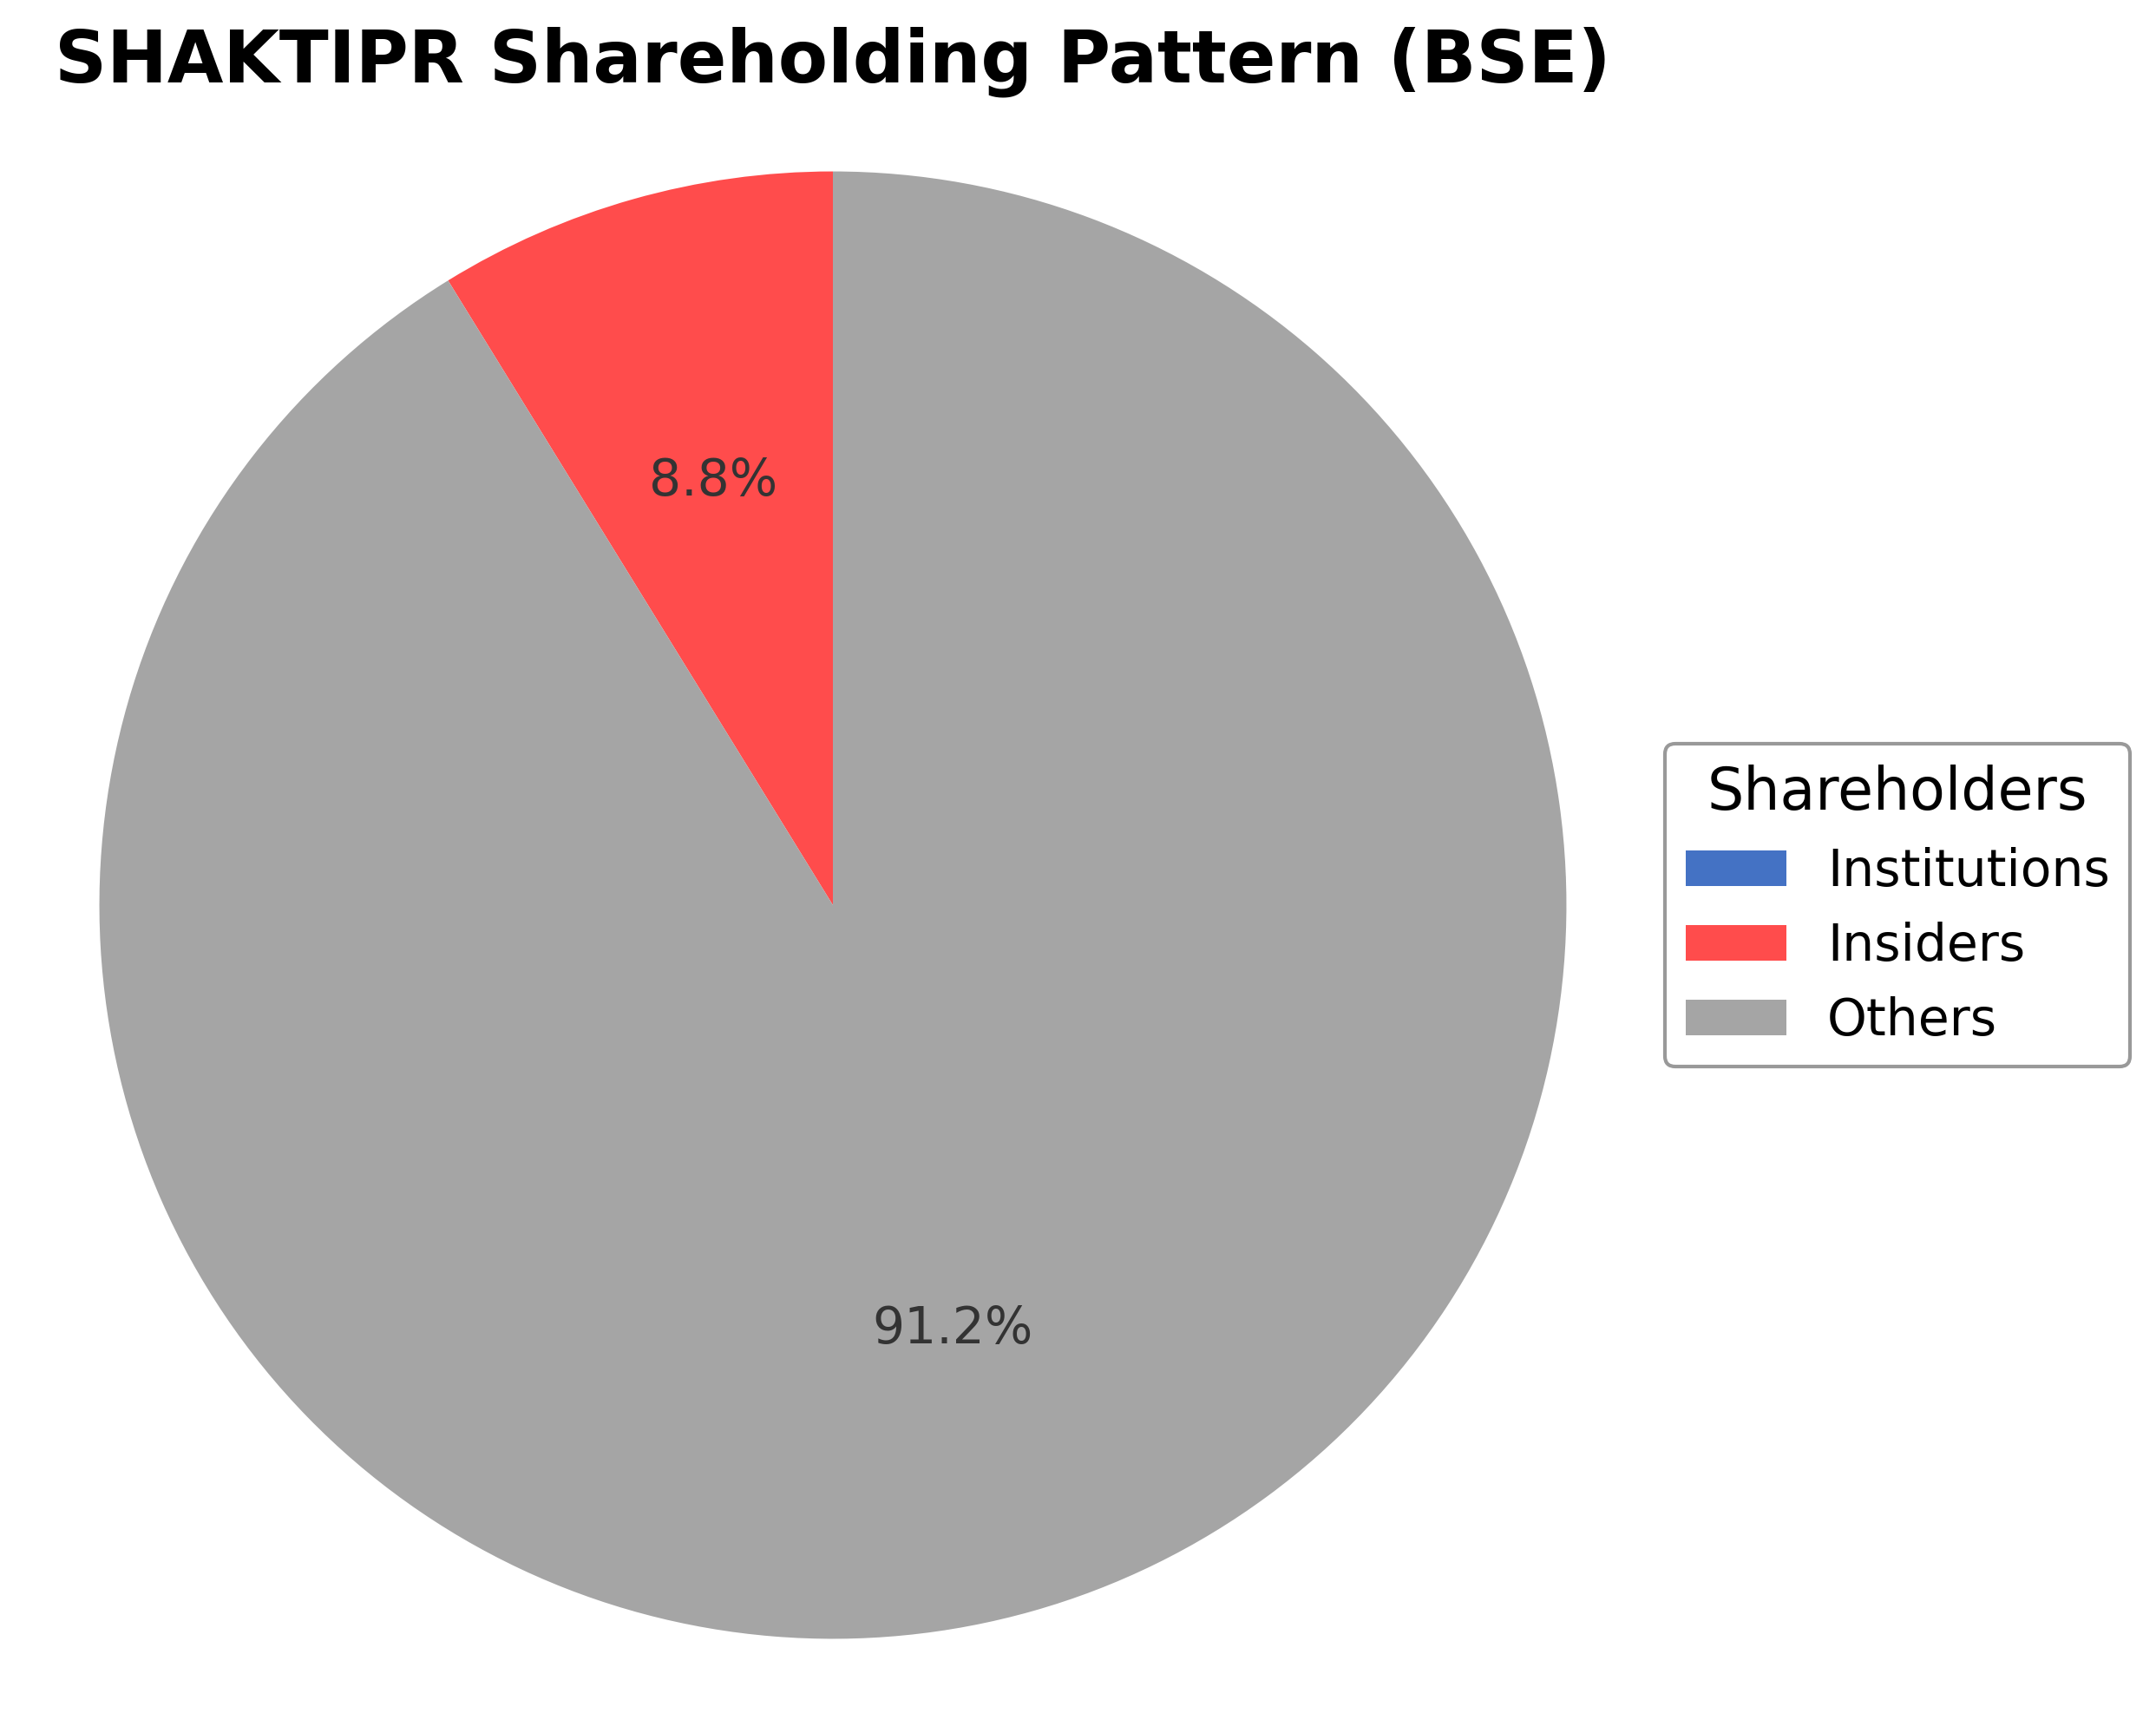
Shareholding Pattern
Sector and Industry Analysis
The printing and packaging sector in India has witnessed steady growth driven by rising demand from FMCG, pharmaceuticals, and e-commerce industries. The market size is substantial, with increasing adoption of advanced printing technologies and sustainable packaging solutions. Key players range from large integrated firms to specialized regional companies, contributing to a competitive yet fragmented landscape.
Industry trends include a shift towards digital and flexible packaging, emphasizing customization and faster turnaround times. Competitive dynamics are shaped by technological innovation, cost efficiency, and the ability to meet stringent quality standards. Barriers to entry include high capital investment, expertise in printing technology, and establishing distribution networks, which favor established players with scale and technical know-how.
The regulatory environment is influenced by packaging waste management rules and environmental standards aimed at reducing plastic usage and promoting recyclability. Compliance with these regulations requires investments in eco-friendly materials and processes, impacting operational costs. The outlook suggests increased regulatory scrutiny and a push for sustainable practices, which will shape industry strategies and product offerings.
Note: Analysis synthesized from industry research, market reports, and regulatory filings. Information is subject to change based on market conditions.
Financial Ratios Dashboard
Financials
Peer Analysis
| Company Name | Market Cap | P/E Ratio | P/B Ratio | EV/EBITDA | Price to CFO |
|---|---|---|---|---|---|
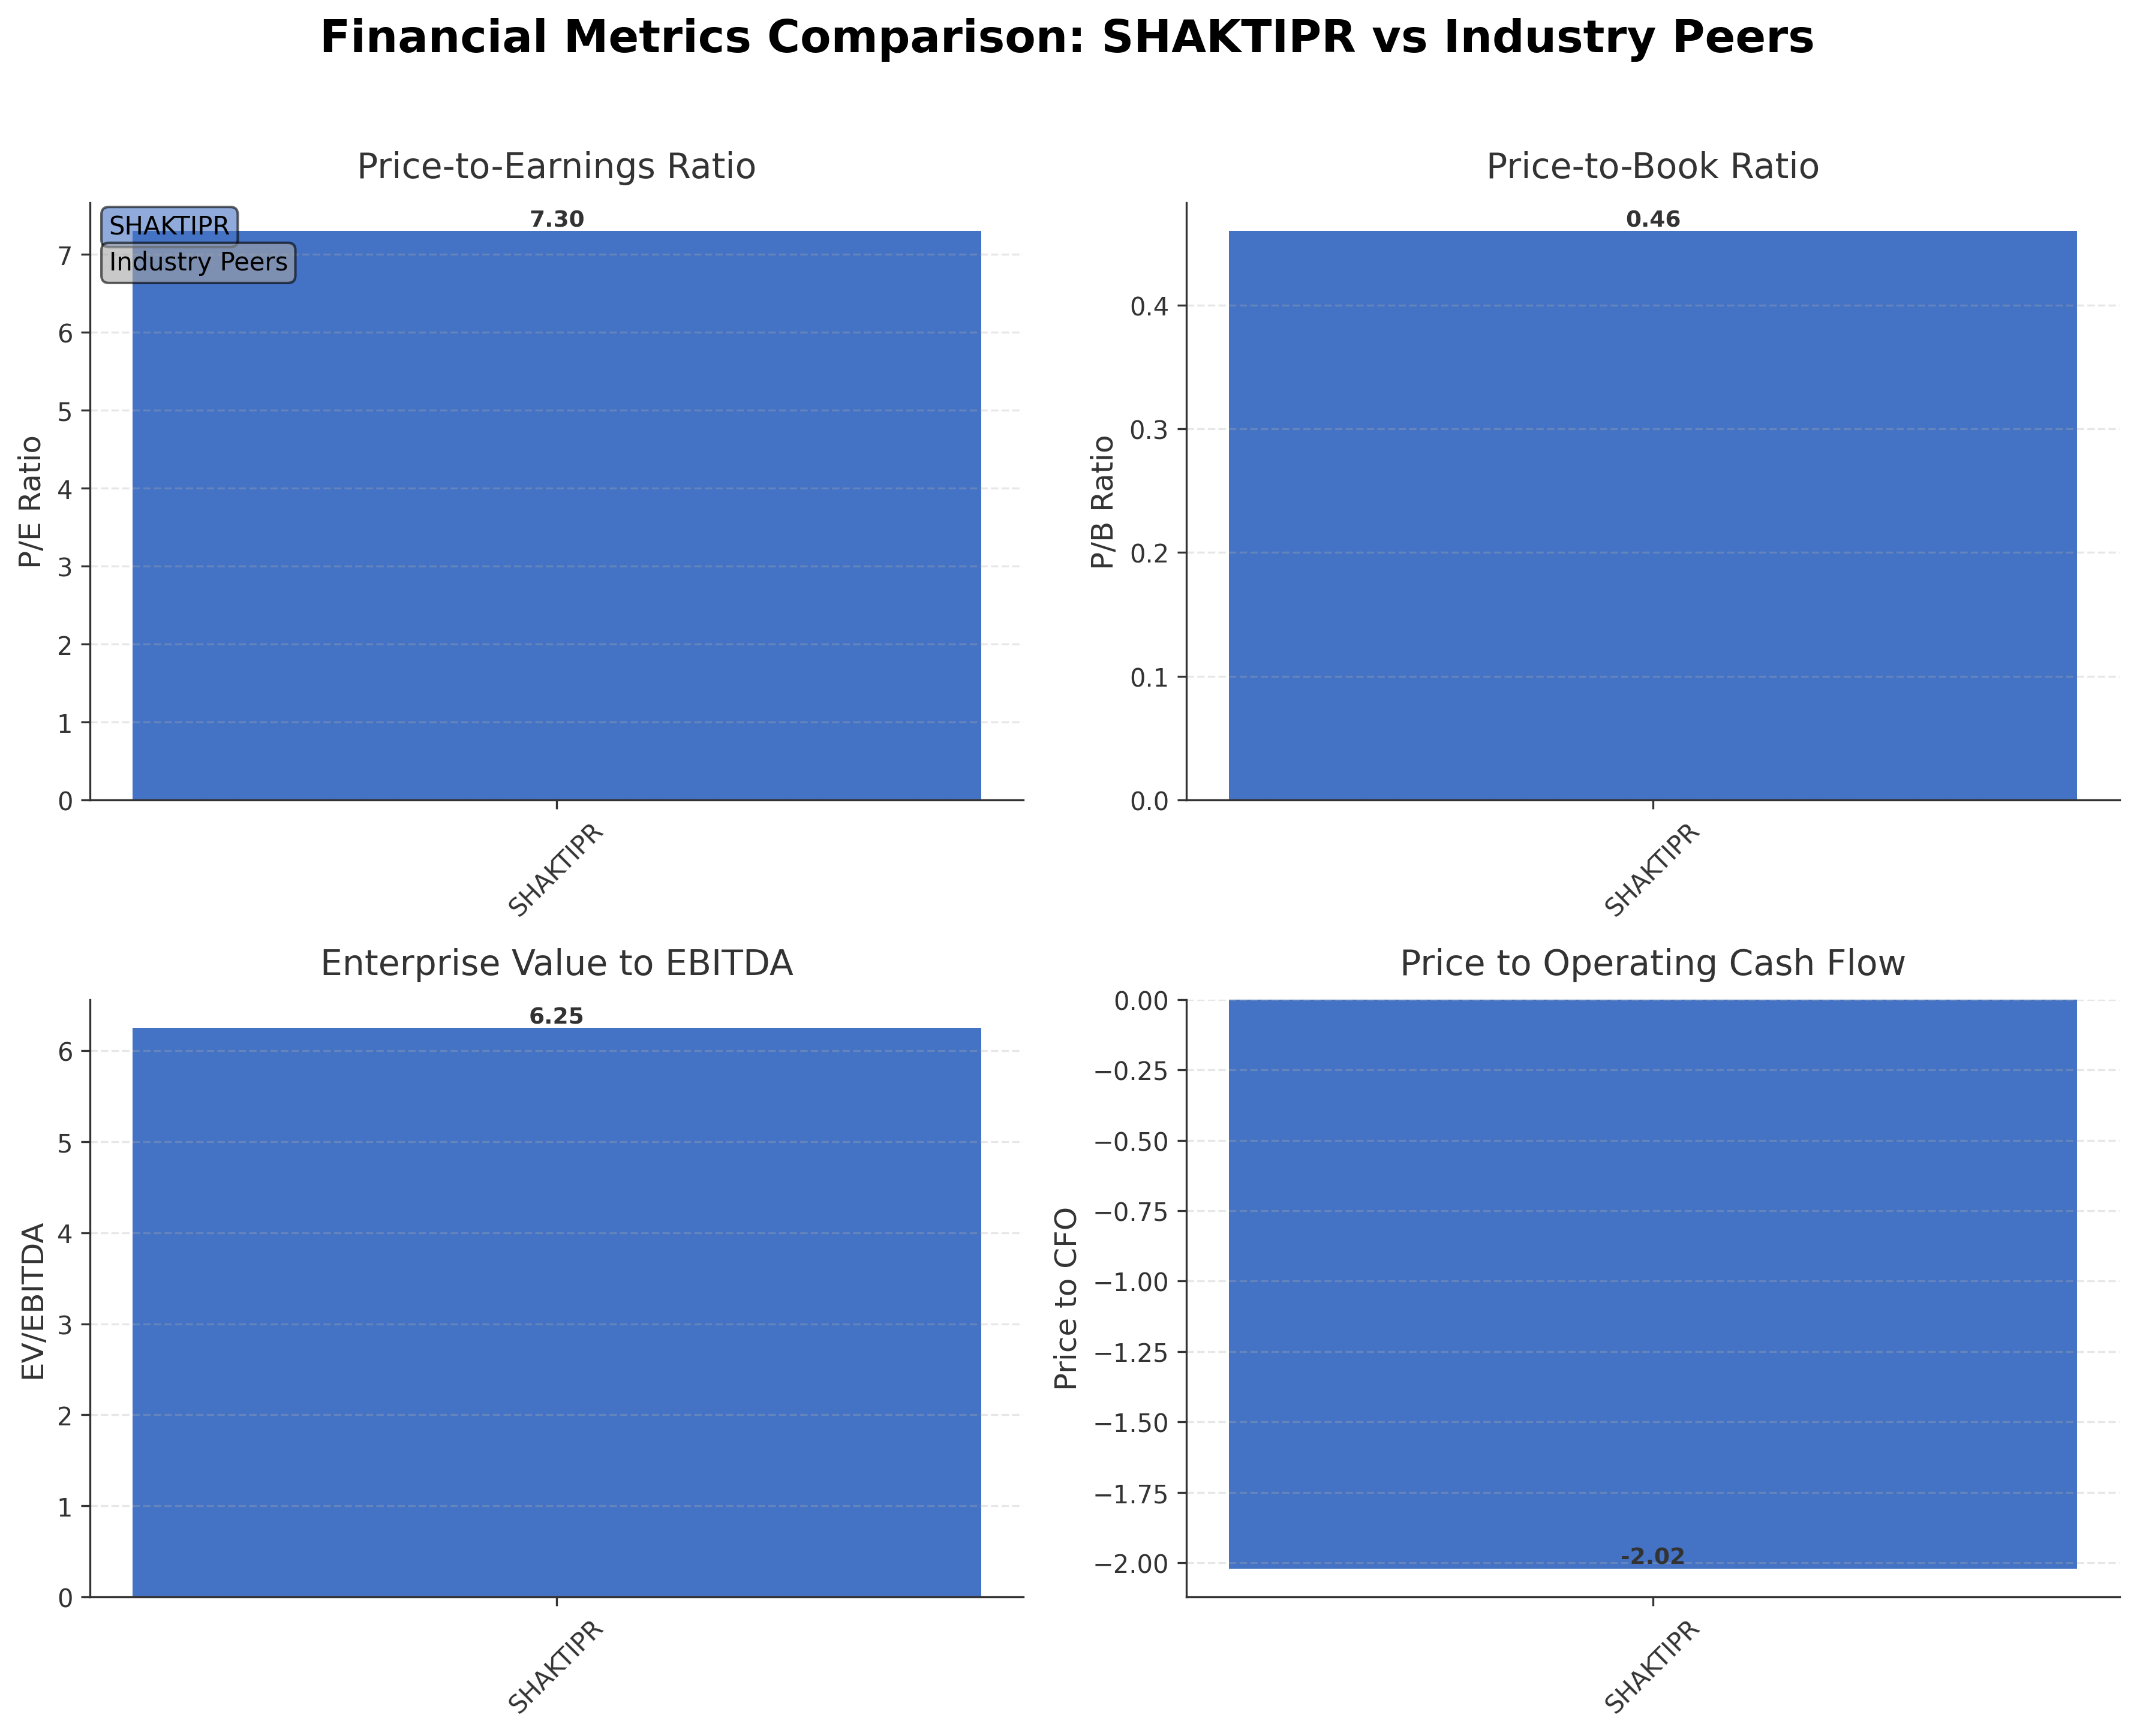
| Shakti Press Ltd. | ₹120.29M | 7.30 | 0.46 | 6.25 | -2.02 |
Comparison Analysis: Shakti Press Ltd. currently lacks direct listed peers within the same industry segment for comparison. Its valuation metrics such as a P/E ratio of 7.30 and P/B ratio of 0.46 suggest a relatively low valuation compared to typical industry averages. The EV/EBITDA multiple of 6.25 indicates moderate enterprise valuation relative to earnings before interest, taxes, depreciation, and amortization. The negative price to cash flow ratio reflects operational cash flow challenges. The company’s return on equity of 7.42% demonstrates modest profitability relative to equity employed. Overall, Shakti Press’s financial metrics position it as a modestly valued entity with room for operational improvement compared to broader specialty business services benchmarks.
Financial Metrics Comparison with Peers
Financial Statements
Comprehensive financial data including income, balance sheet, and cash flow metrics
Income Statement
| fiscal_date | 2026-03-31 | 2025-03-31 | 2024-03-31 | 2023-03-31 | 2022-03-31 |
|---|---|---|---|---|---|
| Sales | 782.96M | 130.28M | 115.81M | 82.82M | 99.19M |
| Cost Of Goods | 724.30M | 91.55M | 72.59M | 49.75M | 68.32M |
| Gross Profit | 58.66M | 38.73M | 43.22M | 33.07M | 30.88M |
| Operating Expense Selling General And Administrative | 3.09M | 2.43M | 6.43M | 1.61M | 999.00K |
| Operating Expense Other Operating Expenses | 11.45M | 7.90M | 9.19M | 4.37M | 5.58M |
| Operating Income | 29.03M | 12.03M | 14.57M | 13.38M | 12.17M |
| Non Operating Interest Income | 115.00K | 9.00K | 0.00 | 0.00 | 12.00K |
| Non Operating Interest Expense | 11.92M | 11.27M | 9.60M | 6.80M | 6.75M |
| Pretax Income | 19.76M | 794.00K | 4.79M | 6.24M | 5.43M |
| Income Tax | 3.30M | 124.00K | 0.00 | 0.00 | 0.00 |
| Net Income | 16.46M | 670.00K | 4.79M | 6.24M | 5.43M |
| Ebit | 31.68M | 12.06M | 14.39M | 13.04M | 12.18M |
| Ebitda | 40.56M | 20.67M | 22.85M | 22.43M | 20.19M |
| Net Income Continuous Operations | 19.76M | 794.00K | 4.79M | 6.24M | 5.43M |
| Preferred Stock Dividends | 0.00 | 0.00 | 0.00 | 0.00 | 0.00 |
| Eps Basic | N/A | 0.13 | 1.36 | 1.77 | 1.54 |
| Eps Diluted | N/A | 0.13 | 1.36 | 1.77 | 1.54 |
| Basic Shares Outstanding | N/A | 5.04M | 3.52M | 3.53M | 3.53M |
| Diluted Shares Outstanding | N/A | 5.04M | 3.52M | 3.53M | 3.53M |
Data provided by Twelve Data
Balance Sheet
| fiscal_date | 2026-03-31 | 2025-03-31 | 2024-03-31 | 2023-03-31 | 2022-03-31 |
|---|---|---|---|---|---|
| Cash And Cash Equivalents | 934.00K | 785.00K | 1.31M | 2.55M | 231.00K |
| Accounts Receivable | 254.14M | 208.40M | 203.37M | 170.81M | 163.85M |
| Total Assets | 491.38M | 352.83M | 352.47M | 335.57M | 342.34M |
| Total Liabilities | 230.24M | 170.13M | 165.30M | 153.21M | 166.20M |
| Long Term Debt | 41.27M | 30.41M | 50.12M | 40.76M | 58.50M |
| Shareholders Equity | 261.14M | 182.70M | 187.17M | 182.38M | 176.14M |
Data provided by Twelve Data
Cash Flow Statement
| fiscal_date | 2026-03-31 | 2025-03-31 | 2024-03-31 | 2023-03-31 | 2022-03-31 |
|---|---|---|---|---|---|
| Operating Activities Net Income | 19.76M | 794.00K | 4.79M | 6.24M | 5.43M |
| Operating Activities Other Non Cash Items | 11.94M | 11.46M | 9.61M | 6.94M | 6.83M |
| Operating Activities Accounts Receivable | -45.75M | -5.03M | -32.55M | -6.96M | -39.50M |
| Operating Activities Other Assets Liabilities | -104.95M | 5.17M | 6.87M | -13.93M | 14.02M |
| Operating Activities Operating Cash Flow | -119.00M | 12.40M | -11.29M | -7.72M | -13.22M |
| Investing Activities Capital Expenditures | -1.30M | -5.14M | -2.30M | 0.00 | 0.00 |
| Investing Activities Purchase Of Investments | 0.00 | -528.00K | 0.00 | -350.00K | 0.00 |
| Investing Activities Sale Of Investments | 0.00 | 0.00 | 1.78M | 14.76M | 22.94M |
| Investing Activities Other Investing Activity | 3.80M | -5.13M | -66.00K | 984.00K | 190.00K |
| Investing Activities Investing Cash Flow | 2.50M | -10.80M | -583.00K | 15.39M | 23.13M |
| Financing Activities Long Term Debt Issuance | 6.99M | N/A | 9.36M | N/A | N/A |
| Financing Activities Other Financing Charges | 61.98M | -5.15M | N/A | N/A | -189.00K |
| Financing Activities Financing Cash Flow | 68.97M | -24.85M | 7.70M | -17.74M | -5.40M |
| End Cash Position | 934.00K | -100.26M | -77.67M | -76.09M | -59.02M |
| Free Cash Flow | -62.14M | 19.16M | -3.21M | -7.94M | -14.39M |
| Financing Activities Long Term Debt Payments | N/A | -19.70M | -1.66M | -17.74M | -5.21M |
| Investing Activities Net Acquisitions | N/A | N/A | N/A | N/A | N/A |
Data provided by Twelve Data
Technical Analysis
Key Insights
- Current trend shows mixed signals with the stock trading below the 200-day moving average (₹27.29) but above the 50-day moving average (₹24.62), indicating potential short-term support but longer-term resistance.
- Key support levels are observed near ₹18.75, the 52-week low, while resistance is noted around ₹39.38, the 52-week high, with intermediate resistance near the 200-day moving average.
- The stock price is currently positioned between the 10-day and 50-day moving averages, suggesting consolidation in the short term.
- Momentum indicators show a neutral RSI around mid-range levels, MACD near the signal line indicating limited momentum, and stochastic oscillators reflecting sideways movement.
- Multi-timeframe analysis reveals daily charts showing consolidation, weekly charts indicating a mild downtrend, and monthly charts suggesting a longer-term sideways pattern.
- Market scenarios based on the current setup include potential range-bound trading with breakout or breakdown contingent on volume and broader market conditions.
Trending News
1. Headline: Shakti Pumps vs Oswal Pumps: Which Solar Pump Stock Is Better Positioned for Growth?
Summary: India's solar irrigation market is entering a multi-year growth phase driven by strong government support under the PM-KUSUM scheme.
Sentiment: positive
2. Headline: Shakti Pumps, NCC, GHCL, and 4 Other Stocks in Focus After Promoters Bought Stakes
Summary: Promoter buying is often seen as a positive signal by investors, as it may reflect management’s confidence in the company’s future growth prospects and business performance.
Sentiment: positive
3. Headline: Shakti Sons Trust acquires 9,000 shares, raises stake to 18.36%
Summary: Shakti Sons Trust, a promoter group entity, acquired 9,000 equity shares of Shakti Pumps (India) Ltd through open market transactions on June 16, 2026. This purchase increased the trust's total holding to 2,26,54,600 shares, representing 18.36% of the company's total voting capital.
Sentiment: positive
4. Headline: Shakti Sons Trust Disclosure of Shareholding Changes in Shakti Pumps (India) Limited | InvestyWise
Summary: Shakti Sons Trust has disclosed its acquisition of 9,000 equity shares in Shakti Pumps (India) Limited. This transaction,…
Sentiment: neutral
Summary: Shakti Pumps (India) ralied 6.01% to end at Rs 537.50 after the company announced an investment of Rs 10 crore in its wholly owned subsidiary, Shakti Energy Solutions (SESL) to establish solar cell and module manufacturing plant in Madhya Pradesh.
Sentiment: positive
Powered by Brave
Recent Updates
News Summary
As of June 16, 2026. Shakti Sons Trust, a promoter group entity, acquired an additional 9,000 shares of Shakti Pumps (India) Ltd, increasing its stake to 18.36% of the company’s total voting capital. This transaction was disclosed in compliance with SEBI regulations and reflects incremental promoter consolidation. Separately, Shakti Press Ltd completed a rights issue allotment of 24.64 million shares at ₹20 each, raising ₹4928.28 lakh to support corporate objectives, with Brickwork Ratings India appointed to monitor fund utilization. The company also extended the closing date of its rights issue to June 02, 2026, allowing shareholders more time to participate, with allotment and listing scheduled shortly thereafter. These developments indicate active capital raising and promoter engagement aimed at supporting growth initiatives and financial strengthening.
News Sentiment
The overall sentiment from recent updates is cautiously positive, driven by promoter stake increases and successful capital raising through a substantial rights issue. The incremental promoter acquisition signals confidence in the company’s prospects, while the rights issue extension and allotment demonstrate effective capital market engagement. Neutral tones arise from procedural updates and timing extensions, reflecting operational prudence. The combined effect suggests a strategic focus on strengthening financial resources and governance, balancing growth ambitions with measured execution.
Source List
Analytical Overview
Analysis Summary
Shakti Press Ltd’s valuation metrics, including a trailing P/E of 7.30 and P/B of 0.46, are below industry averages, suggesting the stock is trading at a discount relative to peers in the specialty business services sector. The absence of a forward P/E and PEG ratio limits forward-looking valuation assessment. The company demonstrates a positive revenue growth trajectory of 15.18% quarter-over-quarter, supported by a significant increase in net income to ₹16.46 crore in FY26, indicating improving operational performance. However, negative operating and free cash flows highlight challenges in cash generation and liquidity management. The debt-to-equity ratio of 53.02% is moderate, but the low cash reserves of ₹0.93 crore against total debt of ₹138.45 crore warrant monitoring. Sector-specific challenges include digital media substitution impacting traditional printing demand, while opportunities arise from diversification into the Agri Division and capital infusion via rights issue. India-specific factors such as regulatory compliance, evolving consumer trends, and economic growth prospects play a critical role in shaping the company’s outlook.
Overall Business and Market Assessment
Supporting Factors: the company’s strong revenue growth of over 15%, improved profitability with a net margin of 2.10%, and successful capital raising through a rights issue exceeding ₹490 crore
Risk Factors: the negative cash flow trends, relatively low cash reserves compared to debt obligations, and sectoral headwinds from digital disruption
SWOT Analysis
Strengths
- Established presence in the printing and publishing industry with diversified service offerings.
- Consistent revenue growth of 15.18% quarter-over-quarter indicating operational momentum.
- Strong current ratio of 2.06 reflecting adequate short-term liquidity.
- Successful capital raising through a rights issue raising ₹4928.28 lakh to support expansion.
Weaknesses
- Negative operating and free cash flows indicating cash generation challenges.
- Low cash reserves of ₹0.93 crore against significant total debt of ₹138.45 crore.
- Modest profit margins with net margin at 2.10%, limiting profitability leverage.
- Limited institutional investor presence reducing potential for large-scale capital inflows.
Opportunities
- Diversification into the Agri Division contributing 87% of revenue with growth potential.
- Government support for related sectors could enhance demand for printing and packaging.
- Potential to leverage rights issue proceeds for operational expansion and debt reduction.
- Increasing promoter stake signaling confidence and potential strategic initiatives.
Threats
- Digital media substitution posing long-term demand risks for traditional printing services.
- Liquidity risks due to negative cash flows and high leverage.
- Competitive pressures within specialty business services sector impacting margins.
- Regulatory changes in environmental and printing standards could increase compliance costs.
Company Description
Shakti Press Ltd. is a key player in the printing and publishing industry, offering a diverse range of services centered around the production and distribution of printed materials. Its primary function involves comprehensive printing services, which include packaging, paper printing, and publishing solutions tailored to meet the varying demands of different clientele. The company is integral to sectors such as education, media, and consumer goods, as it provides essential printed materials like textbooks, commercial packaging, and promotional content. Over the years, Shakti Press Ltd. has established itself as a reliable service provider, leveraging advanced printing technology to deliver high-quality outputs efficiently. Within the financial market, Shakti Press Ltd. holds a significant position, reflecting the ongoing demand for printed materials despite the digital transformation sweeping across related industries. The company’s sustained performance and strategic industry presence underscore its role as a critical contributor to the printing supply chain, enabling businesses and educational institutions to maintain traditional and effective methods of communication and packaging.